
Abstract
This study investigates the recovery of building-level footfall from the COVID-19 pandemic using privacy-preserving mobile devices-based footfall data within 60 downtown areas in the USA and Canada. Using clustering, we identify five distinct building typologies based on their characteristics, including rent, quality and recovery rates. The results reveal significant variation of recovery rates by building features. We find negative relationships with footfall recovery for both the percentage of office and remote work tenants and building quality. In contrast, buildings with traditional work tenants and retail functions achieve higher recovery rates. We also test the ‘flight to quality’ hypothesis via on our typology results. High-quality office buildings (Class A+) continue to have high rents but experience low physical footfall recovery, which suggests that this class is not as resilient as portrayed. The findings thus suggest the importance of considering both economic and footfall resilience in evaluating the performance of office buildings.
Introduction
Since the outbreak of the new coronavirus (COVID-19; SARS-CoV-2) at the end of 2019, there have been approximately 774 million cases and seven million deaths around the world according to World Health Organization COVID-19 dashboard. 1 Beginning in 2020, governments around the world introduced policies to control the pandemic, such as mandated lockdowns, social distancing, and controlled border policies, which then led to the restriction of outside activities and global movement, a supply chain crisis, the closing of retailers, inflation, and more (Balbo et al., 2020; Charles-Edwards et al., 2021; Gruer et al., 2021). Since governments lifted these restrictions, some lifestyle changes have become entrenched, leading to the emergence of what some call a ‘new normal’ (Akram et al., 2021; Bendel, 2015) of non-contact activities, including online shopping, online meetings, online education, and perhaps most predominantly, working from home.
These changes have particularly impacted the downtown area, which is widely recognised as the main Central Business District (CBD), that is, the retail, transportation, cultural and entertainment core of urban areas. Thriving on a high volume of footfall, bustling commercial activities, and dense social interactions, downtowns are sensitive to the altered consumer and business behaviour of the new-normal lifestyle. The rapid introduction of ‘click and collect services’ from traditional brick & mortar retailers, the decrease in employment and commuters, and the resultant increase in the vacancy rate of buildings have threatened the economic vitality of the downtown area (Hutson and Orlando, 2023; Leong et al., 2023).
High office vacancy rates have resulted in lower prices and rents, but researchers suggest that impacts differ by building class, hypothesising that there is a ‘flight to quality’ whereby office tenants seek out attractive new space that will lure newly hybrid workers back. Evidence indeed suggests that Class A buildings with high levels of amenities have sustained or increased their value for tenants, while older Class B and C buildings with fewer amenities have seen price drops (Ghosh et al., 2022; Gupta et al., 2022; Matsuo et al., 2023). Estimating the net effective rents and occupancy rates at the building level located in New York City and Texas, Gupta et al. (2022) find evidence of a ‘flight to quality’ as significantly high-quality offices recorded higher net effective rents even while suffering from a similar drastic decline in occupancy rates. It is unclear whether findings from these two geographies are generalisable to other office centres.
This finding raises the question of whether high-quality buildings are sustaining their activity as much as their value. Even if tenants are leasing Class A space, their employees may only be in the office for a couple of days each week. This then impacts the vitality of downtown, since retail, restaurant, entertainment, transit, and other services depend on the patronage of office commuters. One way to validate rents and occupancy rates is by looking at their correlation with activity as measured by footfall (typically measured by cell phone data). Several studies (e.g. Chapple et al., 2022; Leong et al., 2023) have measured the recovery of downtown areas in the aggregate by comparing footfall pre- and post-pandemic, but fail to look at individual buildings or even classes of buildings.
To understand the building-level influence of the pandemic and generate valuable insights based on building characteristics and recovery rates as measured by anonymised cell phone data, our study employs typology classification in an inductive approach. This method enables us to establish the typologies of buildings that maximise the heterogeneity between them, thereby allowing us to investigate the unique characteristics of each type (Han et al., 2001; Jeong and Kim, 2019). This also enables us to verify the ‘flight to quality’ hypothesis put forth by economists, by analysing outcomes for Class A+ buildings in more depth.
Thus, the research questions of this study are as follows: (1) What are recovery rates at the building level and by building class in U.S. and Canadian downtowns? (2) What is the typology of recovery patterns for downtown buildings, and what are the specific outcomes for Class A+ buildings? (3) What evidence does the analysis provide of a ‘flight to quality’?
The next section provides an overview of previous research on downtown activity. After presenting our data and methods, we validate our findings and discuss our results. A conclusion addresses limitations of the research, suggests potential avenues for future research, and offers policy recommendations which can help policymakers and related stakeholders address specific challenges of different building typologies.
Understanding – and responding to pandemic-induced changes in downtown
Throughout the world, downtowns have traditionally functioned as the bustling commercial core of the economic region. Economic theory suggests that this reflects a process of agglomeration, whereby spatial proximity creates external economies of scale in the form of knowledge spillovers as well as shared labour market and suppliers; other drivers include the concentration of market demand and economies in consumption (Rosenthal and Strange, 2004). For downtowns, this has manifested in clusters of office buildings, with a density of activity shown to increase productivity (Baum-Snow et al., 2024), surrounded by synergistic retail and services that capitalises on the presence of firms and workers nearby.
Still, fluctuations in downtown activity levels are not new to the U.S. and Canada: Before the pandemic, there had been repeated cycles of decline and revitalisation of North American downtowns. Due to the development of suburban areas, downtowns have periodically experienced a decline in retailers, office employment and transit ridership. In response, local governments traditionally tried diverse strategies such as constructing new entertainment facilities and residences, building walkable streets, improving connectivity, increasing the availability of parking, holding events and promotions, promoting cultural amenities, and more. These strategies contributed to dynamic urban centres attracting a diverse range of visitors and residents, although critics identified mixed results in terms of bringing back the middle class (Hutson and Orlando, 2023; Shuldiner et al., 1985).
Post-pandemic, the downtown may once again need to adapt, due to the widespread of new-normal lifestyle of remote and hybrid work, online meetings and classes, etc. Beginning early in the pandemic, households and businesses shifted away from dense downtowns to the suburban outskirts of major U.S. cities in a ‘donut effect’ (Ramani and Bloom, 2021). Specifically, many young middle-class workers moved from downtown areas to suburb (Ding and Hwang, 2022; Ferreira and Wong, 2022; Ramani and Bloom, 2021), and companies also decided to relocate to suburban areas from downtown while downsizing their office spaces (Dalton and Groen, 2022; Rosenthal et al., 2022). Work-from-home (WFH) has become the norm, particularly within the tech, finance and professional service sectors, and some have made temporary WFH policies permanent: as of spring 2024, 13% of U.S. workers worked from home and 26% were hybrid, with a disproportionate share coming from professional services, finance and insurance, and information technology (WFH Research, 2024). This WFH trend is particularly significant in the English-speaking countries like the UK, US, Australia and Canada (Aksoy et al., 2023).
In part due to this increase in WFH, as well as the shift in consumer behaviour towards online shopping, downtown businesses have experienced a disproportionate share of store closures (Wheat et al., 2023; Lund et al., 2021); in general small, minority-owned, and/or service businesses have been hardest hit (Motoyama, 2022; Urban Land Institute & PwC., 2022). This exodus has diminished land values in urban centres: As firms relinquish their downtown office space, the rent premium conferred by centrality has experienced a slight decline (Rosenthal et al., 2022). These overall circumstances have led to a decline in the activity level in downtown areas (Balk, 2021; Schmahmann et al., 2022).
There is an active (and unresolved) debate about the extent to which these changes reflect the post-pandemic new-normal of remote work and online shopping versus longer trends and economic restructuring (Forouhar et al., 2024; Leong et al., 2023; Loh and Kim, 2021). The choice to work or shop from home might reflect, in part, a decision to avoid the built environment of downtowns. But it could also stem from a long-term secular shift towards e-commerce, or the transformation towards an information-based economy. One way to explore this question is to examine jointly the role of real estate and economic factors.
Ideas to bring back activity include a new focus on social interaction (Florida, 2022), renovating the unoccupied offices to recreational spaces or residential properties (Hutson and Orlando, 2023; Loh and Kim, 2021), or increasing the economic diversity of downtown areas by introducing education, health, government, and other sectors with essential workers (Leong et al., 2023). This would increase the number of anchor tenants and institutions, thereby enabling a rise in economic activity (and footfall volume) in the downtown area.
However, research on real estate trends suggests that attracting workers back to office buildings will not be simple. Specifically, employees are demanding high-quality, high-amenity office space (so-called ‘Class A+’ space) (Gupta et al., 2022). Evidence from office building sales and leases since the pandemic suggests that this Class A space has maintained or increased its value in the face of changing work patterns, even as Class B and C prices stagnate or decline (Ghosh et al., 2022; Gupta et al., 2022; Matsuo et al., 2023). Notably, however, these studies do not measure footfall.
If the ‘flight to quality’ is real, and preferences for office building types matters more than the rise of remote/hybrid work, then we would expect to see higher recovery rates for Class A buildings than for Class B and C. Thus, in this study, we perform a building-level analysis to explore the activity patterns in different types of buildings. By connecting footfall to real estate characteristics, we fill the research gap created by other studies that measure one or the other, but not both. Through building a typology, we are able to show how distinct building types with different economic uses recover differently, and thus provide insight into the question of whether economic or real estate factors matter more in recovery.
Data and methods
To analyse the role of the economy and real estate in the recovery of downtowns, we examine the following hypotheses:
Individual buildings vary in how much their activity (measured in footfall) has recovered since the pandemic.
Based on the combination of real estate and economic characteristics, we can define a typology of buildings located in U.S. and Canadian downtowns.
Class A+ buildings will continue to recover slowly to the extent that they house concentrations of industries reliant on remote and/or hybrid work.
Study area
This study includes 60 downtowns from major cities across the USA and Canada (Figure S1). The case study cities were selected based on population, considering the top 50 cities in the US (based on the 2019 American Community Survey) and the top 15 cities in Canada (based on the 2016 Canadian Census). Next 11 secondary cities within the same metropolitan area were removed. 2 Since job density represents an economically significant area, six additional cities with a downtown job density of over 5000 jobs per square mile were included in the analysis. 3 This created our sample of 60 downtowns.
To identify the exact boundary of the selected downtowns, we employed Hierarchical Density-Based Spatial Clustering of Applications with Noise (HDBSCAN) based downtown area (please see the supplemental material). This boundary was based on the concentrations of jobs in the census block (for the USA) and dissemination area (for Canada) using 2019 Workplace Area Characteristics (WAC) data from LEHD Origin-Destination Employment Statistics (LODES) for the US and 2016 Usual Place of Work in Canada from Statistics Canada. Figure S2 represents examples of HDBSCAN downtown areas in selected cities in the US (Chicago, Charlotte, Denver, Los Angeles, New York, San Francisco, and Washington DC), compared with other downtown definitions (Brookings commercial core boundaries and central business district boundaries). It is notable that the HDBSCAN boundary tends to focus on more central areas than the other boundaries. Table S1 represents the descriptive statistics of HDBASCAN downtown areas.
Data and preprocessing
Specifically, to represent the boundary of buildings located in the downtown areas, the research team obtained the 2023 building boundary data from OpenStreetMap (OSM) (OpenStreetMap, 2017) using Python and OSMnx packages (Boeing, 2017). For building features, we downloaded building property data from CoStar as of March 2023, 4 specialising in detailed commercial real estate information. Specifically, this dataset includes the star rating (which represents the overall quality of the building), usable space (in sq. ft.), vacancy rate and geographic information of the existing individual office and retail buildings. We then converted building type variables to dummy variables. If a building possessed multiple types, it was assigned to an ‘office-retail building’ variable. Tenant information by building was also acquired from CoStar: we collected the occupied square feet for industries based on CoStar industry types similar to those in the NACIS code. Next, the industries were reclassified based on their potential for remote work (Althoff et al., 2022; Brail and Vinodrai, 2024), using three types; remote work, hybrid work and traditional work (see the Table S2).
Then, the data on the building attributes were aggregated into the building boundary, selecting only the buildings constructed before 2019. Since a recently completed building could have experienced a significant increase in visitors after construction, this would likely result in an unrealistically high building recovery rate, which could impact the accuracy of the overall analysis.
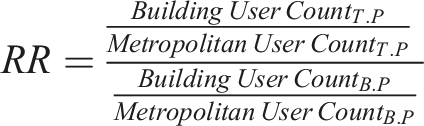
To estimate the recovery rates, we collected the daily footfall volume data between March and June in 2019 and the corresponding months in 2023 through Cuebiq’s Spectus Data Cleanroom platform 5 which supplies the sampled number of anonymised mobile users within the area that users can define. We extracted the daily count of distinct devices within each building. The working hour (from 8 a.m. to 6 p.m.) device counts at the building level were also obtained. Before estimating the recovery rates, we selected the buildings in which the number of daily and working hour visitors was more than one per day as a minimum sample size from March to June 2019 to reduce bias and improve the accuracy of recovery rates. As a result, a total of 5409 buildings were selected to serve as the target buildings for the analysis in this study. In the case of whole day visitors, each building has 22 daily visitors on average, which means 2626 visitors between March and June 2019 (25th percentile is 5, 75th is 25). For the working hour visitors, the mean daily visitors were 22, which is equal to 1901 visitors from March to June 2019 (25th percentile is 5, 75th is 26). In particular, there are a total of 371 small sample buildings, accounting for 6.5% of all buildings, with fewer than two whole day or working hour visitors at the daily level. Although there were fewer than two visitors per building, there were at least 120 visitors between March and June, so it is possible to calculate the recovery rate.
Using the footfall volume data, we then estimated the whole day and working hour recovery rates of each building. The recovery rates (RR) measure the proportion of normalised counts of selected 3 months (or target periods), and the corresponding 3 months in 2019 (baseline periods). The detailed equation for recovery rates is as follows:
Finally, the daily and working hour RR of each building and the building property data were combined to construct the dataset for analysis.
Method
To investigate the typology of recovery patterns by building characteristics, we employed the Self-Organising Map methodology, developed by Kohonen (1998). For this analysis, we employed a set of input variables, including star rating, vacancy rate, usable space, building types, tenant composition, and recovery rates at the building level. The first four variables were selected to explore the relationships between building-level performance in the market and the recovery rate. Tenant composition was included to illustrate the relationships between building recovery and shifts in workplace dynamics, particularly the rise of WFH in the post-pandemic era.
To find the optimal parameter combination, we employed Bayesian optimisation (please see the supplemental material). Based on this, we conducted typology classification to separate the buildings into broad categories, which allows us to explore the notable characteristics of building typologies. As a result of Bayesian optimisation, the most optimal hyperparameter combination was identified as 5, 0.008, 3561, 0.26 and hexagonal for the number of types, learning rates, iterations, sigma and typology, respectively, and this combination recorded the lowest Davies-Bouldin index, with 0.91. The type labels were assigned based on the ascending order of the mean recovery rates of types.
Results
Recovery rates of each building
Using the Cuebiq data and the Recovery Rates (RR) equation, the daily and working hour recovery rates were estimated at the building level. The RR compares March to June 2023 to the corresponding months in 2019. The recovery rates below one indicate that the number of visitors from March to June 2023 has not yet recovered to the same month’s visitor count in 2019. Table S3 depicts the overall descriptive statistics of daily and working hour recovery rates. The mean daily and working hour recovery rates of 0.77 and 0.78, respectively, underline that the office and retail buildings did not recover from the shock and social transformations caused by the COVID-19 pandemic.
Typology classification analysis using building properties and recovery rates
According to the Bayesian optimisation results, the optimal number of types was 5, and the types was labelled from one to five from the highest to the lowest number of buildings in the type. In terms of the distribution of types, most buildings among the target buildings in this study were classified as types 2, 3 and 4, with 1482 (27.4%), 1551 (28.7%) and 1439 (26.6%), respectively (Figure 1(a)). Types 5 and 1 recorded 252 (4.5%) and 695 (12.8%), respectively. Regarding usable space, types 1 and 2 dominate the distribution of usable space, with type 1 possessing the largest share at 51% and types 2 following with around 36%. Types 3,4 and 5 account for smaller proportions, particularly type 5, only having 0.1 % (Figure 1(b)). The distributions of building counts (a) and the total usable space (in Millions of Sq. Ft.) by types (b).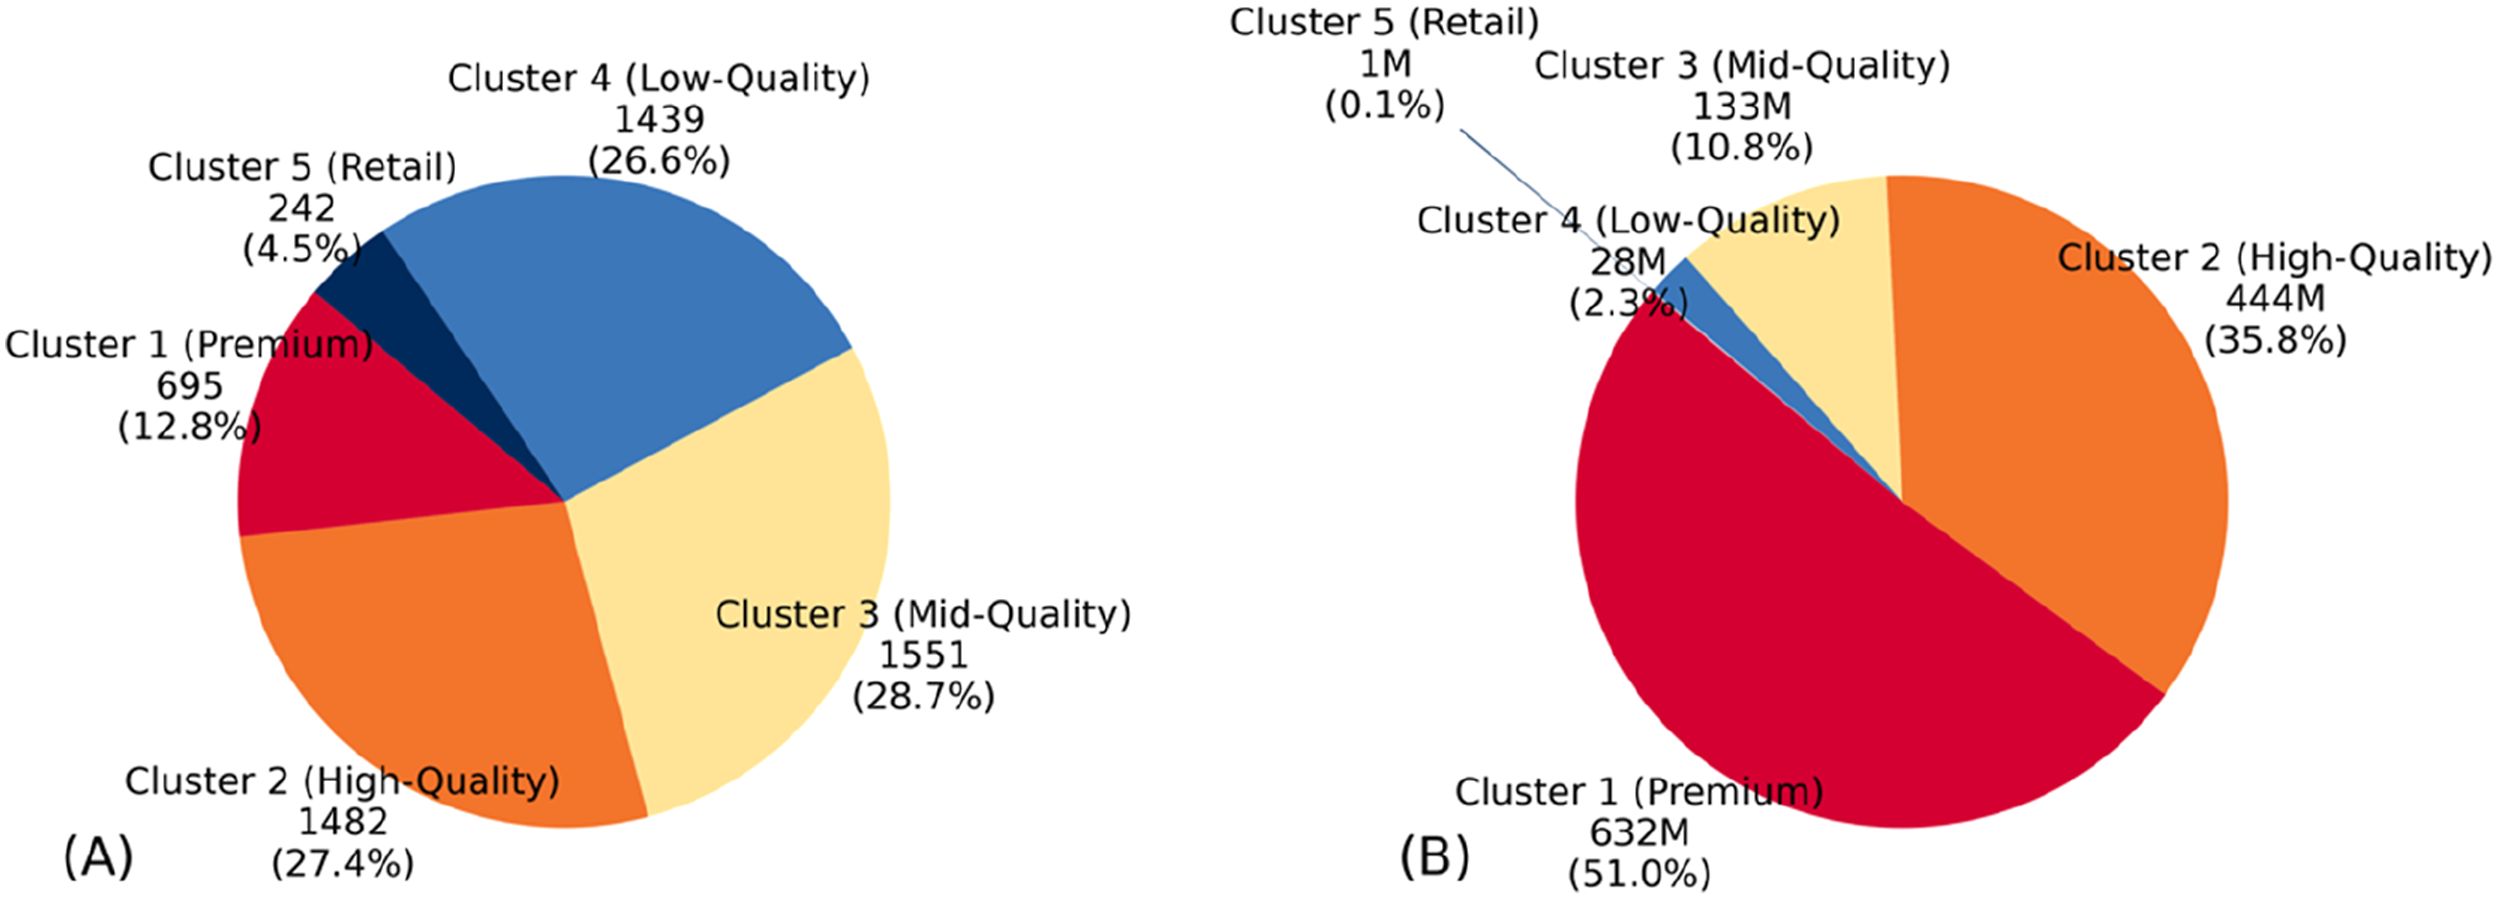
The characteristics of each type are described in Figure 2. (Detailed descriptive statistics of each type are described in from Table S4 to S8 and validation of the typology classification result is described in supplemental material). Based on these characteristics, we created a snapshot description of each type, as follows: The mean of variables by types, representing their characteristics.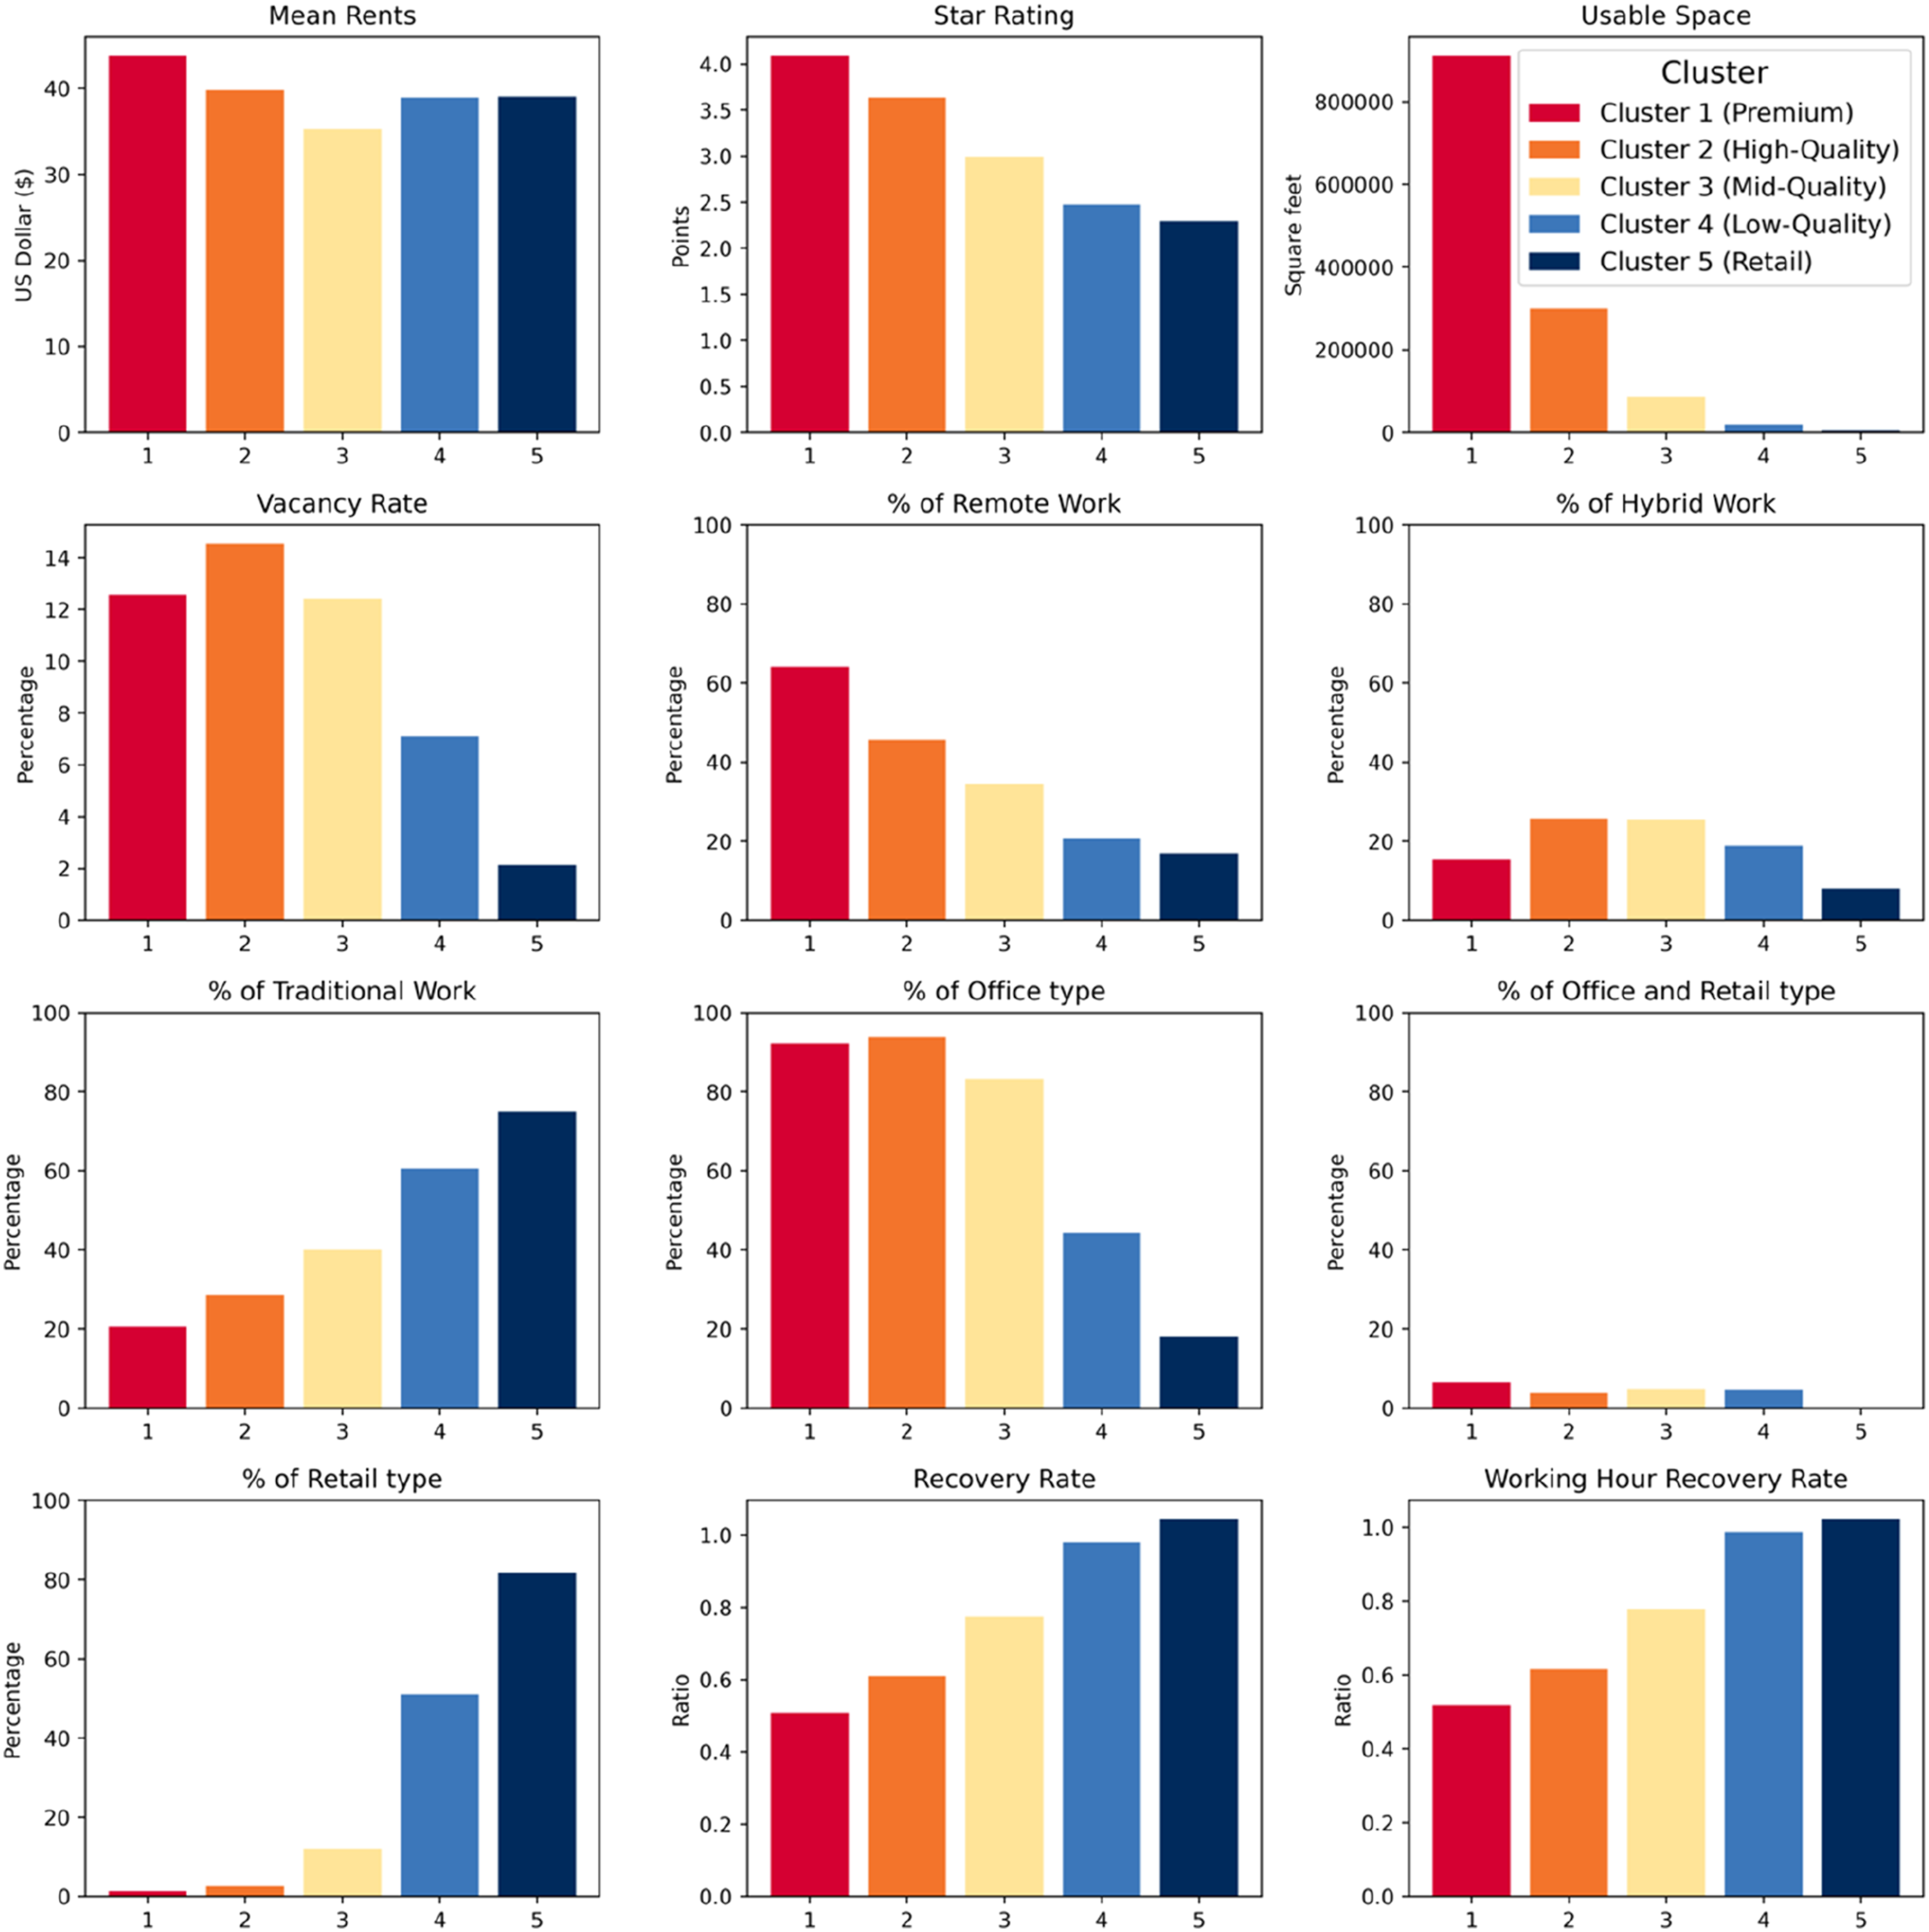
Type 1 (premium large office buildings)
This type (henceforth called ‘Premium’) stands out with the highest rent and an excellent quality building, indicating premium standards and possibly luxurious amenities. It boasts an extensive usable space and a vacancy rate that aligns with the overall average. The tenant composition heavily favours remote work, with a significant portion also engaged in hybrid work, and a smaller proportion in traditional work. This type is primarily an office building with significant mixed-use and retail spaces. Recovery rates are slightly below average, which may reflect its operational efficiency during working hours, when it recorded the lowest recovery rates.
Type 2 (High-quality spacious offices)
With the second most expensive rents and high quality, this type is also characterised by high-quality office buildings. Its usable space is much less than in Type 1 (Premium), meaning that these are much smaller buildings. The vacancy rate is the highest of all the types. The tenant base includes a mix of remote and hybrid workers, with a much larger share of semi-remote workers than in Premium, but slightly more traditional on-site workers. This building is predominantly office-oriented, with a minor allocation of mixed-use and retail space. The type mainly comprises office buildings, with a few mixed office-retail spaces. Recovery rates were recorded as the second lowest of all the types during working hours.
Type 3 (Mid-quality low-cost offices)
This type is characterised by moderate rents and average-quality offices. It provides a small amount of usable space, which is slightly above the average of types, and the vacancy rate is almost as high as Premium. The tenant composition shows a balanced distribution among remote, hybrid, and traditional works. The majority of the building is dedicated to office space, with a smaller proportion allocated to multi-type and retail. Recovery rates, including during working hours, are moderately high.
Type 4 (Low-quality small Properties)
This type features smaller buildings with a lower star rating, suggesting an older or less well-maintained property. These buildings have a predominantly traditional workforce, with the remainder split between remote and hybrid workers. The mean rent is relatively low, and the vacancy rate is the second lowest among the types, suggesting high demand for these spaces. The usable space is limited, and the type features mostly mixed-use office-retail and retail buildings. Recovery rates throughout the day and working hours are the second highest among all types, nearly back to 2019 levels.
Type 5 (Budget retail buildings)
Type 5 consists of buildings with the lowest star rating and mean rent, indicating budget-friendly options with basic amenities. These buildings have a high proportion of traditional work tenants, with minimal remote and hybrid workers. The vacancy rate is very low, demonstrating high occupancy. The usable space is the smallest among the types, and the majority of buildings are retail-focused. This type recorded the highest recovery rates overall and during working hours.
The most notable finding from the typology result is a strong relationship between recovery rates and building type and tenancy: both the proportion of traditional work tenants and retail-type buildings, and the proportion of remote work tenants and premium buildings. Specifically, types 4 and 5 (Low-Quality and Retail), both dominated by retail and traditional tenants, recorded the highest recovery rates during working hours and whole days. On the other hand, types with a high share of remote work tenants, usable space and the quality of building (types 1 and 2, Premium and High-Quality) experienced a negative relationship with recovery rates. That premium office buildings are recovering so much more slowly than low-quality retail space suggests that these facilities are still suffering from the shock of the COVID-19 pandemic, rather than experiencing long-term structural shifts away from office work. In contrast, retail and low-quality office space, both occupied largely by traditional workers, have recovered, suggesting first that they have been resilient to long-term shifts such as the rise of e-commerce, and second that they are perhaps not as tied to consumption by office workers as agglomeration theory suggests.
One caveat here is the timeframe, until mid-2023. Though premium office buildings had not recovered by that time, many firms did not settle on a WFH policy until 2024. Thus, premium space may have subsequently recovered.
Discussion: Flight or crawl to quality?
The ‘flight to quality’ hypothesis suggests that high-quality office buildings, called A+ buildings, were more economically resilient than lower-quality office buildings in the severe market downturn during the COVID-19 pandemic, based upon the longitudinal changes in net effective rents during the pandemic (Gupta et al., 2022). From our typology results, although Type 1 represents a premium building, there was variation within the type. To explore this in more detail, we subsetted to office buildings with a star rating 5, which corresponds with A+ buildings in terms of structure, quality, amenity and energy efficiency (CoStar, n. d.). The 249 buildings selected are described in Table S9 in the supplemental material; they had the highest mean rent ($45.20) and remote work percentage (around 70%). They also had low resilience in terms of physical footfall, with significantly low recovery rates in those buildings (0.56 and 0.55 for whole day and working hours). With a maximum working hour recovery rate of 2.27, some buildings are doing very well, but others are practically empty (Figure 3). Furthermore, the recovery during working hours is more tightly clustered than that for the whole day, even for these premium buildings. The recovery rates of whole day (A) and working hour(B) distribution of selected A+ office buildings.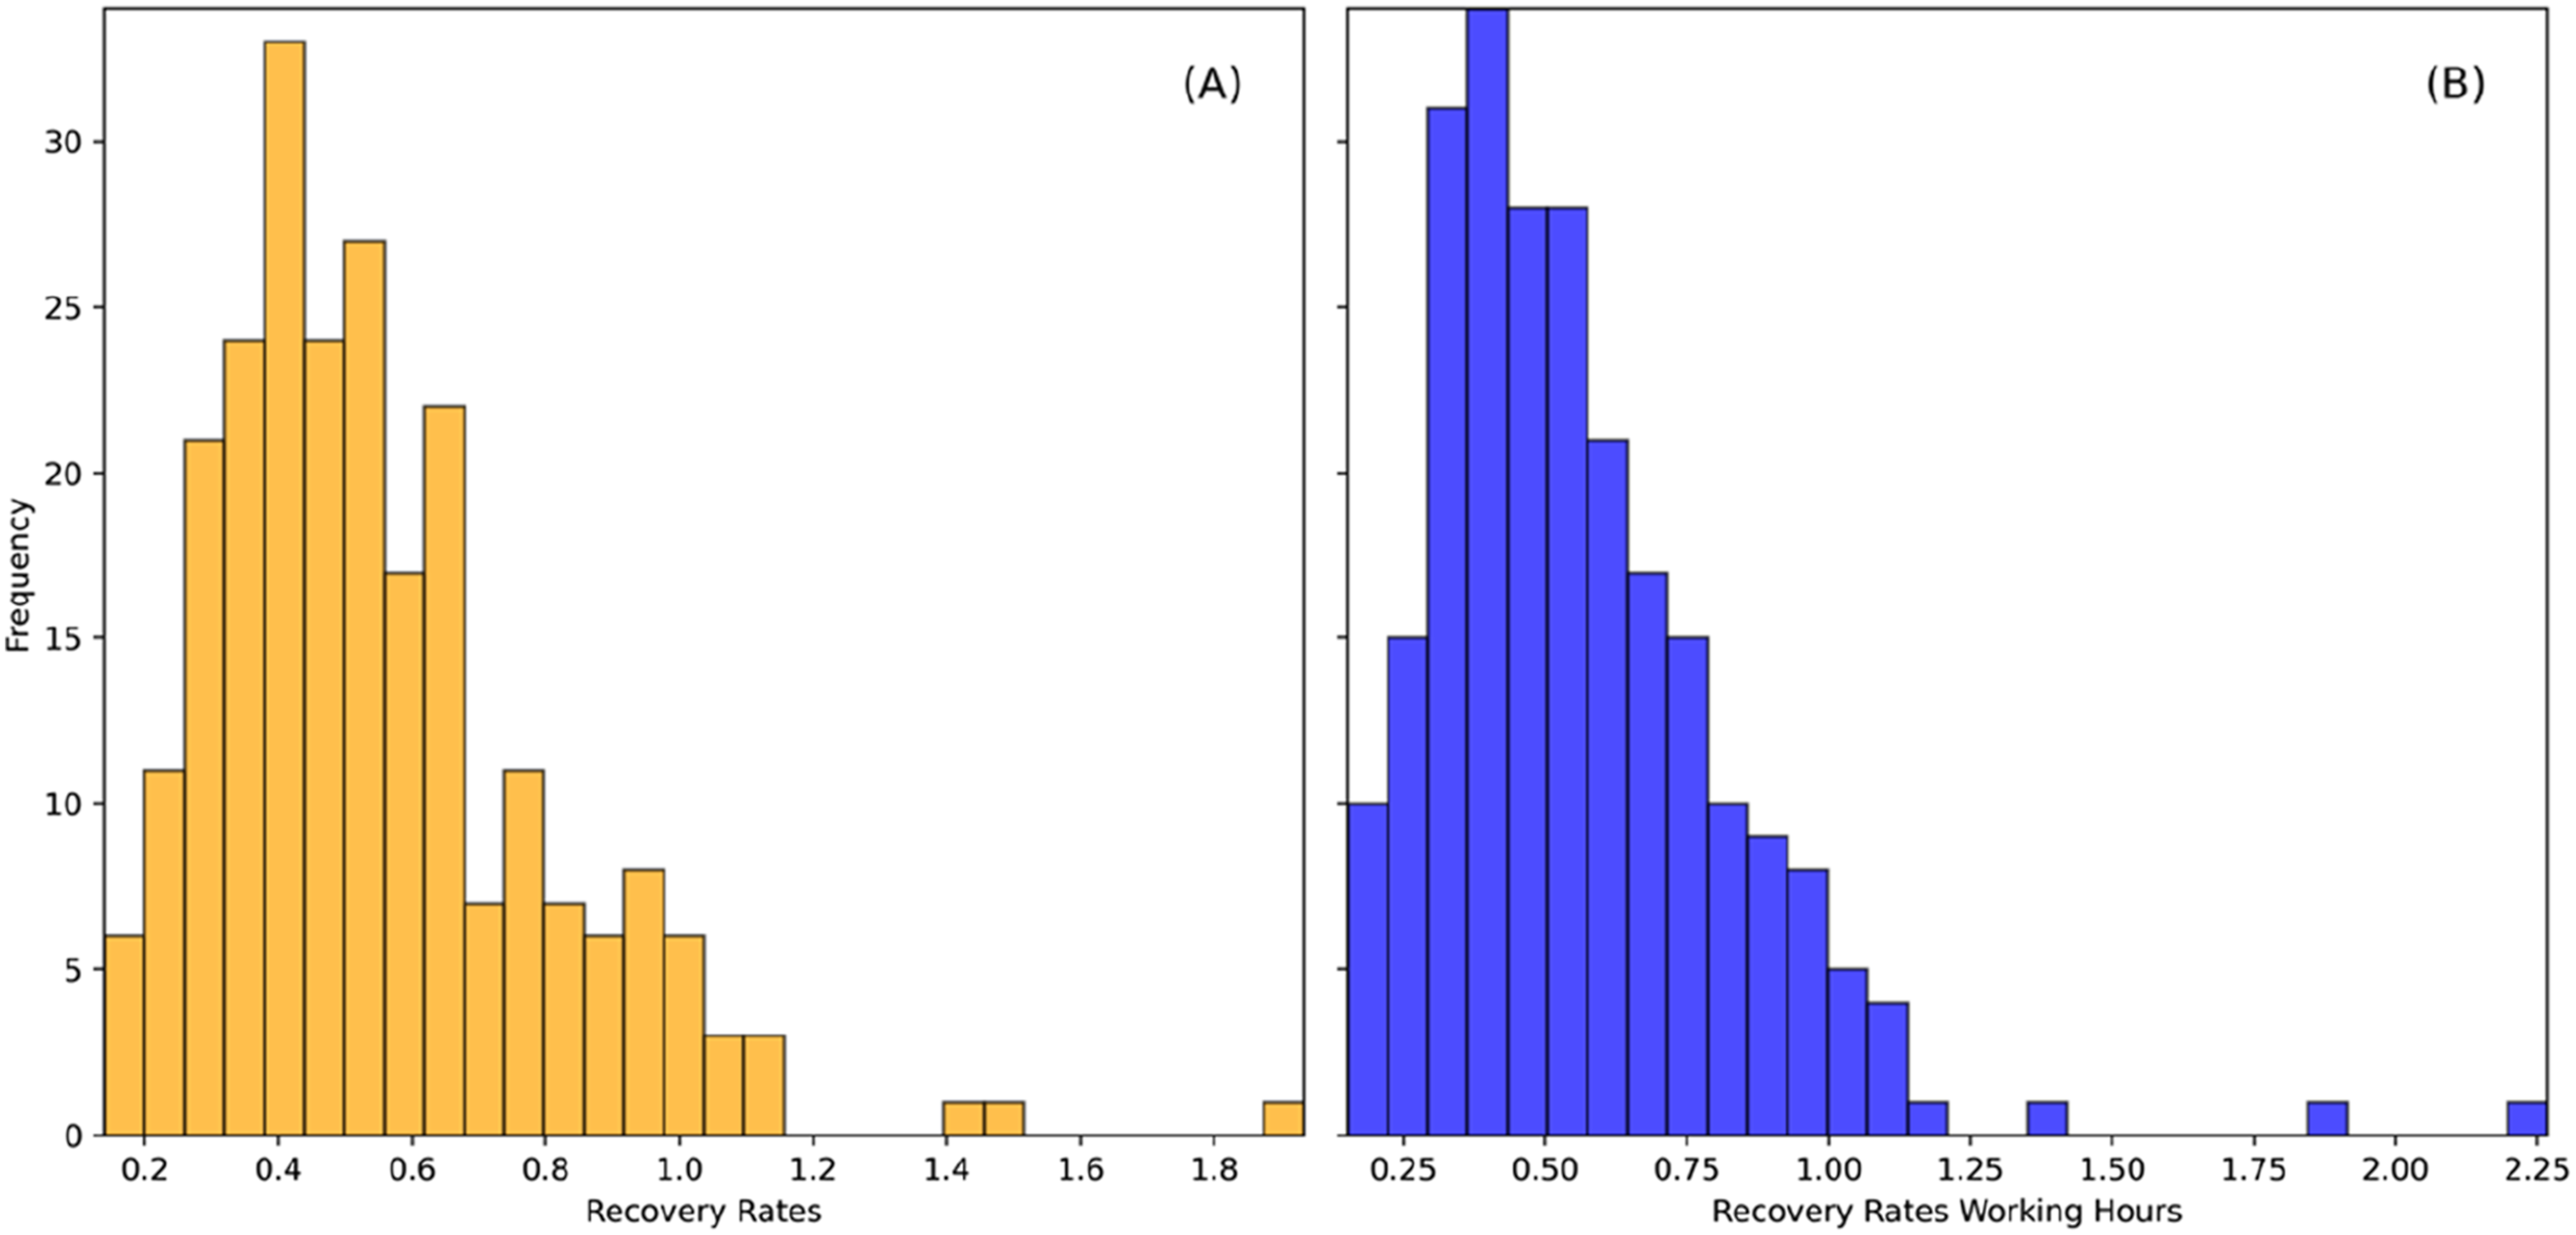
The typology classification suggested that buildings with higher rents tended to have lower recovery rates; in other words, there is a negative correlation between economic and footfall data. This closer look at A+ buildings confirms that even though they have higher rents and net effective rents than other buildings, their physical activity has significantly declined. Even if tenants are bound by a lease, they may not actually be occupying the space.
However, if the ‘flight to quality’ is occurring, it should be evident in the rent levels of these buildings: even if there are relatively low activity levels, A+ buildings could be experiencing more demand than other types of real estate, as evidenced by rent levels. Figure 4(a) compares the rate of change in rents per square foot for 5-star, 4-star, 2-star office, and 2-star retail buildings. In general, rents declined across all market segments, but the change rate for 2-star offices exceeds that for 5-star offices except for 2023 Q3. Furthermore, the overall change rates for 5- and 4-star offices were similar, even though rent declines stabilised in 2023 for 5-star buildings while 4-star continued to decline. This suggests that even if there is no flight to quality, there may indeed be a slight preference for quality. The changes in the inflation-adjusted change in rent per square foot relative to 2019 Q4 (a), the availability rate between 2020 and 2023 Q3 (b) and the net absorption between 2020 and 2023 Q3 (c) by star rating.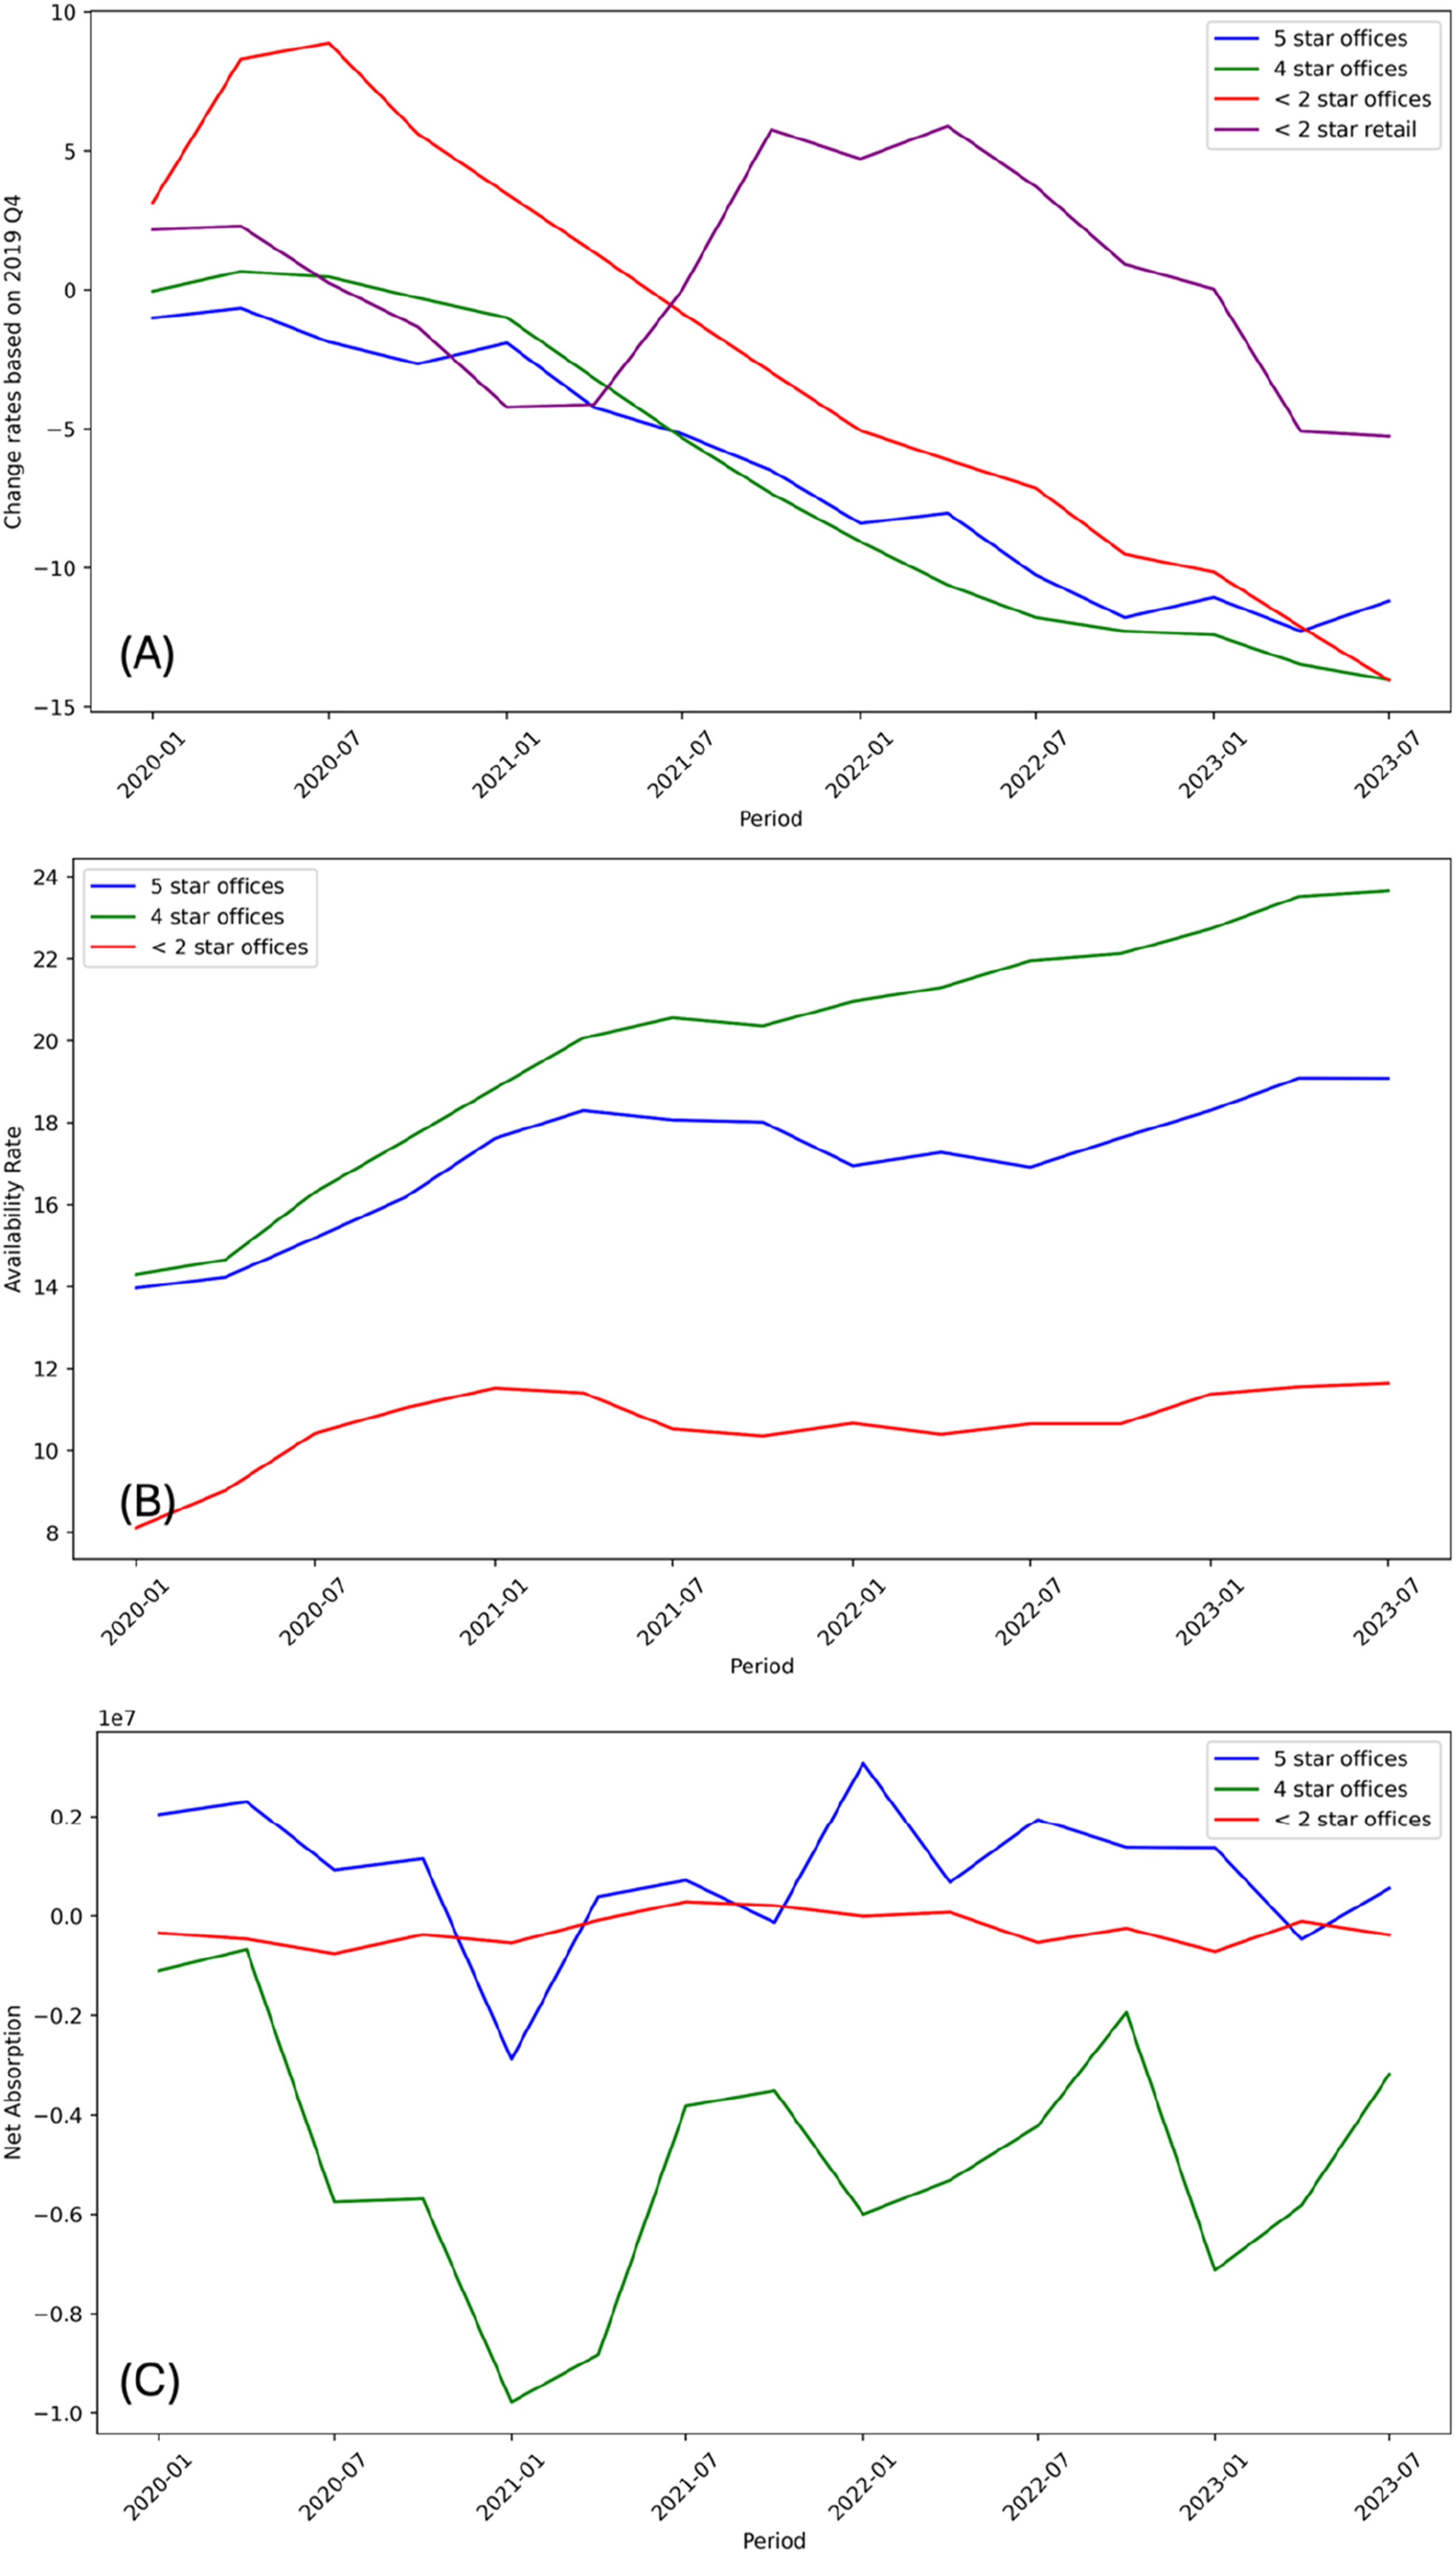
Data on availability rates and net absorption reinforce this argument. Availability rates have steadily increased for both 4-star and 5-star offices, with a sharp rise for 4-star offices (Figure 4(b)). At the same time, the net absorption data (Figure 4(c)) highlights a considerable decline in net absorption for 4-star offices after the pandemic. On the other hand, 5-star offices experience a relatively positive trend in net absorption. Of note, the fluctuation trend of 5- and 4-star offices are similar. If tenants were moving out of 4-star offices and into 5-star offices, we would expect to see opposing trends in net absorption between the two categories – one increasing while the other decreases. However, the similar trends suggest that the tenants leaving 4-star offices are not moving into 5-star offices.
Consequently, these results show that while there are some marketplace trends that align with the ‘flight to quality’, this is more of a gradual shift. In particular, the market trends of 5-star and 4-star offices are similar, which suggests that the ‘flight to quality’ is not occurring. While there may be a slight preference for higher-quality offices, it can be seen as a crawl rather than a flight. Although we cannot fully rebut the ‘flight to quality’ argument, our findings complicate the oversimplified narrative of ‘flight to quality’. The findings thus suggest the importance of considering both economic and footfall resilience in evaluating the performance of office buildings.
Conclusion
In this study, we developed typologies using building characteristics and recovery rates to examine the ‘flight to quality’ hypothesis, including whether this phenomenon occurs across downtown areas and whether high-quality buildings maintain their activity as much as their value. To achieve this goal, we calculated the building-level recovery rates based on their footfall volume, and building features. Then, five unique typologies were identified using SOM and Bayesian optimisation. From the typology results, we clearly found some relationships between the building features and recovery rates. Specifically, there were negative relationships between the percentage of office and remote work tenants, building quality, and footfall recovery.
We then evaluated the ‘flight to quality’ hypothesis in light of the typology classification, finding that despite high economic rents, physical activity is low. This suggests that A+ buildings may be economically resilient but seriously underutilised, lacking what we call ‘footfall resilience’. The existence of a ‘flight to quality’ alongside a dearth of footfall suggests a need for more sustainable urban form. One approach might be transforming large spaces into high-quality residential units with luxurious amenities, including gyms, cleaning services, etc. Because many young professionals prefer to live in the downtown area due to the proximity to their workplace as well as the urban lifestyle of abundant recreation and leisure facilities (Graham, 2023; Siedentop et al., 2018), this could attract young professionals and increase the footfall recovery rate.
One limitation of this study is that there might be a sample size issue when using cellphone-based data. Although the whole sample may come in millions, we analysed it at the scale of individual buildings. In other words, the actual footfall volume may be just one or two visitors per day per building. Although we tried to deal with this limitation by establishing the threshold for minimum footfall volume as at least one visitor per day, some buildings still recorded a small sample. This is likely to create unreliable estimates of the recovery rates for small sample buildings. Additionally, this study was not able to consider commercial lease terms, which may affect activity rates, for instance, by temporarily extending office traffic that will dissipate after the end of the lease. Since long-term leases may thus delay observable changes in vacancy rates, our findings may not fully capture the market responses to this nature of commercial leases due to the lack of data.
This study offers invaluable evidence for policymakers, landlords and building management companies, researchers, and related stakeholders to establish effective recovery strategies, considering both economic and footfall resilience in urban planning. Given the comprehensive sample of large primary downtowns in the U.S. and Canada, results should be generalisable to other such large downtowns. Future studies can be expanded to explore the typologies of buildings located in various commercial boundaries, such as business parks or shopping centres, which allows us to more broadly explore how building-level recovery varies across the built environment. Furthermore, it is possible to examine the spatial relationships between the offices and retailers in diverse commercial areas, such as downtowns, suburban centres and main streets. This would provide further insights into the impact of remote work on retail activity.
Supplemental Material
Supplemental Material - Does class matter? Understanding differential pandemic recovery via a building typology
Supplemental Material for Does class matter? Understanding differential pandemic recovery via a building typology by Byeonghwa Jeong and Karen Chapple in Environment and Planning B: Urban Analytics and City Science
Footnotes
Declaration of conflicting interests
The author(s) declared no potential conflicts of interest with respect to the research, authorship, and/or publication of this article.
Funding
The author(s) received no financial support for the research, authorship, and/or publication of this article.
Supplemental Material
Supplemental material for this article is available online.
Notes
![]() . A Professor Emerita at UC Berkeley, she received the 2023 Regional Studies Association’s Sir Peter Hall Award for Lifetime Contribution to the Field.
. A Professor Emerita at UC Berkeley, she received the 2023 Regional Studies Association’s Sir Peter Hall Award for Lifetime Contribution to the Field.
References
Supplementary Material
Please find the following supplemental material available below.
For Open Access articles published under a Creative Commons License, all supplemental material carries the same license as the article it is associated with.
For non-Open Access articles published, all supplemental material carries a non-exclusive license, and permission requests for re-use of supplemental material or any part of supplemental material shall be sent directly to the copyright owner as specified in the copyright notice associated with the article.