
Abstract
Short-term rental markets are constantly evolving in response to dynamic market conditions. Leveraging the large-scale external market shocks resulting from the COVID-19 pandemic, this paper aims to better understand how short-term rental submarkets are formulated in response to changing market conditions. Using sequence analysis on monthly booking records between mid-2019 and the end of 2022 in Australia, this paper identifies six distinct short-term rental types underlying their varying longevities on the market. Temporal, geographic, operational and hedonic characteristics are considered to differentiate thriving from diving market trends and derive a taxonomy that narrates six submarkets. The results reveal a shifting STR market landscape from central cities and longstanding tourist destinations to peri-urban regional towns and a shift from properties run by small-scale amateur hosts toward professionally operated rentals with substantially more space and amenities. This suggests that short-term rentals have emerged as a distinct accommodation class to hotels, albeit in ways that differ based on spatial context.
Introduction
The growth of Airbnb and other short-term rental (STR) platforms over the past decade has fundamentally changed the global accommodation market. On the one hand, digital platforms open new possibilities for guests and hosts worldwide to access millions of properties in an app. On the other hand, critics of digital STR platforms have been resistant to opening local property markets to large volumes of visitors (Mermet, 2022), and by corollary, the control thereof being partially ceded to the algorithmic vagaries of Silicon Valley’s leviathan firms. On the eve of the pandemic, there were 6 million active listings on Airbnb worldwide (The Guardian, 2019), compared to roughly 18 million hotel rooms (IHG, 2018). More importantly, the lines between these two accommodation providers are blurring, as hotel rooms are now commonly advertised on platforms, and many professionally run short-term rentals operate in ways akin to hotels, with concierge services, amenities and so on.
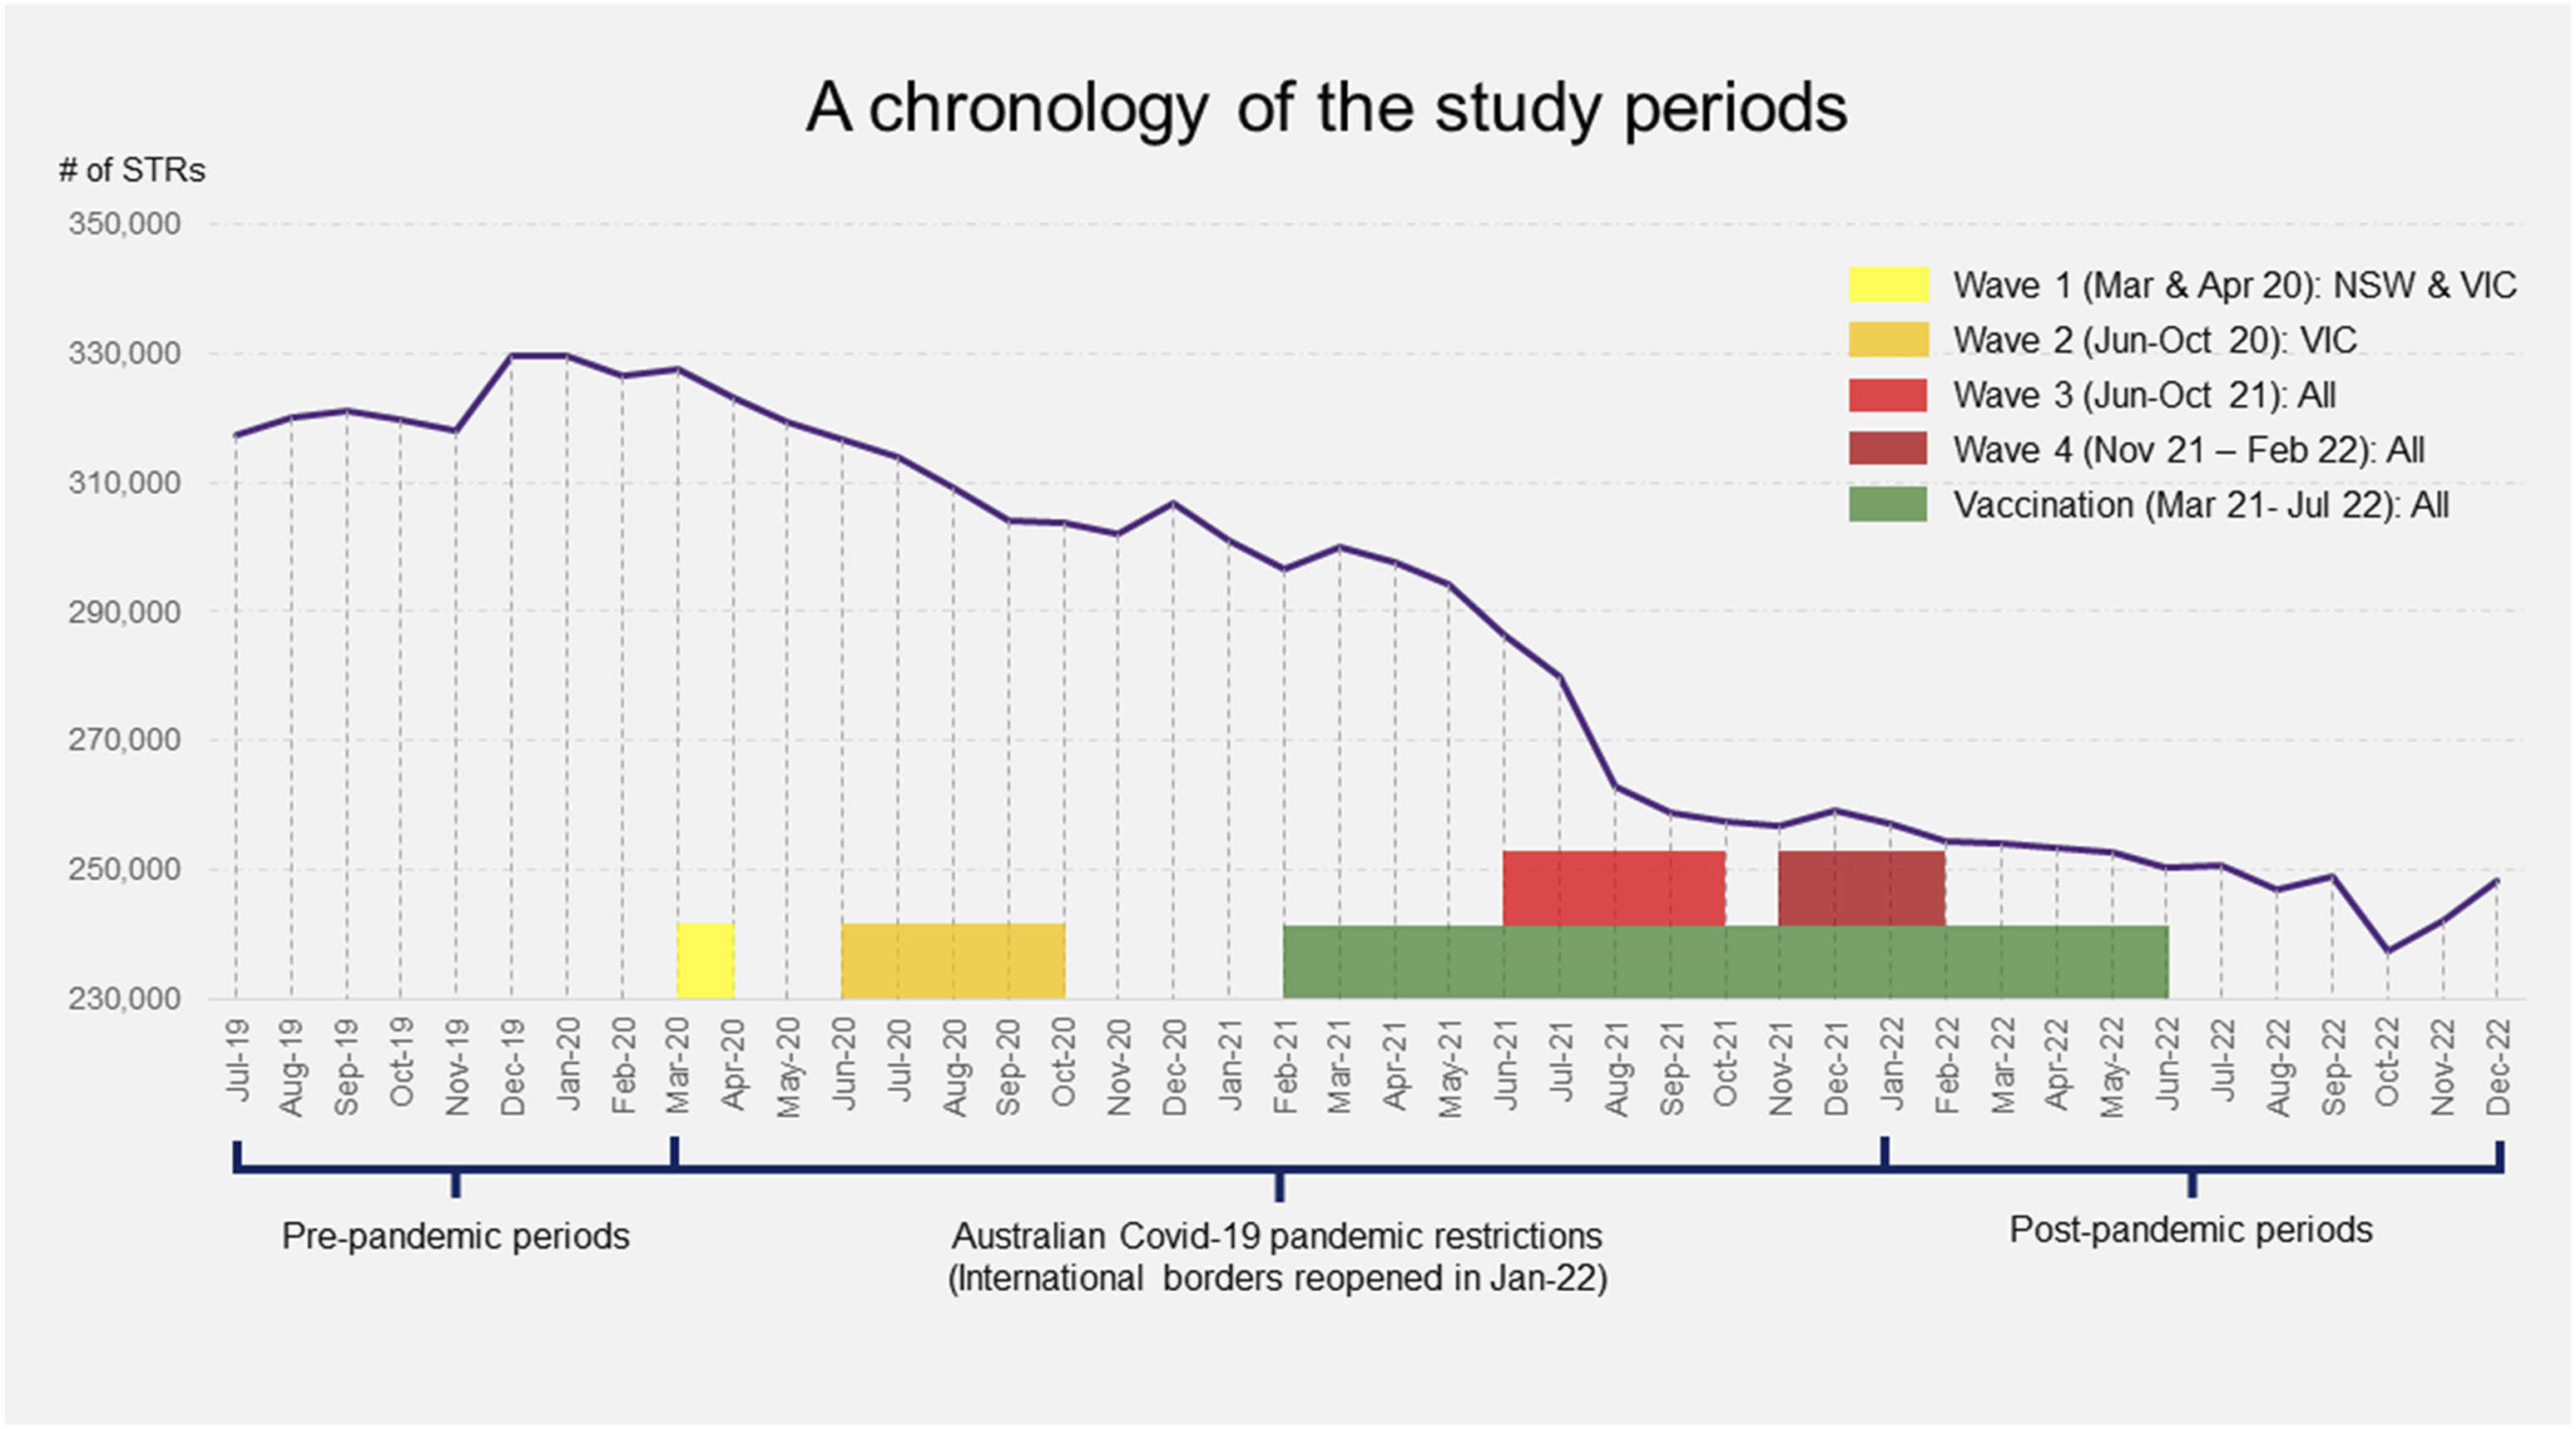
However, the expansionary potential for STR platforms was challenged during the global COVID-19 pandemic, which almost instantaneously arrested global travel and tourism in 2020. In Australia, international travel and tourism were almost entirely halted through strict border closures. Additionally, Australian Federal states implemented a series of interstate border closures, limiting domestic travel to periods in between virus outbreaks. These stringent restrictions led to a sharp 23% decline in the total number of listed STR properties, going from a peak number of nearly 330,000 in December 2019 to around 250,000 in September 2022 (Figure 1). Total number of STRs in Australia (Jul 2019–Dec 2022) with colour blocks labelling different stages of the COVID-19 pandemic in Australia.
1
Yet, domestic intra-state travel in Australia was not impacted to the same degree: With state border closures, Australians redirected their holiday plans to focus more on travel to less populated regional areas within their home state. Likewise, there was significant population relocation to non-urban regions, where STR properties served an important role in facilitating the transitory accommodation arrangements (Bond et al., 2023). Thus, rapid growth in STR accommodation availability occurred in non-urban regions catering to domestic visitors, particularly lower-density, amenity-rich coastal and mountain communities or rural retreats (AirDNA, 2021). This was driven to some degree by domestic tourists looking to escape without boarding an aeroplane, but also by the rapid proliferation of working from home, which untethered office workers from their desks in favour of non-urban locations (Dadpour and Law, 2022). These trends were somewhat consistent around the world with divergences from government lockdown policies, border and quarantine restrictions, shifting attitudes towards travel and COVID-specific STR regulations like social distancing (Mariotti et al., 2022).
The rise of new submarkets and the decline of traditional urban markets raise emerging research questions concerning the most significant spatial and temporal STR activity patterns underscoring new market trends. Examining these questions sheds light on regional tourism and housing policies, which are particularly germane in the wake of a global housing crisis. While not tied to STRs directly, the crisis has triggered a series of policy and legislative responses aiming at reducing the potential impact of STR on residential housing markets (Liang et al., 2022; Todd et al., 2022).
This paper draws theoretical inspiration from classic innovation of entrepreneurship literature, such as Kirzner (2015), which sees entrepreneurship as a dynamic process of discovering imperfect competitions and mismatches between market demand and supply to reap profit. The spatial extension of Kirznerian entrepreneurship argues that location- and industry-specific knowledge enables alert entrepreneurs to take advantage of profitable opportunities (Andersson, 2005). In the context of STR, hosts are seen as ‘micro-entrepreneurs’ (Mahmuda et al., 2022) whose business decisions (location and operation) alter in reflection of emerging and disappearing visitor accommodation demand, driven by large-scale, external shocks like the COVID-19 pandemic. The adaptation to localised market conditions helps build the economic resilience of STR businesses (Korsgaard et al., 2020).
Our study aims to identify and understand STR submarkets in Australia based on operational, geographic, hedonic and temporal characteristics. Using a sequence analysis approach on large STR booking data, we segment six differentiated STR submarkets, whose attributes explain their ‘diving’ or ‘thriving’ trajectory in terms of listing activities before, during and after the pandemic. We further amplify the STR typology into a taxonomy using distinct attributes representative of each type. The findings reveal increasing professionalisation in STR operations, as well as entrepreneurship through spatial positioning for discoverable market opportunities. They provide insights into how STR markets will perform in a future characterised by continued remote work and blurred lines between new and traditional forms of visitor accommodation.
Short-term rentals and the COVID-19 pandemic
The COVID-19 pandemic exerted profound uncertainty on the tourist and visitor accommodation sector, including short-term rental accommodation. Many STR hosts incurred significant economic losses, which coincided with outbreaks of COVID-19 and the subsequent lockdowns and travel restrictions (Chen et al., 2022). These volatile market conditions led many STRs to significantly alter their business operation, such as introducing flexible booking and emphasising guest experience (Sainaghi and Chica-Olmo, 2022). Such alterations also mean a retreat of opportunistic STR investors and a market consolidation that benefits professional hosts (Dolnicar and Zare, 2020).
The pandemic-led transformation yielded differentiated outcomes, where demand dropped significantly in some locations – mainly in major cities – but surged elsewhere. Sainaghi and Chica-Olmo (2022) identified shifts in the preferences for STR listings with less emphasis on property size and geographic centrality, focussing on being professionally operated and in proximity to other properties, instead. Research also indicates that attributes explaining an STR’s ‘survival’ through the pandemic are typically entire-home properties renting out for longer periods (Gossen and Reck, 2021) that prioritise cleanliness (Shen and Wilkoff, 2022) and practise physical distancing (Bresciani et al., 2021). As global tourism gradually recovers from the pandemic since 2022, a complex picture has emerged: While certain STR property types and locations have gained significant visitation, others have seemingly languished.
Australia’s STR history dates to 2012 when Airbnb Australia was officially launched. On the eve of the pandemic, Australia’s market reached its peak with around 330,000 listings, two-thirds of which were actively renting. Currently, active non-hosted listings comprise about 1.5% of Australia’s 11 million dwellings (Sigler and Zou, 2024). The pandemic witnessed considerable consolidation and fluctuation in the STR sector. The growth potential of the Australian STR market shifted from central capital cities to lower-density, peri-urban areas with growing visitor accommodation demand. High-amenity ‘Sea Change’ and ‘Tree Change’ regions also reached new peaks: The former includes quintessential seaside resort towns along Australia’s extensive coastline, whereas the latter covers spectacular wilderness and mountains catering for diverse tourism and hospitality preferences (Zou et al., 2024, Figure 1). Alongside the post-pandemic recovery, the STR industry has been facing an escalating debate over their potential association with over-tourism and declining housing affordability in Australia (Gurran et al., 2020), although early empirical evidence is rather mixed at this point (Bond et al., 2023).
Dolnicar and Zare (2020) postulate owner-investors’ withdrawal from the STR market during the pandemic, finding instead more stability in long-term rental markets. Moreover, they predict a partial, not a full, recovery of the global STR market to its pre-pandemic level, as economic uncertainties could be looming for years. Researchers in the STR space have yet to fully corroborate these hypotheses with convincing empirical evidence. It is essential to study the nuanced STR market segmentation corresponding to rapidly changing market conditions, which could point to plausible answers to these hypotheses.
Thus, this paper aims to address three empirical questions: First, based on varying activity levels over time what STR submarket types emerge? To answer this question, we take advantage of the exogenous shocks to tourism demand associated with the pandemic, such as border closures and reopening, that allow for volatile changes in STR market conditions. Second, can we taxonomise STR types with type-specific temporal, geographic, operational and hedonic characteristics? Lastly, what can be inferred from the STR taxonomy vis-à-vis future entrepreneurial directions of the STR industry and their policy implications?
Empirical approach and data
The methodological framework is centred around a sequence clustering of individual STR booking data. The reasons for adopting sequence analysis are twofold: Segmenting STR submarkets is achieved without a priori assumptions about how many submarkets there are and what they look like. Moreover, the segmentation is based on dynamically changing booking activities before, during and after the pandemic. This framework differs from Kourtit et al. (2022), where STR was intentionally divided into budget and luxury types based on price differentials. The researchers then conducted a survival analysis to understand how STR property and spatial characteristics affect each type’s vulnerability to pandemic effects.
Empirically, we cluster a sequence of monthly booking activities per each active STR property spanning 42 months before, during and after the COVID-19 pandemic and delineate a typology of STR properties, taking advantage of the fluctuating and heterogeneous demand for STRs during different stages of the pandemic. The study periods include eight pre-pandemic months (Periods 1–8, July 2019–February 2020), 23 months of the pandemic (Periods 9–31, March 2020–January 2022) and 11 months after the border reopening (Periods 32–42, February–December 2022). Hence, we are able to capitalise on varying activity levels to derive distinct STR types that exhibit divergent trends using sequence analysis.
We then combine quantitative metrics and qualitative characterisation of key features representing each STR type, including time-varying STR booking performance (availability, utilisation and profitability), geographic and regional concentration, STR operational and hedonic characteristics and develop an STR taxonomy that narrates unique STR submarkets.
Building a typology using sequence analysis
Sequence analysis is a well-established method that allows patterns within a set of categorical sequences to be examined and visualised (Liao et al., 2022; Pyrohova et al., 2023). This is achieved through two key steps. The first step involves a process of calculating pairwise distances between individual sequences comprising a set of categorical states. These distances are used to assess the level of similarity to one another. Next, a clustering process arranges individual sequences into a set of meaningful groups based on the pairwise distances calculated previously. These groups are then graphed in the form of a sequence plot that visualises all individual sequences.
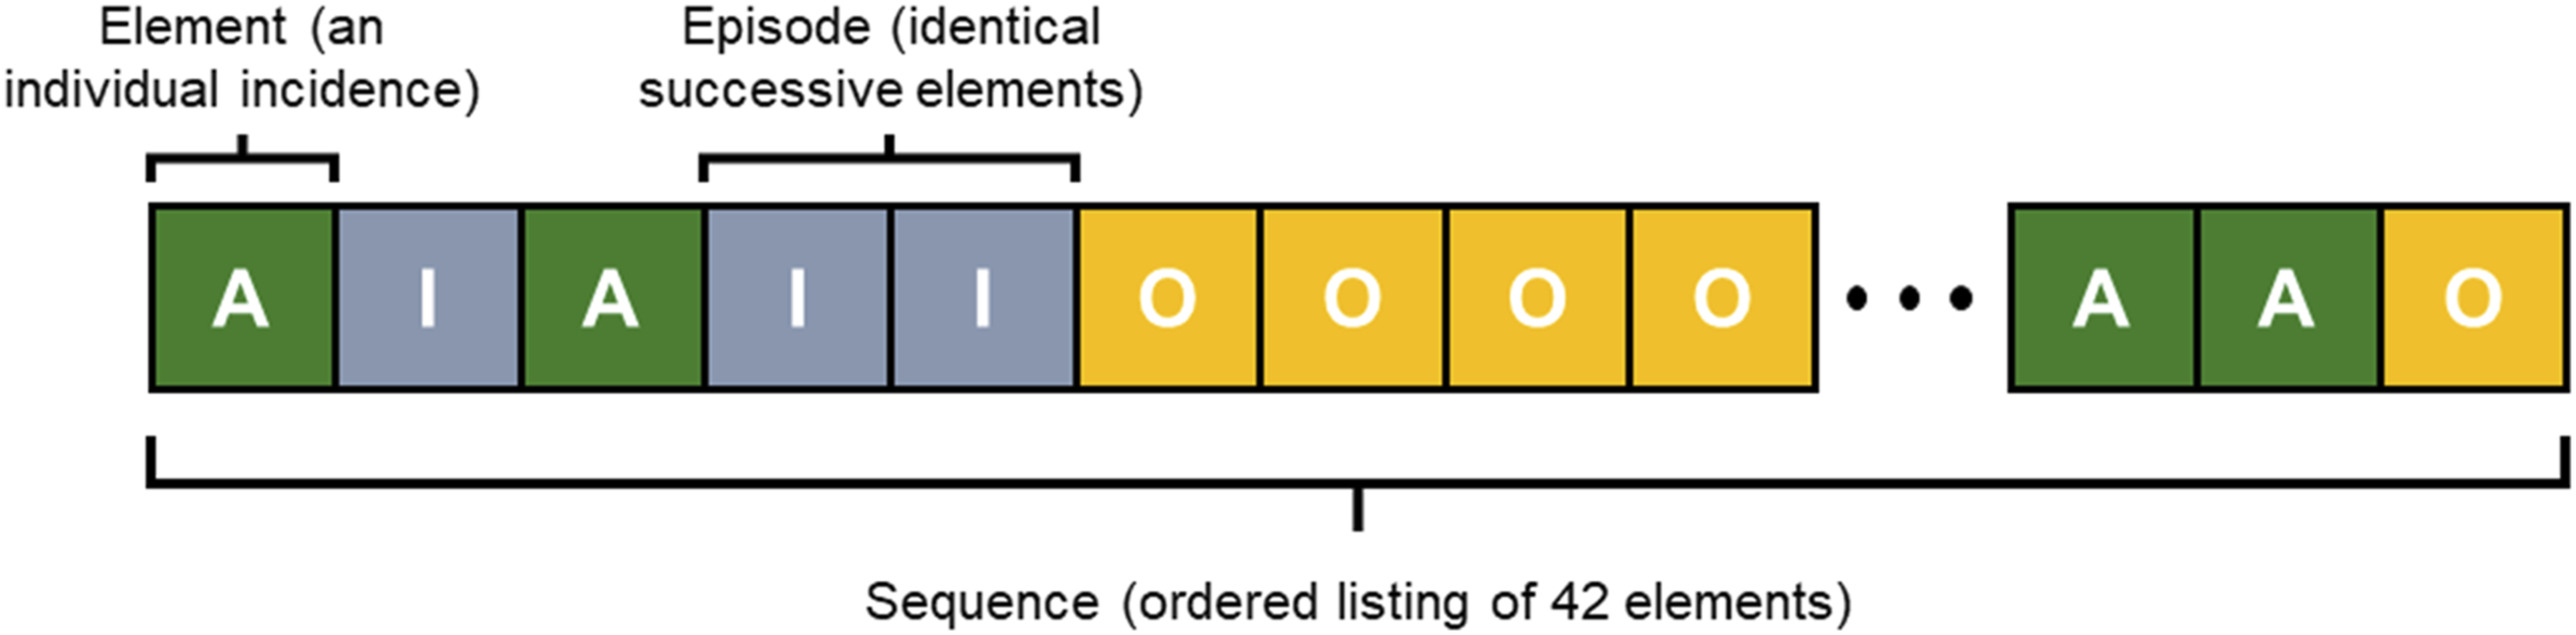
In this study’s context, an individual sequence (Figure 2) is for a single STR property composed of 42 discrete elements representing its status each month from July 2019 to December 2022. There are three statuses: • Active (A): A property is available for booking or booked one or more days in any given month. • Inactive (I): A property is neither available nor booked in any month. • Offline (O): A property is not in the system in any given month due to being delisted from the platforms, inactive for more than 12 consecutive months or yet to be listed. Sample sequence of STR activity statuses (three elements: active (A), inactive (I) and offline (O)).
The sequence analysis is conducted using the TraMineR package in R (Gabadinho et al., 2011). Identifying a cluster requires the calculation of the longest common subsequence of booking activities and comparison between different STR properties, where a distance-based dissimilarity measure is used. STRs of similar activity sequences are clustered into a type.
To determine the most appropriate number of clusters for the input dataset, we adopted a hybrid approach combining three quantitative metrics (the Average Silhouette Width, Hubert’s C Coefficient and Point Biserial Correlation), which set a range of 4–8 clusters, with visual assessment and logical reasoning on each state distribution plot and their associated dendrogram for 4–8 clusters, which determine the optimal number of six clusters. The strategies closely resemble those presented in Studer (2013, Section 6). The detailed methodology behind selecting six clusters is documented in Supplementary Material (Subsection ‘Sequence Analysis’, including Figures S1 and S2) for reference. Note that only STRs with at least one active month in the study period are considered for the analysis due to the irrelevance of ‘zombie’ listings with no STR activities throughout the study period.
Characterising types into a taxonomy
Next, we characterise six STR types into taxonomy by combining a qualitative evaluation of sequence plots alongside quantitative and spatial measurements that distinguish the six types. Specifically, we: • Identify ‘diving’ versus ‘thriving’ trends: A direct outcome of the sequence clustering analysis is a series of sequence plots. They provide visual evidence demonstrating the overall trends of STR activities spanning 42 months per each STR type. Furthermore, we plot temporal trends of four benchmark STR activity metrics for six types: quantity (number of active listings), availability, utilisation and profitability. The ‘diving’ types likely exhibit declining or inactive trends towards the late-/post-pandemic periods, whereas the ‘thriving’ types either sustain or raise activity levels. • Characterise each type: Besides their distinct temporal activity levels, type-specific geographic, operational and hedonic characteristics are used to delineate a type. We produce a choropleth map for each type that highlights suburbs and regions with a high concentration of active listings. We also produce type-wise summary statistics and binomial logistic regression results that help accentuate type-specific features.
This taxonomy has utility in its capacity to infer broader STR market trends, the growth and decline of STR property types and locations, alongside desirable STR operations and amenities.
Data sources
STR monthly booking information and property characteristics are extracted from STR data collected and curated by AirDNA, an industry-leading STR data provider. STR booking and property information from major platforms like Airbnb and Vrbo are collected and cross-validated for high accuracy (AirDNA, n.d). Over the 42-month study period, 456,072 STR properties amounted to 11.8 million booking records. To enrich the spatial information, each STR’s longitude–latitude information is used to spatially join suburb (Census Statistical Area 2, ‘SA2’ for short) and regional (Tourism Region) data. The enriched dataset contains temporal, geographic, STR operational and hedonic characteristics, underscoring the main objectives of the empirical work.
Summary statistics of key short-term rental metrics for the full sample.
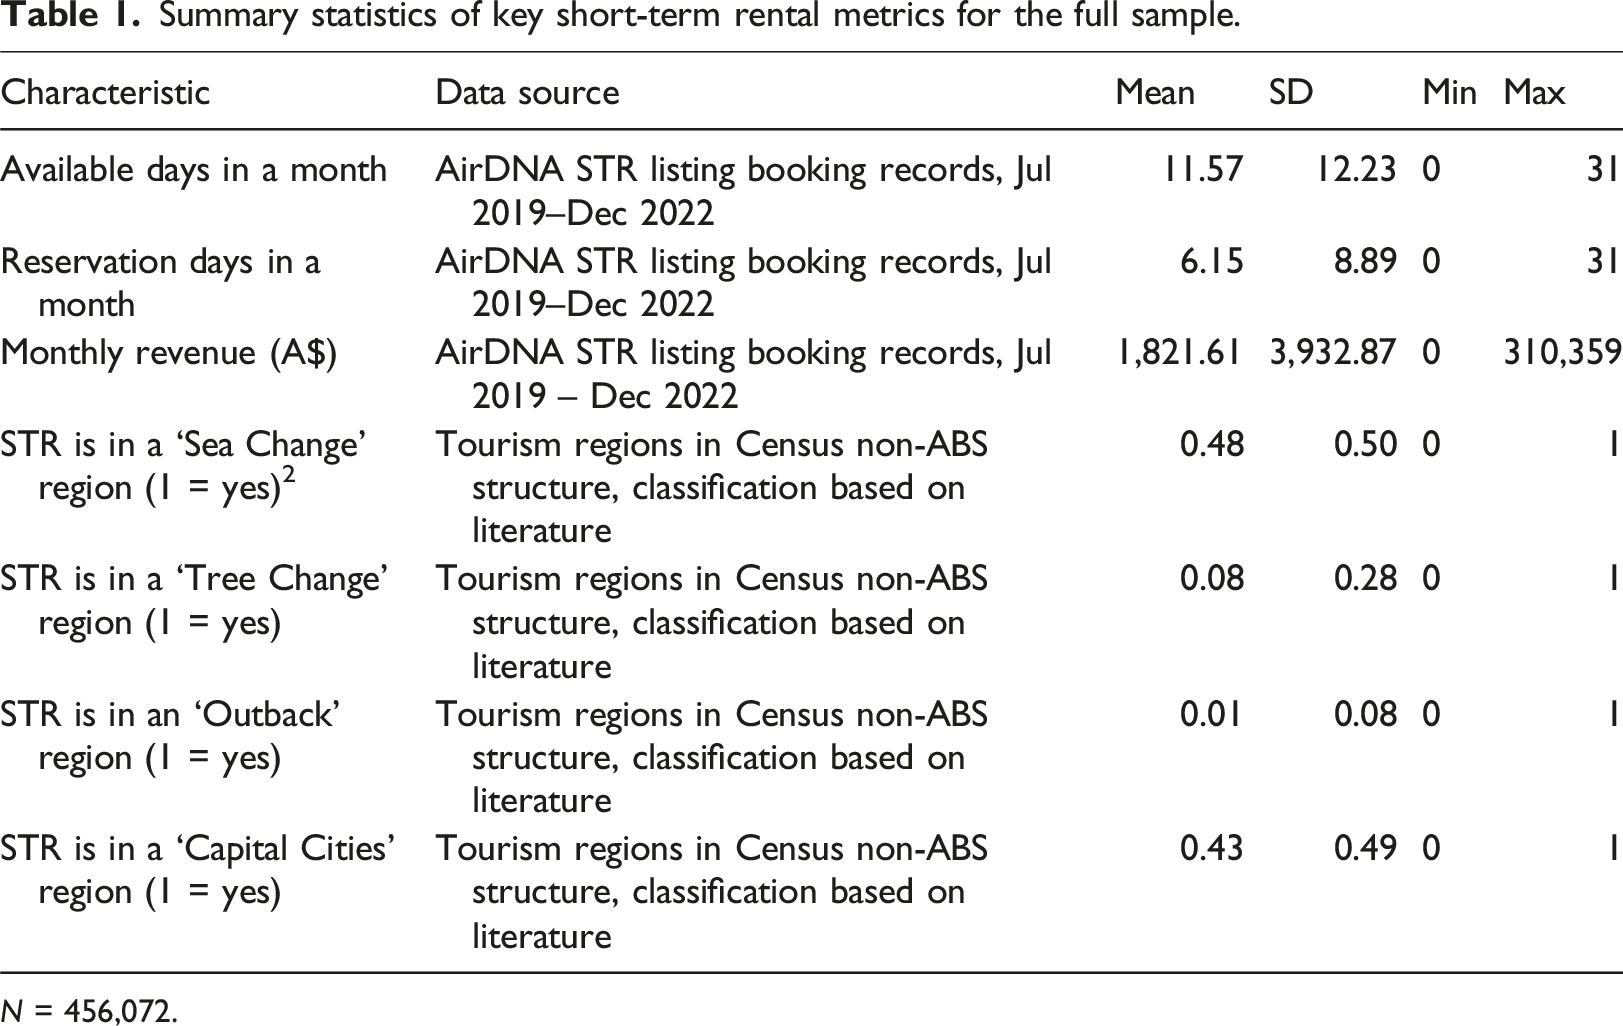
N = 456,072.
Results
Six STR types
The sequence plots are visualised in Panel A of Figure 3. Their temporal STR activity dynamics are as follows: • Type 1: 15% of properties are classified as Type 1. They are characterised by an active status during the early stages of the pandemic until mid-2021 when the COVID-19 Delta variant spread across Australia (Periods 24–28), gradually switching to an offline status. This is considered a ‘diving’ type. • Type 2: 21% of properties are classified as Type 2. They are characterised by market entry and increasing activeness after border restrictions were lifted at the beginning of 2022 (Period 32 onward). This is considered a ‘thriving’ type. • Type 3: 20% of properties are classified as Type 3. They are characterised by maintaining activity throughout the study period with few disruptions. This is considered a ‘thriving’ type. • Type 4: 14% of properties are classified as Type 4. They are characterised by turning inactive during the initial stage of the pandemic (Periods 9–10) and remaining largely inactive for the rest of the study period. This is considered a ‘diving’ type. • Type 5: 13% of properties are classified as Type 5. They are characterised by market entry in late 2020 (Period 15 onward) and rapidly rising activity levels thereafter. This is considered a ‘thriving’ type. • Type 6: 17% of properties are classified as Type 6. They are characterised by turning inactive in early 2020 (Periods 9–10) and quickly transitioning into an offline mode. This is considered a ‘diving’ type. Sequence analysis results: (a) Sequence plots of status distribution for six types, (b) the sequence plot of status distribution for all STRs and (c) dissimilarities between sequence medoids for six types.
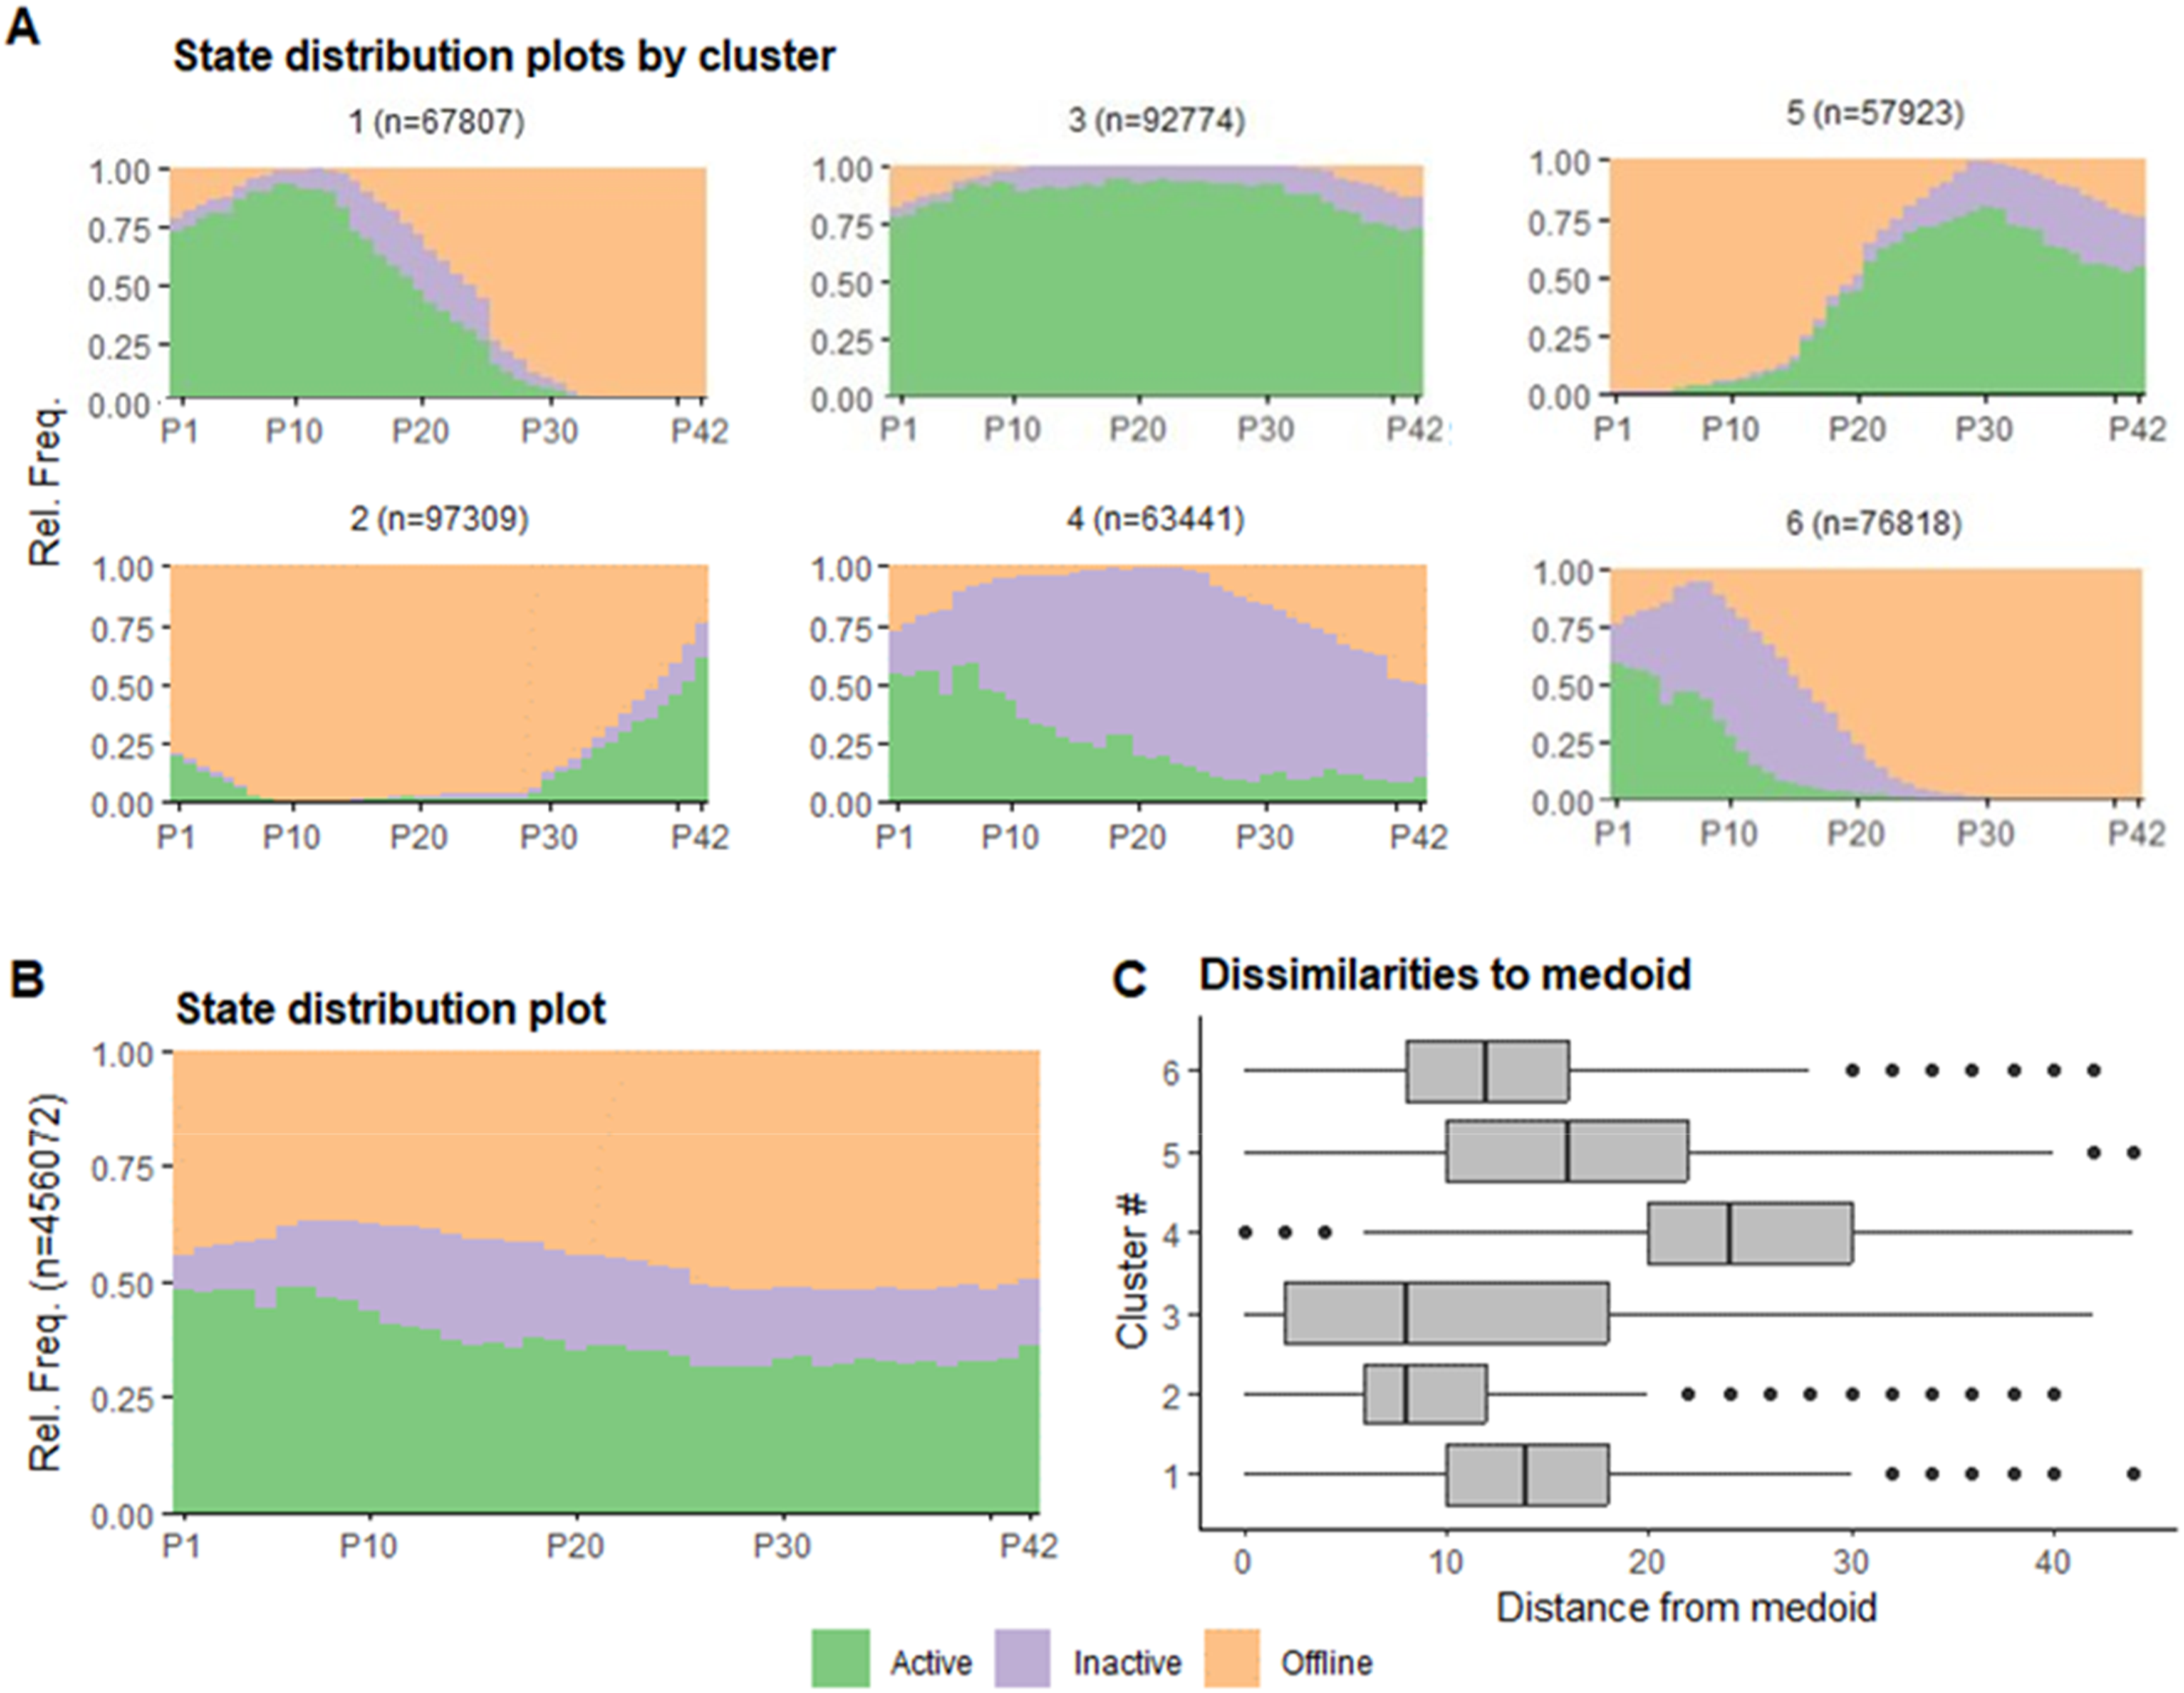
These six types significantly differentiate in activity statuses across the study period, as demonstrated in the unique sequence plots and varying dissimilarities from cluster medoids (Panel C of Figure 3). Their temporal dynamics exhibit distinct patterns through various stages of the COVID-19 pandemic with generally ‘diving’ or ‘thriving’ trends in activeness. The clustering pathway is visualised in the dendrogram for the six-cluster scheme in Figure S2 in Supplementary Materials.
Taxonomy of six STR types
Next, we formulate the taxonomy based on quantitative and qualitative characterisations of type-specific temporal, geographic, operational and hedonic features for the six STR types.
Temporal characteristics
We further describe the temporal trends for six types with four benchmark metrics: quantity (percentage of active STRs in a month), availability (per active STR monthly non-blocked days), utilisation (per active STR monthly reservation days) and profitability (per active STR monthly revenue). These metrics are presented in Supplementary Materials (Temporal dynamics in four metrics, Figures S2-S5).
Combined with the sequence plots, the visually distinct temporal dynamics distinguish the ‘thriving’ STR types (including Type 3: sustaining throughout the study period; Type 5: growing amid the pandemic; and Type 2: growing in the post-pandemic period) from the ‘diving’ types (including Type 4/Type 6: inactive/offline during the early stage of the pandemic; and Type 1: gradually offline amid the pandemic).
Geographic characteristics
Considering STR’s close association with tourism markets, the geographic distribution of the six STR types inevitably differs. In the following map series (Figures 4–9), we visually display the percentage of each type of STRs in all active STRs within a Census SA2 (suburb), with zoomed-in maps for six tourism-focused capital cities.
3
These maps highlight regional clusters for each STR type. Notice that the suburbs with less than 100 STRs are excluded to avoid misleading, extreme percentages. • Type 1: Relatively concentrated in tourism-focused regions surrounding capital cities, including the traditional tourist destinations like Philip Island and Mornington Peninsula in Victoria, Hunter Valley in New South Wales and Limestone Coast in South Australia (see Table S3 in Supplementary Materials). • Type 2: Clustered in coastal towns and peri-urban regions surrounding capital cities more known to domestic travellers, such as coral reef coasts in central/northern Queensland (e.g. Bundaberg and Mackay) and northwest coastal regions in Western Australia. • Type 3: Clustered in less populated coastal and inland regions. These are traditional, non-urban tourism regions for domestic visitors, such as Central Highlands and Kangaroo Island. These regions typically have a stable short-term rental accommodation demand. • Type 4: Concentrated in populous capital cities as well as international tourist destinations like Uluru (‘Ayers Rock’) in the Northern Territory and the Gold Coast in Queensland. • Type 5: Clustered in less populated, coastal and inland outback regions across Australia. • Type 6: Heavily concentrated in capital cities and Uluru. Spatial distribution of Type-1 STRs at the suburb (SA2) level. Spatial distribution of Type-2 STRs at the suburb (SA2) level. Spatial distribution of Type-3 STRs at the suburb (SA2) level. Spatial distribution of Type-4 STRs at the suburb (SA2) level. Spatial distribution of Type-5 STRs at the suburb (SA2) level. Spatial distribution of Type-6 STRs at the suburb (SA2) level.
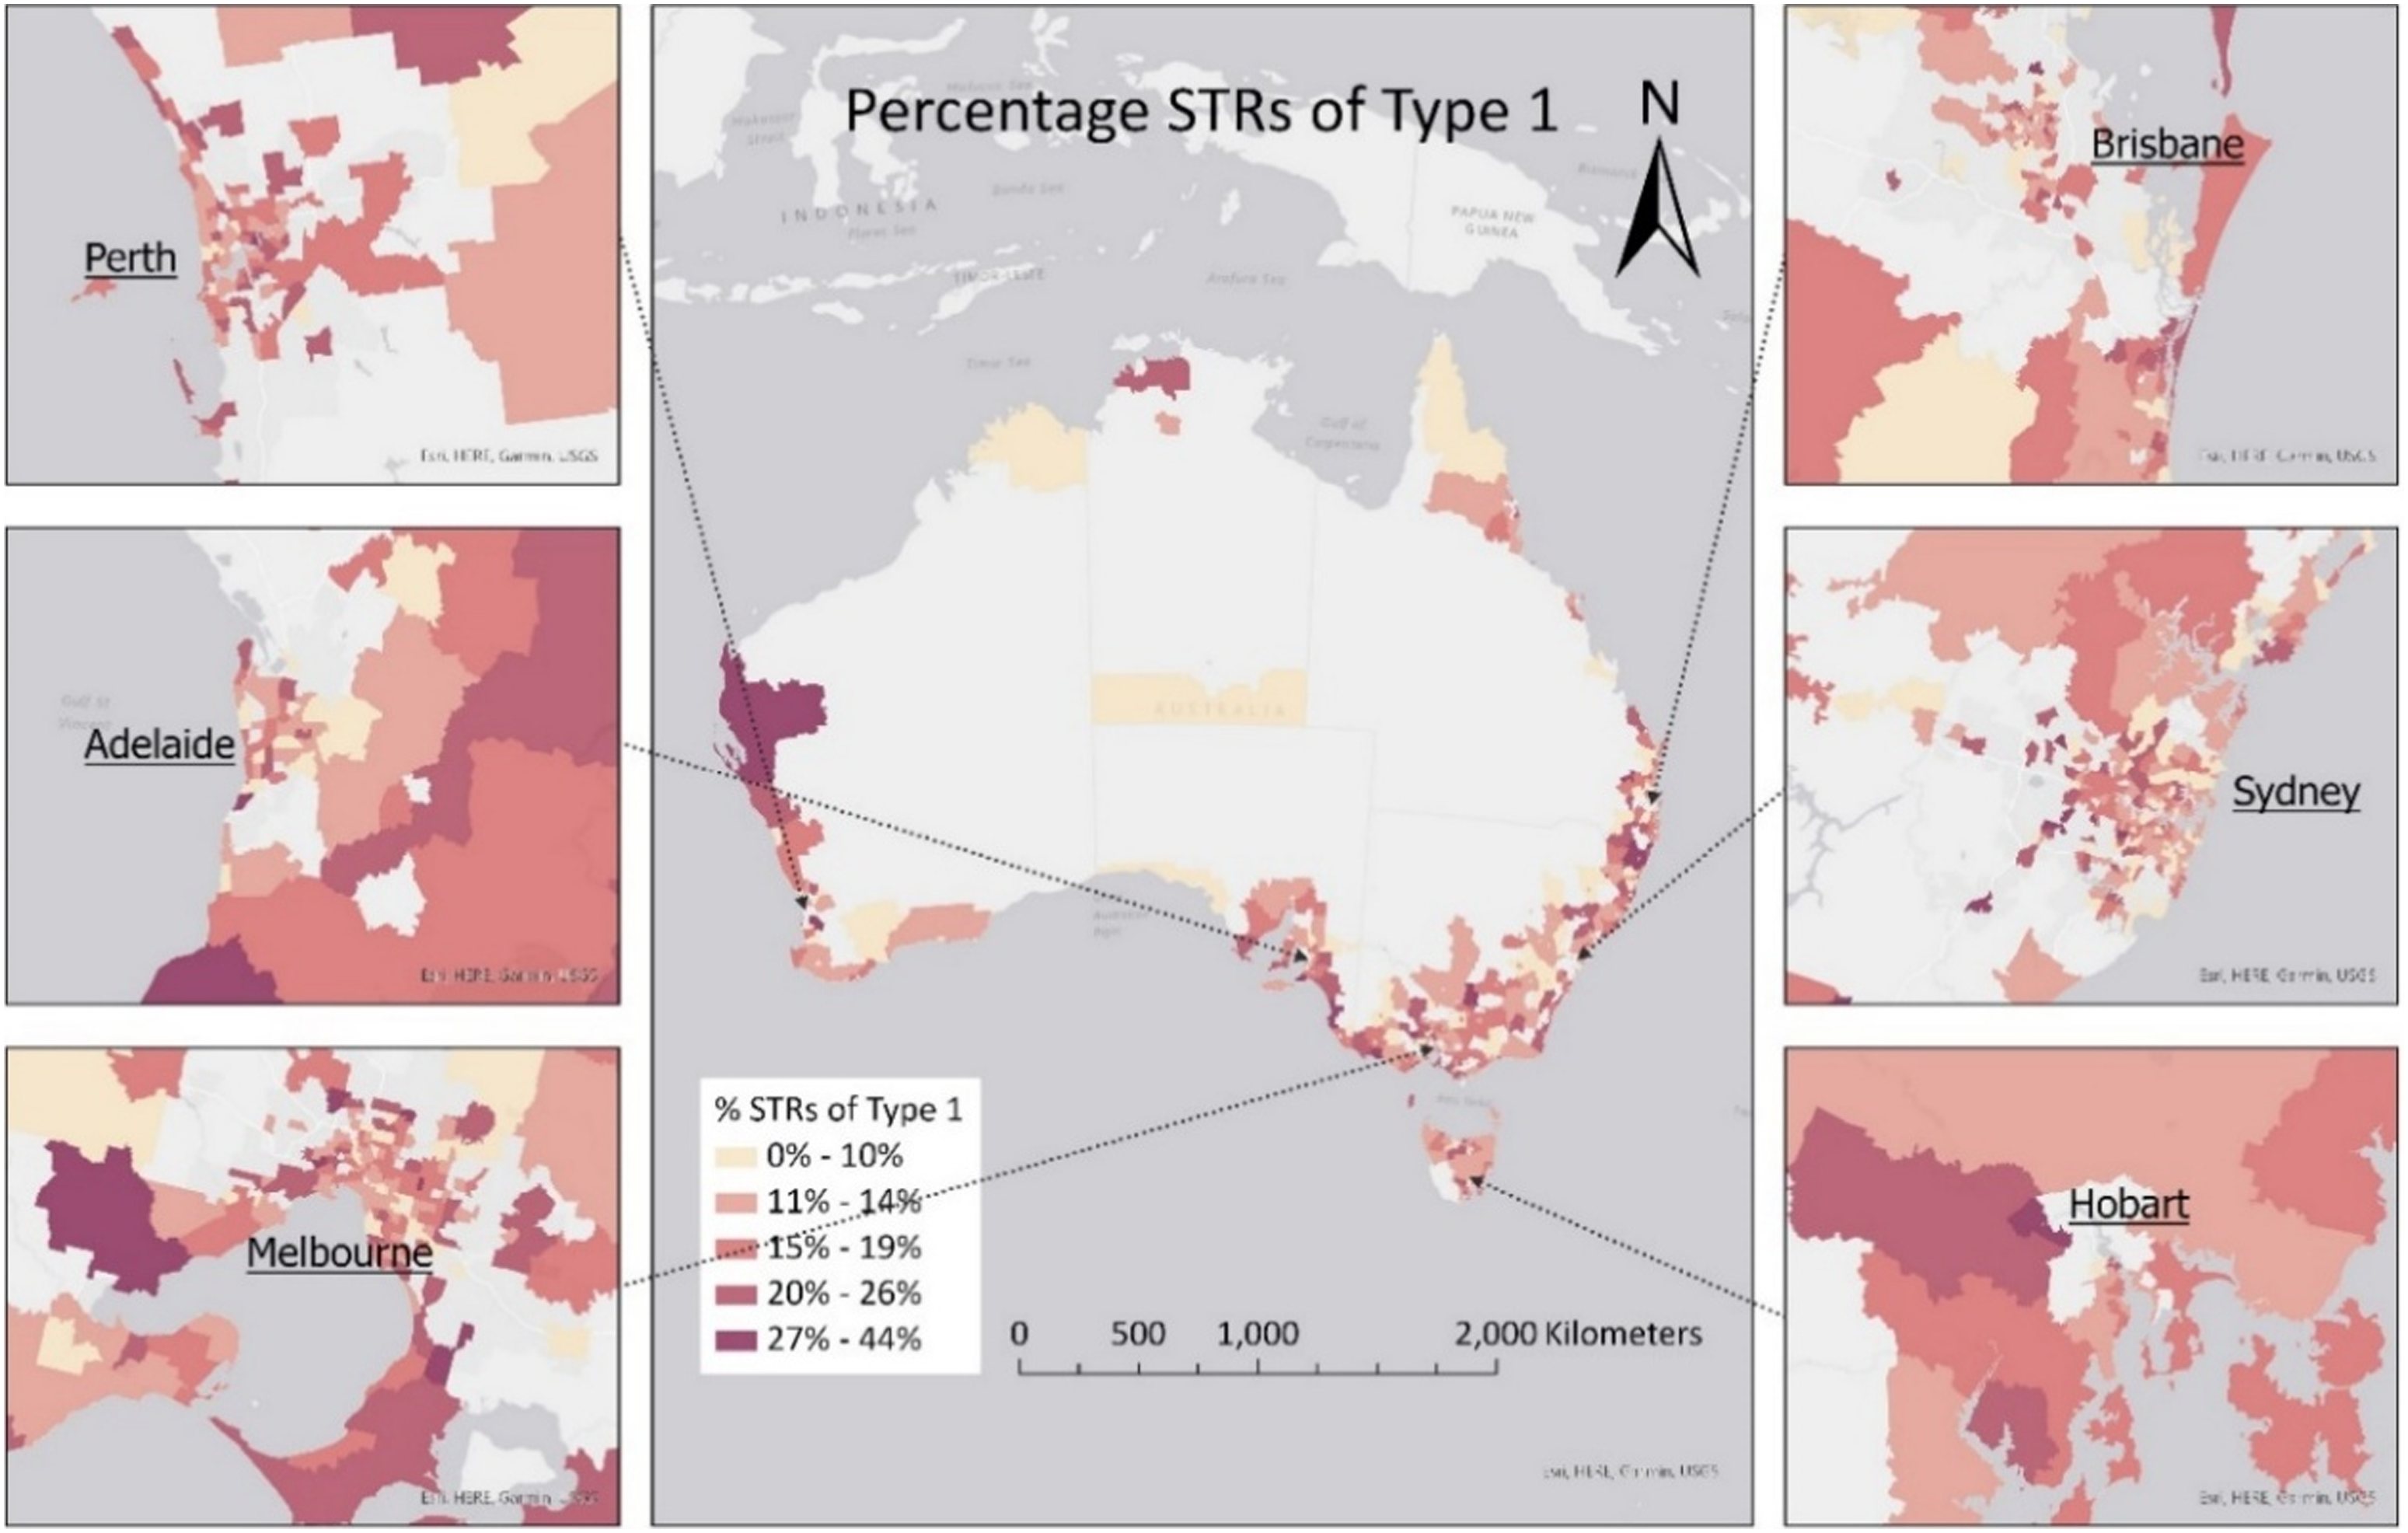
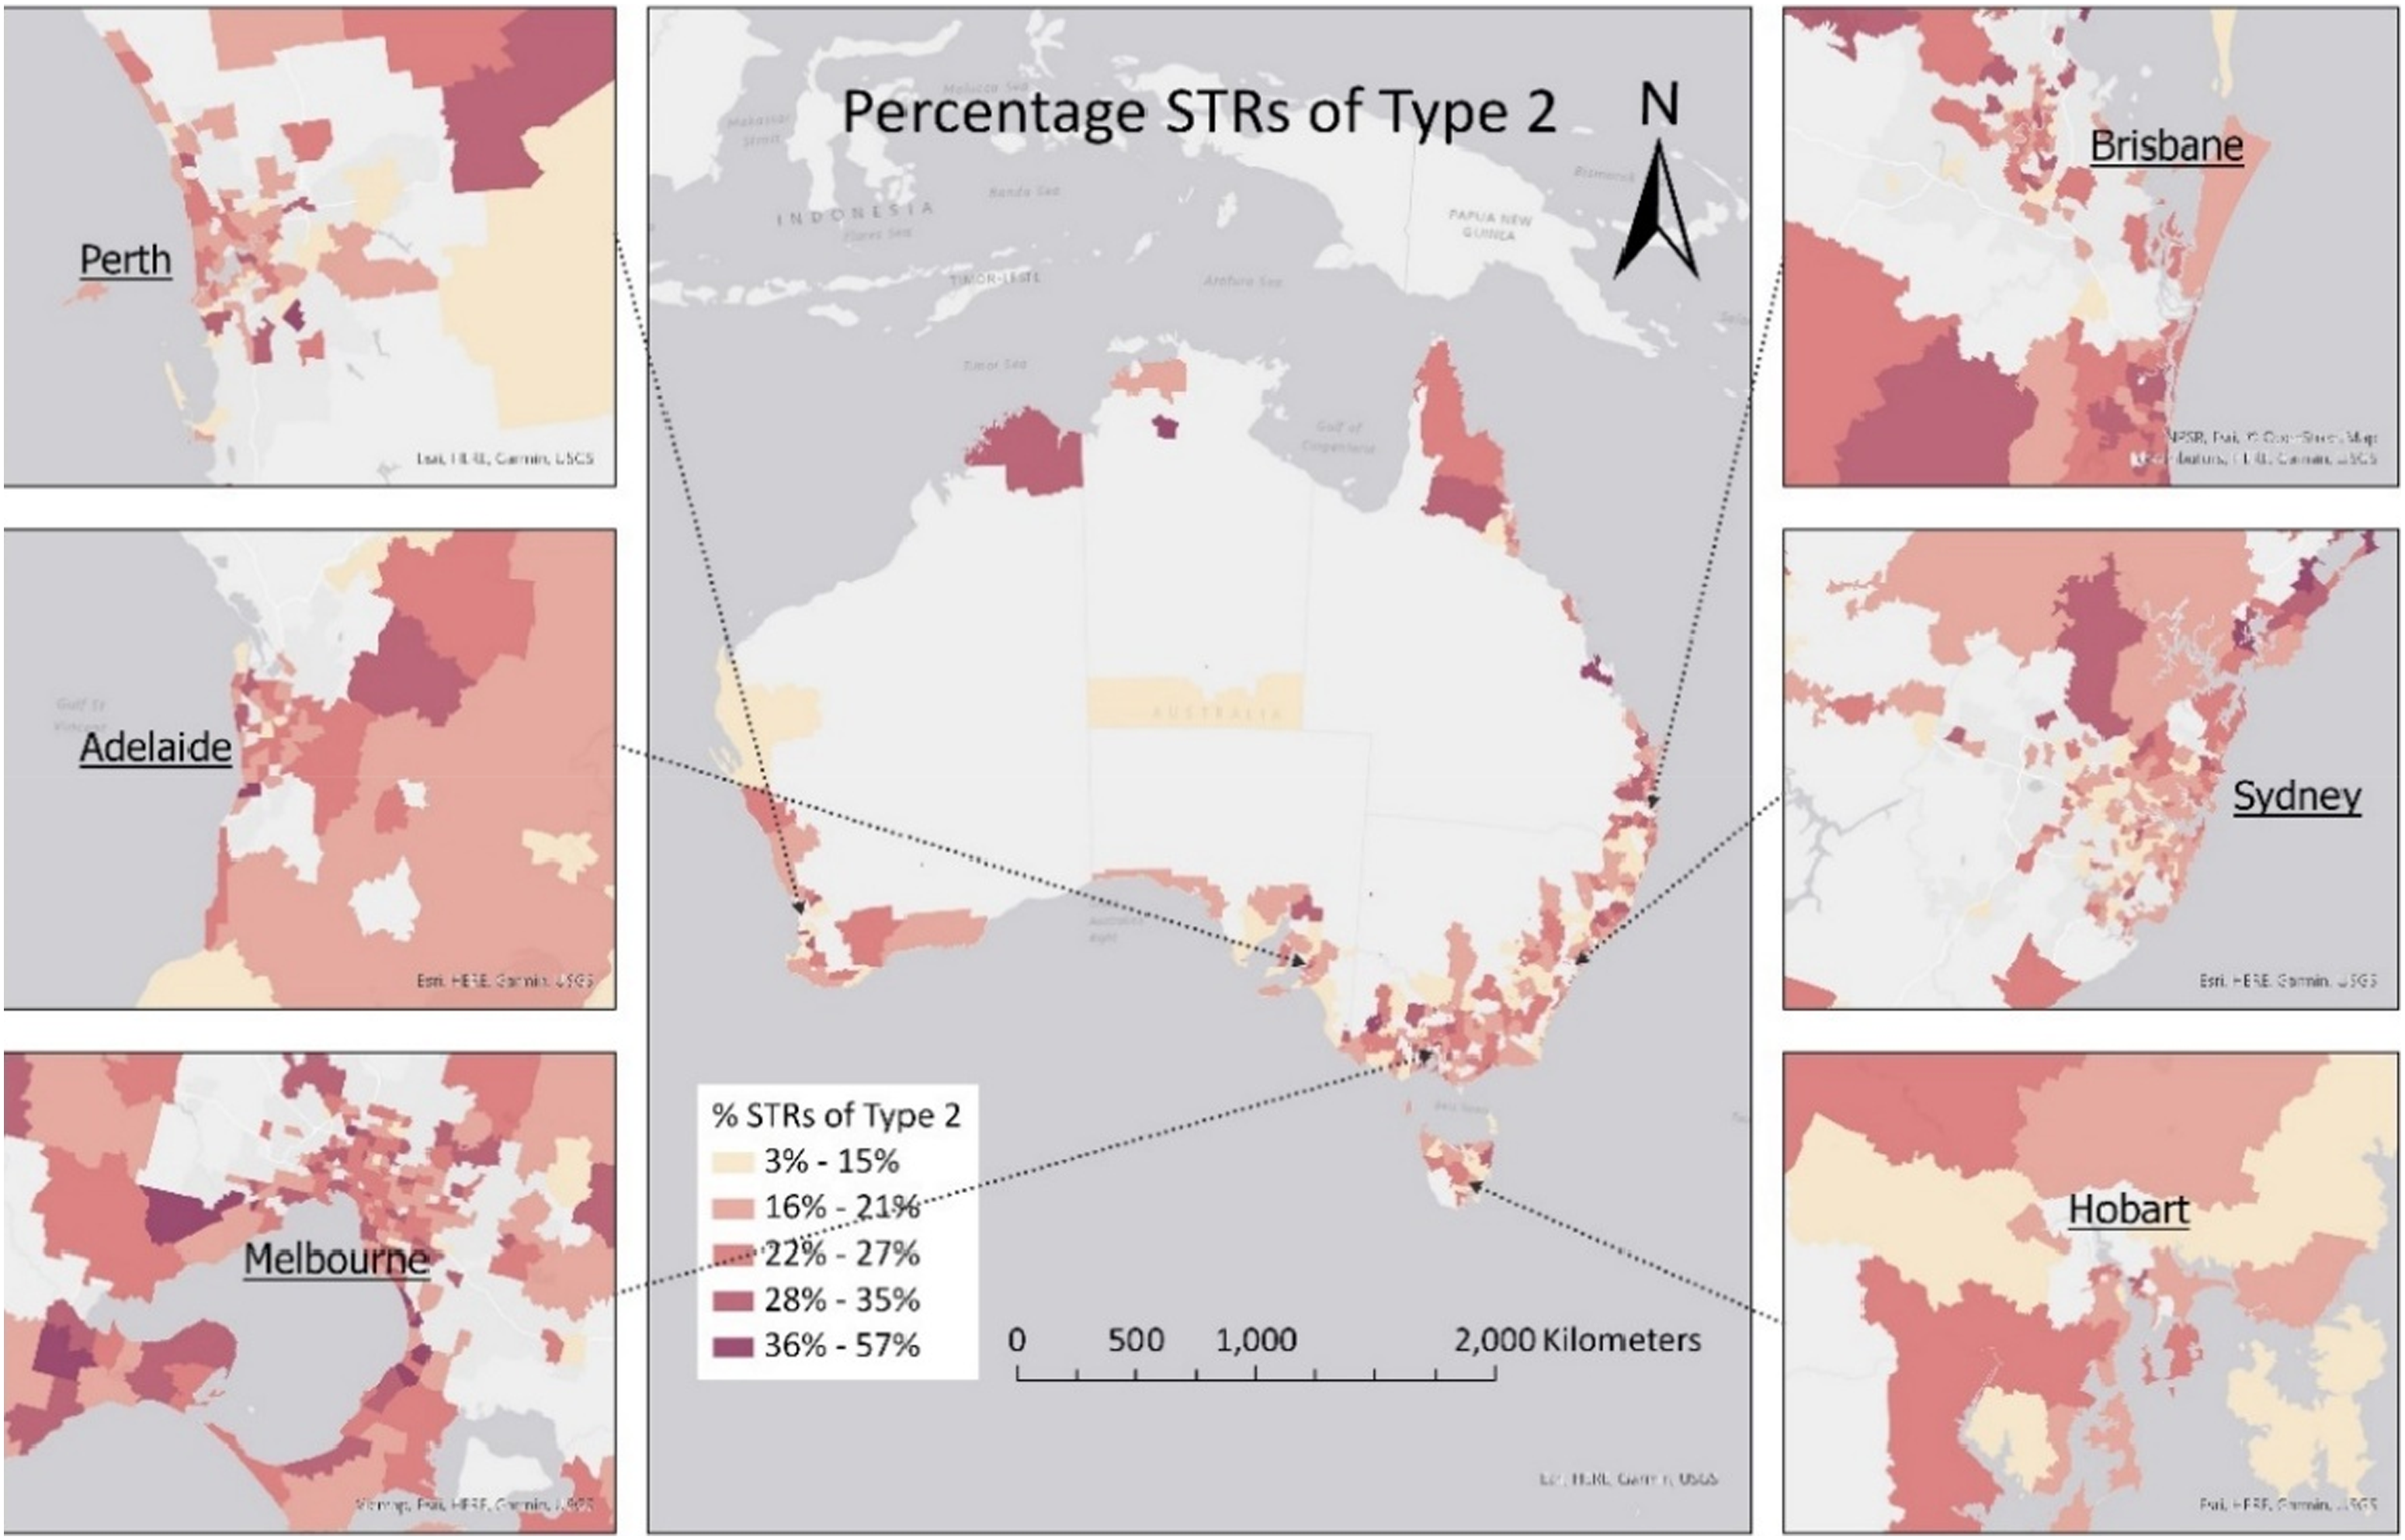
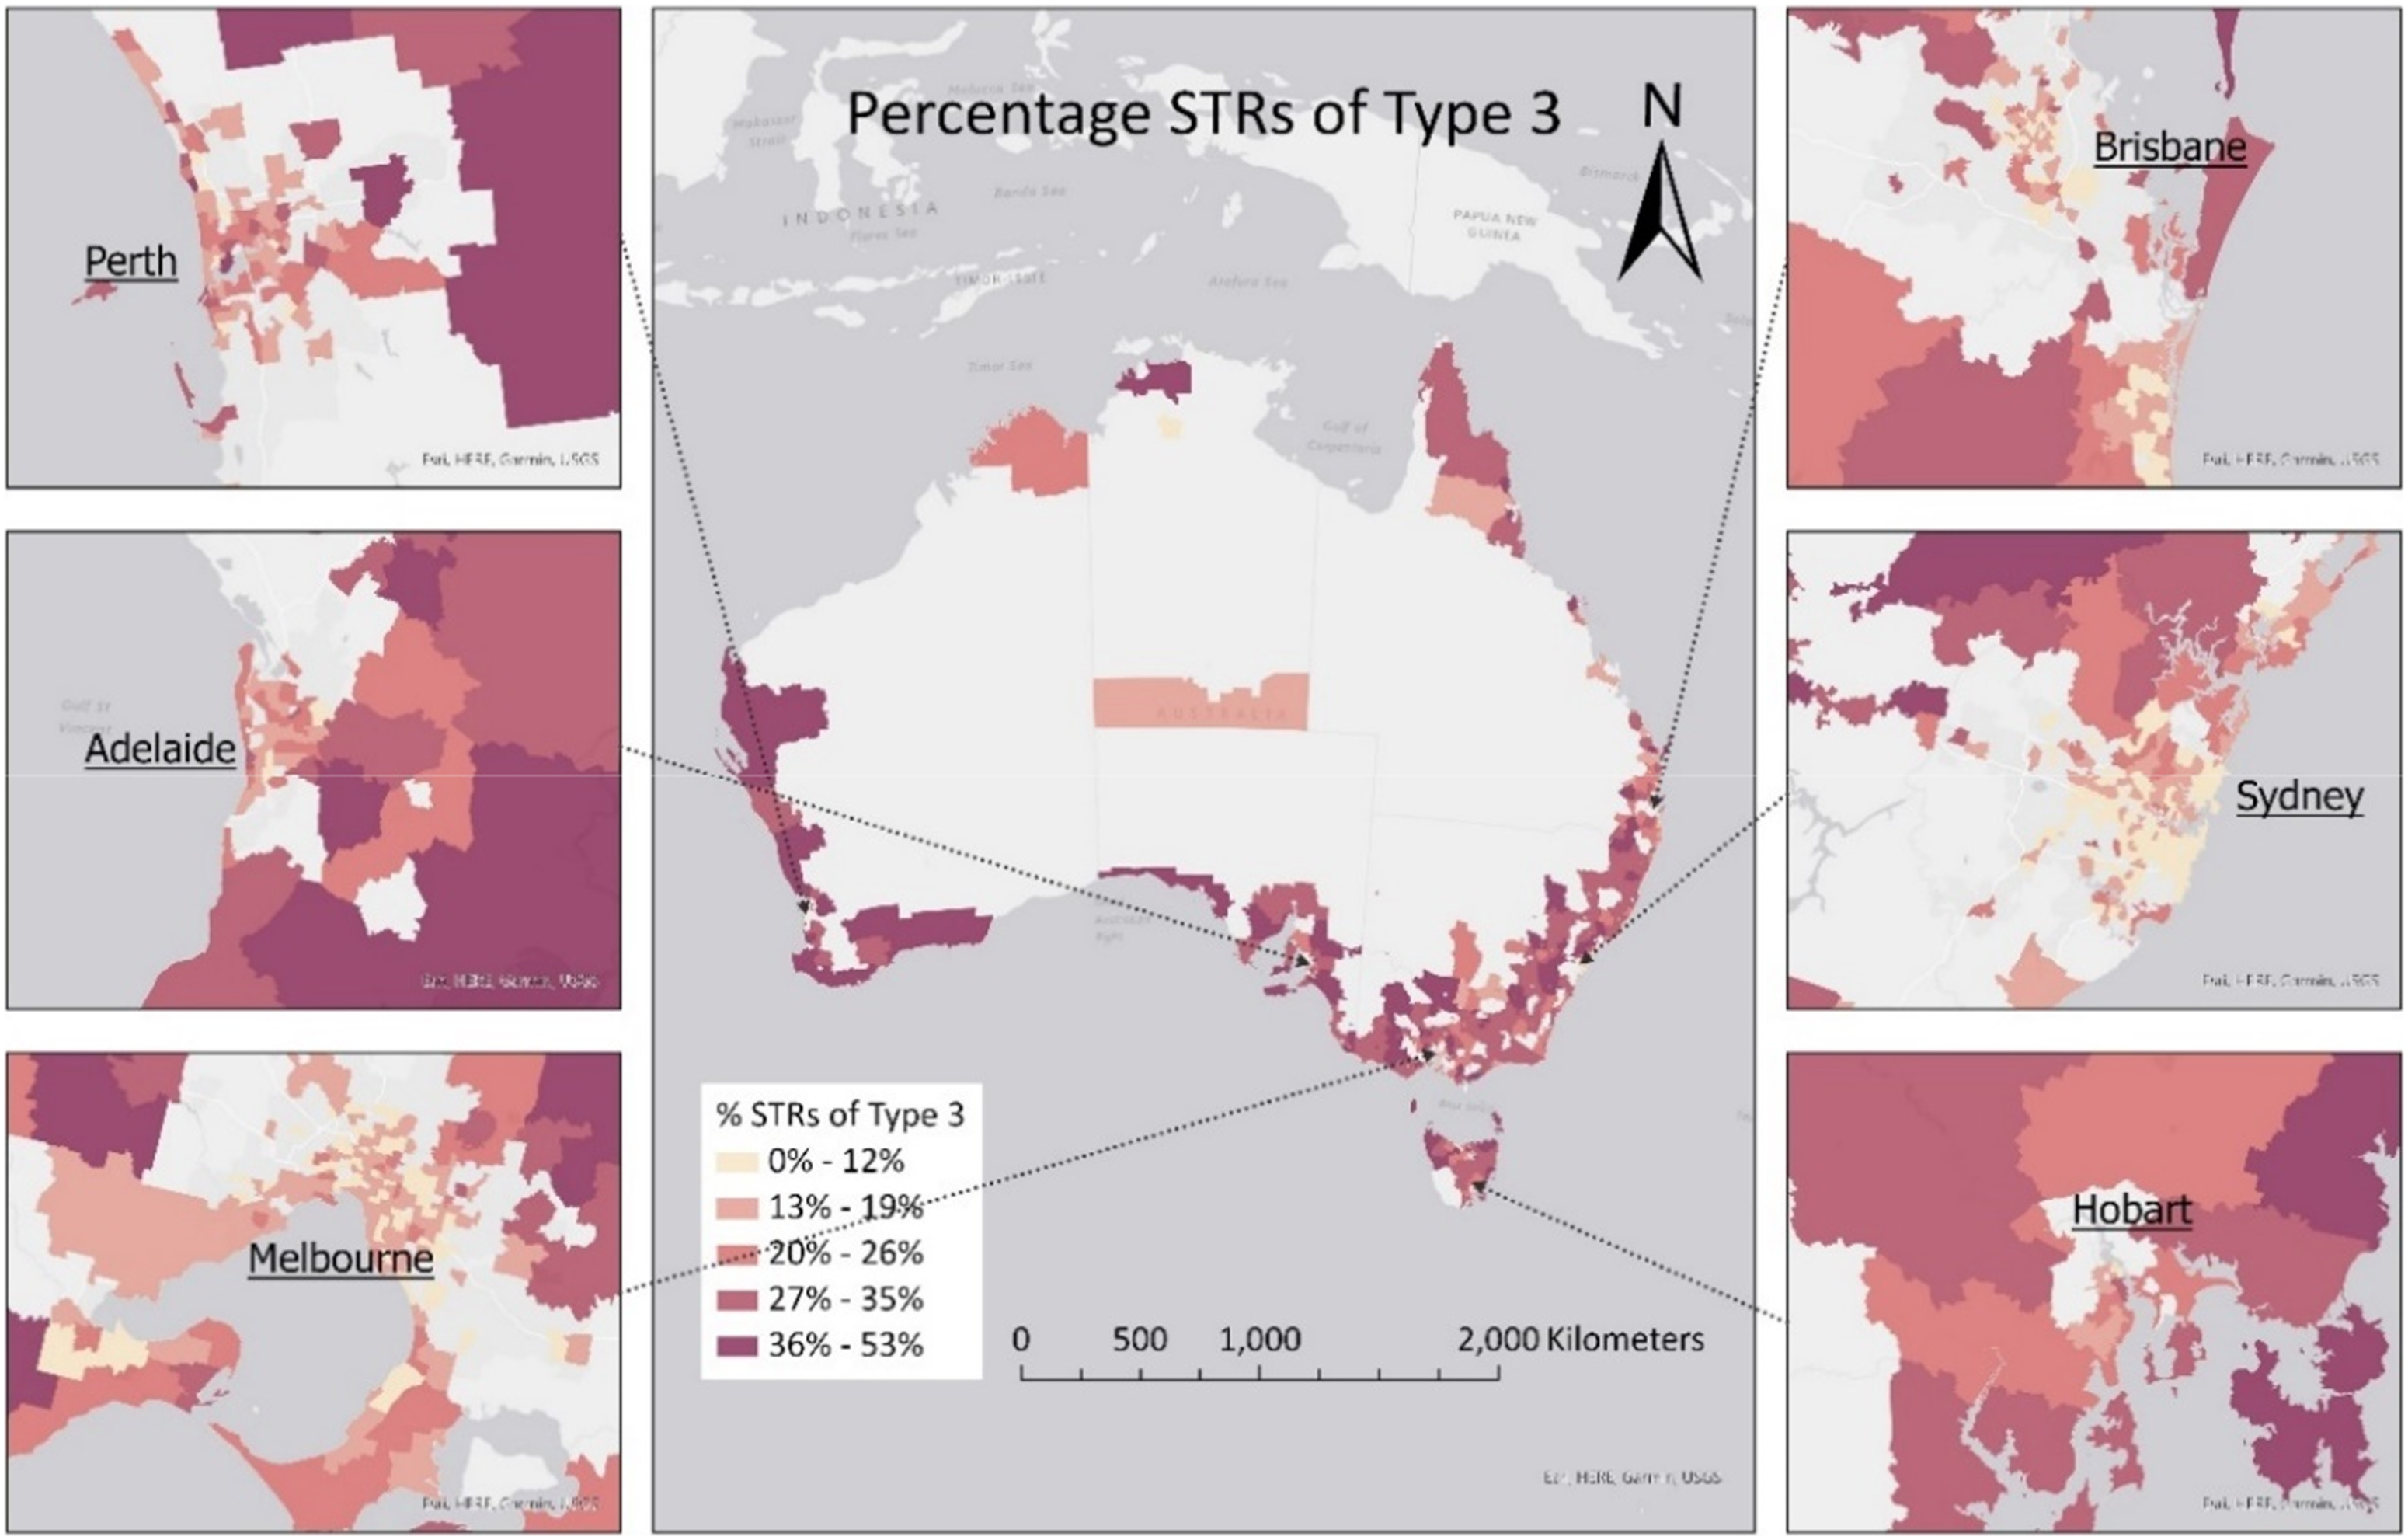
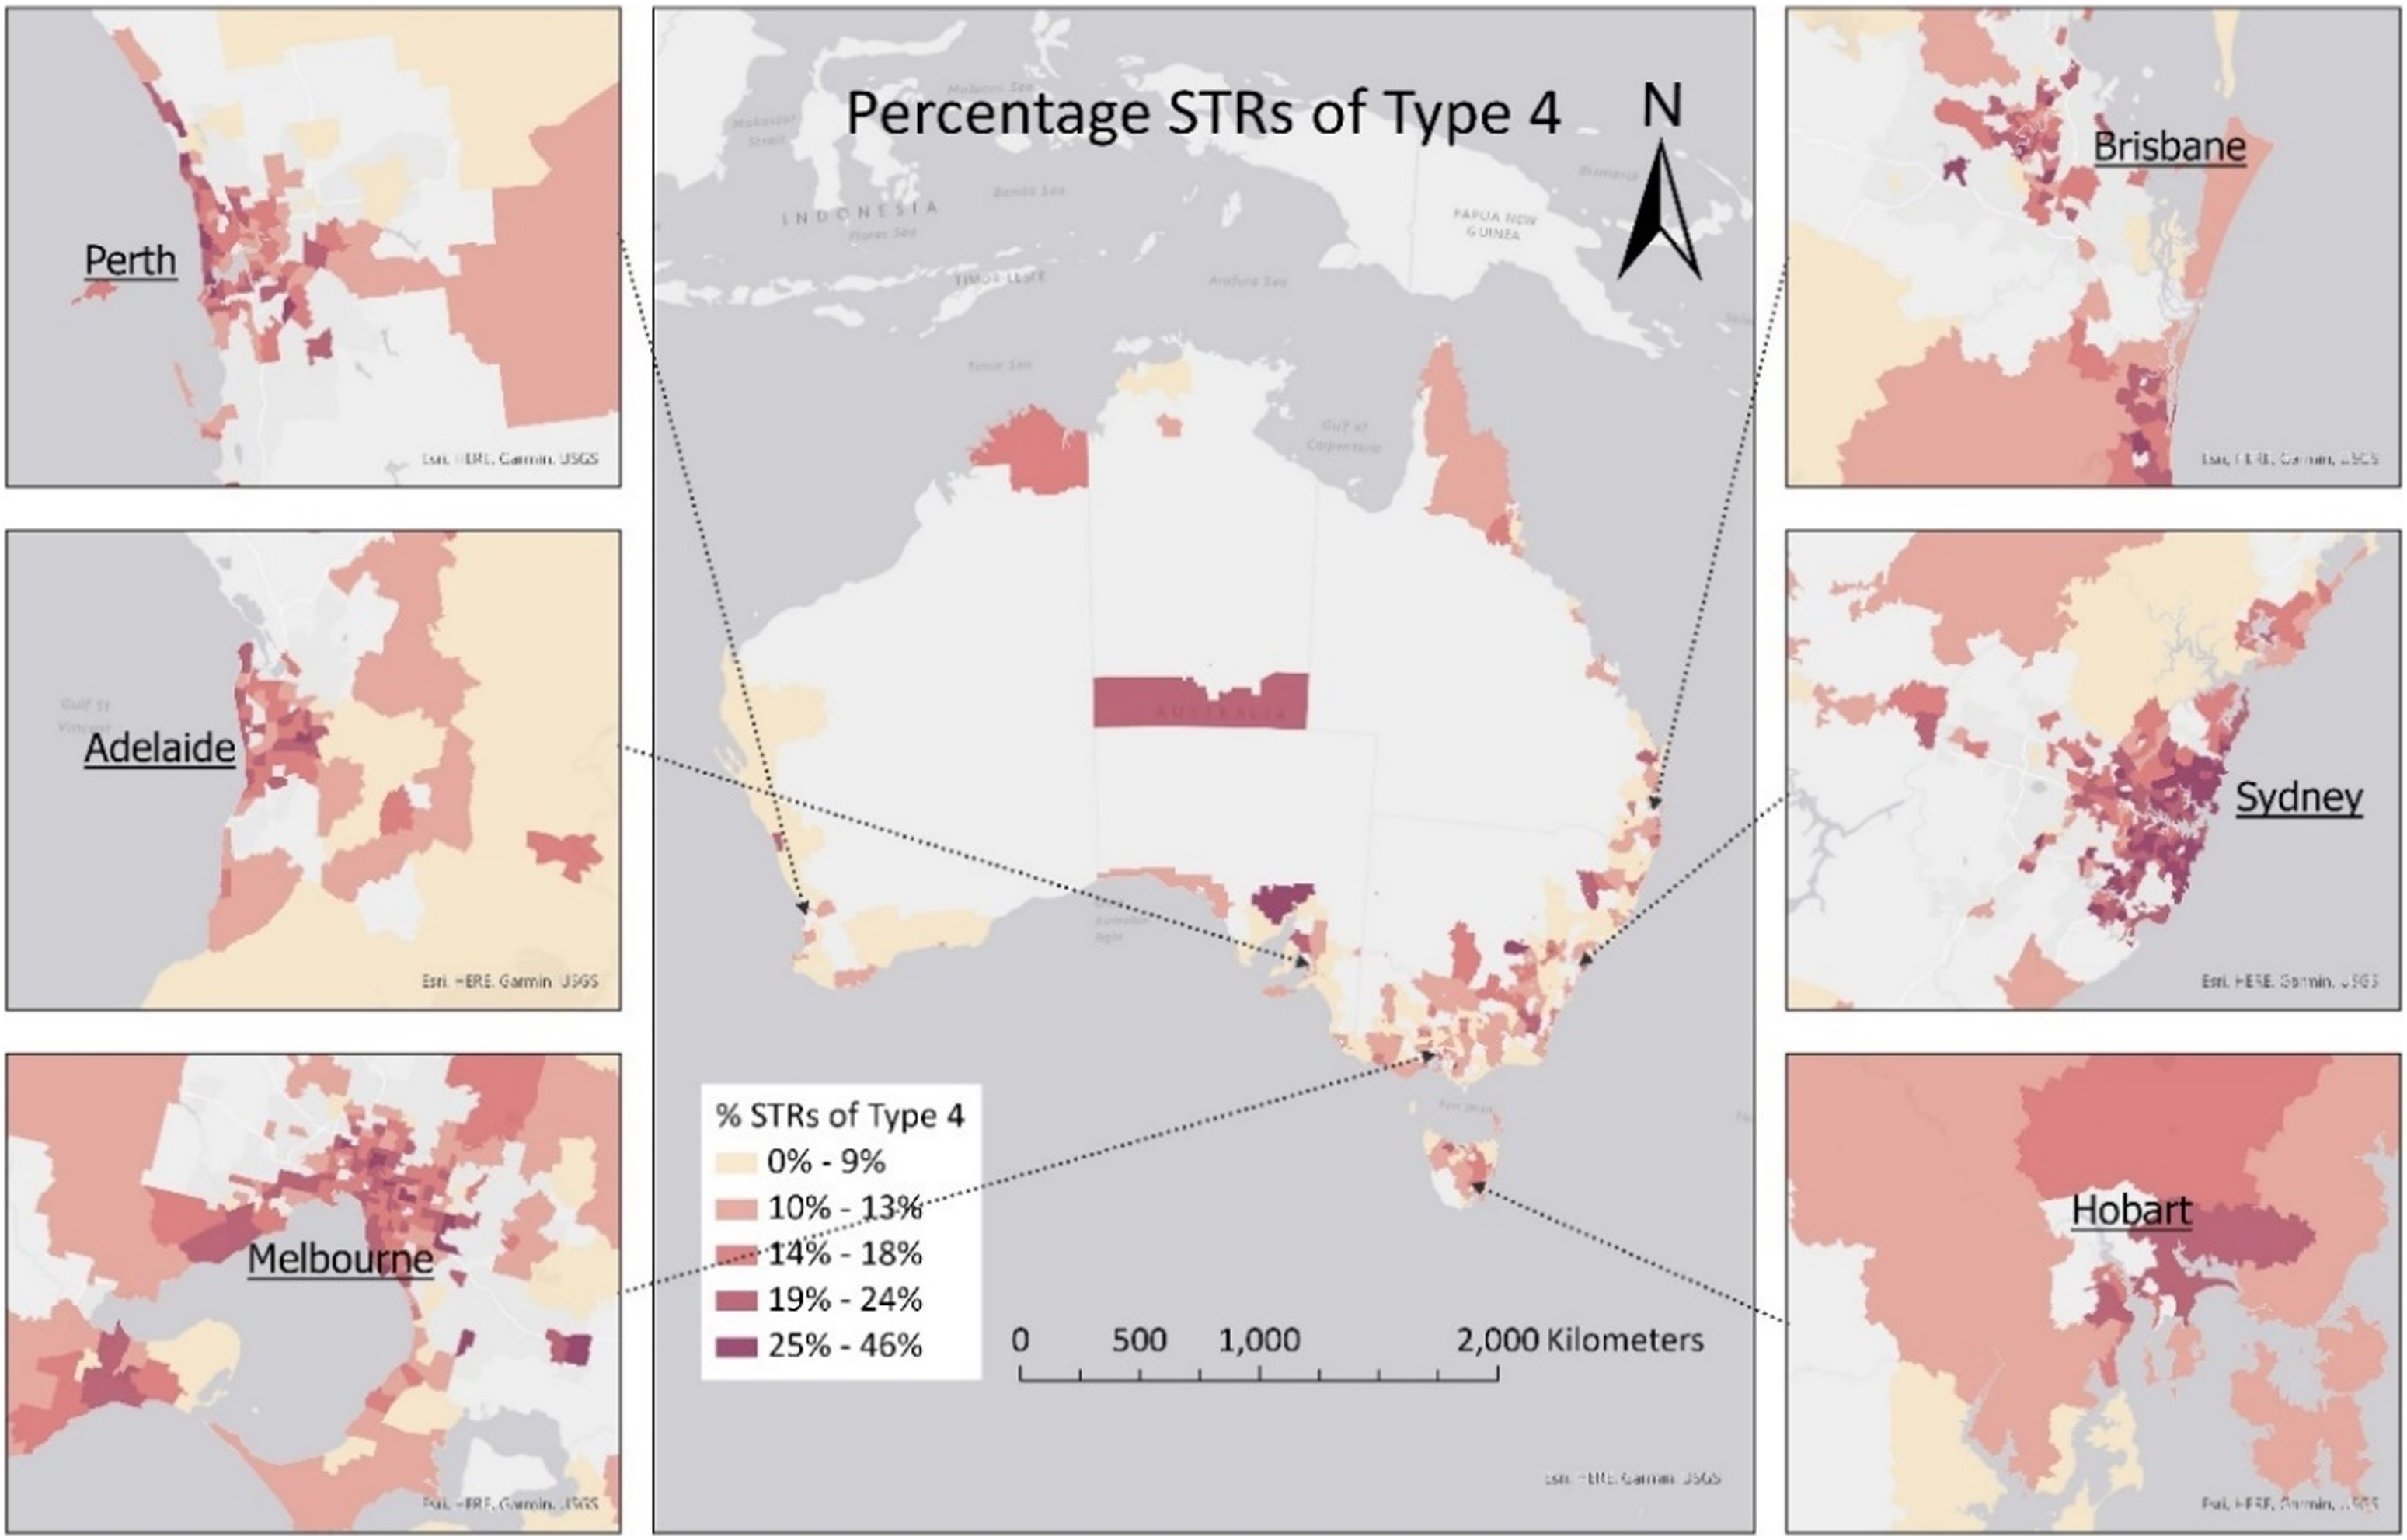
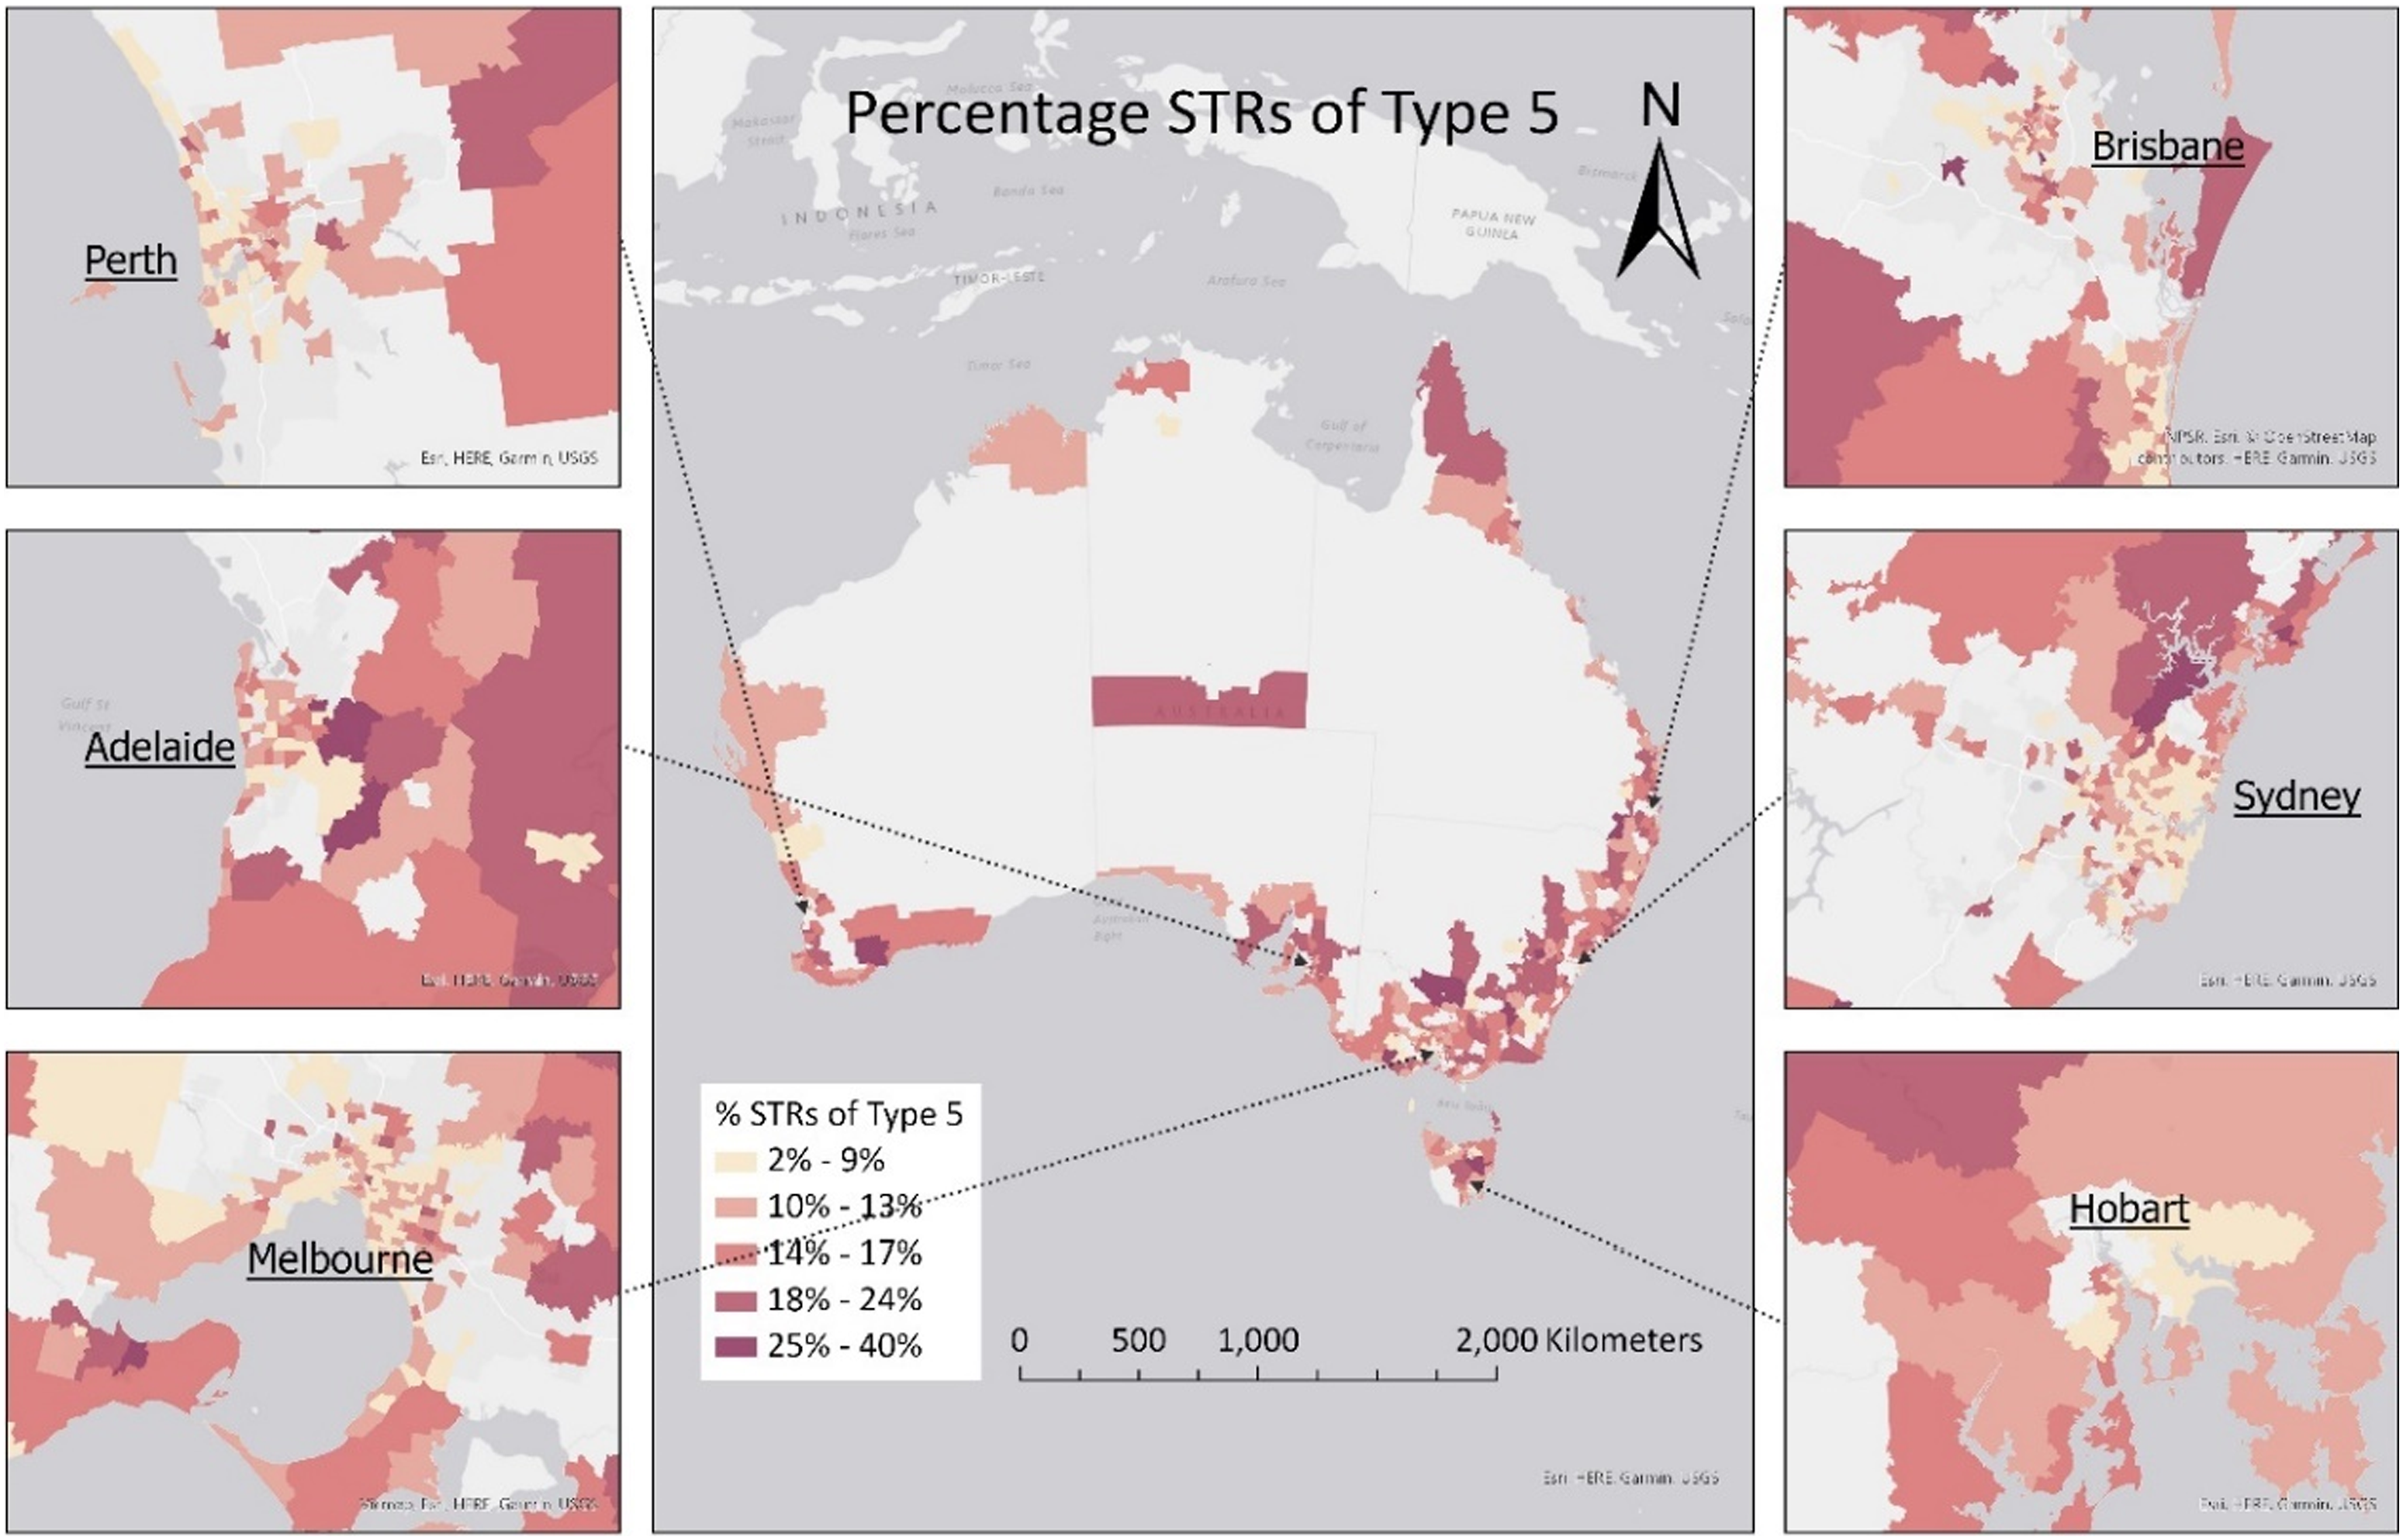
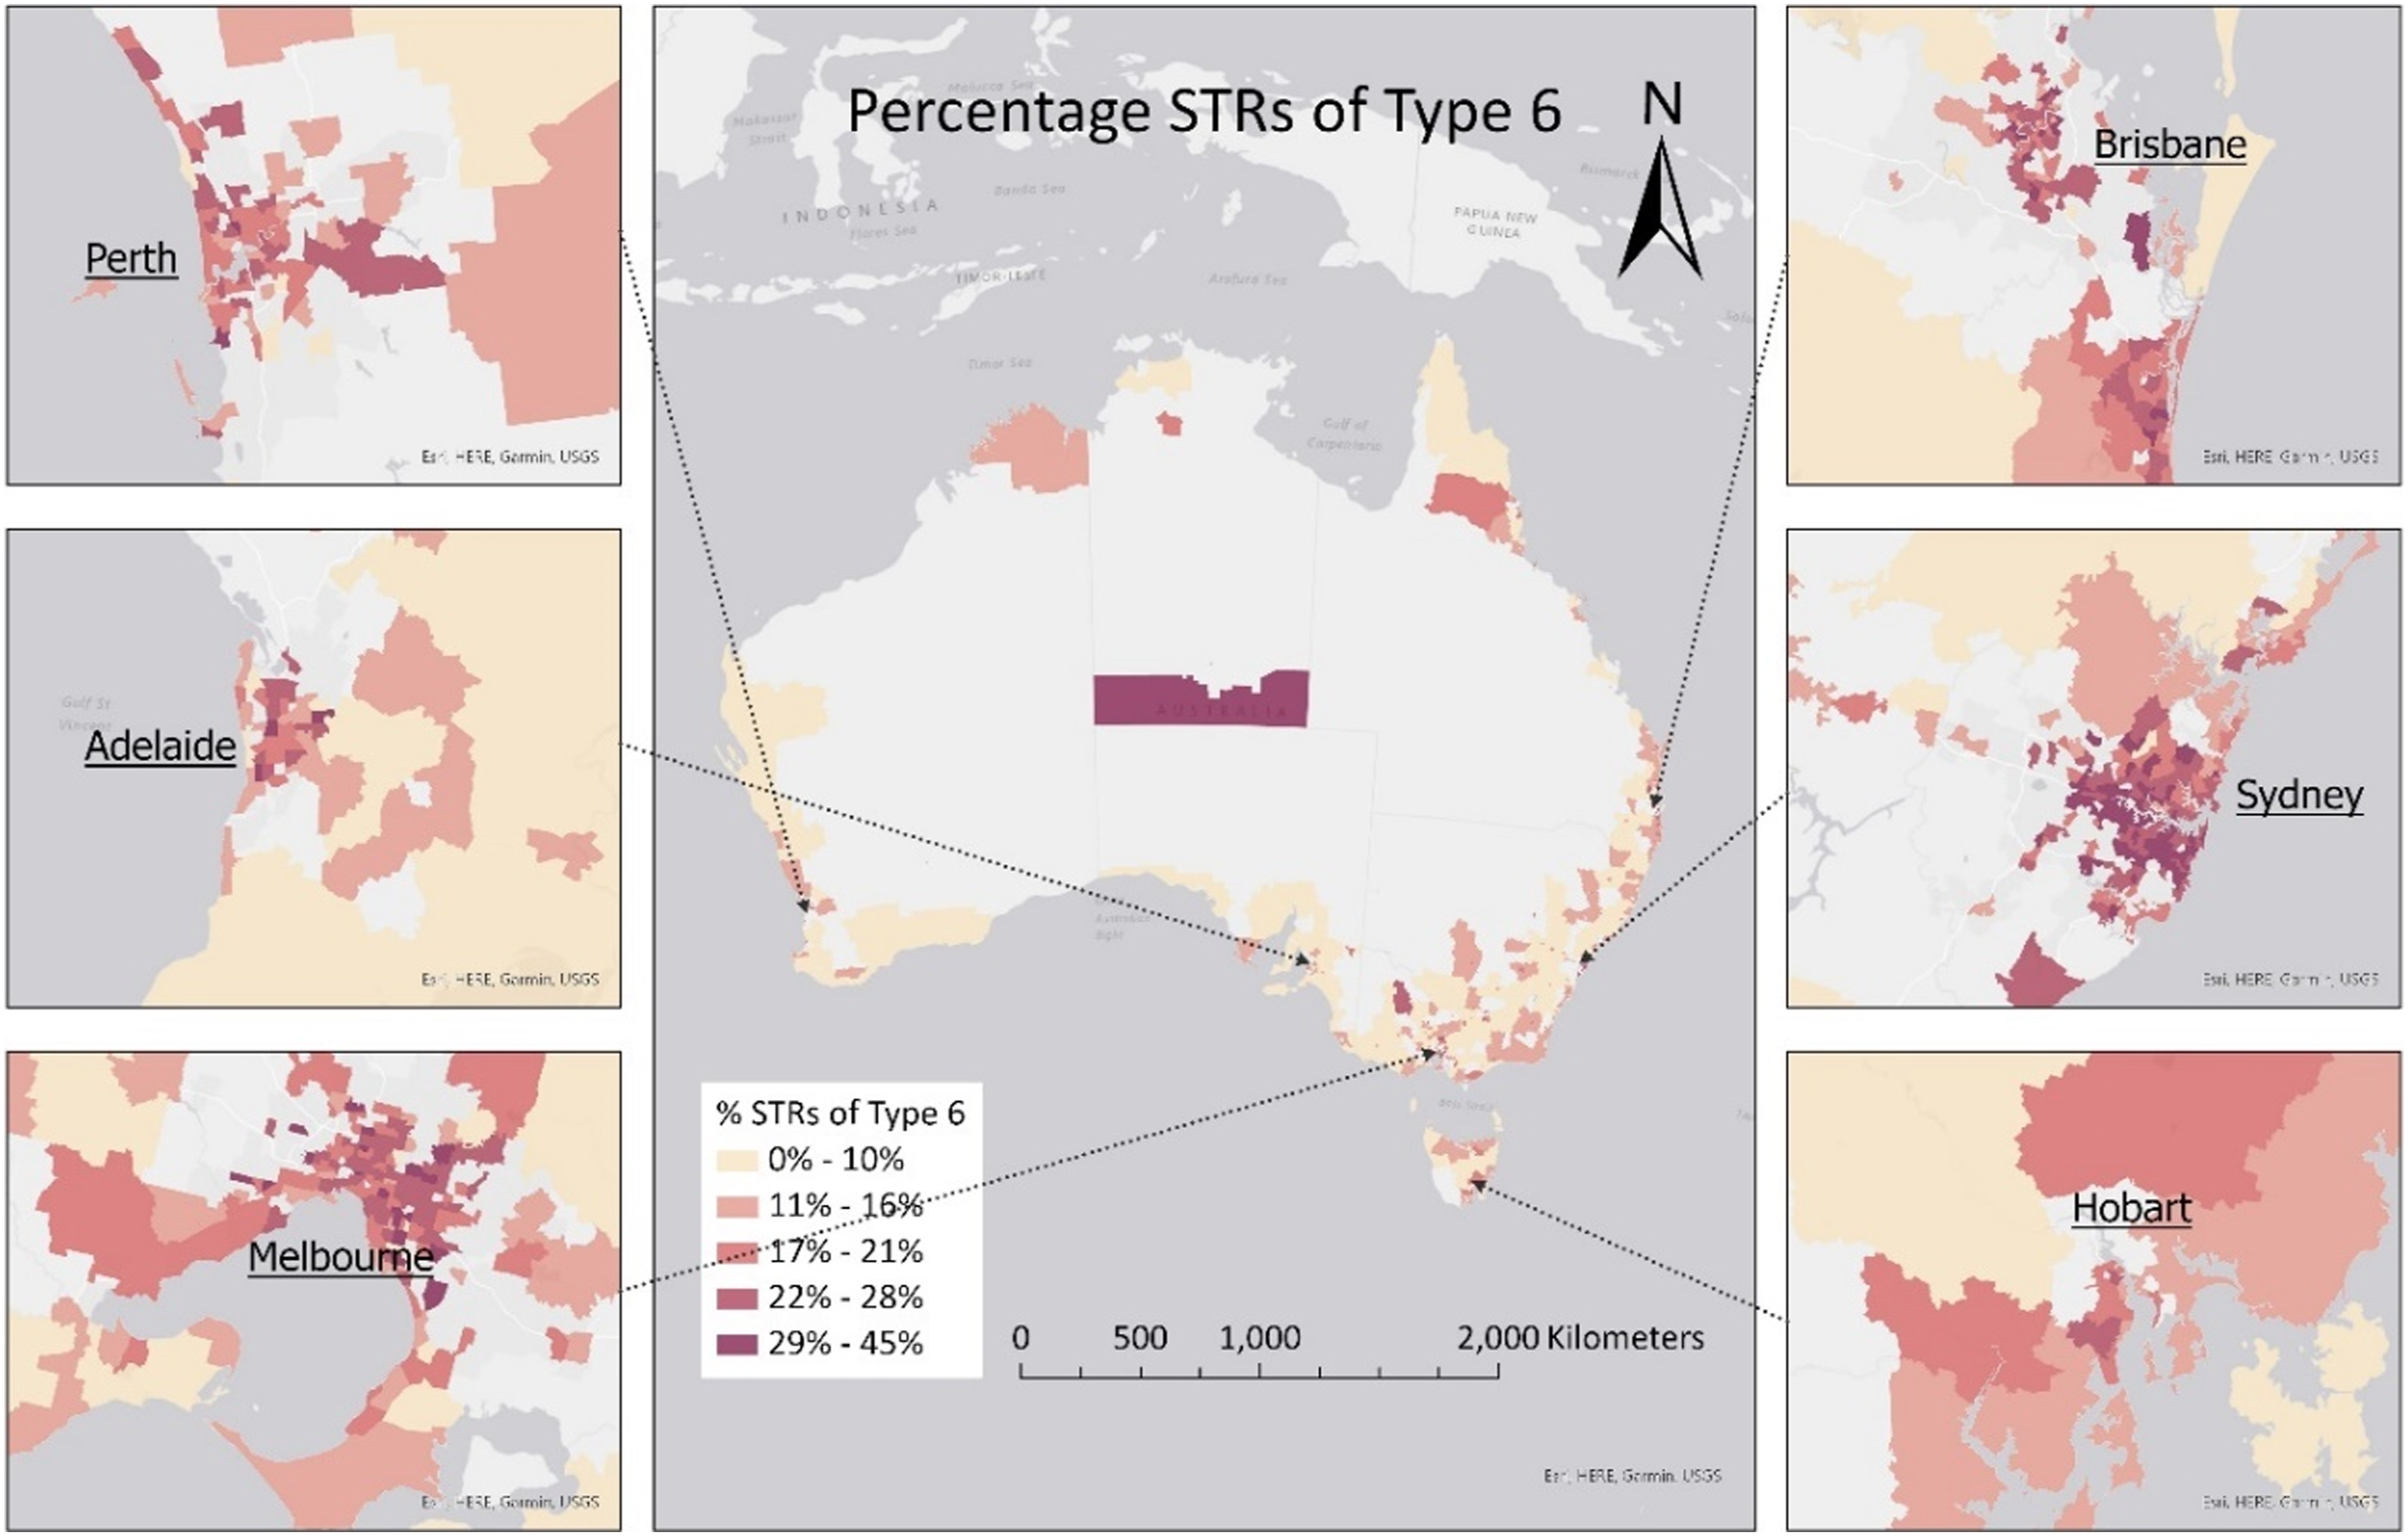
Two themes emerge from the geographic patterns. First, the diving STR types tend to be concentrated in densely populated capital cities and traditional coastal tourist destinations. In contrast, the thriving STR types appear in the less populous coastal and/or inland regions and peri-urban suburbs. Second, many suburbs can have both the thriving and diving types of STRs, such as Uluru and the Gold Coast, suggesting that geographic location, although critical, is not the sole factor that influences STR submarket dynamics.
STR characteristics
The six STR types differ not only in temporal dynamics and geographic distribution but also in type-specific operational and hedonic characteristics. In particular, the accelerating STR professionalisation associated with multi-property corporate-type hosts, standardised operation and amenity-rich properties is documented in the literature (Cocola-Gant et al., 2021; Zou et al., 2024). To better narrate each STR type into a taxonomy, we compare type-wise summary statistics and run six type-wise binomial logistic regressions at the individual property level – both help contextualise the significant operational, hedonic and geographical characteristics of a distinct type. Due to the article length, type-wise summary statistics and regression results are included in Supplementary Materials (Tables S1 and S2) to inform readers who wish to further examine the statistical and modelling details.
Taxonomy of six STR types.
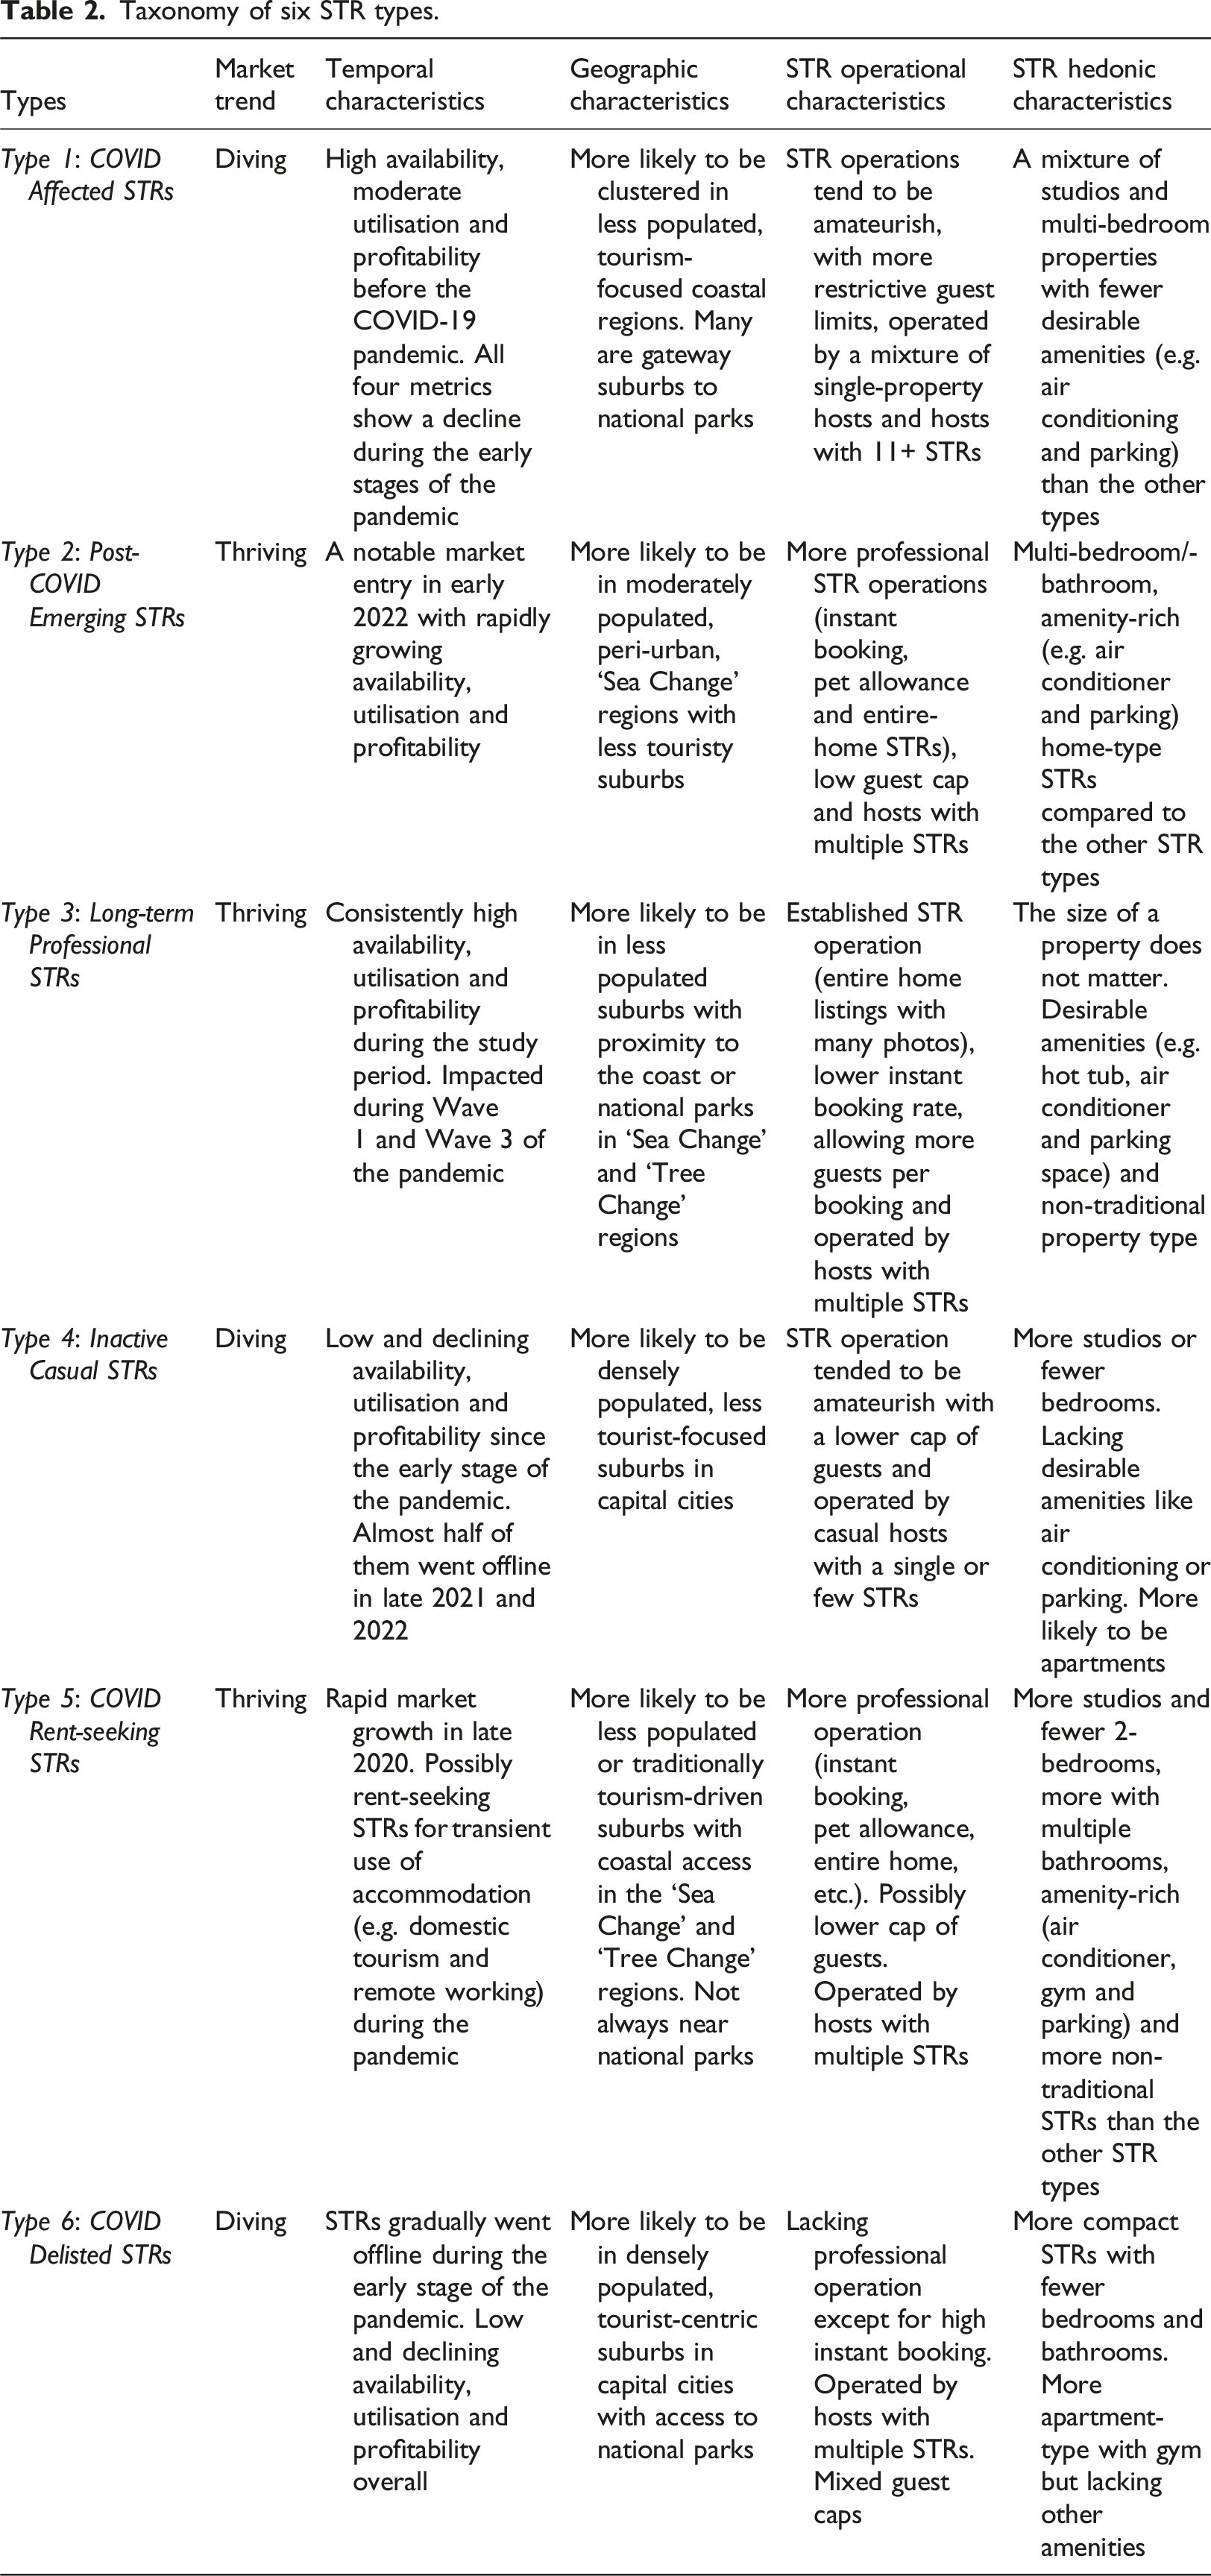
In terms of STR hedonic characteristics, we consider property size (bedrooms and bathrooms), property type (apartment, house or others) and amenities (swimming pool, hot tub, air conditioner, gym access and parking space). While each hedonic characteristic has a heterogeneous association with STR types, professionalised properties (entire-home, amenity-rich, spacious STRs) tend to thrive as opposed to the diving, amateurish STRs (amenity-sparse, shared-room, smaller-sized) (Table 2, Column 6).
Lastly, we explore suburb-level characteristics, such as the percentage of employment in tourism-related industries (including food and accommodation services, arts and recreation services and retail) and the percentage of land categorised as a national park, alongside tourism region classification for six types. Due to the lack of active STR listings in ‘Outback’ regions, we compare STRs of each type within ‘Sea Change’ and ‘Tree Change’ regions against the referencing ‘Capital Cities’ group. As expected, statistical findings (Table 2, Column 4) generally agree with the visual findings presented in the previous section. We also identify each type’s top 10 tourism regions included in Supplementary Materials, Table S3.
With detailed characterisation from the temporal, geographic, operational and hedonic dimensions, we formulate a taxonomy of the six STR types in Table 2. Types 1–6 are framed as ‘COVID Affected STRs’, ‘Post-COVID Emerging STRs’, ‘Long-term Professional STRs’, ‘Inactive Casual STRs’, ‘COVID Rent-seeking STRs’ and ‘COVID Delisted STRs’, respectively. This taxonomy reflects the differentiation between diving and thriving types, as well as distinct geographic, operational and hedonic features embedded in each type.
Discussion
Short-term rentals have fundamentally reshaped the temporary accommodation landscape, enabling new modalities using platform-mediated technology and emerging markets towards peripheral regions (e.g. Domènech and Zoğal, 2020) away from city centres typically characterised by mainstream hotels. Agility is a key feature of STRs, with entrepreneurial hosts alertly reacting to changing demand through both pricing adjustment and listing/delisting properties. STR can also be transformed into permanently occupied private dwellings (and vice versa – the so-called ‘circuit switching’) reflecting on a host’s personal or professional circumstances and broader property market and macroeconomic changes.
To understand how STRs evolve over space and time, we adopt a spatiotemporal perspective, drawing upon a ‘natural experiment’ in which the COVID-19 pandemic posed severe disruptions to human mobility and tourism accommodation in Australia between 2019 and 2022. The results of this paper demonstrate distinct STR submarket dynamics in relation to these disruptions: Some properties gradually withdrew from the market, while others took advantage of new economic opportunities in the meantime. Behind the rise of new STR geographies and the fall of traditional ones, an increasingly professionalised host class arises whose spatial and operational strategies adapt to changing market conditions. Specifically, we identify and characterise three ‘thriving’ STR types conforming to this, including Post-COVID Emerging STRs (Type 2), Long-term Professional STRs (Type 3) and COVID Rent-seeking STRs (Type 5).
Two primary findings underpin our taxonomy of the six STR types. First, geographical attributes were paramount, demonstrating that innovative host strategies considering multiple dimensions of the local STR market were most successful in adapting to large-scale external shocks. Through the pandemic, peri-urban locations largely supplanted the traditional central cities or longstanding tourism destinations, contrasting with a pre-pandemic global trend towards the geographical centralisation of STR businesses (Tornberg, 2022). As the pandemic shifted visitation away from traditional geographies, properties located in high-amenity peri-urban regions within driving distance of major cities fared better than core urban markets. Locational attributes can be a boon when tourism is strong but may lead to increased vulnerability when tourism demand is vulnerable against unforeseen risks, such as public health emergencies, natural disasters or severe economic recessions.
Second, STR accommodation supply has become increasingly characterised by professional hosting. The thriving STR types significantly lean towards entire-home operation, multi-property and standardised management and multi-bedroom/bathroom properties enriched by desirable amenities like air-conditioning and parking space. These are demonstrated by type-wise summary statistics and multivariate regression results. Professionals are better equipped to act swiftly to changing market needs than amateur hosts (Fan et al., 2023; Sigler et al., 2024). The trend of host professionalisation points to the STR industry’s maturation, which was significantly accelerated during the COVID-19 pandemic. It resonates with the principles and processes described in the classic entrepreneurship literature.
What does this mean for our understanding of STRs in Australia and other parts of the world? To start with, we should adopt a spatiotemporal perspective on STR market dynamics. In contrast to commercial hotel accommodation, there is considerable temporal and spatial fluctuation in the STR market during external events. Spatially, capturing the emergence of new destinations and flagging the disappearance of old destinations are the first steps toward addressing the broader economic impacts of the STR sector on a region’s tourism industry and housing market. Furthermore, acknowledging and analysing nuanced submarket trends concurrently affecting each region would help industry professionals and policymakers understand the complexity of STRs as a mature product. Critically, the interplay between shifting demand for STR in peri-urban locations facilitated by remote-working arrangements and strong domestic regional tourism and Australia’s regional housing markets boomed by strong interstate migration and delays in property production requires carefully orchestrated policies in light of the escalating tension between the pro-business and pro-regulation camps on STR. The insights into STR submarkets can help tailor policies and measures towards addressing each submarket for optimal outcomes that balance priorities between economic development and housing affordability.
There are some limitations associated with the current study. First is the modelling limitation inherent in the type-wise multivariate analyses. Although a rich panel of STR operational and hedonic features are incorporated, these models do not always yield consistent results that clearly distinguish different types. Second, the types derived from the current study, although representing a variety of STR submarkets, may only partially uncover diverse STR market dynamics worldwide, notably those markets that have implemented significant regulatory measures on STR. Third, although our analyses point to the underlying mechanisms (e.g. entrepreneurial alertness and imperfect market conditions) that could drive the STR market segmentation, the intention of the research is not to prove the causality of such potential mechanisms producing STR submarkets.
Several opportunities for further research arise from the current study, particularly in deepening our understanding of host behaviours and how visitor fluctuation and pricing impact property availability. Further research might also seek to track individual properties over time, with a view to understanding which factors affect ‘switching’ between long-term and short-term rental markets. In addition, further investigation into STR characteristics and regional distribution of each type is critical to disentangling complex submarket dynamics – after all, each submarket has its uniqueness. We recognise that building a taxonomy is merely an important starting point, instead of an endpoint, to answer questions about the short-term rental market dynamics. The shift toward professionalisation and longer-term stays suggests a convergence with long-term rentals – a trend that may be reciprocated through the ‘platforming’ of other types of property rentals and other transactions, including property sales.
Conclusion
STRs are neither homogeneous nor monolithic. Instead, submarkets stratify properties by their attributes, geographies and host behaviours. This study identified six types as ‘thriving’ or ‘diving’ across 3.5 years during the COVID-19 pandemic. We find that distinct strategies tied to operational, hedonic and geographical features underpin the viability of short-term properties, with considerable differentiation between urban, regional and rural, as well as between professional and amateur hosting strategies. Our results suggest trends toward further professionalisation of ‘thriving’ STR listings, the characteristics of which are constantly shifting in response to diverse visitor markets. STR host strategy will need to continue to be adaptive in the wake of increased regulation, novel digital management platforms and optimisation technologies. The fact that professionally managed STRs are more likely to cope with dynamic market pressures demonstrates the sector’s continuing innovation to navigate changing market conditions.
Our results also offer a rich empirical case study as evidence for scholars and policymakers seeking to ensure that STRs fit comfortably alongside conventional rental arrangements, particularly in places with timely public debates. Such debates have intensified as global tourism rebounds out of the shadow of the pandemic. The results show a maturation of STRs beyond the sharing economy into a submarket that behaves parallel to the hotel and residential markets. Methodologically, sequence clustering methods have been broadly utilised in demographic and social science research for their data-driven nature and strong visual capacity. This paper expands its application scenarios in (STR) market segmentation studies, which can be redeployed to other national and subnational contexts, as well as other spatiotemporally varying study objects, such as land-use transitions.
Supplemental Material
Supplemental Material - Diving or thriving? How COVID-19 reshaped Australian short-term rental submarkets
Supplemental Material for Diving or thriving? How COVID-19 reshaped Australian short-term rental submarkets by Zhenpeng (Frank) Zou, Thomas Sigler, Elin Charles-Edwards and Jonathan Corcoran in Environment and Planning B: Urban Analytics and City Science.
Footnotes
Declaration of conflicting interests
The author(s) declared no potential conflicts of interest with respect to the research, authorship, and/or publication of this article.
Funding
The author(s) disclosed receipt of the following financial support for the research, authorship, and/or publication of this article: This work was supported by an Australian Research Council Discovery Project (Grant number DP200100506).
Data availability statement
The datasets generated during and/or analysed during the current study are not publicly available due to the commercial nature of disaggregated short-term rental booking records, but geographically and temporally aggregated data are available from the corresponding author on reasonable request.
Supplemental Material
Supplemental Material for this article is available online.
Notes
References
Supplementary Material
Please find the following supplemental material available below.
For Open Access articles published under a Creative Commons License, all supplemental material carries the same license as the article it is associated with.
For non-Open Access articles published, all supplemental material carries a non-exclusive license, and permission requests for re-use of supplemental material or any part of supplemental material shall be sent directly to the copyright owner as specified in the copyright notice associated with the article.