
Abstract
Recognition for the importance of the night-time economy (NTE) in cities is mounting in both academia and policy. Yet, much of this discourse is centred on the consumption side of the NTE. Analytical and policy insights into the role of those who work to keep our cities ticking 24/7 and the NTE flourishing is still severely limited. Just how many people work at night? And how can we count them? Current assessments, where at all present, often diverge drastically, whilst cities and countries step up more and more policy efforts to grow the NTE. We present here a case study, centred on the task of assessing the Australian night-time economy’s workforce, to underscore continuing challenges in accounting for night shift workers. We underline how counting night shift workers provides for a more effective evidence base for urban policy. We demonstrate both definitional difficulties and data limitations, arguing for the pressing need for more precise urban science of the night, and of the NTE specifically, as a precondition to stepping up our engagement with night shift workers, in order to account for them in policymaking.
A critical urban workforce, hidden in the shadows
The night-time economy (NTE) is often a sizeable component of how cities the world over function. It regularly accounts for millions of US dollars in revenue and is more and more in the headlines. Local governments far and wide, from Adelaide to London, to Hong Kong and Montreal, to name but a few, have progressively embraced it as a key urban policy issue (Seijas and Gelders, 2021). Yet, how many people work at night in cities? This apparently simple question hides deep complexities in accounting for night shift workers in our cities and depicting their conditions across diverse urban settlements and countries. This is a growingly timely issue to tackle for anyone working in urban analytics and urban policy alike, not just night-time enthusiasts. Over the past decade, a mounting recognition of the importance of the NTE has been on the rise in cities worldwide (Gwiazdzinski et al., 2018) and in urban studies scholarship more specifically (Acuto, 2019). Geographers, planners, and anthropologists, amongst others, have busily gone hand-in-hand with a proactive international community of night advocates to push for greater attention in academia, policy and general public attention toward the activities that take place in cities after dark. While much of this has centred around making the case for why the NTE matters, and then on deepening our nuanced understanding of the nocturnal challenges and opportunities of cities, recent years have also seen a mounting push to better include in these narratives (and policies) the experiences of night shift workers. Characterised by precarity, inequalities and troubling well-being challenges (Duskova and Duijzings, 2022), the geographies, and sociologies of night work (Shaw, 2022) are now the object of several poignant investigations (MacQuaries, 2023) advocating explicitly for action on this front across diverse realities. This is not just a matter for a specific research or policy niche. Night work is a critical component, for instance, of the proliferation of platform urbanism in cities worldwide. So, how can we better attend to the conditions of night workers and take practical actions to ameliorate their positioning in urban economies and governance? We argue here that one of the fundamental steps urban studies can take is that of better accounting for night workers. We speak of accounting, rather than just counting, to stress the fundamental social justice issue at play here, including the experiences and voices of night shift workers in the proliferation of NTE policies and in the analysis of urban economies more generally. We stress this is as much a matter of counting them in statistical, economic and policy documentation in cities, as it is one of accounting for them with an explicitly normative intent to better open opportunities for voicing their ‘right to the night’ (Acuto et al., 2021). To chart a pathway forward in this action research agenda, we turn to a familiar context for us, that of Australia, which in turn offers not only a useful case of preliminary efforts towards assessing night-time workforces but also highlights some of the key limitations many other contexts confront when attempting to do so.
The workers behind the (Australian) nights
Australia has certainly not been immune to the popularity of the NTE in cities, offering a fertile ground for this inquiry. This success of night-time discourses in Australian cities has gone hand in hand with advertising night-time economies far and wide in both major capitals but also regional centres and suburban authorities. Likewise, greater attention to the formalisation of NTE governance and distinct moves that further enhance how cities and regional hubs tackle what happens after dark have taken place around the nation. Many examples of NTE governance initiatives can be found within local government. These have been efforts like the City of Melbourne’s Night Time Economy Advisory Committee, the City of Sydney’s Open Sydney agenda, Parramatta’s Night City Framework and Canterbury Bankstown’s Night Time Economy Action Plan, to name a few. While examples of the initiation and development of NTE and 24-h economy agendas in Australia are most found within local government organisations, there are exceptions to this. As noted above, in 2020, the New South Wales State Government launched its 24-Hour Economy Strategy for Sydney, and in 2021, announced the appointment of a 24-Hour Economy Commissioner, now flanked by the world’s first Minister for the Night Time Economy, with the of the 24-Hour Economy Commissioner slated to become a statutory entity in itself (New South Wales Government, 2023). Industry lobby groups such as the Night Time Industries Association in New South Wales have also played a part in this emerging agenda.
Despite this rise in interest in better managing Australian cities after dark, we find that there is limited availability of data depicting the temporal characteristics of the Australian economy and labour market. This is no small methodological challenge. Defining the boundaries of night work and the NTE involves grappling with what qualifies as ‘work’ and ‘night’. In many instances, this has focused on the 6 pm to 6 am half-day, as in the UK, or on the so-called ‘other 9-to-5’ (e.g. Dentel-Post et al., 2017) as in the USA. As a now well-known study by design consultancy Arup from 2015 put it, there are many ‘shades of night’, that are often very much dependent on cultural frames (Lam et al., 2015). At the same time, we need to factor in how to account for the varied labour activities, accounting potentially for formality informality, and complex schedules of night shift workers. The concept of night work can range from informal or intermittent tasks, such as an academic answering emails at 8 pm, to more traditional, structured roles like a nightclub bouncer working at 3 am. Furthermore, analysis of the NTE often focuses on leisure and consumption-based industries like entertainment, hospitality, and nightlife, overlooking broader nightwork sectors like healthcare, logistics, and transport. To this end, our investigation aims to unpack not only the complex definitional issue at stake here but also how to grapple with that methodologically. These problems are not just of a statistical and academic nature but an essential challenge in recognising the size, importance and contribution that night workers have to our cities and the country’s economy. Ultimately, better assessing how many work at night and in what conditions can pave the way for engaging more effectively with night workers, understanding their importance, and crucially giving them a better voice in the future of Australian cities.
The article reviews several possible sources of information and variations on the definition of the NTE and night work. We start from the Council of Capital City Lord Mayors’ longitudinal datasets and reports on the ‘core’ NTE (food, drink, entertainment, and leisure activities) and then survey a series of five possibly additional datasets. Here, variations on the definition and accounting methods give us interesting findings not just on the workforce size but also on who is counted and who is not, opening up contingent mixes of definitional and social justice questions. In doing so, we aim to offer some glimpses into the scale and composition of night work. Nonetheless, challenges in definitions, sample sizes, and cadence hinder a comprehensive exploration of night work metrics and definitions. Our investigation underscores the need for, and lack of, consistent sub-national/granular, up-to-date data to inform evidence-based policies to support the people who underpin Australia’s NTE. It also stresses that most of the focus of accounting done to date has been centred on that presumed ‘core’ of the NTE (like entertainment and hospitality), and we argue there is a need to better include the contributions of care, services, transport, logistics, cleaning, and other workers, ahead of then also reaching out into informal economies and non-economic definitions of night work. For instance, as we demonstrate below with quite some degree of confidence, we argue that upwards of a million people could be conservatively counted as night workers in Australia – approximately one in nine working Australians. However, we note below that the overall number of night workers is probably much bigger. Put it simply, the analysis and discussion presented in this paper is but an initial step in what we argue is an urgent direction for scholars and policymakers.
This effort goes hand in hand, in our view, with a wider international proliferation of night-time policies (Cibin, 2021; Garcia-Ruiz et al., 2023) as well as night mayors, night czars, or similar positions (Homan, 2024), and establishing consultative groups of key night-time stakeholders to identify, discuss, and manage challenges and opportunities (Acuto et al., 2024). Significantly, this movement has progressively broadened the cast of sectors and issues attended to when speaking of the ‘night’ in cities. Opportunities to better recognise the contributions of night workers and the conditions these operate in to sustain this expanding variety of nocturnal sectors have been a growing leitmotif of more recent urban studies calls (Tomasella, 2024). This has gone in parallel to calls to deliver a much more interdisciplinary and experimental form of urban science of the night (Acuto 2019; Shaw 2018) to account for fuller pictures of what happens after dark. We take up these trends jointly with a specific normative purpose of deploying better urban analytics toward more inclusive urban policymaking.
Our specific case study of Australia is a poignant example of the potential to do so. Given the proliferation of government agendas to support and grow economic activity at night in Australian cities, it is important to measure NTE activity and to understand how this is perhaps changing to inform evidence-based government policies. With planning, governing, advertising, and promoting, come measuring and assessing. Amidst this busy flurry of lobbying, governing, reforming, and planning on the NTE across the country, measurement of the NTE and assessment of trends, geographies, and economic returns the NTE brings to Australian cities has become increasingly on the cards. To appropriately support those keeping our society and urban centres running at night in Australia, policymakers and other governance stakeholders need to understand such things as how many people are working at night, where they are located, their work, their working conditions and demographic composition. Night work encompasses various roles conducted by people from several demographic backgrounds. Research from the United States and the United Kingdom, has already underscored how a sizeable number of people who work at night are poorly paid, casualised and carried out by marginalised groups (Hamermesh, 2019; Kolioulis et al., 2021; Shaw, 2018, 2022). Moreover, well-established medical and public health research has also shown across a multitude of countries, Australia included, that night work can be detrimental to workers’ mental and physical health (Books et al., 2020; Ganesan et al., 2019; Huggins et al., 2022; Torquati et al., 2019). Notwithstanding the provision of modest supplementary compensation for eligible night workers in the form of so-called ‘penalty rates’ (a higher rate of salary, paid to Australian employees for working unsocial hours or days), it has been acknowledged that the health-related costs associated with night work are ‘unlikely to be factored into freely negotiated wages’ due to the unequal distribution of market power between employers and employees (Productivity Commission, 2015: 404). Knowledge of where activity is taking place, at what time, and by whom will enable (in our case, Australian) policies and cities to be developed, planned, and shaped to cater for those night workers who underpin the development of our night-time and 24-h economies. Without this information, academics and policymakers are effectively working in the dark.
Measuring those at the ‘core’ of the NTE
For most Australians, the night is a time outside of the usual ‘9-to-5’ that allows for socialising, dining, leisure and entertainment activities, exercising, relaxing and sleeping. The consumer-facing ‘going out economy’ or ‘core’ NTE has been the focus of NTE agendas and measurements in Australia for almost two decades in some cases like Sydney and Melbourne. For at least 10 years, analysis commissioned by the Council of Capital City Lord Mayors (CCCLM), which represents Australia’s eight capitals but also often convenes major regional hubs, has been the primary data source used by Australian local governments to benchmark the number of people employed in the NTE. Some of us has been intimately involved in developing this data and closely engaged with CCCLM, capitals and regional sites in implementing some of its implications. This could provide an initial vantage point on the question of ‘counting’ workers and linking that analytical exercise to practical implementation. The analysis for this CCCLM work uses a methodology initially developed around 15 years ago by economic consultancy Trends Business Research (TBR) in the United Kingdom. Having been developed in the Global North, this methodology prioritises leisure and consumption activities and has the potential to bring biases that could overlook the unique aspects of night work in other global contexts. Back then, TBR used granular Dun & Bradstreet credit agency business data to identify those industries most likely to operate at night and mapped this analysis to the Australian and New Zealand Standard Industrial Classification (ANZSIC) system. Since 2017, this data has been prepared by Australian-based consultancy Ingenium Research (one of us is a director), using the original methodology. The research uses Australian Bureau of Statistics data to estimate the number of people who work within the industries that belong to the core NTE, non-core NTE, and supply NTE sectors (Edwards et al., 2024). A key limitation of this data is that the Australian Bureau of Statistics labour force data does not differentiate between people who work during the day and those who work at night. As a result, all employees in industries deemed to have a higher propensity to operate at night are captured. A similar approach has been adopted in the United Kingdom by the Office for National Statistics (ONS), in collaboration with the Greater London Authority. The ONS methodology identifies industries with a high proportion of night workers using data from an annual Labour Force Survey question that asks respondents whether they work during the evening or night. Industries are classified as night-time if they have a higher-than-average proportion of night-time workers and a sample size of at least 30, based on pre-pandemic data from 2019. The total number of employees in these industries is then presented as night-time workers employed in night-time industries (night-time cultural and leisure activities, activities that support night-time cultural and leisure activities, 24-h health and personal social services, and activities which support wider social and economic activities) regardless of whether they work at night or not (Office for National Statistics, 2023).
Critically, the Australian ‘core NTE’ is defined as economic activity occurring at establishments that provide services to leisure users – mainly between 6 pm and 6 am. The core NTE is split into Drink, Leisure & Entertainment, and Food sub-sectors and then further subdivided by specific activity types. To this end, non-core sectors include public and private transport, hotels and other accommodation, retail services, policing, health, parking, and lighting, whilst ‘supply’ NTE establishments tend to operate during the day but are part of the Core NTE supply chain.
This is no major city story either. The data for this study is prepared for 88 urban centres across Australia, although the annual report presents the findings for 12 Australian cities (including the eight capitals) and incorporates contextual policy insights from the cities themselves. While ‘non-core’ (economic activity that supports the core NTE) and ‘supply’ (the NTE’s economic supply chain) data has been analysed and provided regularly to the capital city councils for the past decade, with increasing degrees of sophistication, the primary focus of the Australian NTE annual report published by CCCLM is the core NTE (economic activity at establishments serving leisure users, mainly between 6 pm and 6 am). In 2023, however, retail and accommodation (which are classified as non-core industries) were added to the report – a reflection of the appreciation of the desire to account for the growing diversity of consumer-facing night-time activities and the range of people participating in the NTE in Australian cities.
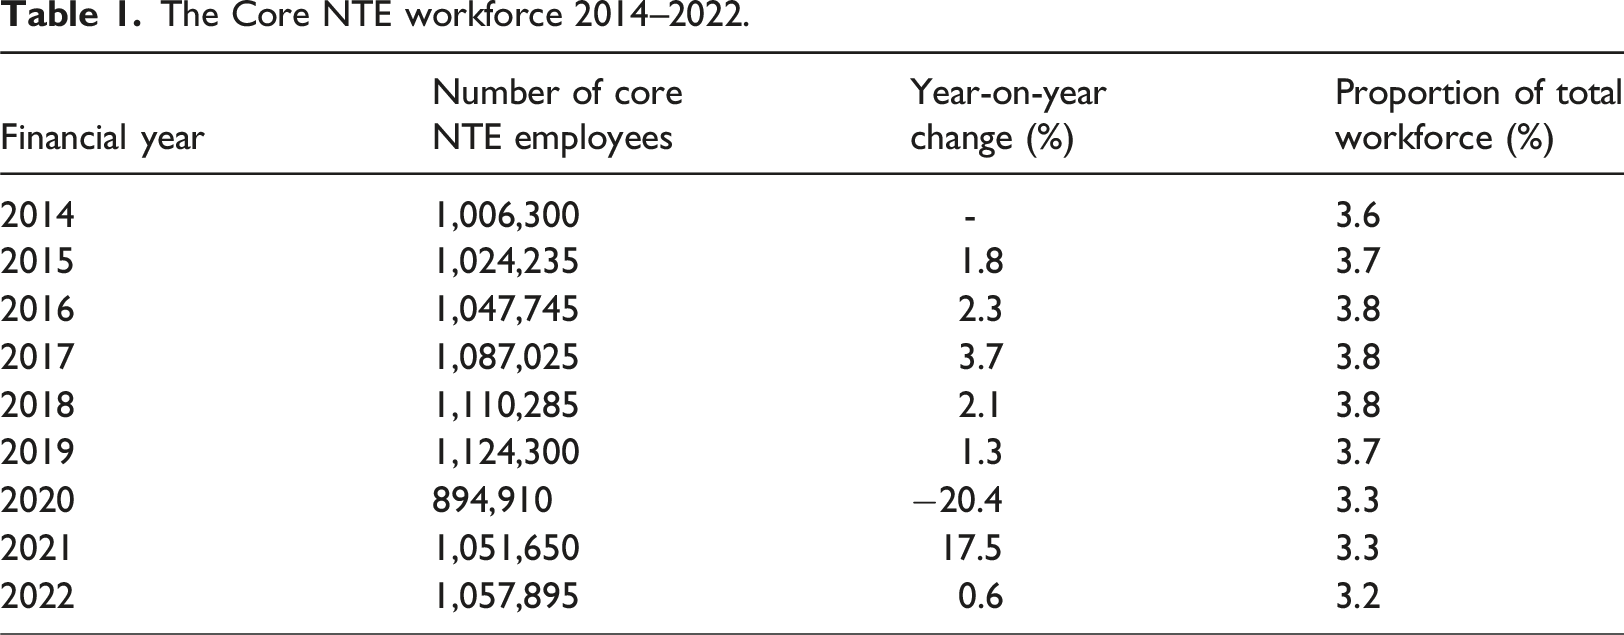
So, what do we learn from this statistical exercise? The 2023 CCCLM report shows that across the whole of Australia, 1.06 million people worked in the core NTE in 2021/22. Most of this employment was classified as belonging to the food (restaurants, cafes, and takeaways) sub-sector (65%), followed by leisure and entertainment (23%) and drink (12%). Notably, the core NTE has been growing faster than the overall Australian economy. Between the 2008/09 and 2021/22 financial years, the value of the Australian core NTE increased by 62% (33% of this is due to inflation). During the same period, the number of core NTE businesses grew by 47%, and the number of people employed at these businesses increased by 14% (Bevan et al., 2013; Edwards et al., 2024). While the number of employees in the core NTE has not grown at the same rate as the number of establishments and sales turnover, the Australian Bureau of Statistics’ Labour Force Survey data shows that employment in this sector has been growing at a faster rate than the overall economy over the past four decades. In February 1985, there were 324,000 Australians employed in the Accommodation and Food Services sector, representing 5% of all employed persons, rising to 928,100 in February 2020 (7% of all employed persons), at the commencement of the COVID-19 pandemic (Australian Bureau of Statistics, 2022).
The Core NTE workforce 2014–2022.
Summary of the six data options.
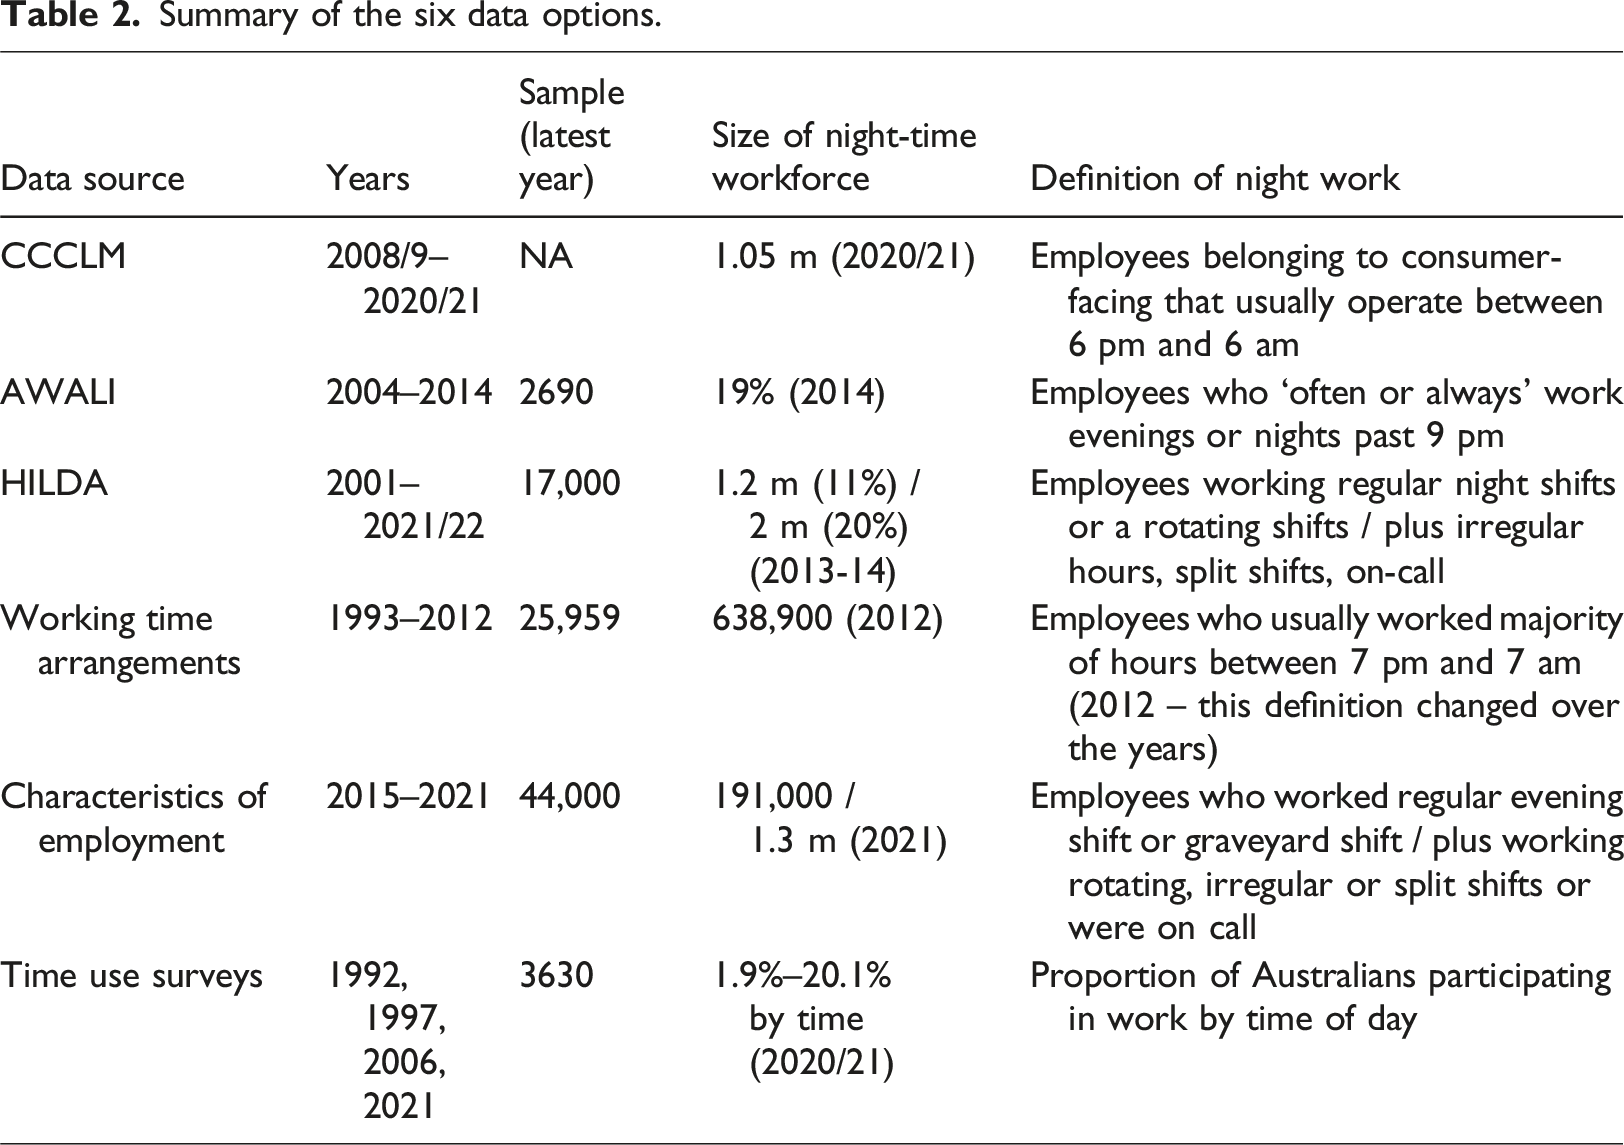
Alternative accounting of night work: Five different insights
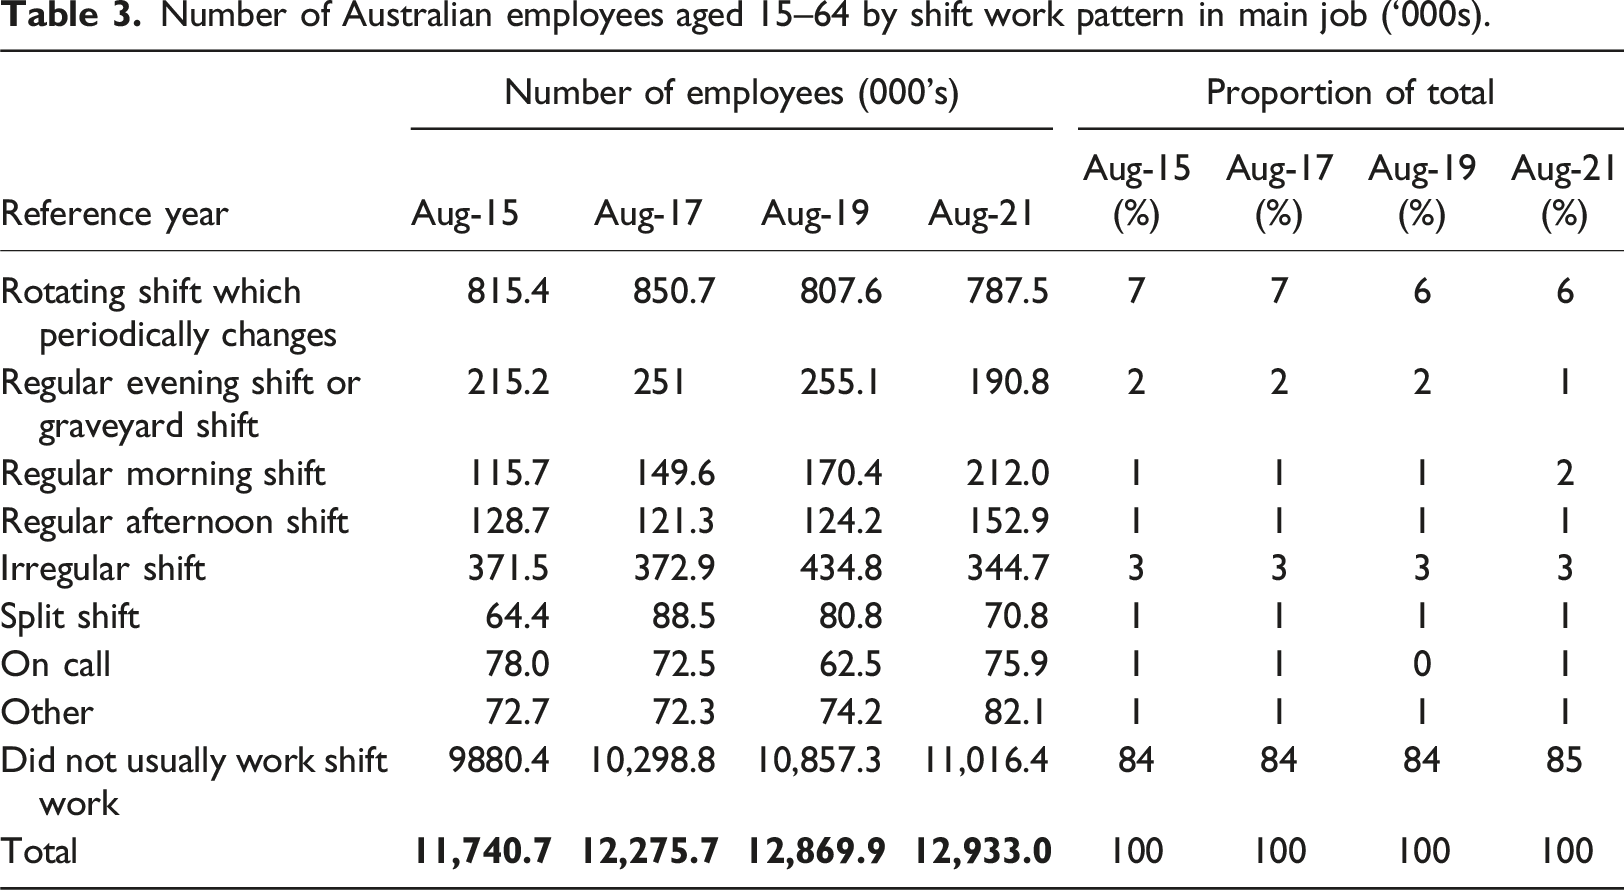
Number of Australian employees aged 15–64 by shift work pattern in main job (‘000s).
First, the Australian Work and Life Index (AWALI) is a national Australian annual survey administered by the University of South Australia’s Centre for Work + Life. The survey collected information about Australians’ current employment, assessed respondents’ perceptions of work–life balance between 2004 and 2014, and included a question about night work (Skinner and Pocock, 2014: 8). The data classifies evenings as after 9 pm and works because those who replied ‘sometimes’, ‘rarely,’ or ‘never’ to working at this time were classified as not working during that time. Analysis of the survey data by the Productivity Commission found that 19.1% per cent of Australian employees ‘often or always’ worked evenings or nights past 9 pm’ (Productivity Commission, 2015: 393).
Daly’s (2014: 8) analysis of the results of the AWALI survey found that people aged 35-44 were the most likely to work evenings (7.4% of this age group), and couples with children were most likely to work evenings (7.5%). Those on the highest end of the wage spectrum ($90k+) were most likely to say that they worked evenings only (6.7% of people earning $90k+) (p. 10). Skinner and Pocock (2014) used the same data and approach and found that 13% of Australians surveyed worked a combination of weekends and evenings, and 6% worked ‘exclusively on night/evening shifts’ (no weekends) (p. 27). Men (16% evenings and weekends /11% evenings, no weekends) were more likely to work during these time periods when compared to women (7%/5%) (p. 28). Their research showed that the frequency of ‘working a combination of weekends and nights, or just evenings/nights’ was associated with the highest ‘work-to-life interference’ (p. 3) – defined by the researchers as the ‘capacity to satisfactorily engage in the activities and responsibilities of other spheres of life’ and to have the ‘time available to spend on activities outside work’ (p. 8). Evening/night work was also found to be ‘associated with the greatest negative impact on women’s work-life outcomes - whether combined with weekend work or not’ (p. 3). Although this dataset offers valuable insights into nocturnal employment, it is outdated, given that the most recent survey was conducted in 2014. Another limitation is the survey’s sample size (2690 in 2014), hindering reliable analysis at a sub-national level.
In alternative to AWALI, we could leverage the Household, Income, and Labour Dynamics in Australia (HILDA) Survey to generate an overall stocktake of workers. HILDA is an annual longitudinal survey of around 17,000 Australians. One of the questions in the survey asks people to best describe their current work schedule. Analysis by the Productivity Commission found that in 2013–14 almost 1.2 million Australians were working either a regular night shift or a rotating shift, equating to 11% of all Australian employees (Productivity Commission, 2015: 393). The Productivity Commission estimated that this figure was likely to have been 2 million, or 20% of the workforce, if those working irregular hours, split shifts, and on-call work were also captured (although not all of those on these work patterns work nights). Additionally, regular evening shifts are not included in the above figures. Analysis of HILDA survey data has also indicated that night work is often casual. Healthcare, accommodation and food services and retail trade were found to have the greatest number of night workers – with each of these sectors having more than 200,000 night workers, according to 2009–2014 HILDA survey data (Productivity Commission, 2015: 393). Bittman (2016: 533) explains that the growth of employment in these industries (retail, hospitality, security, and healthcare) has led to ‘a higher proportion of employment that has spread beyond the usual working hours’. The limitation of this dataset is that the question about current work schedules forces respondents to select one answer from a list of eight different schedule types, some of which are ambiguous as to the time of day (e.g. ‘a split shift’, ‘on call’ and ‘irregular schedule’. As such, it is not possible to definitively say with certainty which respondents work at night.
Thirdly, we could turn to more classic central statistical tools for the country. The Australian Bureau of Statistics’ Working Time Arrangements survey might help. WTA was conducted every two to 3 years between 1993 and 2012, and asked questions about the time of day people worked. Unfortunately, from 2003 onwards, the survey questions were altered, meaning that the results are not comparable from this point onwards. Additionally, only high-level aggregated survey results were made publicly available. Originally, night work was captured in the survey as the majority of hours took place between 5 pm and 6 am. In 1993, 3.0% of Australia’s working population fell into this category, rising to 3.9% by 2003 – indicating growth in the number of people working at night. In 2006, the survey question was fundamentally changed, asking respondents whether they usually worked any hours between 7 pm and 7 am on a regular basis. More than 2.5 million people (29.9% of respondents) reported regularly working during these night-time hours. This is a very different metric to the 1993–2003 surveys, with the earlier surveys counting pure night shift workers and the 2006 survey encompassing a much broader group of people, including those who regularly finished work late or started work early. The 2009 Working Time Arrangements survey did not ask about night work and, in 2012, the Australian Bureau of Statistics changed the wording of the survey yet again, asking whether people worked the majority of hours between 7 pm and 7 am in all jobs (6.9%), bringing the survey more in line with the 1993–2003 iteration, although not entirely. This means that it is impossible to compare this metric to any of the earlier iterations of the survey, whilst the latest dataset was collected more than 12 years ago in 2012.
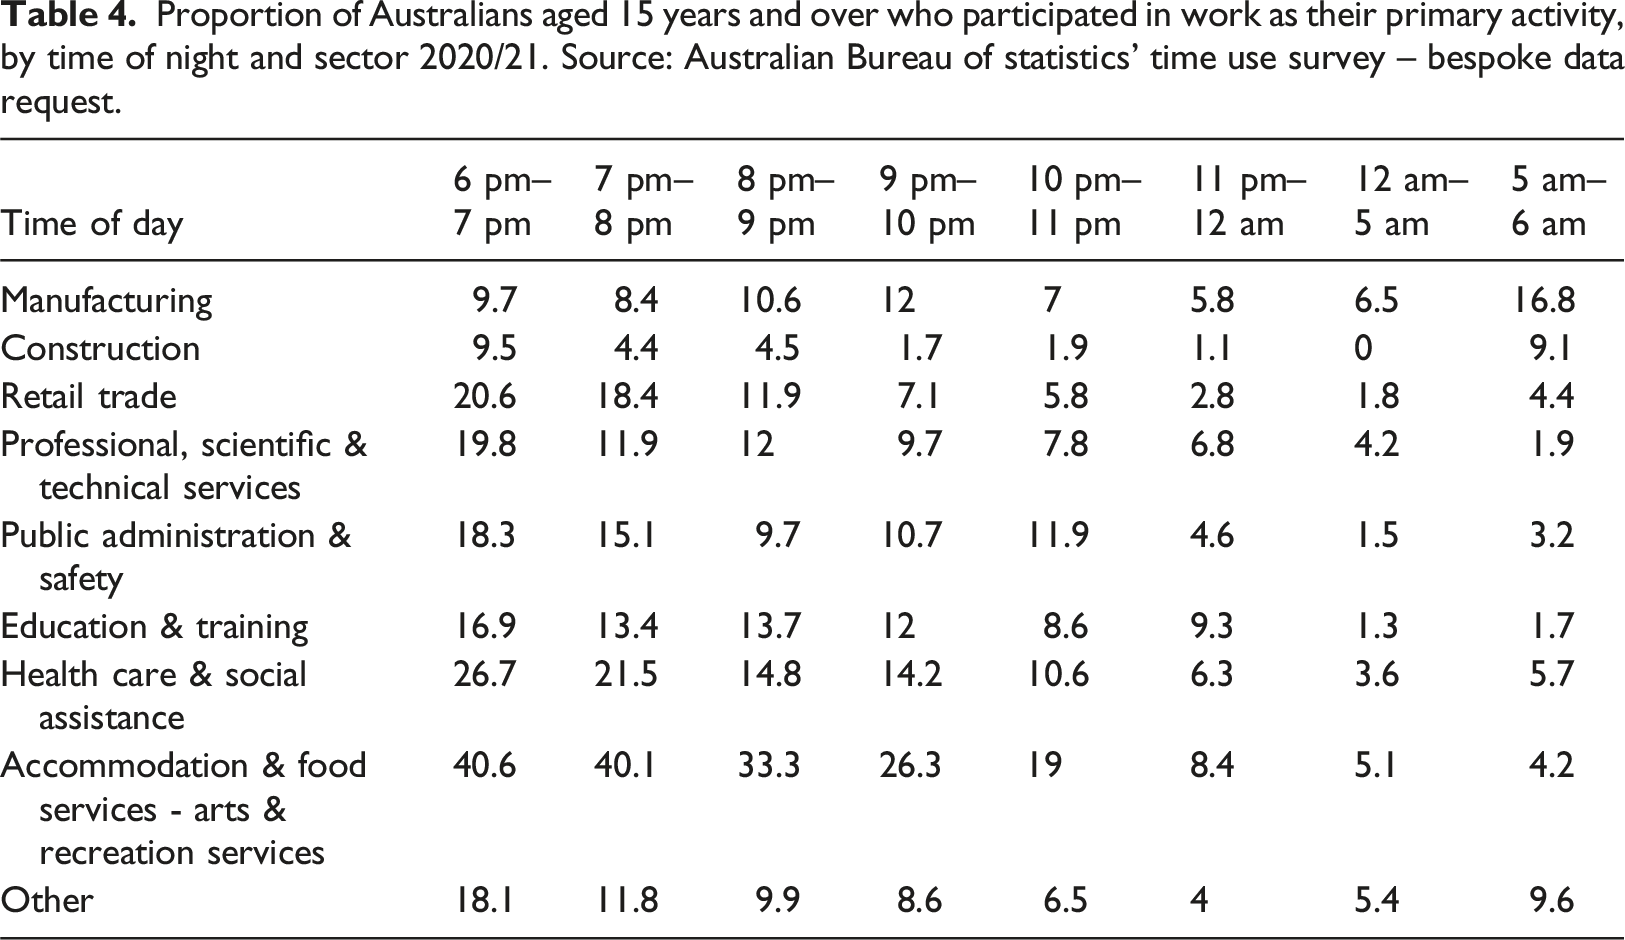
Proportion of Australians aged 15 years and over who participated in work as their primary activity, by time of night and sector 2020/21. Source: Australian Bureau of statistics’ time use survey – bespoke data request.
The number of people working a regular evening shift or graveyard shift fell from 255k in 2019 to 190k in 2021, likely due the COVID-19 pandemic. The data shows that just over 40% of people working regular evening shift or graveyard shifts were born overseas. The industries with the highest number of people working regular evening shift or graveyard shifts were health care and social assistance (22% of all evening/graveyard shift employees), and accommodation and food services (17%) but manufacturing (14%) and retail (12%) follow suit closely. A limitation of this dataset is its sample size. Despite the Characteristics of Employment survey having the largest sample size of all the survey-based data sources reviewed, detailed analysis for every industry or by small geographic area is considered too unreliable for general use. Additionally, the Characteristics of Employment survey, respondents are asked whether they ‘usually work any shift work’. Those who respond ‘yes’ are asked a follow-up question that forces them to select one of eight different shift work types (e.g. ‘on call’, ‘irregular shift, split shift’). The ambiguous temporal nature of most of these shift types means that it is impossible to account for every person who works at night (beyond the small proportion of people who stated that they work evening or graveyard shifts). This is a similar limitation to the HILDA survey.
A final option we currently have available in Australia in many ways similar to the data available in North America or the UK is that of time use. This is no novelty per se. In 1974, the Cities Commission sponsored Australia’s Time Use Survey (TUS), which collected almost 1500 single-day responses to compare time use by participants in Melbourne and Albury-Wodonga. The first Australian Bureau of Statistics pilot Australian TUS was conducted in Sydney in 1987. This pilot was followed by full national time use surveys in 1992, 1997, and 2006. In 2018, the Federal Government’s Women’s Economic Security Package (Commonwealth of Australia, 2018: 5) committed to reinstating the Australian Time Use Survey after more than 10 years of hiatus.
The Australian Bureau of Research’ TUS collects detailed information about a representative sample of Australians and how they use their time in each five-minute interval across the 24-h day; a method Ironmonger (2008, p. 1) described as the ‘most valid technique to measure time use’. Despite the availability of the detailed results from the 1992, 1997, and 2006 surveys, no analysis appears to have been carried out to explore work by Australians across the twenty-four-hour day, with the ABS TUS drawn upon to calculate how much aggregate time is spent on specific tasks, such as unpaid work in the home. Figure 1 shows that according to ABS TUS data, Australians aged 15 and over are much more likely to be working in the evening than they are later into the night and the early hours. For example, in the early evening between 6 pm and 7 pm 20.1% of people reported that they were working, compared to just 1.6% between 2 am and 3 am. Through the integration of this data with the Australian Bureau of Statistics’ Labour Force Survey, it has been estimated that the number of Australians working between 6 pm and 6 am fluctuates across the night-time hours, from half a million between 12 am and 5 am to 2.7 million between 6 pm and 7 pm (Edwards et al., 2024). Proportion of Australians aged 15 years and over who participated in work, by time of day in 2020/21.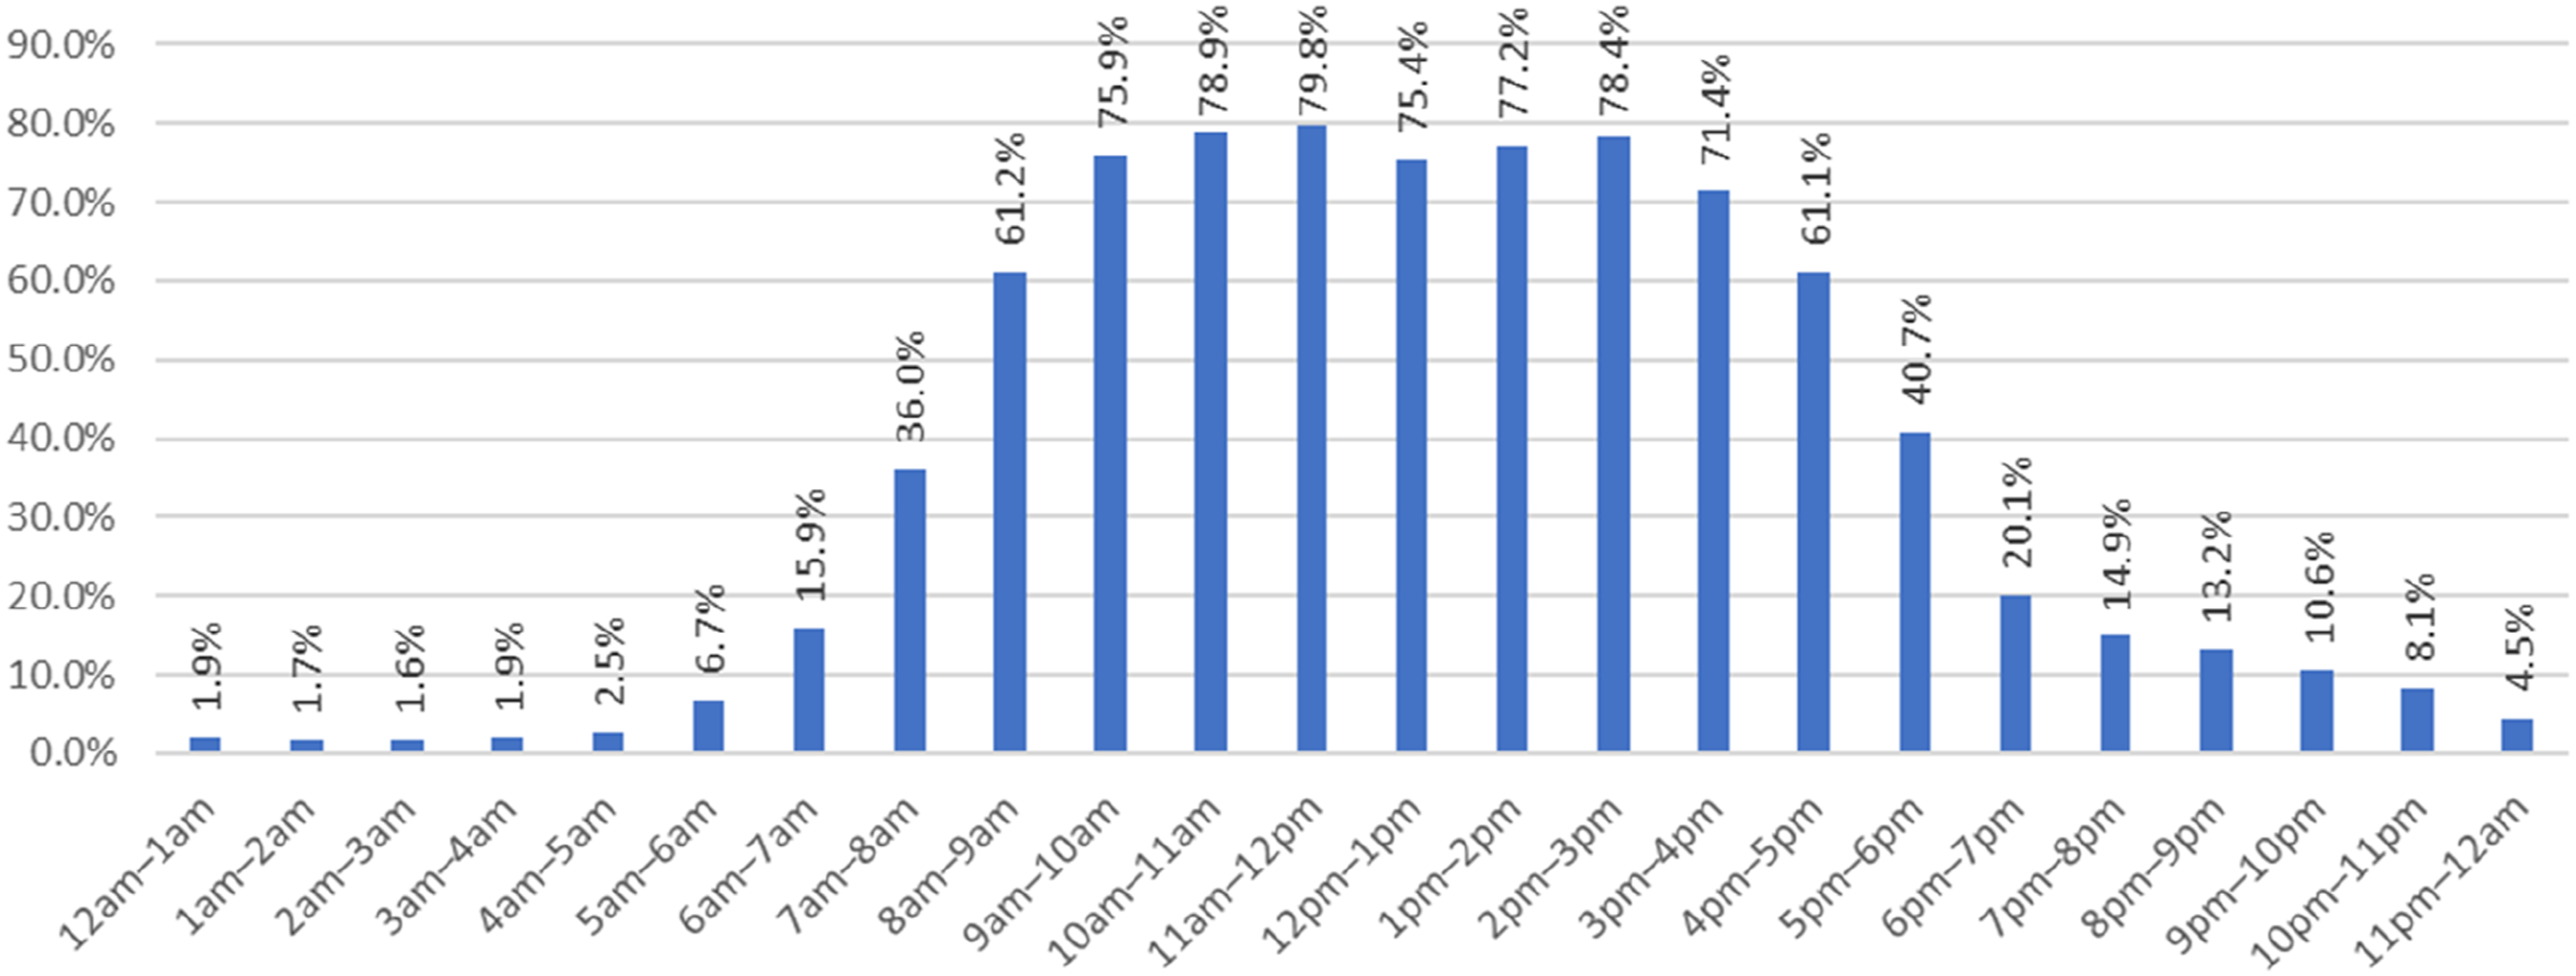
As shown in Table 1, the Australian Bureau of Statistics’ 2020/21 Time Use Survey indicates that the industries where people are most likely to be working between 6 pm and 6 am are accommodation, food, arts, and recreation services, followed by health and social assistance. The proportion of people working each sector fluctuates throughout the night. For example, an increase in the proportion of manufacturing and construction employees can be seen between 5 am and 6 pm. The data also shows that night work is more prevalent among Australian people who identify as male and younger people. Interestingly, many people reported working at night from home. For example, in 2020-21, 15% of employees worked between 8 pm and 9 pm at their own home, compared to 13% at a workplace. Time Use Surveys collect comprehensive data, enabling a detailed analysis of respondents’ demographics and how they use their time across the twenty-four-hour day. The key limitation of this data is the relatively small survey sample sizes in Australia – particularly in the 2020/21 data, reducing its capacity to provide reliable sub-national analysis or cross-metric analysis. A deeper examination of the subsectors in which night workers are employed based on a larger sample of data using this survey method could provide greater clarity on how who works at night by sector, with the potential to shift the narrative beyond the current ‘consumption’ side of the NTE.
A key challenge for most surveys is the inability to accurately determine the number of night shift workers based on the questions asked. For example, while it is possible to count those who report they usually work regular evening or graveyard shifts, workers whose schedules fall into rotating, irregular, split or on-call shifts are excluded – as it is impossible to determine whether these shift arrangements involve night work. The time use survey data is the most helpful in being able to determine the level of activity across each of the night-time hours and the demographic characteristics of these workers as with most of the data sources looked at, the sample design is not sufficient to enable detailed analysis beyond the national level. Considering the NTE agenda being pursued by Australian government organisations, there is a requirement for better data on the number and characteristics of night workers. This would best be achieved via existing federal government data collection mechanisms such as national surveys administered by the Australian Bureau of Statistics (ABS).
Accounting better: An urban inclusion purpose
As we have argued, we can do so with an explicit urban inclusion purpose, to tackle urban inequalities whilst pushing an action research agenda for urban science to be more closely engaged with evidence-based policymaking. The necessity, in the Australian context at least, to work hand in hand with decision-makers and often in co-production with these, in turn, pushes us as urban scholars to become more conversant in some of the language of policymaking in the NTE, which demands clear economic cases and evidence-based policy acumen. This data-based approach to advocacy is no novelty in the context of the NTE internationally. Some of the most effective campaigns to raise attention, and in turn policy action, to the NTE have included clear ‘business cases’ outlining the urban economics of the night. For instance, work by London business group London First in quantifying the economic footprint of the NTE on the British capital has been fundamental in setting up the groundwork, in the mid-2010s, for the Mayor of London’s push to establish both policies, committees and roles (like the Night Czar), as well as tangible change in the city (like the Night Tube). In Australia, research by Ingenium and the Council of Capital Cities Lord Mayors on the state of the Australian NTE has equally been central in pushing similar action by local governments over the last decade, and evidence-based advocacy continues to present positive engagement opportunities we have witnessed first-hand during our inquiries in contexts like Adelaide, Melbourne, Canberra, and Sydney. Yet, indisputably, some clear challenges remain and stand out from the discussion above.
Overall, our investigation of accounting methods for night-time workers underscored two key challenges not just for data collection and analysis, but also for applying effective evidence into policymaking. The first challenge we would see needing to be addressed is that of classifying who is, and who is not, a ‘night worker’. Should only paid workers be counted? Or, consistent with the growing scholarship on the precarity and invisibility of night workers, should people conducting volunteer, informal or domestic work at night be considered too? At what time does the night start and end – it is after dark, or is it at a specified clock time? Should only regular night work be counted, or should occasional or intermittent night work be incorporated into the analysis too? What about those who primarily work during the day but whose shifts end later than or before the usual nine-to-five? A factor particularly relevant post-pandemic is whether those working from home at night in flexible positions should be counted as night workers. There is no singular consensus to any of these questions – although the most used definition of the NTE in Australia is economic activity between 6 pm and 6 am.
Alongside this, a further challenge is that of data availability. While detailed labour market data is collected and analysed by Australian government agencies, no perfect dataset allows the analysis of the Australian labour market temporally across the 24-h day and over time. While governments typically collect data to monitor the levels of economic activity in their countries, cities, and regions, there has been limited or no perceived need to collect or analyse this data on a temporal basis to date. In Australia, data collection pertaining to the time of hours worked by Australians over the years has been inconsistent and, therefore, is not always comparable. There are, as we noted above, a few data indicators that can be drawn on to demonstrate what appears to be increased working hours at night, which in turn tell us that a base for better evidence-based action is already available and thus that clear strides ahead in the modes of accounting for night work could be achieved.
Lastly, we see a challenge of pigeonholing night workers in their specificities, further detaching them from better-established workforce recognition of their colleagues during the day-time. In our view, there is a clear tension regarding our definitional and statistical efforts on counting ‘night work’. Whilst there are commonplace versions of ‘working hours’ and the ‘workday’, notions like the ‘worknight’ are scant or wholly absent in policy and scholarship. We could consider advocating for the ‘worknight’ to become a commonly used term by academics and decision-makers, just as we do for the ‘overnight’. To that end, this essay (and more broadly our wider Night Shift research project), carries out a particular task in that it seeks to generate more reliable data about night work upon which such definitional efforts could be based. Yet, while we hope this approach will create opportunities for the needs and voices of night workers to be better attended to, we do not mean for night work to be regarded as some kind of anomaly to be measured against or separated from day work. Rather, our effort here is to shed light on an overshadowed critical component of the workforce – one that is often precarious, underpaid and facing challenging health conditions. In doing so, we take a specific step toward raising the profile of night workers in policy and scholarship, toward a better integration of this workforce rather than specialist separation, without of course undermining the necessity to account for, not least in remuneration, as to the complex wellbeing challenging underpinning working at night.
Given these challenges, it is important to consider how harmonising labour surveys and standardising data collection at a national level could improve our understanding of night work. By implementing consistent definitions and temporal classifications across labour force datasets, policymakers would have access to more accurate, consistent, and comparable data, enabling them to develop policies that better reflect the true scale, diversity, and conditions of night work. Such efforts could be used to inform improved labour and NTE policies, ensuring that the contributions of all-night workers are fully recognised and better supported. Night workers, however, we count them, are a fundamental part of the Australian workforce. They are also often poorly understood, calling is to step up our analytical capacity and their recognition in urban policy and governance across the country. Our review of currently available data sources that might be available to account for night-time workers has sketched a first picture of what the NTE workforce in Australia might look like. It is, of course, but a very preliminary effort on what could be a fundamental piece of not only specifically applied urban analytics and city policy, but potentially a country-wide effort to better contextualise the workforce behind the sizeable night-time economy that takes place in Australia after dark. With some degree of confidence, we have argued that upwards of a million people could be counted as night workers in Australia. However, this number could be, and probably is, much bigger. As we stressed in our assessment, this is a particularly conservative reading of how many people work at night: a million would be but a portion of the overall NTE workforce if we were to go, as we have argued, beyond ‘core’ sectors (like entertainment and hospitality) of the NTE and capture major nocturnal activities in the likes of logistics, care, and transport, for instance.
Yet our review also underscored these facts are highly contingent both of wide methodological diversities between the various sources we could rely on, as well as sizeable data limitations. Our brief analysis of available information has demonstrated that there remain many challenges to understanding the prevalence and characteristics of night work in Australia. Above we have outlined several data sources that could be drawn upon for this purpose and high-level findings from each of these datasets. Whilst this review tells us we do have important longitudinal information and some insights that cover most of the past two decades, and reasonably large sample sizes, it also stresses clear differences. Likewise, definitions of what makes for ‘night work’ vary, with important temporal divergences as to when night work really starts. Data-driven temporal insights play a foundational role in developing evidence-based policy for the future of night work in the context of 24-h economies in Australian cities. The systematic capture of information about the locations, times and demographic characteristics of night work is vital in effectively planning for the working conditions, travel, safety, social, and infrastructure needs of this growing workforce, and yet this data is currently lacking. It becomes amply clear to us that more investment and research are urgently needed to fill not just this gap in knowledge, but to ensure that the mounting efforts to manage the night-time economy of cities and regional centres across the country are centred on effective, up-to-date, and reliable data. Surveying night shift workers is not a luxury for academic studies or a curiosity for data experts, but a fundamental piece of pressing needs to better attend to the hundreds of thousands, if not millions, whose working conditions after dark are rarely chronicled, discussed, and acted upon in local, state, and federal policy. We simply cannot afford to discount this sizeable workforce. The night-time workforce keeps cities functioning 24/7. Despite its role in expanding urban and national economies, the needs and interests of this sizeable workforce have tended to be ignored. Night workers’ activities might take place out of sight for most urban dwellers, but their role in providing essential urban services needs to be acknowledged – and accounted for.
Footnotes
Declaration of conflicting interests
The author(s) declared no potential conflicts of interest with respect to the research, authorship, and/or publication of this article.
Funding
The author(s) disclosed receipt of the following financial support for the research, authorship, and/or publication of this article: this study was funded by the Australian Research Council (ARC) via a Discovery Project led by Michele Acuto and Alison Young, and titled Night Shift, DP220101078.
Data availability statement
Data sharing not applicable to this article as no datasets were generated or analysed during the current study.