
Abstract
Urban studies have gradually expanded their vision from horizontal to volumetric dimensions, responding to the growing compactness and density of cities. Though land use study has a long history, the study of urban space use from a volumetric perspective remains limited. However, vertical spatial difference is as substantial as horizontal spatial variance, especially in mixed-use developments. Addressing this, the research analyses 3D floor space use dynamics in the City of Sydney between 2007, 2012, and 2017 using ArcGIS Pro and visualising results with Plotly. Utilising Voxel Automata and Markov transition logic in Netlogo3D, we simulate potential future 3D urban structures. The model transforms floor spaces into voxels, assigns varying transition probabilities to voxels based on self-state, and applies the influence of neighbourhood state. The research underscores the challenges in developing varied transition probabilities for different floors, revealing the complexity of modelling 3D space use dynamics. The findings provide a more realistic understanding of the complex urban system and cities’ volumetric development. Additionally, the utilised 3D visualisation method can extend its utility beyond floor usage types to other spatial variables. Consequently, the research highlights the importance of 3D system thinking in future urban growth and expansion studies, and suggests more precise transition rules for modelling specific time points, benefiting future smart governance.
Introduction of volumetric urbanism
More of the world’s population live in urban rather than rural areas. In 2020, 56% of the world’s population lived in urban settings (Ritchie and Roser, 2018). With dramatic growth in urban populations, people living in cities, especially in megacities, face a denser work and residential environment. The idea of a compact city for a sustainable future (Ogle et al., 2017; Rahnama et al., 2020) is then highlighted, with high-rise buildings of better efficiency, higher capacity, and more heterogeneity of urban function within their footprint. Accordingly, increasingly high-rise buildings for both residential and commercial uses make city centres more compact and denser. Urban development research has studied the vertical perspective of urban growth, and there is also a growing focus on the volumetric perspective (Bruyns et al., 2021; McNeill, 2020).
Driven by the growing global population, complex transportation systems, modern skyscraper construction technologies, and the evolution of a compact city for sustainable urban development, it is now essential to study intensive urban development volumetrically. It is closely intertwined with the study of urban growth and complex urban systems and planning strategies. Research on the vertical dimension of urban development can be dated back to the beginning of the 21st century. Ireson and Barley (2000) see the vertical aspect of the city as layers of a city’s horizontalness and emphasise the stacked functions of cities. Both McNeill (2005) and Harris (2015) highlight the importance of skyscrapers in city development and relationship between power and height. The political issues had also become aligned with the spatial levelling up (Elden, 2013; McNeill, 2019; Weizman, 2002), when we see volumetric urbanism as a territory expansion and occupying the spaces above the head or underground. For instance, Singapore, a country with limited horizontal land, is rather aggressive in vertical land governance. In the 2010s, research showed vertical urbanism studies’ growing popularity (Elden, 2013; Graham and Hewitt, 2013; Harris, 2015). Besides the early conceptual and theoretical research, land use studies have increasingly focused on the analytics of the three-dimensional (3D) real world (Chundeli, 2015; Koziatek and Dragićević, 2019; Lauermann, 2022; Liu et al., 2018).
Extended from vertical urban development, Graham and Hewitt (2013) first argued that it is more appropriate to apply a volumetric understanding of urbanism in order to link the ‘horizontal’ and the ‘vertical’. Accordingly, McNeill (2020) illustrates the concept based on urban geography and identifies the crucial characteristics of understanding volumetric urbanism. However, until then, related studies remained in the theory stage, and analytical research was limited. Volumetric urbanism focuses on the three-dimensional spatial and network interaction of cities and places. It judges the urban area as a whole volume to address the importance of functions contained in buildings and the connectivity within and between buildings. Related case studies have been qualitative (McNeill, 2019) and quantitative (Higgins et al., 2020). Bruyns et al. (2021), therefore, expand the concept by applying the methodology of urban morphology. The research summarised five main elements for volumetric analysis: (1) density, (2) functional mix, (3) compaction and compression, (4) network complexity, and (5) interaction intensity, temporality, and vitality, intending to emphasise both the surface and vertical dimensions, and the interacting activity happening within the volumetric built environment. Bruyns et al. (2021) also raises the further need for study on translating a volumetric model for urban development and planning strategy. Research on volumetric urbanism and its contribution to the smart city is still limited compared to discourse on vertical dimension. Therefore, there is still scope for practical applications in research on the volumetric dimension.
LUCC (Land use and cover change) research has been seen as a support for sustainable development since the 1990s in Agenda 21. It was addressed again in the United Nations’ Sustainable Development Goals for its potential contribution to related topics. The study of mixed land use and its drivers or implications has a long history (Mouratidis and Poortinga, 2020; Song et al., 2013; Wu et al., 2021; Yang et al., 2016). Research also indicates that mixed land use can lead to a sustainable urban environment (Culaba et al., 2020; Evans and Foord, 2007). However, past land use studies are often horizontalism-dominated (Bruyns et al., 2021; Hewitt and Graham, 2015). Lin et al.(2014) applied cellular automata to model vertical growth, but only studied the height of each cell on the ground horizontally. Based on urban morphology, Chen and Feng (2022) coupled CA model with 3D modelling tool, CityEngine, to visualise the changes of urban form and volume by building heights, but neglect the changes and difference in and between floor layers. While He et al. (2023) studied the urban land use change from both horizontal and vertical dimension, they simulated land use parcels and their related vertical metrics separately. The vertical spatial difference of use in modern volumetric city is remain limited. In the review of spatiotemporal modelling of urban land use change and urban growth (Chakraborty et al., 2022), it identified that over the period of five decades (1970–2020), works still limited to 2D applications and more exploration on 3D integrated CA models is necessary in the age of digital twins. Many works (He et al., 2023; Liang et al., 2021; Yao et al., 2024) have conducted to strengthen the approaches for spatial modelling of land use dynamic; however, volumetric understanding of the urban dynamics is still circumscribed (Y. Liu et al., 2021). With the recent digital explosion of 3D spatial data, there are more opportunities for researchers to study the floor space use pattern of urban volume. Consequently, this research concentrates on function mix and change from the perspective of volumetric urbanism.
Although the total floor space in cities has been increasing for many years, research on floor space change and its driving mechanism is still limited. Hu (2014) summarised the floor space use within buildings of the CBD in Sydney, Australia in different timeframes but did not consider both spatial and vertical aspects. Chundeli (2015) created 3D models for land use volume of building scale and integrated the models into the urban planning process, but without considering the difference between layers and within a floor plan. Responding to the underground dimension, Li et al. (2016) studied the driving factors of function use within buildings by floors without studying the actual changing pattern temporally. Hawken and Han (2017) analysed the vertical heterogeneity of industry use in buildings by compressing the quantities into a horizontal block unit, and Han et al. (2021) extended the study to the temporal scale, but both studies ignored the difference between vertical layers.
Therefore, based on volumetric urbanism, this research aims to understand the changing volumetric distribution of urban function in the City of Sydney with three main approaches. The study first explores the city’s spatial pattern of urban function by floors in the built environment to reveal the visualisation methods for 3D floor use statistics. Then, the research calculates the transition probability of floor space use to examine the 3D spatiotemporal dynamic. Third, voxel automata are employed with Markov transition rules to build the understanding of volumetric development and simulate possible future changes.
Methodology
Study area
With an area of about 27
Research data
To simulate the 3D space use change in the volumetric city, floor use data is the most important one. The time series geospatial dataset was obtained from the City of Sydney’s Floor Space and Employment Survey (FES) data of 3 years: 2007, 2012, and 2017 (City of Sydney, 2018). The dataset initially consisted of 2D vector data with space use code, floor level, floor height (metres), and roof height (metres) attributes. The data was then transformed into a 3D format by adding the floor height to the Z coordinates of each polygon. Based on the space use code of the City of Sydney, the research recategorises all the geospatial features into 16 types of uses (Figure S1), of which Shopping includes showrooms and shopping areas, and Diet includes restaurants, eating, and drinking. The pre-processed dataset will be used to study the spatiotemporal transition and neighbourhood pattern to produce the driving rules for 3D floor use changes.
3D volumetric spatial transition visualisation
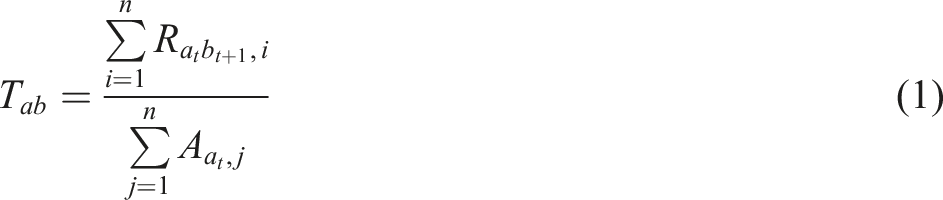
This research focuses on the spatial pattern of urban areas from the function perspective of the volumetric built environment and then explores their transition over time. The space use quantities by floors for each of the three time periods (2007, 2012, and 2017) are obtained through a GIS system, and spatial statistics are calculated using ArcGIS Pro. To explore the 3D spatial changes of floor use, the research creates a transition matrix for each floor. Different from past LUCC studies (Palmate et al., 2017; Z. Zhang et al., 2023; Zhu et al., 2021) with only one transition matrix to represent the entire development of a timeframe, this study builds layers of transition tables to show the characteristics of different floors via a tool created by ModelBuilder in ArcGIS Pro. It combines ‘Iteration Selection’ according to FLOORID and ‘Tabulate Intersection’ (ESRI, 2023) to obtain the area of transition from one use type to another. Finally, a transition probability T of type a to b can be calculated as follows.
Later, the descriptive statistics demonstrating the pattern by floors and times are calculated via Python loop ‘While’ to deal with repetitive work of integrating all the transition matrix data to the Xarray format for further visualisation. Plotly, an open-sourced Python library (Plotly, 2023), a popular Python library for its animation graph and 3D visualisation (Mundargi et al., 2023; Zeidan and Rempel, 2023), is applied to visualise the use patterns. By applying Plotly’s imshow and scatter_3d of plotly.express, the research visualises the 3D transition matrix in a readable way.
CA-Markov Chain simulation model and its extension to voxel automata
The research applies CA (Cellular Automata)-Markov model for 3D dynamics analysis. CA-Markov has been the most common method for urban expansion and LUCC study in the past decades (Firozjaei et al., 2019; Jokar Arsanjani et al., 2013; Y. Liu et al., 2021; Palmate et al., 2017; Rahnama, 2021; Tariq and Mumtaz, 2023; Yue et al., 2024; Y. Zhang et al., 2021). This research focused on extending the vision of urban space change study from horizontal to volumetric and how to analyse and visualise 3D space use change, and further exploring the challenges faced that raised from urban 3D simulation. In a coupled CA-Markov simulation model, the Markov Chain controls the state change through temporal probability, while CA controls the state change through spatial layout. In general, a CA-Markov applied the transition probability matrix based on historical land use data and its changing pattern; meanwhile, the spatial growth dynamics can be controlled by neighbourhood patterns or the transition potential maps generated from external environment factors. Nevertheless, to stick to the research aim, simple neighbourhood state impact rule is applied.
Later, Voxel Automata (VA) is applied to simulate a 3D data environment, extending 2D neighbourhood rules of CA to 3D. VA, a 3D cellular automata model, was introduced recently (Byari et al., 2022; Sepasgozar, 2020; Shirowzhan et al., 2018) to describe the spatial contiguity for the volumetric environment. Voxels are the basic spatial unit to represent a space volume in the real world. It models the transition with the state of a voxel can be influenced by that of its neighbourhood. Similar to the neighbourhood rules of CA, VA’s most common rules, for instance, in Netlogo3D, are ‘neighbours’ with 26 neighbour voxels and ‘neighbors6’ with 6 neighbour voxels from the centre (Figure 1). Netlogo (Wilensky, 1999), an open-source software, has been used for studying land use change for a long time, while its newer 3D version, Netlogo3D, is applicable in the 3D environment; hence, it is applied in this research. The analytical diagram integrating Voxel Automata and Markov Chain in ArcGIS Pro and Netlogo3D. Where 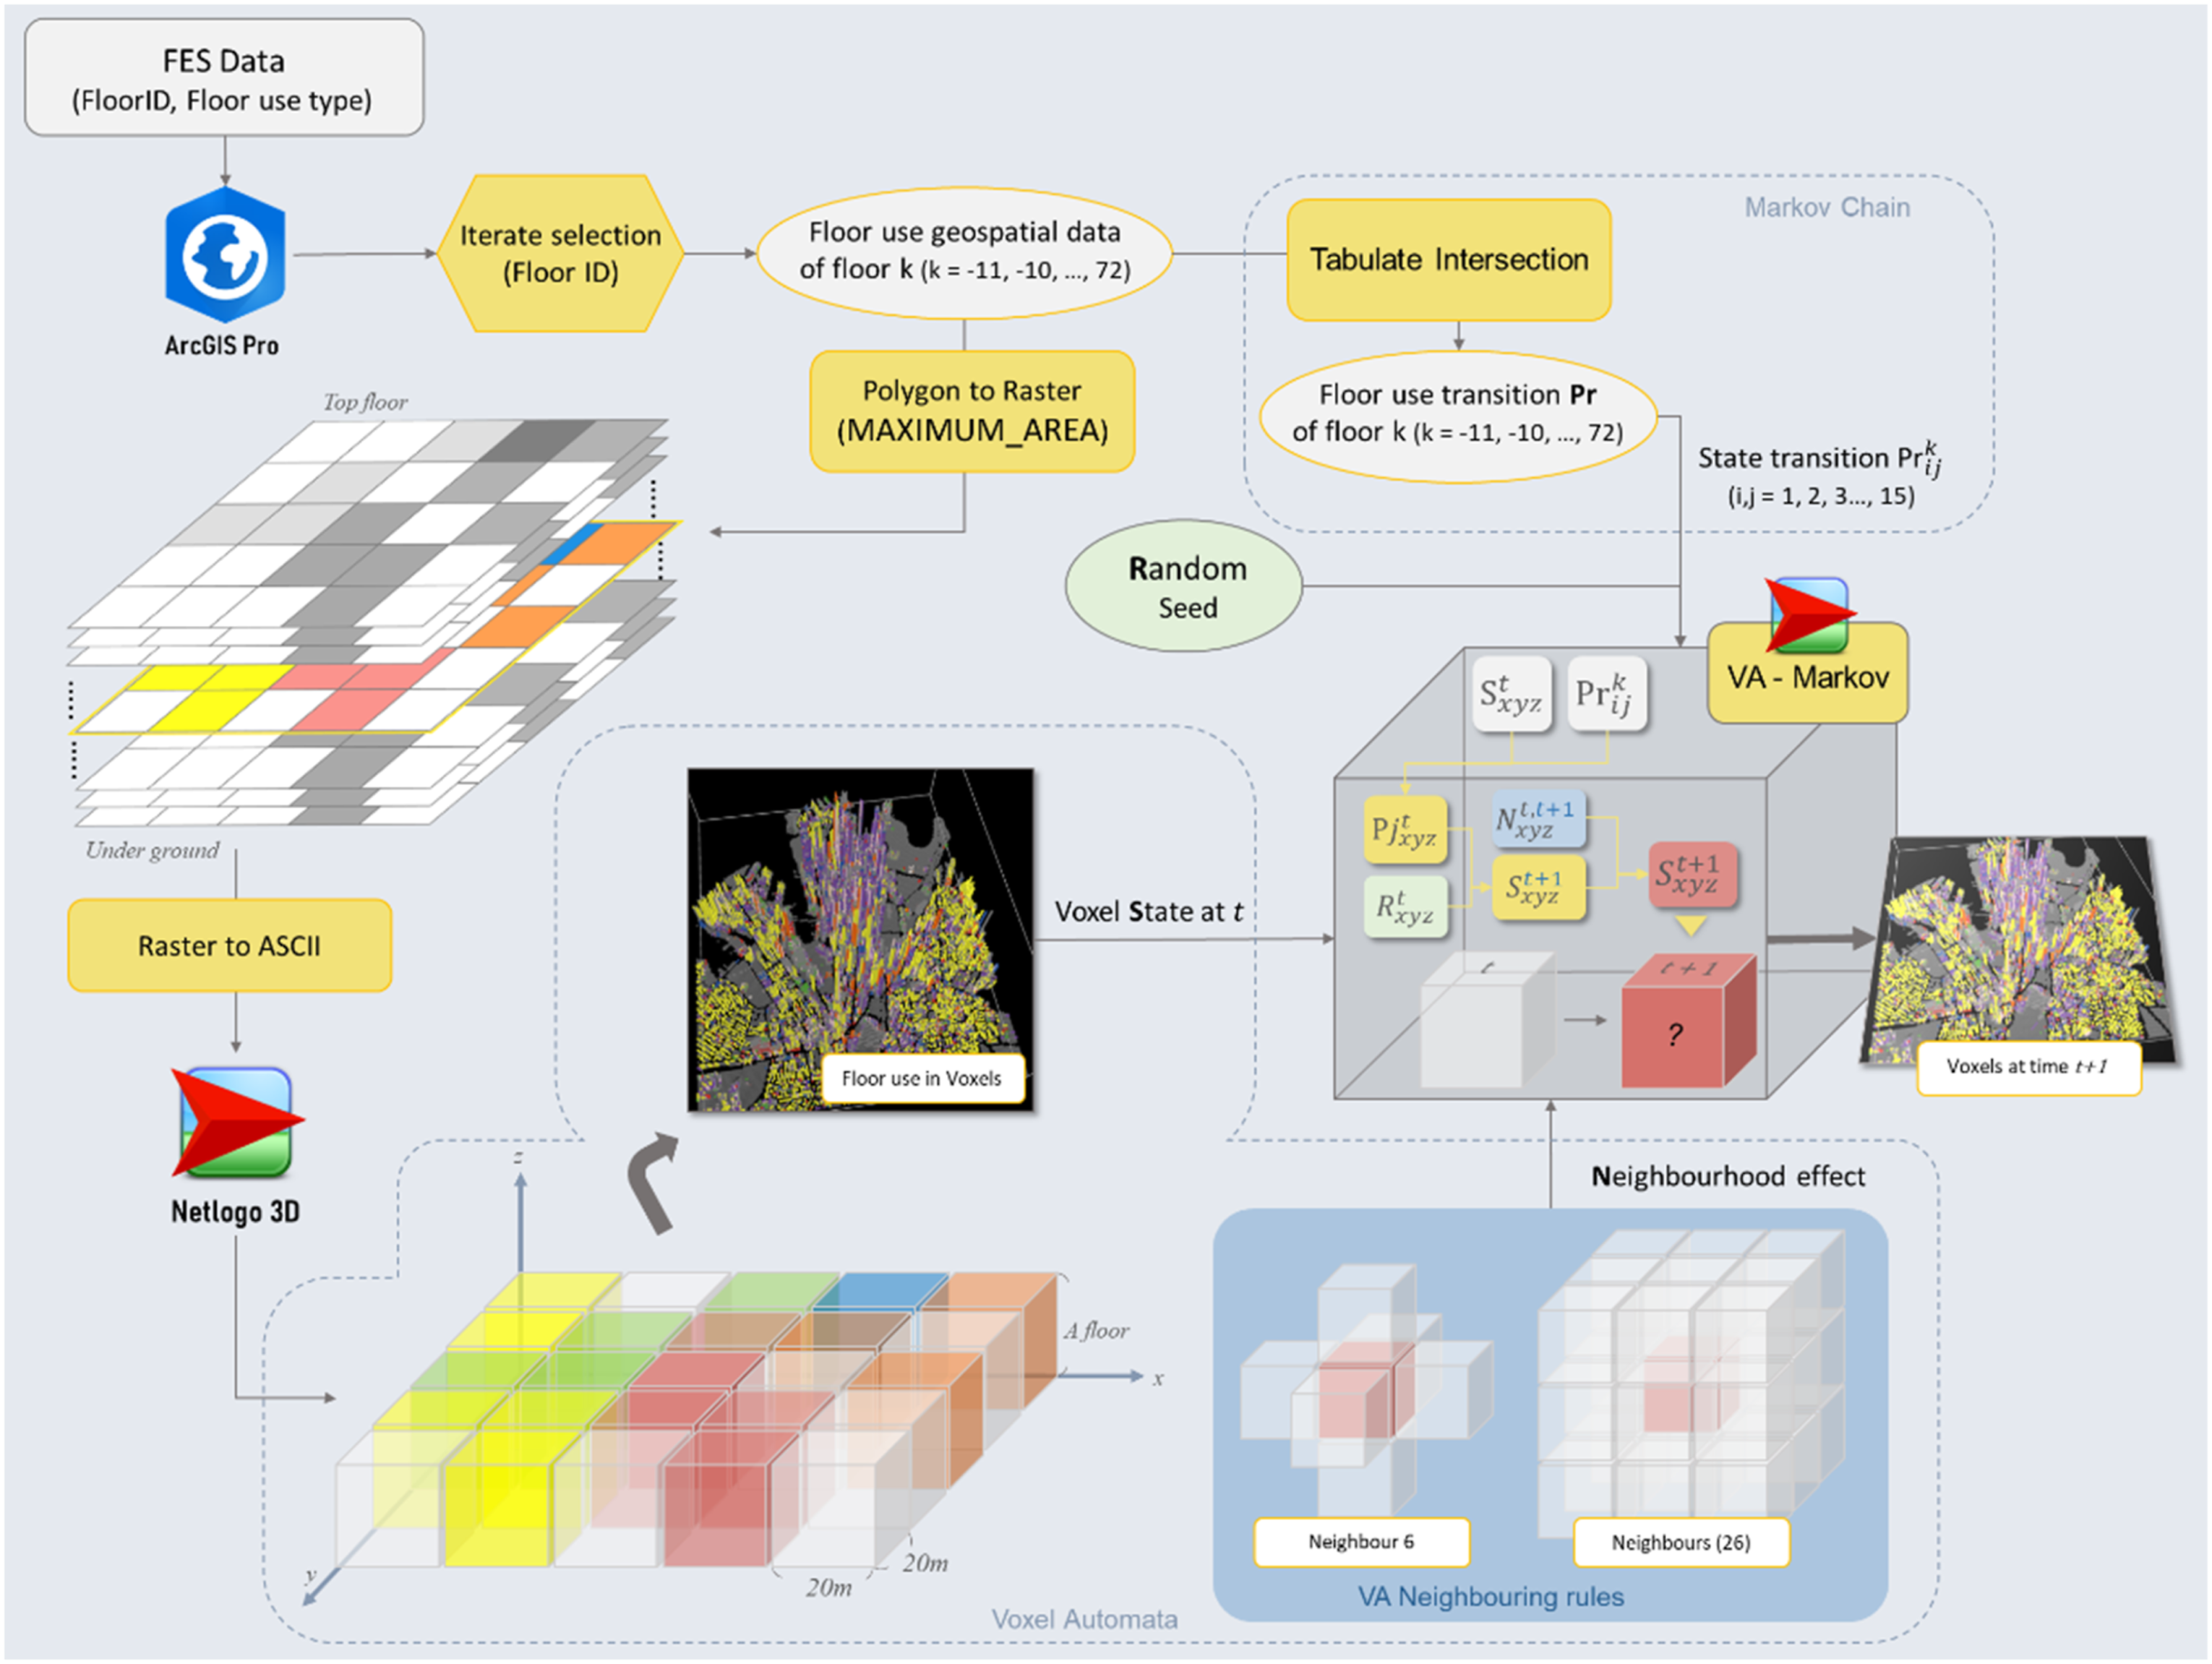
Considering the performance of detailed patterns within the high-density study sites and the computation capacity, the voxel size of this research is set to 20 m × 20 m in the horizontal plane to present the spatial pattern of floor use. The size for the z-axis of a voxel is set to represent one floor to highlight the vertical differences of floor layers that past research lacks. Due to the same measures in horizontal and vertical scales not representing similar distance scales, the z-axis of a voxel cannot also be set to 20 m. For example, 200 m in a horizontal plane can only take a small part of a suburb; however, 200 m in a vertical plane take almost all part of the city.
In VA-Markov, the voxel environment represents the real-world layout and is established according to the 3D vector data in the GIS system (see Figure S3). The created voxel world in Netlogo3D decides the location where the probabilities
Results
The vertical changes of 3D space use from 2007 to 2017
The growing floors of buildings in the compact city highlights that the changing space use patterns of various floors in buildings are better to study, respectively. According to Figure S4 to S7, the heatmap of vertical space use pattern in the Supplementary Material, it is obvious that the core functions of each floor are different. Spatial heterogeneity within the urban exist not only traditionally horizontally but also vertically or volumetrically. Next, the changing proportion of various functions across floor levels between the timeframes are compared in Figure 2. Blue in the cumulative bars represent the change from 2007 to 2012, while red indicate the change from 2012 to 2017. The vertical changing pattern of floor space use in 10 years. (a) The changing proportion of a type of space use area in a floor group of the total area of a space use type. (b) The changing proportion of the area of a space use type in a floor group by each floor group. The blue bars represent the changing proportion from 2007 to 2012, while the red bars represent the changes between 2012 and 2017.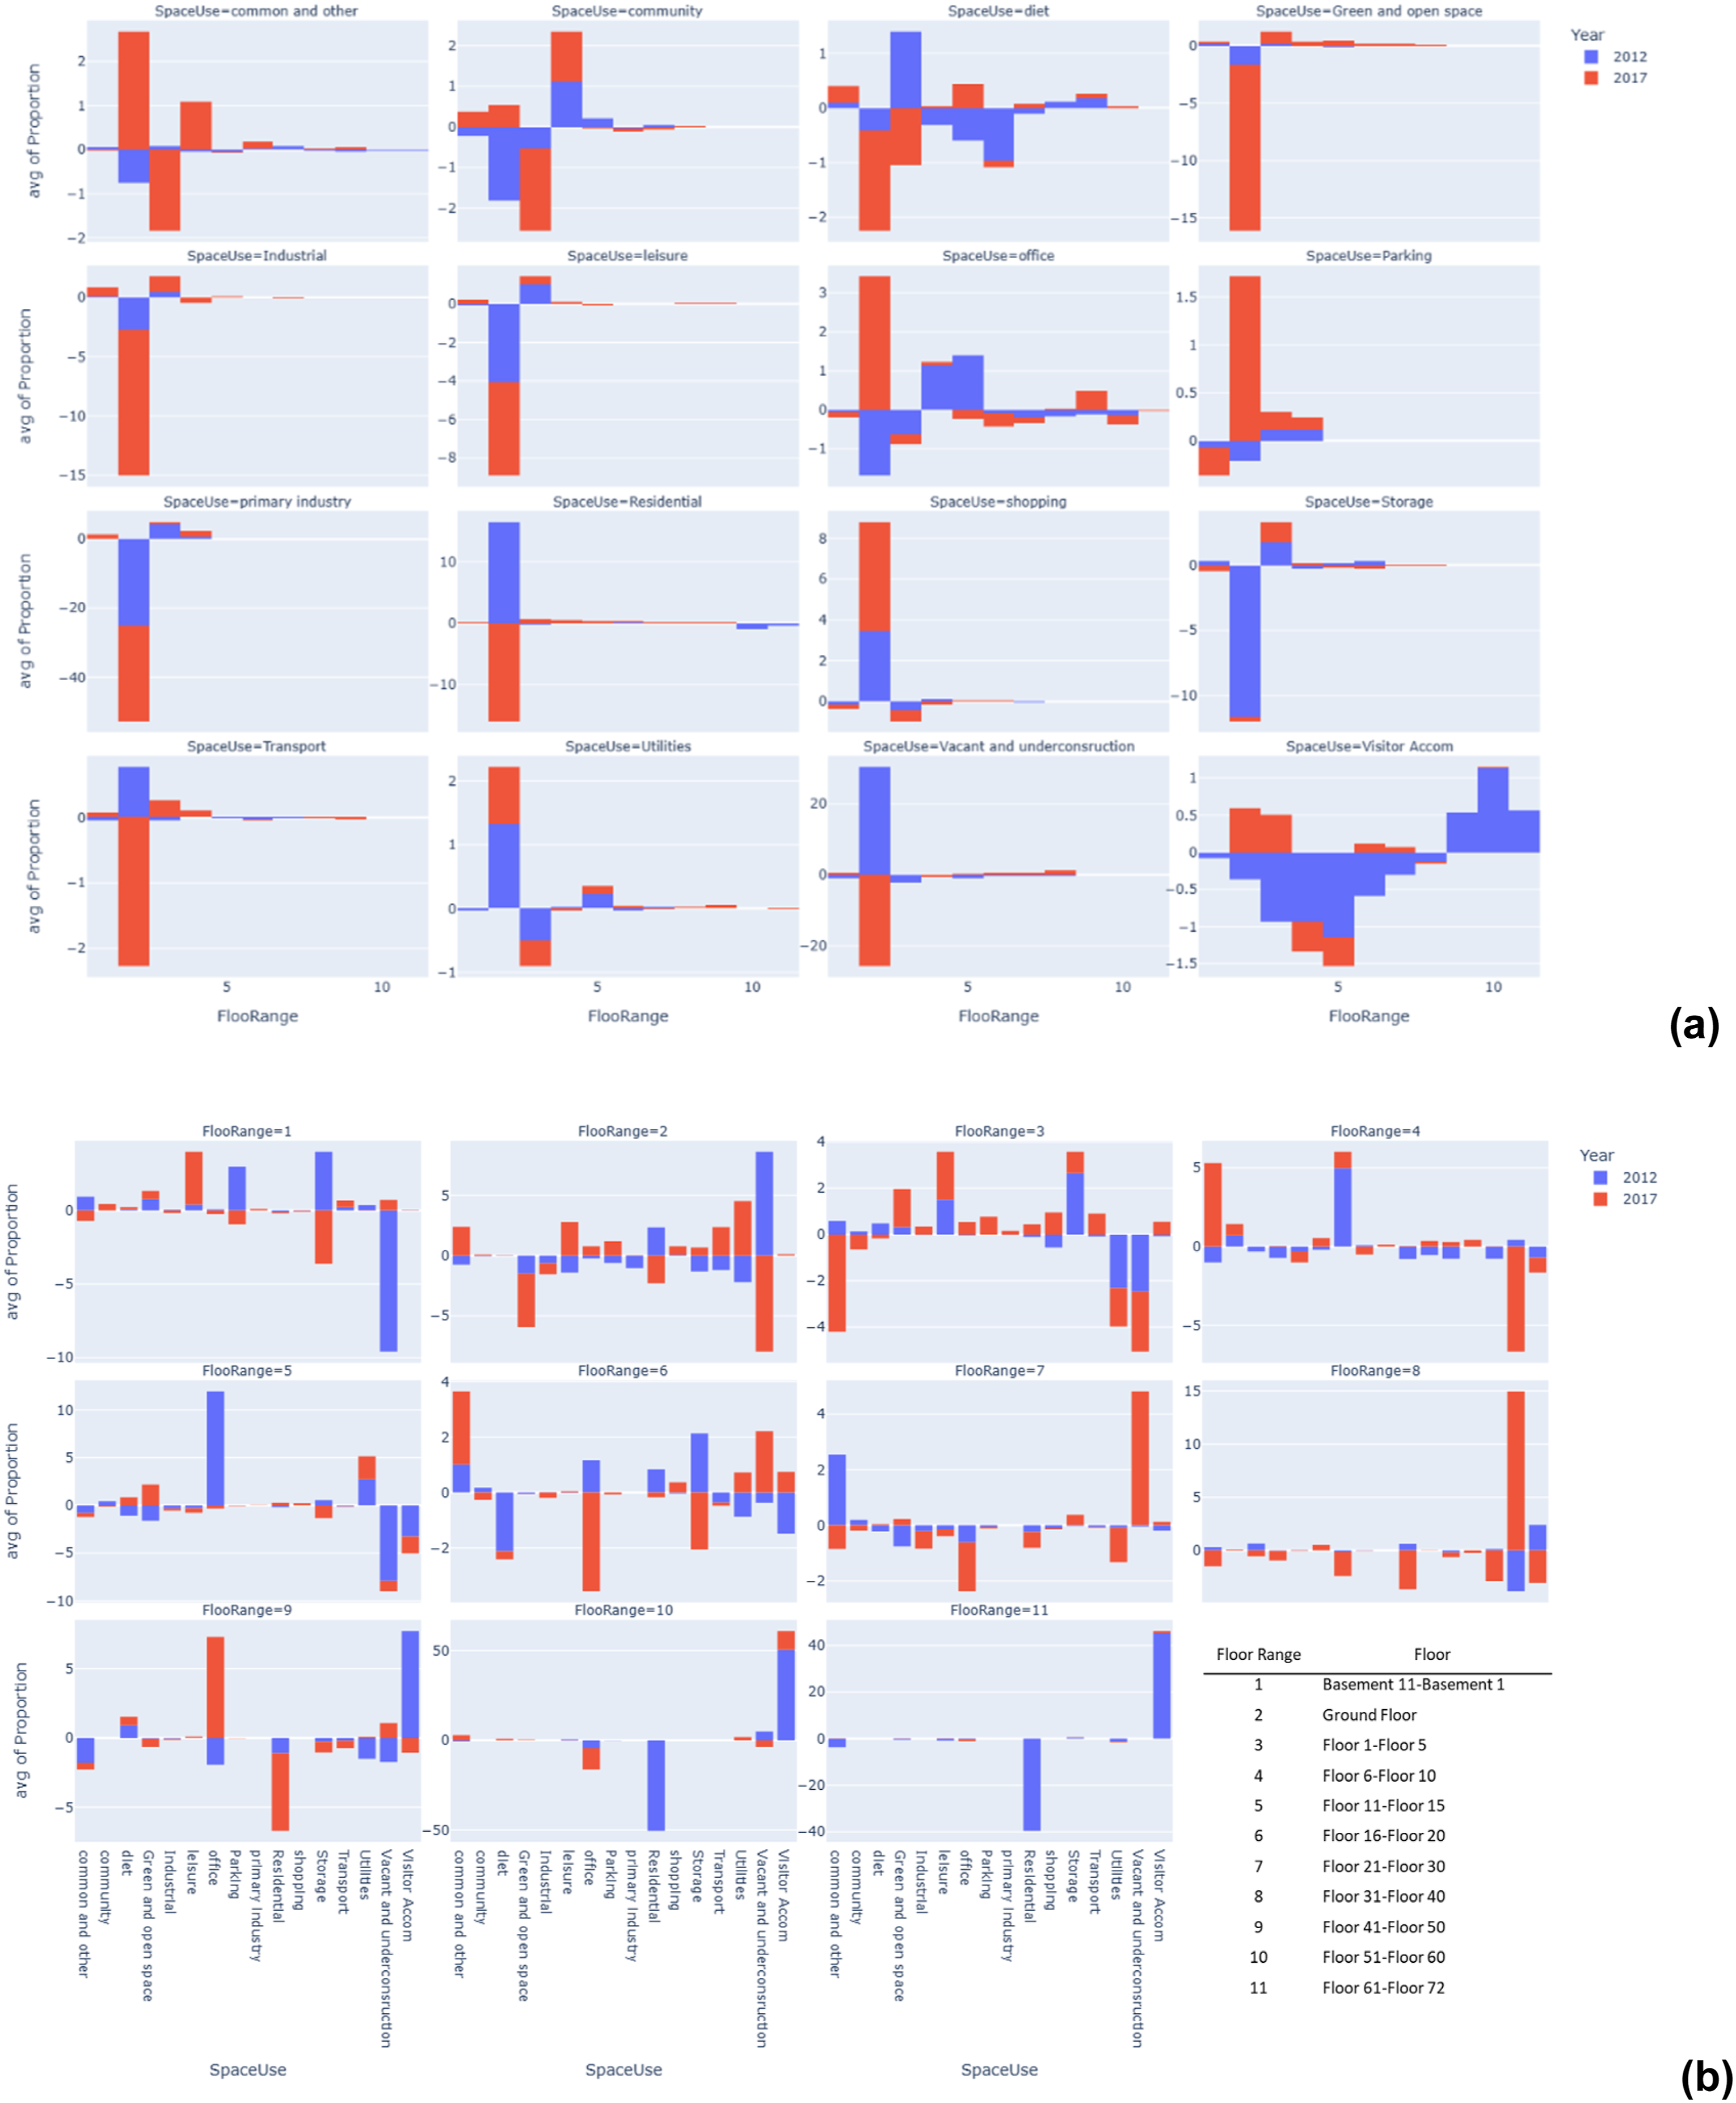
In general, most of the use types changed obviously in lower building levels. For example, residential and vacant uses both have significant pattern changes for its proportion of ground floor and show an opposite pattern in two timeframes. There is a 10% increase in residential use’s proportion of ground floor compared to the changes between 2007 and 2012, while there is a 10% decrease in the differences between 2012 and 2017. However, for visitor accommodation, changes happen in all floor groups. Use like shopping sees a dramatic increase in proportion for ground floor of over 8% between the two timeframes. On the contrary, storage, urban green space, industry, primary industry, and leisure uses show a significant decrease in their proportion in ground floor in both timeframes, ranging from 8% to 40%. Therefore, it is useful to monitor the changing way of each space use type by floors with Figure 2. That is, when urban grows more compact and high-rising, research should focus more on the differences within a location (building), which is often ignored in past LUCC studies.
3D floor space use types transition
The transition matrix based on the spatial overlay is essential to understanding the changing built environment. This research creates an Xarray dataset that includes 84 layers of transition matrixes of two time periods. The dataset has five dimensions, which are (1) the original use type, (2) the new use type, (3) the transition probability (based on the transition proportion), (4) the floor level and (5) the transition time period (see Figure S8 in the Supplementary Material for details). Firstly, a matrix heat map (Figure 3(a)) with an animation frame, interactive slider, and label is produced to illustrate the total transition condition. The slider is used to change from different floors, and the start button makes the map automatically orderly change by floor. The continuous colours clearly show the transition probabilities of various use types of two time periods. The map makes it convenient to identify the change patterns immediately. For instance, users can compare the left and right matrix to find that 100% of the ‘Primary Industry’ remained the same from 2007 to 2012, while all changed to ‘Industrial’ from 2012 to 2017. There is a significant decrease in the probability for vacant and under construction to remain the same. It was about 38% for the first 5 years and then 26.7% for the later 5 years. In contrast, there is a noticeable 8% increase rate from vacant to office use. The interactive transition matrix of 2007 to 2012 (left) and 2012 to 2017 (right) by floors (a) and the corresponding 3D scatter visualisation with annotation (b & c). The published interactive image can be accessed at: https://keziahsu.github.io/EPB_2024_Fig3a and https://keziahsu.github.io/EPB_2024_Fig3bc.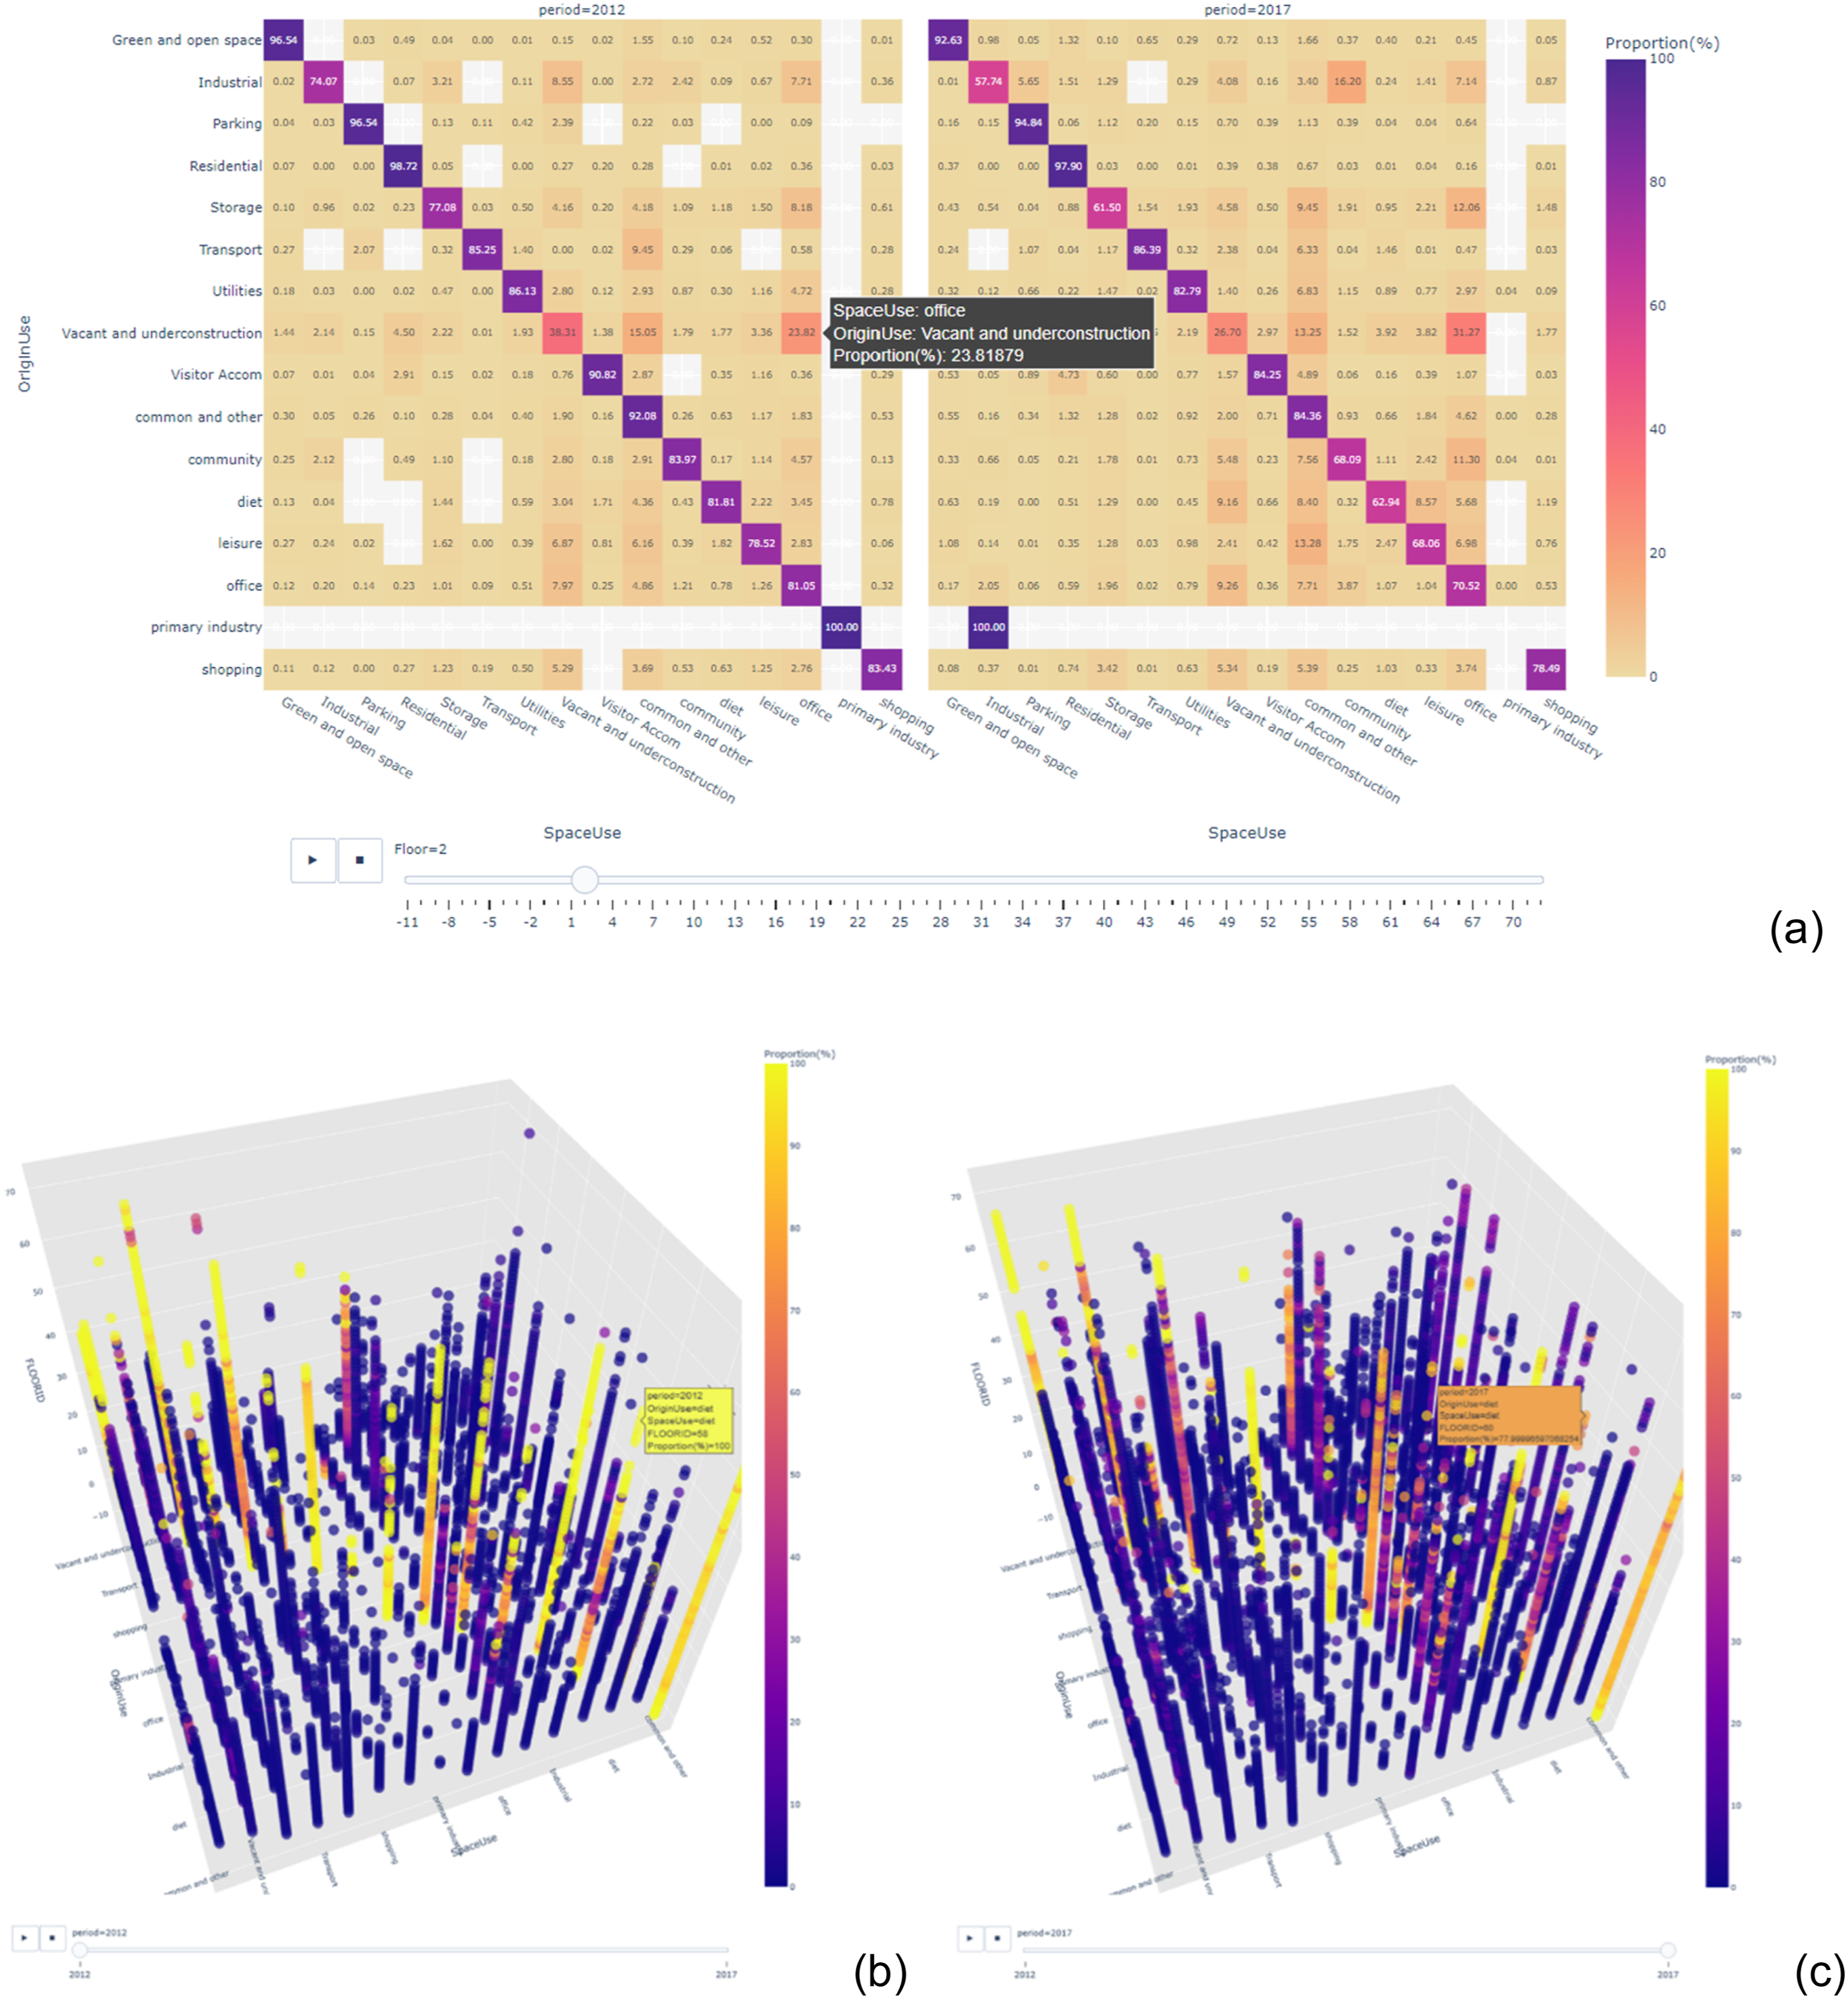
Next, to make the visualisation closer to the actual world and easy to compare between floors, the matrixes of different floors are appended to build a 3D scatter map. In Figure 3(b) and (c), the research placed the transition proportion of space use types by floors from basement to high levels in continuous colours. With the slider controlling the period, the significant differences in the transition patterns by time can be easily identified. For instance, the transition probability of storage to storage (storage use remaining no change), generally reduced in almost all floors comparing 2007 to 2012 and 2012 to 2017, and that of office use shows a similar trend of decreasing probability. Therefore, when a traditional matrix graph presented only the status of the mixed result, the interactive transition heat map and 3D scatter map can be helpful web image tools to monitor the fast-changing 3D built environment.
Modelling volumetric dynamic of future floor space pattern
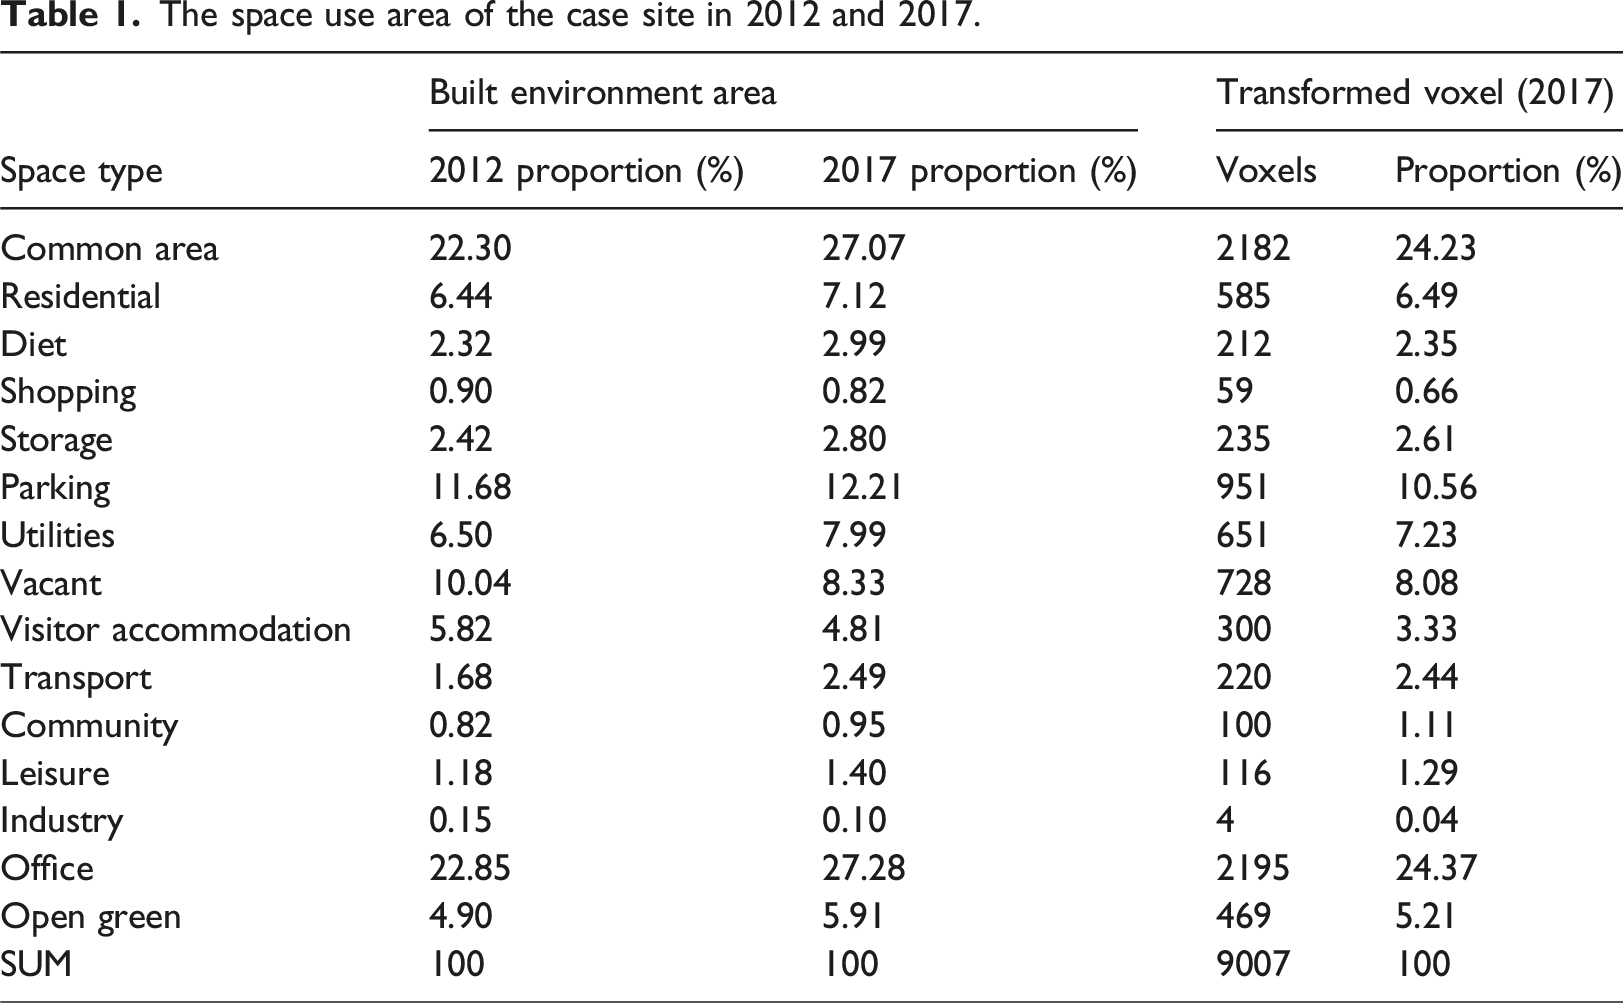
The space use area of the case site in 2012 and 2017.
Obtained from the changes between 2012 and 2017, 60 Markov transition matrixes are generated to determine the transition probability of the 60 floors within the study site. The transition probabilities of the same use type are accumulated to 100%. The simulation model then iteratively compared the accumulated transition probability of each voxel with a randomly selected float-point number within the range of 0 to 100. After 1000 spatial iterations, the spatial distribution of space use types seems to be located randomly without spatial contiguity (Figure 4(b)). This is because its simulation scenario considered only the Markov transition logic but VA neighbouring rules. Screenshot for the different status of the models under three neighbour scenarios. Use type like storage, utilities, common area and parking are combined for better visualisation and readable for understanding the changes.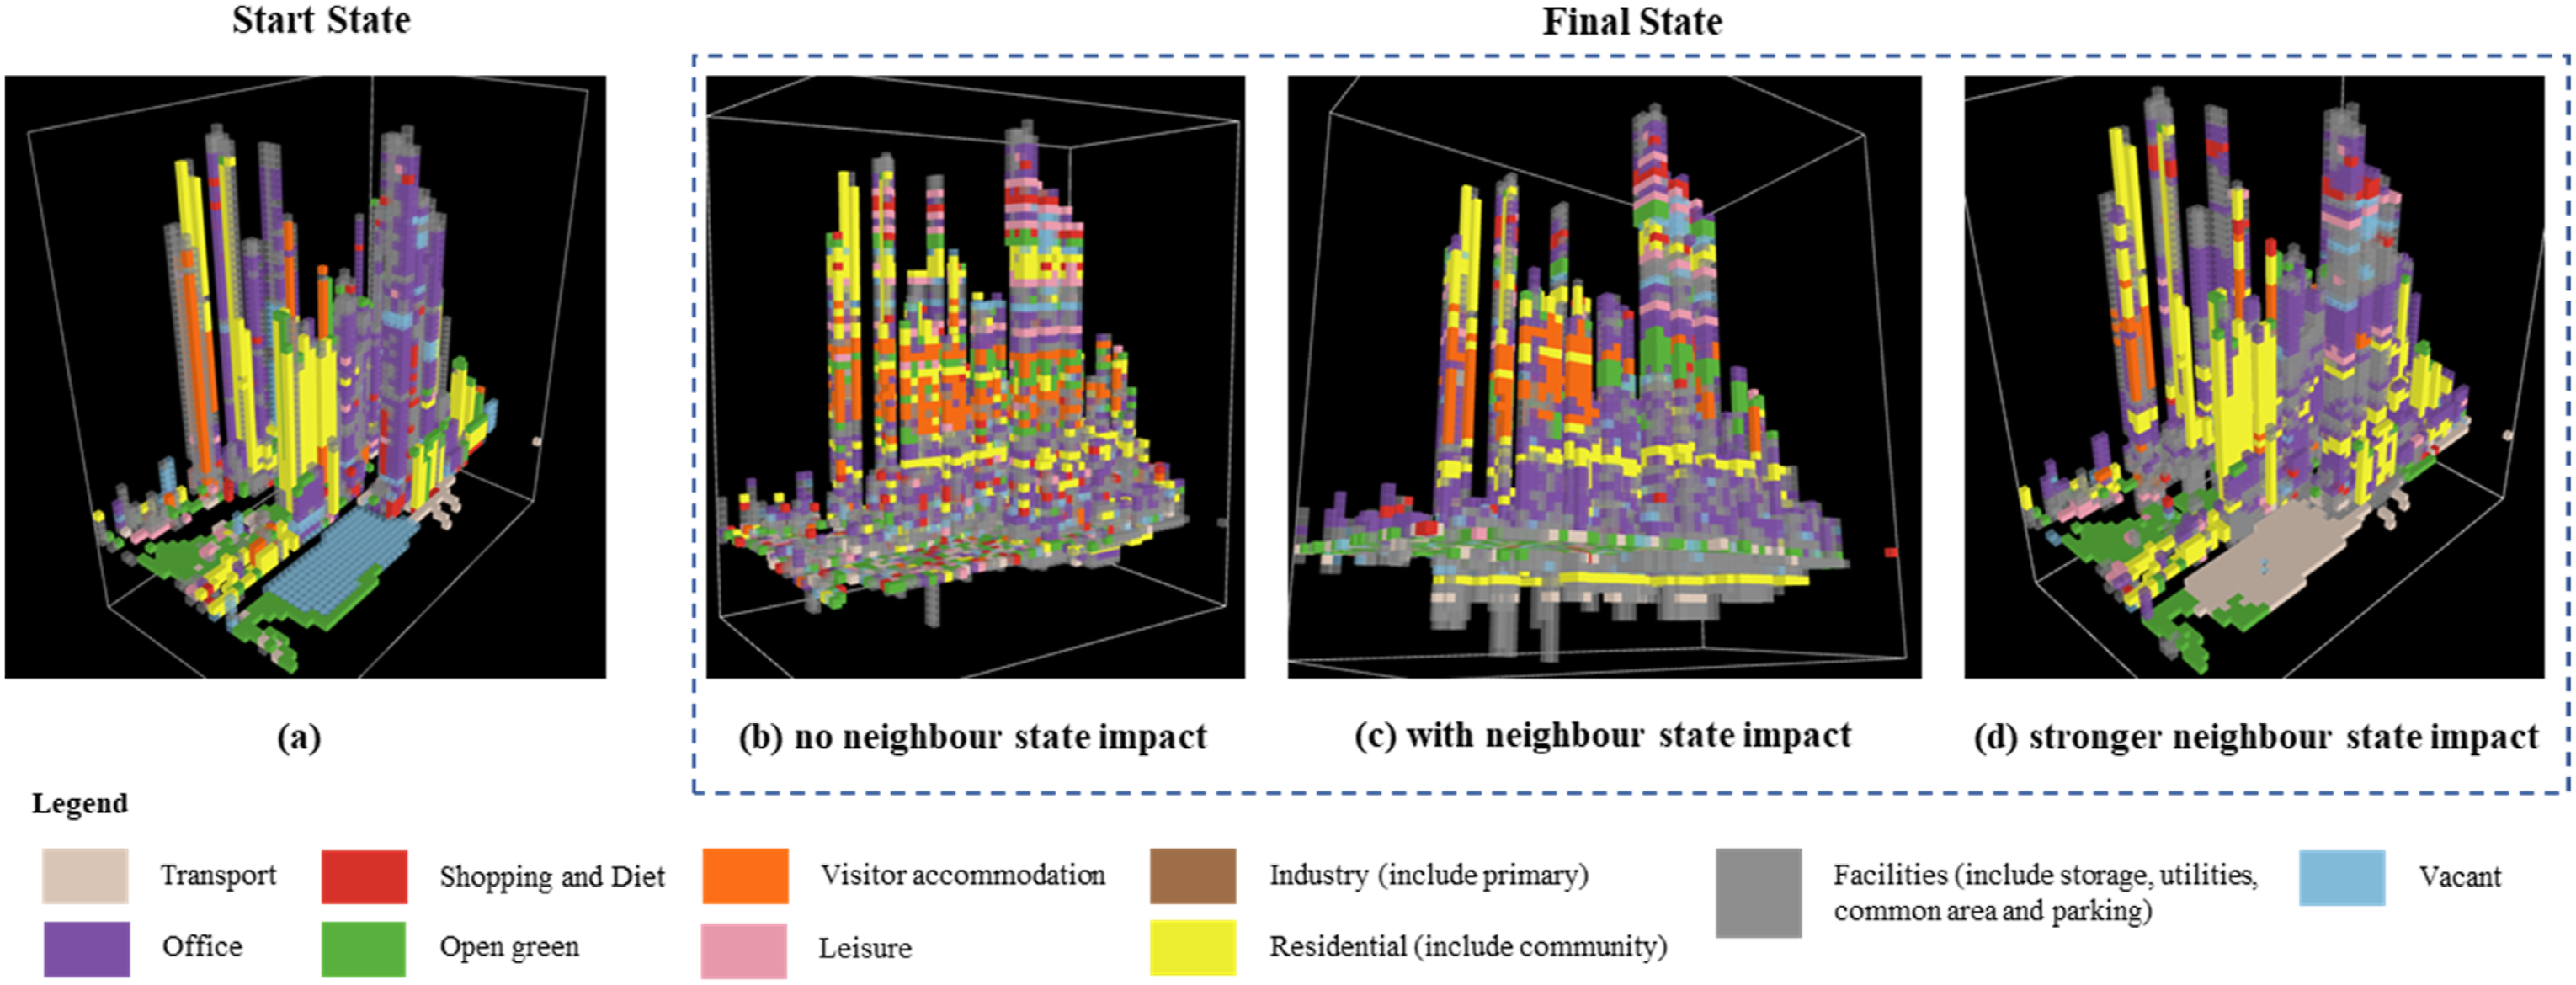
The research further adds the scenario by Voxel Automata spatial filer to highlight neighbourhood homogeneity. After the determination of the next-step use, the system observes if there are other neighbour voxels with the same space use type (initial step) or with the same expected (next-step) use type. If false, the voxel state remains the same. Two types of neighbour search rules are applied in Netlogo3D: neighbours6 and neighbours. The research gives uses of Common area and other, Utilities and Parking rather strict rules (neighbours) considering their weak neighbourhood attractiveness and popularity in transitioning from other use types. Accordingly, the new state becomes more spatially reasonable (Figure 4(c)). In Figure 4(d), a stronger neighbour rule with higher neighbour threshold applied, and its spatial pattern shows a noticeable spatial contiguity that the use type is more geographically continuously connected, which is closer to reality. Hence, it highlights the importance of VA in the simulation.
Estimated steady status of 3D floor space use in the future.
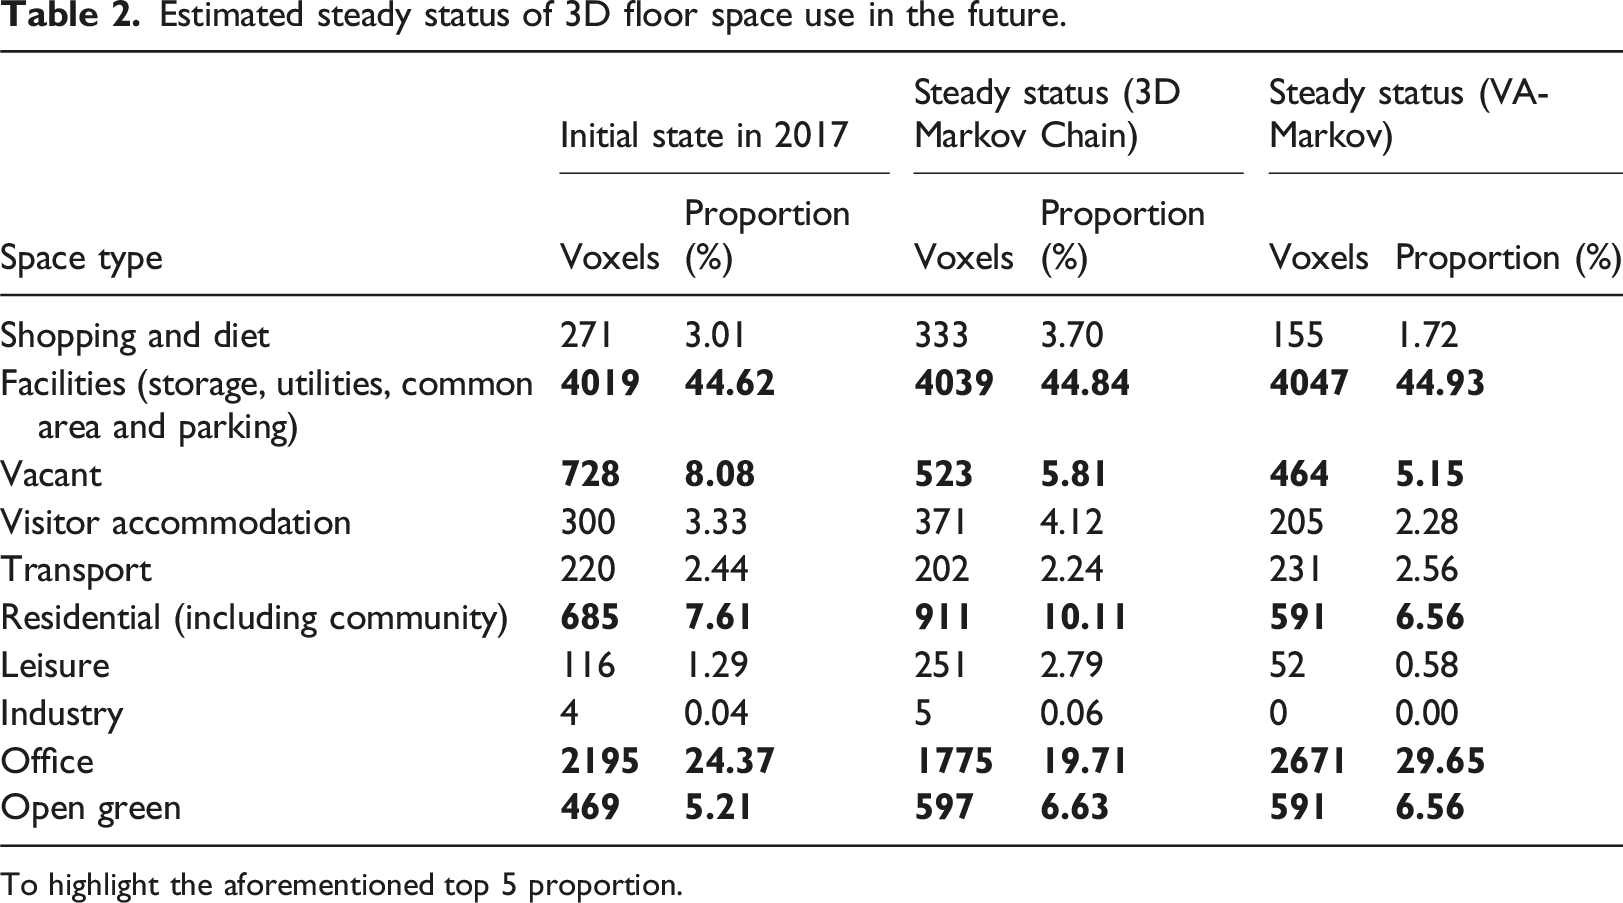
To highlight the aforementioned top 5 proportion.
Discussion
According to the growing attention on the substantial density and mixed urban space term, this research extended the traditional 2D vision of land use change studies to 3D, in response to the volumetric expansion of high-dense cities. The first challenge this research address is how to analyse and present the results of 3D space use patterns, especially when spatial data are overlaid and the sizes of different layers (floors) vary. To highlight differences in the 3D environment, statistics are calculated by different floors, time frames, and use types. Limited research (Li et al., 2016; Liu et al., 2018) has analysed urban space use by slicing them into layers. Thus, this research adds a new dimension to understanding the layout of urban functions in response to compact and volumetric urban proliferation. The research used 11 floor groups to conclude 84 building floors for summarising the use characteristics from underground, lower levels to upper levels, making recognising the pattern easier. For example, visitor accommodation and office use are more likely to be found in upper levels than other use types, while residential and industrial uses are more commonly seen in lower levels. In addressing spatiotemporal changes, GIS ModelBuilder and Python loop coupled well to present changes. Python’s Plotly Library produces animated and interactive 3D graphs, effectively conveying dynamic status. Layers of the transition matrix were produced to analyse these changes and contribute to further 3D floor space modelling.
Later on, different from the traditional global CA-Markov simulation model with only a layer of transition matrix (Gemitzi, 2021; Lin et al., 2014; Palmate et al., 2017), the research introduced the local CA-Markov system. Learning from the concept of direction-based CA-Markov (Firozjaei et al., 2019) that provides multiple sets of transition rules to places of different directions, this research employed an independent Markov transition matrix for each floor. This addressed the issue of varying transition probability and the occupied uses across different floors. Although the changing pattern for the estimated future configuration differs from that of the previous condition, it does not mean the result must be weak, as all the figures for different floors are aggregated. Therefore, a primary concern in 3D simulation raised by this research is the need to validate outcomes by floors, given the variability in total area and types of use across different floors. This also highlights the vertical spatial differences that often ignored.
Another problem that may not be faced in 2D simulation is found in the transition matrix. The new emerging use types in the upper levels of a building may often face the condition of no transition rules control. For instance, in 2007, there were no visitor accommodations above the 60th floor, but by 2012, some residential spaces above this level had been converted into visitor accommodations. When applying the transition matrix of 2007 to 2012 for predicting further potential changes, no transition probability was used to control the step changes from visitor accommodation to others. In this case, the transition probability from other floors can be applied, or the average transition probability of a floor range can be used. Moreover, in contrast to the traditional study of land use, there is more chance in 3D simulation for a space to transit to null (which means disappear) or to convert from null, as the total built volume of each floor is relatively flexible. For instance, the CBD study site had only 48 floors on the ground in 2012; however, there were 51 floors in 2017. That is, each location’s vertical boundary is different and changing over time. In this case, variables learn from planning policy or future project can be applied.
This research explores the volumetric modelling method to extend the understanding of compact cities to a volumetric perspective in response to the demands of modern urban environments. As this is a burgeoning approach, numerous opportunities exist to enhance the 3D floor space simulation model. External environmental factors and urban development plan that influence the changes in 3D space uses can be collected further to enhance the realism of spatial development. Additionally, accuracy assessment measures for the model’s performance like cumulative PA, Kappa coefficient, or frequency of misclassification (Lu et al., 2020; Mahmoudzadeh et al., 2022; Zhang et al., 2021) could be employed for the temporal simulation of specific times. In conclusion, this research is novel and contributes to the current studies in three-dimensional simulations by providing detailed three-dimensional floor use changes in urban functionality, employing the Voxel Automata model. It offers a novel lens to reassess, understand and monitor contemporary compact city, contributing academically to urban geography and practically to smart urban governance.
Conclusion
In general, this research provides pioneering exploration into the dynamics of space functions from a volumetric perspective, particularly relevant in the context of rapidly growing high-density and high-rise urban patterns. The study emphasises the imperative of analysing variations and transitions in functions across both horizontal and vertical spatial dimensions. The 3D visualisation method introduced in this study is a valuable tool, illustrating space use patterns and area proportions, and it is applicable to various spatial variables in the volumetric urban area. Voxel automata modelling provides deep insights into the complex spatial interactions within the skyscraper in Sydney CBD. This contributes significantly to the monitoring of volumetric urbanisation, thereby benefit urban planning within high-density area. The distinctive volume-domain approach, which analyses the dynamic floor by floor, lays a vital groundwork for future studies in urban expansion studies and paves the way for a paradigm shift in urban space planning.
Looking forward, this research acknowledges several avenues for enhancement. While our model offers valuable insights, the complexity introduced by the vertical dimension suggests the need for more data-proven impact rules. In the future, integrating external driving factors and agent behaviours into our 3D model could enhance its competitiveness in representing real-world urban complexities. Additionally, employing GeoAI modelling methods may reveal hidden relationships between voxels, thus refining understanding of spatial patterns.
This research marks a pivotal initial step in applying Voxel Automata to study urban development in a volumetric system. It underscores the importance of embracing 3D perspectives in urban analytics research, especially given the current policy trend favouring denser development for sustainability. Looking ahead, a more comprehensive exploration of 3D simulation methodologies and the development of 3D social-demographic data are crucial to strengthen the foundations of future volumetric spatial planning. In conclusion, the research unveils the potential of volumetric urban analysis, and points towards a broader research trajectory to enhance our understanding of complex urban structures. Towards denser urban development, this research establishes a solid foundation for exploring the intricacies of 3D urban environments, contributing to a sustainable and resilient future.
Supplemental Material
Supplemental Material - Toward volumetric urbanism: Analysing the spatial-temporal dynamics of 3D floor space use in the built environment
Supplemental Material for Toward volumetric urbanism: Analysing the spatial-temporal dynamics of 3D floor space use in the built environment by Yi-Ya Hsu and Hoon Han in Environment and Planning B: Urban Analytics and City Science.
Footnotes
Acknowledgements
This research appreciates the City of Sydney for providing the raw dataset for the Floor Space and Employment Survey (FES). The First author (Yi-Ya Hsu) acknowledges the support of UIPA Scholarship (UNSW Sydney) and the top-up scholarship provided by Future Food System CRC (P1-028) & UNSW Arts, Design & Architecture.
Declaration of conflicting interests
The author(s) declared no potential conflicts of interest with respect to the research, authorship, and/or publication of this article.
Funding
The author(s) received no financial support for the research, authorship, and/or publication of this article.
Ethical statement
Data availability statement
The datasets generated during and/or analyzed during the current study are available from the corresponding author on reasonable request.
Supplemental Material
Supplemental material for this article is available online.
References
Supplementary Material
Please find the following supplemental material available below.
For Open Access articles published under a Creative Commons License, all supplemental material carries the same license as the article it is associated with.
For non-Open Access articles published, all supplemental material carries a non-exclusive license, and permission requests for re-use of supplemental material or any part of supplemental material shall be sent directly to the copyright owner as specified in the copyright notice associated with the article.