
Abstract
This study evaluates the spatial behavior of an intermodal transportation hub in Carapungo, one of the densest neighborhoods in Quito, Ecuador. This public infrastructure is deficient and lacks adequate equipment for the people who use, occupy, and transit within and around it, as well as for the numerous activities that occur, particularly at Carapungo’s Entry Park. Traditional methods for analyzing urban dynamics and land use are typically rigid and fail to grasp the complex and nonlinear nature of public spaces, especially in informal Global South cities. However, recent advancements in Artificial Intelligence and Machine Learning, combined with aerial drone videos, have enabled the modeling and prediction of urban dynamics beyond state regulations and formal planning. In this context, we developed a model using Computer Vision Technology and the YOLOv5 algorithm, incorporating Deep Learning training. The objective is twofold: firstly, to detect people, their movement and speed; and secondly, to produce “Occupancy” and “Count & Speed” cartographies that highlight commuters’ spatial patterns. These situated cartographies provide valuable insights into urban design, mobility, and interaction within a conflicted public space’s-built environment. The generated data offer planners and policymakers quantitative spatial information to consider local practices and dynamics in urban planning, particularly in situations of informality and insufficient urban infrastructure.
Keywords
Introduction
Carapungo as case study
Carapungo is a neighborhood of Calderon parish located on the most northern border of Quito (Ecuador), inhabited mostly by low-income population sectors. In an area of 79.17 km2 (Municipio de Quito, 2021), the parish has expanded from over 150,000 inhabitants in 2010 to almost 190,000 inhabitants in 2022 according to INEC’s (2022) projections. Located at 2610 m.a.s.l., Carapungo is the northern main entrance to Quito, in which the Pan-American Highway passes by since 1971, becoming a referential point for urban development and expansion. The construction of this highway coincided with the oil boom in Ecuador, which brought significant flow of capital for construction, including the development of social housing in areas like Carapungo. The Pan-American Highway divides the district in two: north and south sides; but it also is the main infrastructure to connect Colombia and Peru. Therefore, the vehicular traffic is high and constant, with the continuous presence of trucks, buses, trailers, and vehicles. On a normal weekday, three of 10 inhabitants in Quito use private vehicles to mobilize in the city, while in Calderon, about 110,000 people use public transport to reach the city center or to commute to other circuits (Definición de La Estrategia De Comunicación a Operadores y Usuarios Sobre La Implementación Del Sistema Integrado De Transporte y La Tarifa Integrada De Transporte En El Distrito Metropolitano De Quito, 2021; Transporte de pasajeros, 2015; Secretaría de Movilidad, 2017).
This situation is complex, chaotic, and insecure at a daily basis, where commuters, informal vendors, buses, taxis, and alternative—informal—means of transport at Pan-American Highway, particularly at Carapungo’s Entry Park, is high in numbers (Medina Gavilanes and Cano-Ciborro, 2022). During rush hours and because of the informal urban aspects of the area, in Carapungo, the presence of a formal intermodal transportation hub does not exist, nor even signs or panels that indicate the location, the circuit, or arrival time of public transportation. Instead, there is a blurred text—BUS—written on the asphalt as a vague indicator. Along the sidewalk, people wait for buses in a long and winding line, without necessarily forming a proper queue. This urban scene is characterized by a bustling movement of vehicles, individuals, and goods. Buses sporadically halt in the middle of the highway, prompting people to run after them or even cross the highway in front of moving vehicles. Meanwhile, both formal and informal taxi drivers seek potential clients among those who missed the bus. Amidst this commotion, vendors attempt to entice passers-by with food or supplies (Figure 1). Left: Situation of Carapungo district and Pan-American Highway in Quito. Top Center: Cartography of Carapungo entry park emphasizing informal BUS lane. Bottom Center: Carapungo platform and bridge. Top Right: Drone view showing people running to catch three separate buses. Bottom Right: Aerial view of people struggling to enter through both the bus exit and entrance zones, which is prohibited. Authors, 2022–23.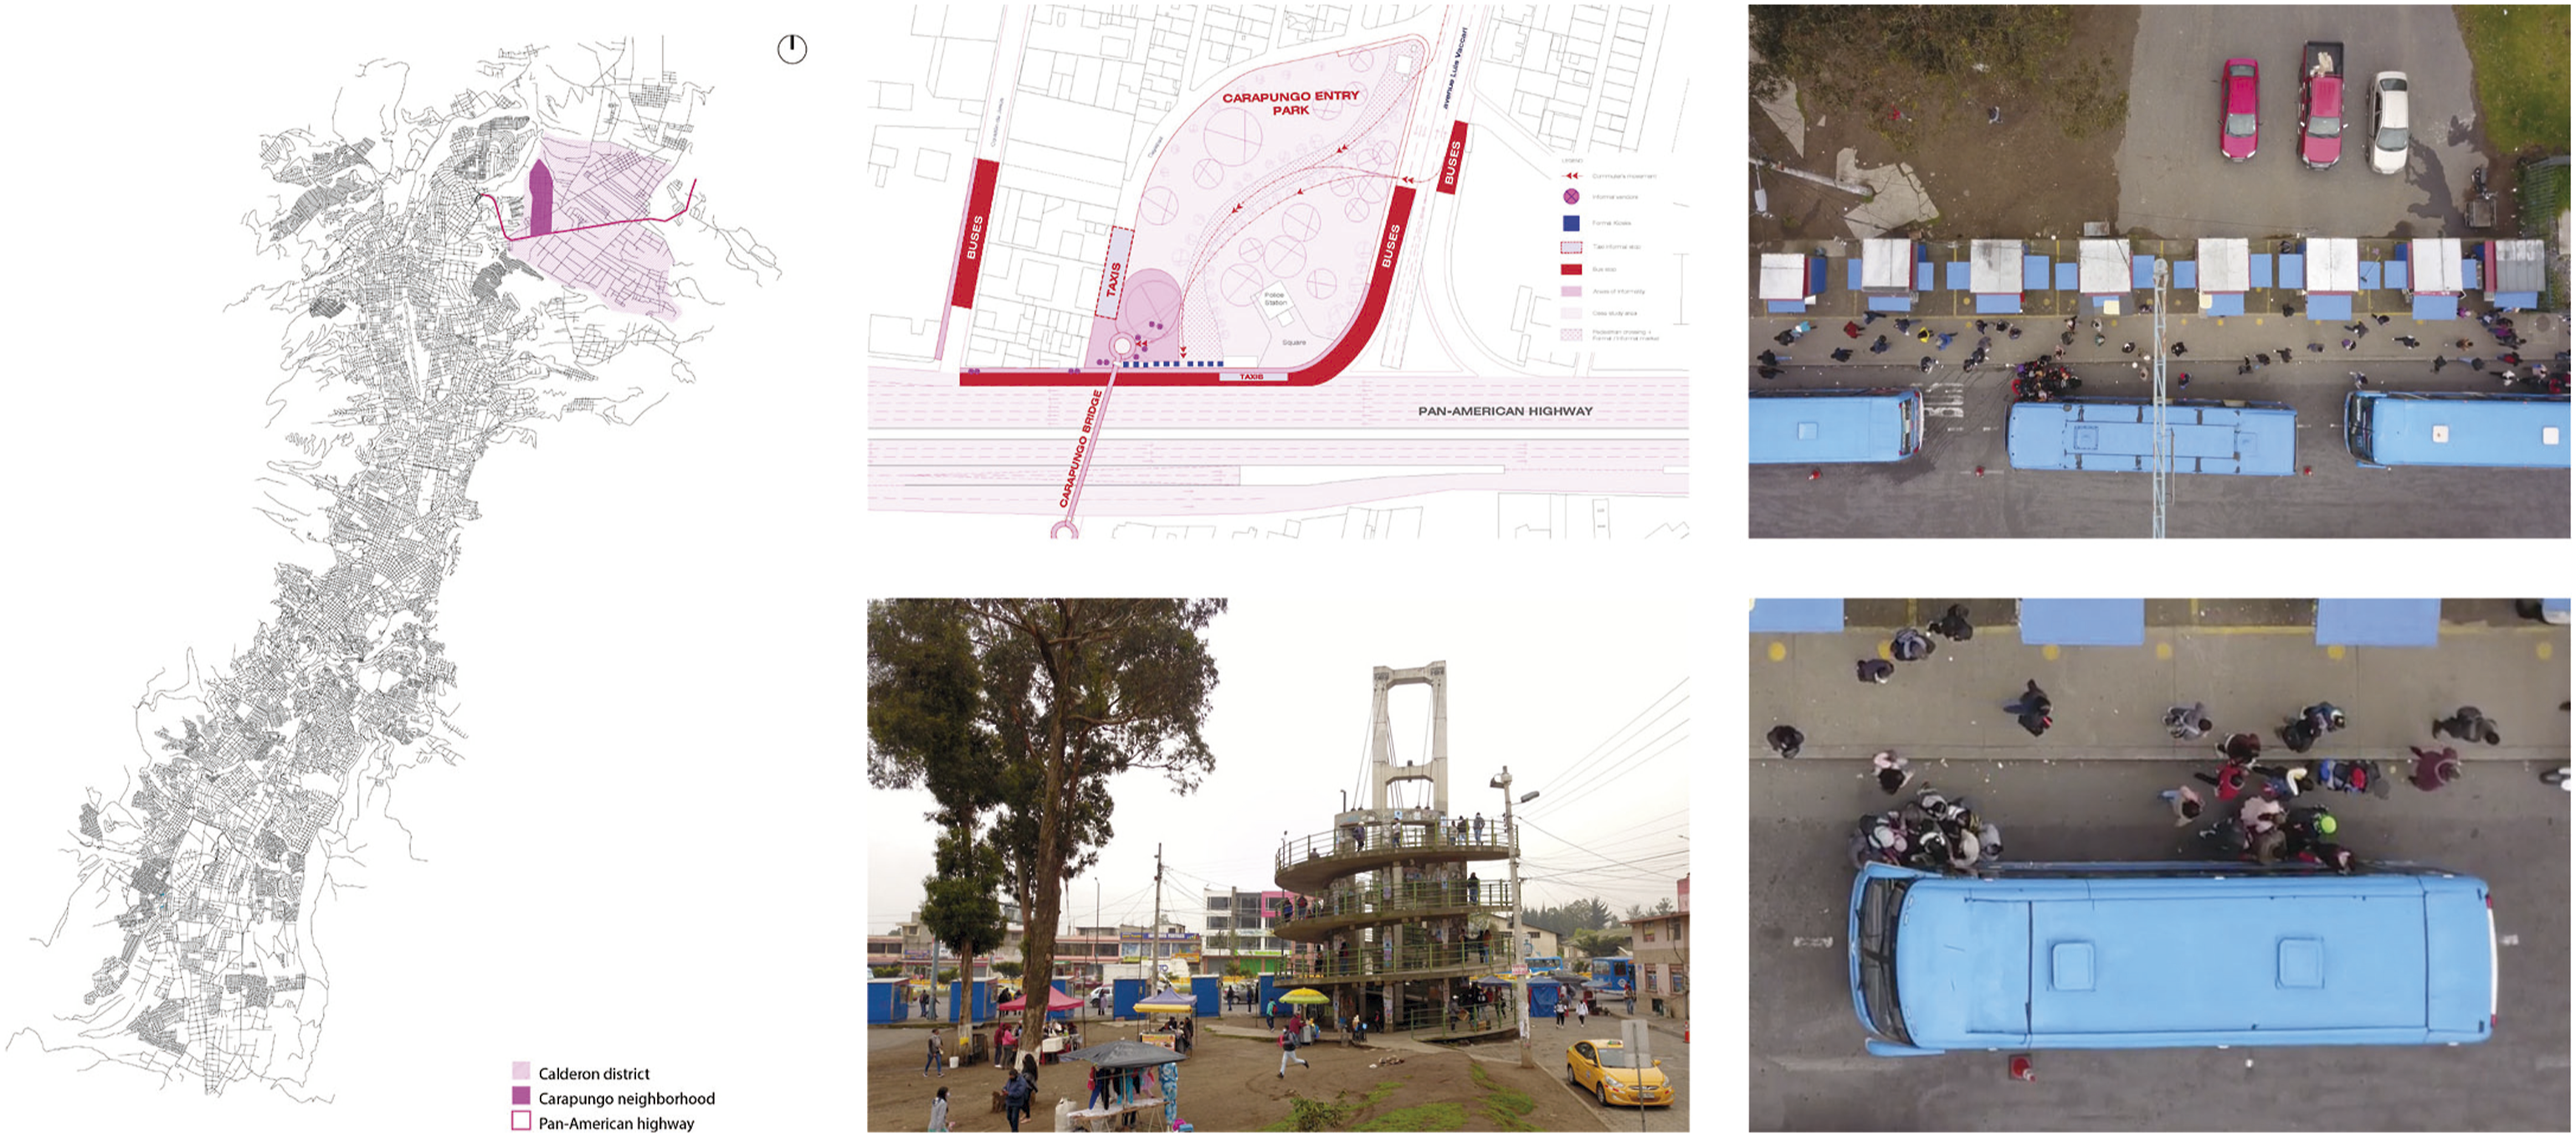
Carapungo case study is just not an eloquent example of small-scale urbanism or subaltern urbanism (Roy, 2011), but rather how pertinent is the implementation of novel and contemporary tools to make visible, analyze and look for soft design 1 solutions in such complex urban contexts. If urbanism has been mainly understood and represented in the 20th century through platonic forms and objects, Carapungo situation is able to broaden those conceptions in favor of more bodily, dynamics, informal and unexpected approaches with a wide repercussion in the urban fabric but also at people’s mobility and use of public space, which is the small scale. In such conditions, we propose this AI approach as an analytic, predictive, and make-decision tool to recognize and identify patterns of movement, occupation, and spatial relationships developed by passers-by, commuters, and traders.
State-of-the-art technologies in urban contexts: UAV and AI vision tools
Over the past decade, studies on city efficiency and urban flow have increasingly employed AI methods, utilizing recordings and images from both pedestrian and vehicular perspectives (Alahi et al., 2014). Our focus centers on people detection in urban scenarios, leveraging advanced algorithms like SSD (Liu et al., 2016) and YOLO—You Only Look Once—(Redmon et al., 2016), which can detect people with high accuracy and speed compared to semantic segmentation methods. Nevertheless, effective spatial analysis demands systems that incorporate plan representation (Pacheco Junior & Costa do Amaral, 2021). While satellite images are valuable for large-scale urban planning, decision-making on a smaller scale demands a deeper understanding of human actions, interactions, and dynamic object occupation. In this context, drone recordings as part of the field of Remote Sensing through Unmanned Aerial Vehicle have proven to be a precise alternative (Craye and Ardjoune, 2019; Tzelepi and Tefas, 2017), though they require specialized datasets and training models (ICG - DroneDataset, 2019).
Unlike satellite images, drone views often require monitoring, quantification, and individual detection rather than focusing on class proportions. YOLO object detection on UAV-captured video effectively addresses this, showing utility in micro-urban scales, such as people detection in crowded scenes (Gouiaa et al., 2021), monitoring physical exercises (Park and Ewing, 2017), mapping behavior in parks (Park, 2020), rescue operations (Półka et al., 2018), detection of illegal activities in urban areas (Tan et al., 2018), active target search in urban environments (Geyer, 2008), even the formulation of public policies (Butilă and Boboc, 2022). More recently, Hosseini et al. (2023) used aerial imagery to map sidewalks, aiming to understand pedestrian behavior and improve urban streetscapes’ friendliness.
Furthermore, Deep Learning (DL) and Computer Vision Techniques (CVT) have been applied to quantify passenger movements in urban environments using overhead cameras in train stations (Velastin et al., 2020). This study accentuated the deficiency in widely available datasets capturing aerial images of people, thus underlining the persistent challenge of detecting individuals from aerial perspectives. In their comprehensive review, Xiao et al. (2021) delved into recent strides in DL for pedestrian detection, with a predominant focus on footage from vehicle cameras. While their analysis underscored the efficacy of modern DL models, they highlighted the ongoing need for enhancements in datasets and image annotations.
This underscores a persistent gap in the analysis of aerial imagery, which serves as a critical information source for urban planning. Moreover, there is a notable absence of studies focusing on human scale and human behaviors in contested urban contexts within South America and the Global South—where such studies could fully realize their potential and utility due to informal urbanism. Often, research in this domain prioritizes larger-scale scenarios for the development of road, green, or blue infrastructure policies, neglecting the scale of the human body.
Specific goal and methodology
We aim to make visible the informal occupations, unpredictable displacements, and frugal relations in the public space of Carapungo’s Entry Park. To achieve this goal, we propose a methodology to automatically localize, identify, and visualize the following features: people detection, people counting and speed representation, flux quantification, area of occupation, and spatial relationships. By harnessing AI vision tools, we will create a variety of situated cartographies, which will capture both occupancy patterns (“Occupancy Cartographies”) and user count and speed tracking (“Count & Speed Cartographies”). These cartographies will be automated to provide insights to designers because they show areas with different occupational characteristics or current fluxes and uses. The overlap of these maps offers a crucible of opportunities that reflect diversity and respect at a simple glance for designers.
Methodology is based on a range of advanced DL algorithms. These include the Fully Convolutional Network (FCN) focuses on converting an-input image to pixel-level segmentation (Long et al., 2015); SegNet, built on an encoder-decoder architecture and employs a “skip-layer” to combine the encoder’s spatial and semantic information (Badrinarayanan et al., 2017); and U-Net, a popular biomedical image segmentation architecture (Ronneberger et al., 2015). While we share some similarities with the FCN, SegNet, and U-Net architectures mentioned above, we have customized our networks to address the specific challenges of our project more effectively, such as object detection and semantic segmentation for small informal urban contexts. Once the objects (pedestrians) have been identified, a distance-based approach is used to identify individual paths for each person. After the paths have been identified, flows and velocities can be calculated. The following section provides a detailed explanation of the entire process.
Data and methods: UAV-sourced data, computer vision techniques, and deep learning
Data obtained by the drone flight
For this experiment, we used high-accuracy UAV images obtained from drone-based aerial recordings. The drone—DJI model—was flown over the border of the Pan-American Highway and Carapungo Park Entry on February 9, 2022, between 6:25 and 8:21 a.m. The UAV reached an altitude of 30 m during the entire recording, being able to cover an image of 70 × 30 m, with a definition of 4K pixels. We recorded 9 areal videos of approximately 60 s, and 6 videos showing the environment. To this article, we selected one aerial video that presents spatial tensions among the sidewalk that performs as a bus stop, people trying to get in and out of a bus, passers-by trying to avoid the passengers’ current, and how buses go by and stop in between the highway lines and not in the supposed area to stop. These different situations happen in the lapse of 60 s, portraying the complexities of such space, which can be replicated and extrapolated to other similar situations.
For this project, we selected a one-minute video that captured the complexity of the area, notably highlighted by the arrival of several buses during rush hour. To process the data, we extracted 1452 frames, at a frame rate of 24 fps, from the original one-minute video (60.5 s). For the background removal process, we reserved 252 frames to train the background subtractor. The remaining 1200 frames, equivalent to 50 s, were utilized for people counting and velocity calculation. The original one-minute full-size aerial video (4096 × 2160) was also cropped into a modified version (4096 × 1640). This choice was made because the Pan-American Highway at this location features twelve traffic lanes, including high-speed lanes, which posed a challenge for the machine learning model in accurately recognizing people’s movements.
In this one-minute drone video, captured at an altitude of 30 m, we employed two methods: Computer Vision Techniques (CVT) and a Deep Learning (DL) model based on YOLOv5 training. This choice was due to CVT being more efficient in counting and tracking moving individuals, while YOLO yielded better and more accurate results in detecting people when they were in stationary groups, thus, it was used for spatial occupancy analysis. In the following section, both methods will be outlined, utilizing two pipelines to illustrate the process of segmenting the moving actors in the urban scene, identifying them, and ultimately quantifying and visually representing them (Figure 2). “Computer Vision” and “Deep Learning” techniques from video to shape detection and data analysis. Authors, 2024.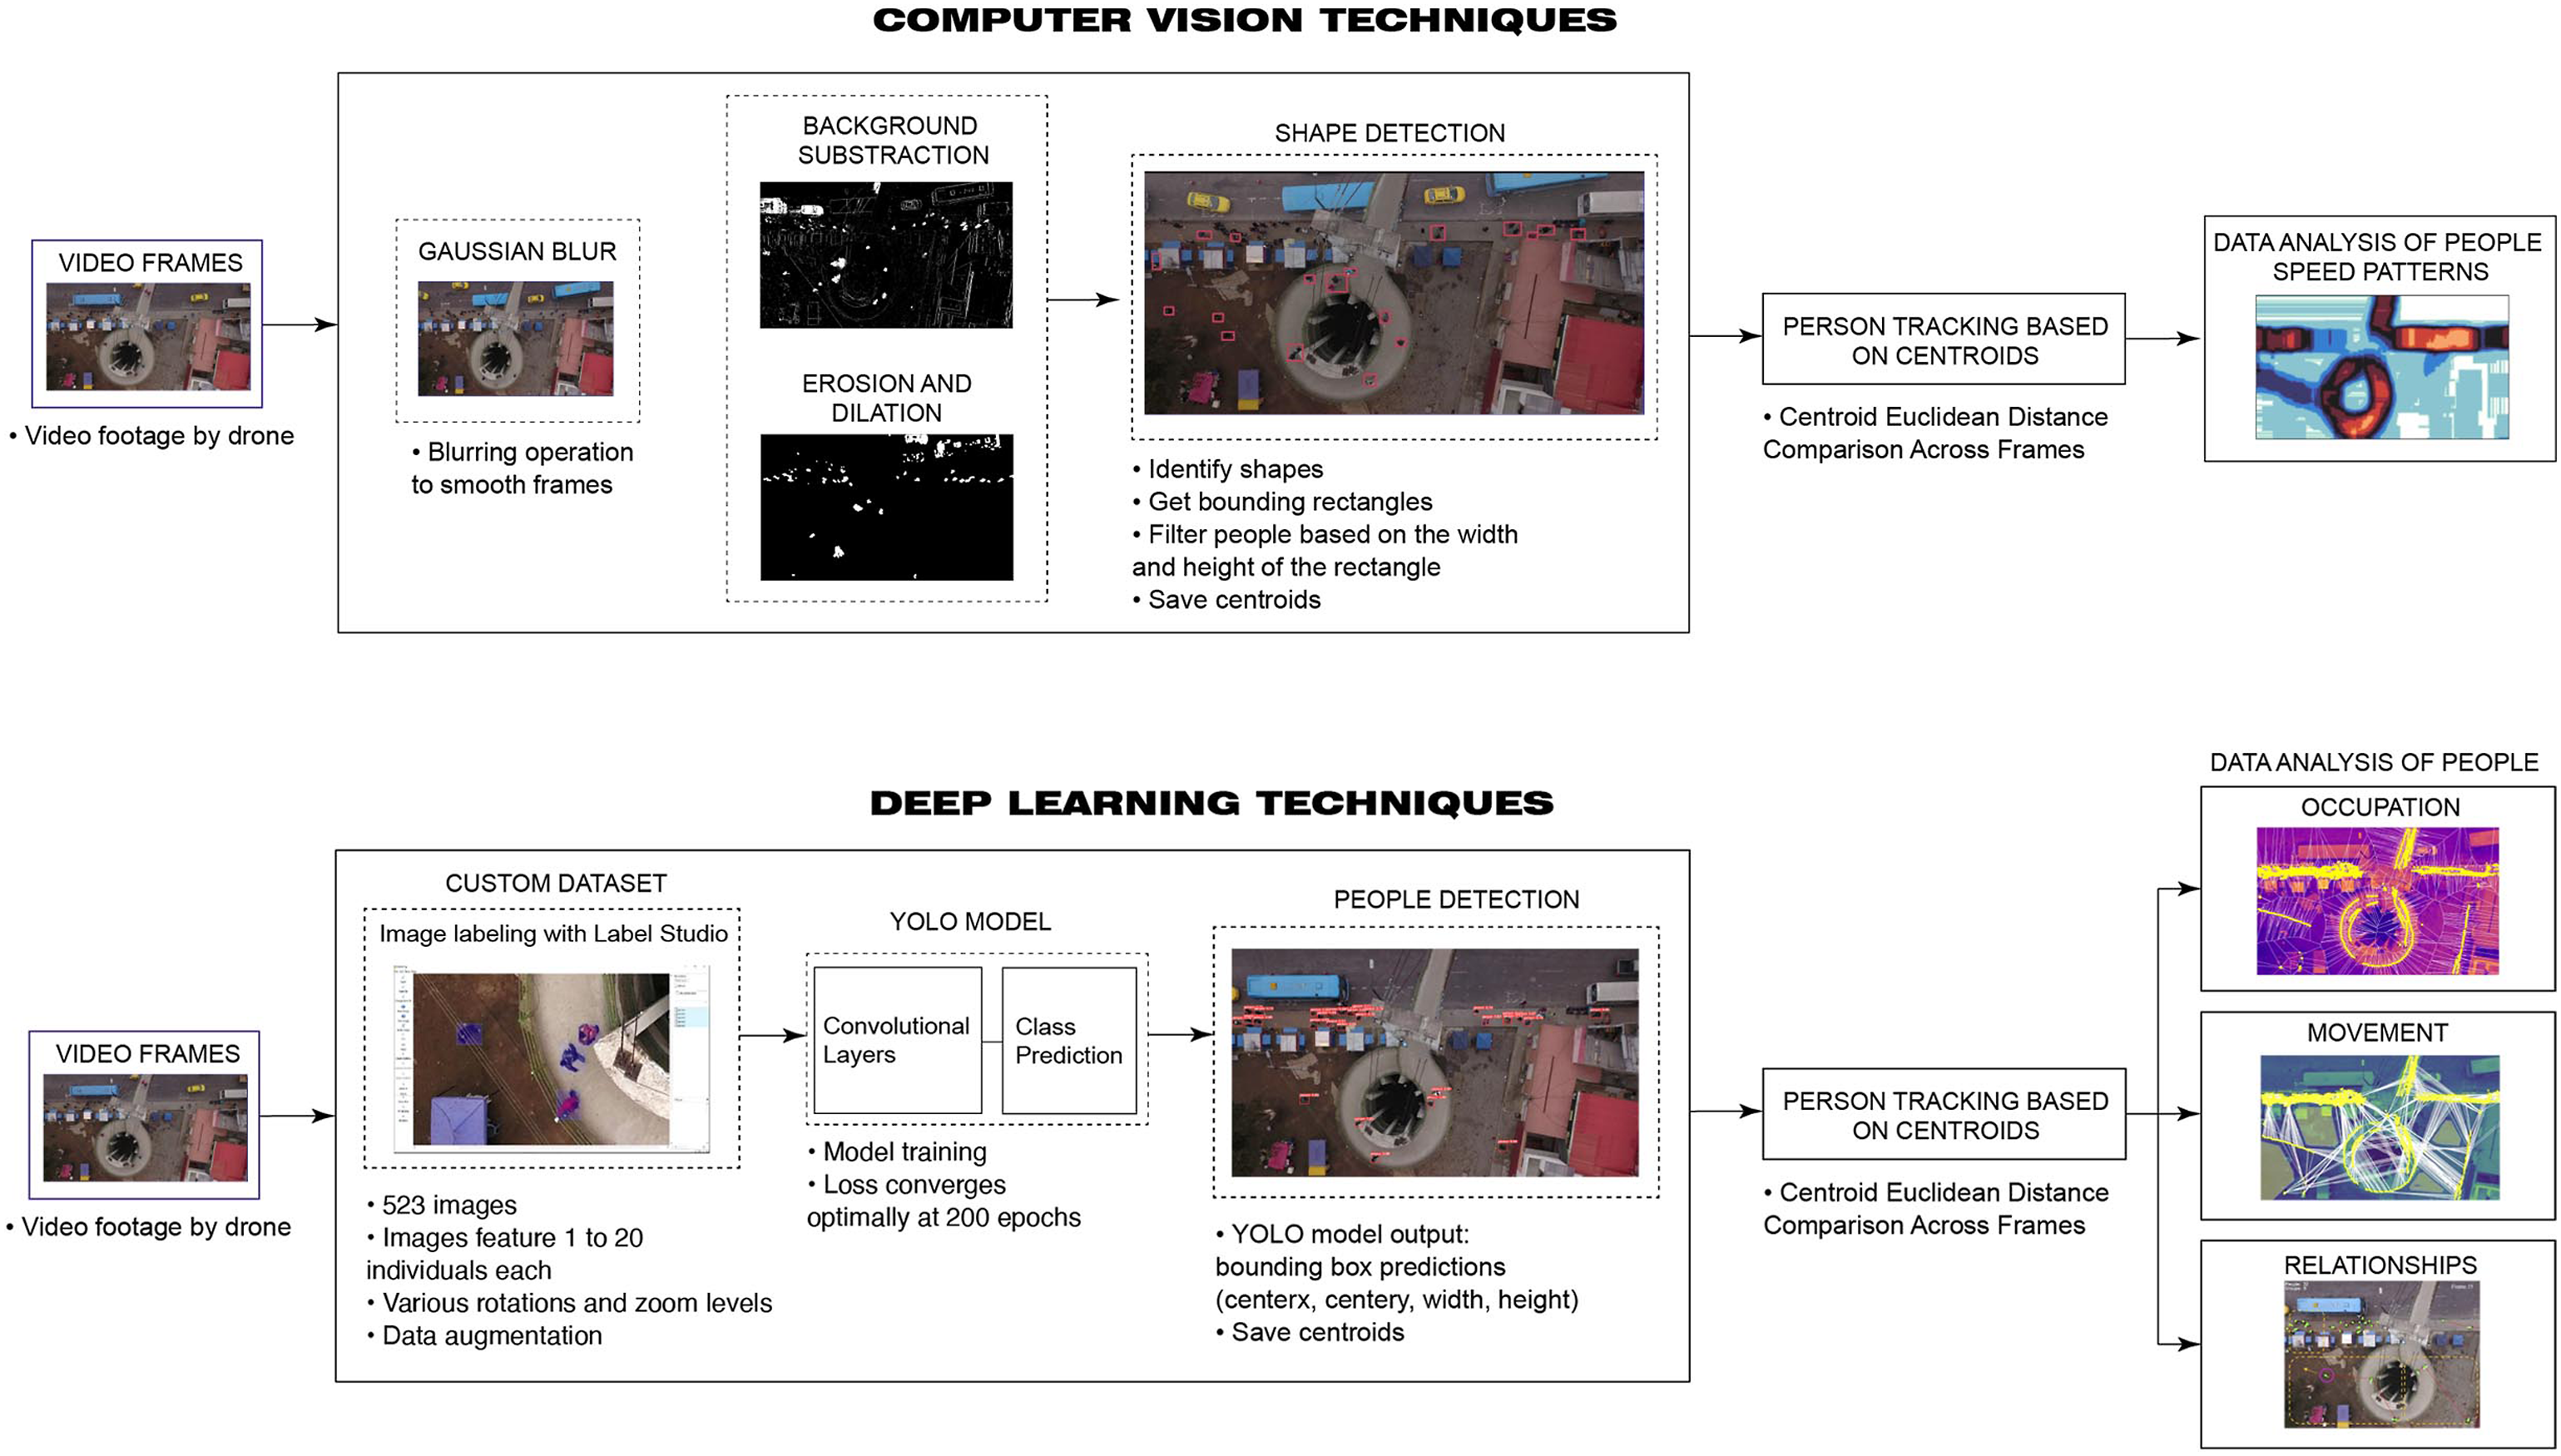
Computer vision techniques
CVT were employed for individual identification in the video. The extraction of moving object shapes within video frames enabled real-time motion capture and analysis, eliminating the need for predictive model training (Bramich, 2008; Singla, 2014). This process was conducted using the OpenCV library.
First, a Gaussian blur filter was applied to optimize background subtractor performance. Subsequently, background subtraction yielded a binary image displaying only the moving objects. As has been shown in the study of Thakur et al. (2015), morphological operations can improve the segmentation of moving agents. Erosion reduced noise by shrinking foreground object boundaries, while dilation filled gaps and connected fragmented regions (Aslani and Mahdavi-Nasab, 2013).
We utilized a contour detector to outline shapes with bounding rectangles, which enclose shapes with minimal additional space. By imposing specific size criteria on these rectangles, we isolated human shapes while excluding vehicles. Tracking humans involved computing the centroid of each retained rectangle, serving as a central reference point for individual locations. Finally, we stored the collected positional data for subsequent analysis of people’s behavior within the designated area.
Deep learning model
The experiment centered around processing and representing moving actors has various merits for activity measurement and circulation prediction. However, challenges arose in distinguishing between occupancy roles and accurately quantifying stationary individuals, often leading to confusion with the background surroundings. To address these challenges, detection mechanisms based on DL were adopted to identify both moving and static individuals. Consequently, a parallel approach was taken, utilizing the YOLOv5 Deep Learning model ((Zhu et al., 2021) Ultralytics/Yolov5, 2020/2022).
We manually labeled specific frames using the YOLO format in Label Studio (Label Studio, 2023), resulting in a dataset of 523 images, each containing 1 to 20 individuals. Additionally, a validation set of 93 images with corresponding labels was prepared for model evaluation (Mokayed et al., 2021).
The images were standardized to a default width size of 640 pixels. Data augmentation, including mirroring techniques, quadrupled the dataset to enhance the model’s generalization capabilities. A batch size of 16 was employed during training. The model achieved optimal loss convergence at epoch 200, with precision and recall reaching stability after epochs 50 and 100.
VAL/box_loss metrics and results along epoch.
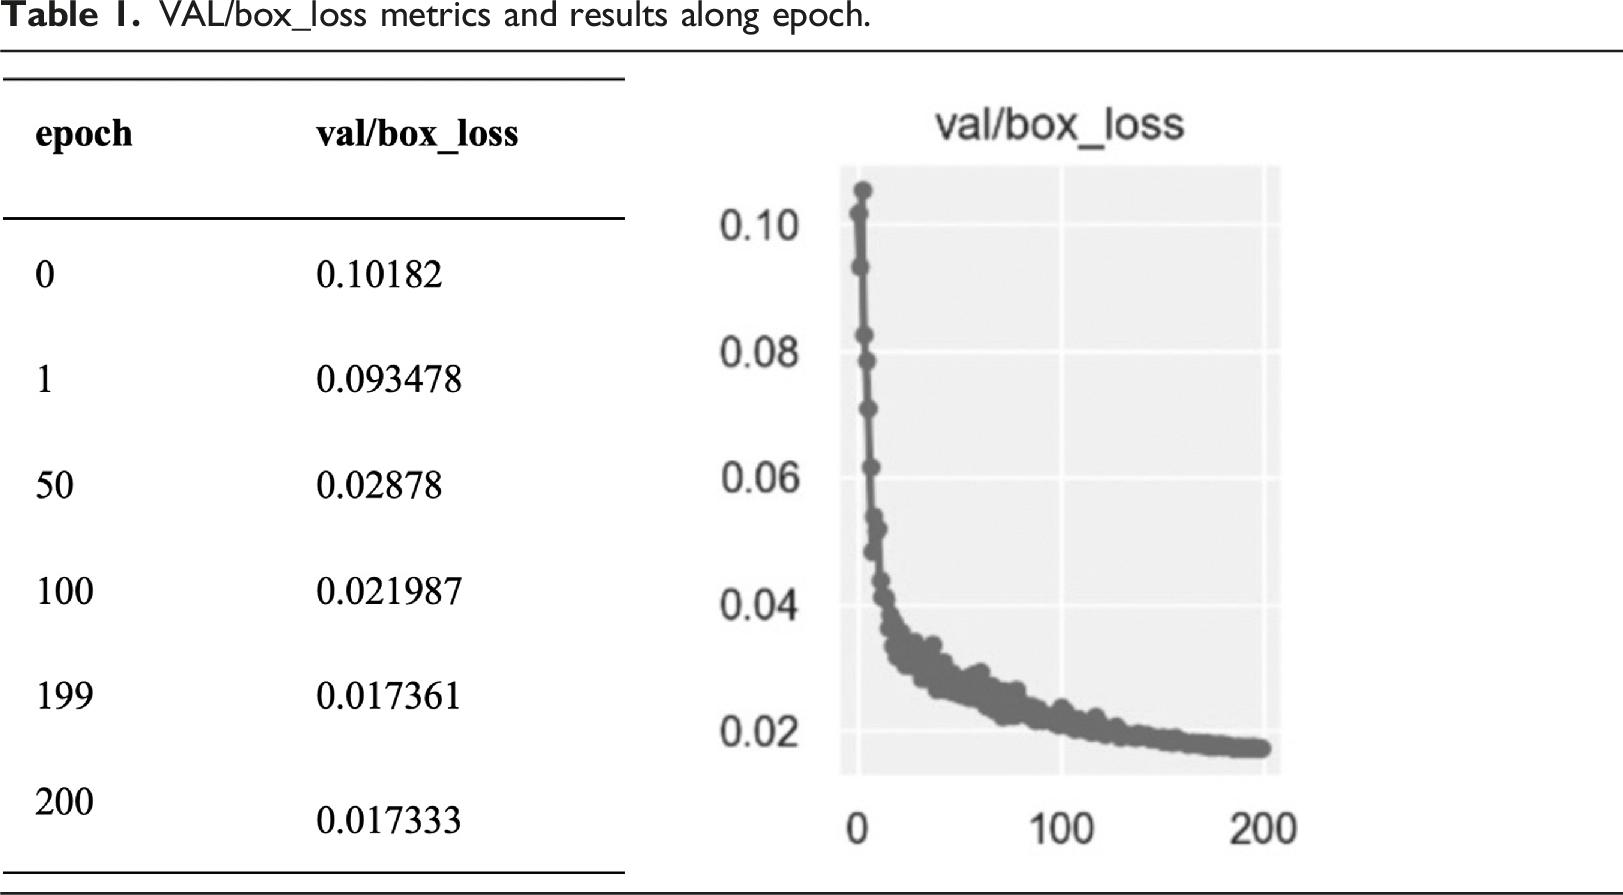
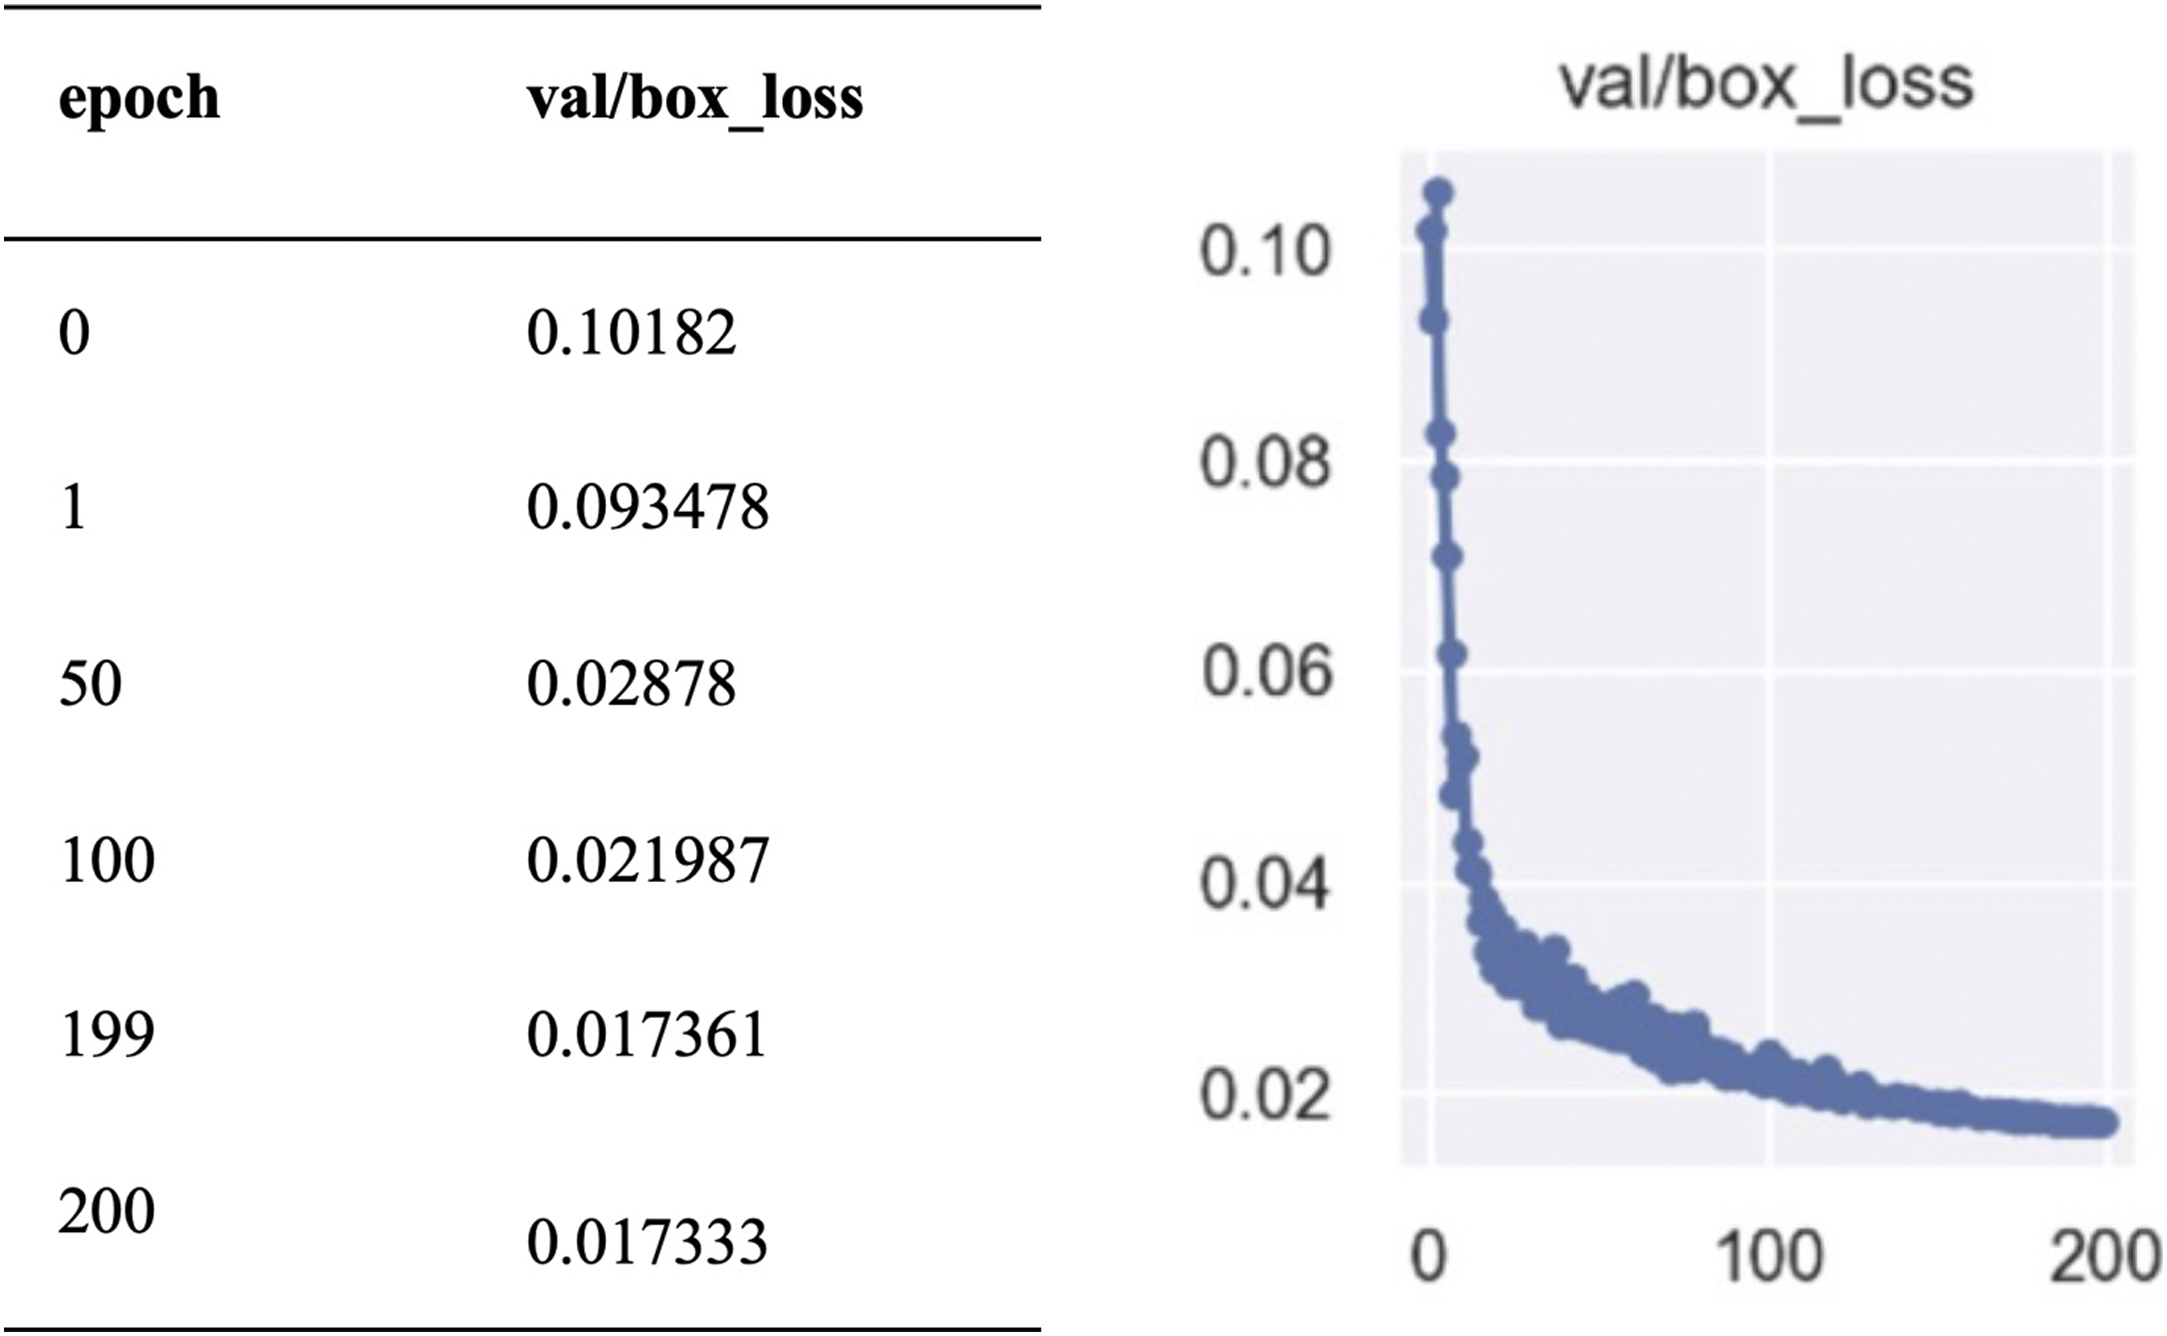
Post-training, the model accurately detected individuals in videos, providing bounding boxes with centroid coordinates for seamless integration with CVT for further analysis and tracking.
Discerning distinct paths of individuals in the video
Both CVT and DL provided identical formats for determining people’s positions: the centroid of the bounding box. Leveraging this data, our objective is to track individuals’ positions throughout the video. Initially, we calculated the distances between a single point in the current frame and all points in the subsequent frame using the Euclidean distance:
In each frame, we compared the positions of points (x1, y1) and (x2, y2) to find the closest pair. If their distance was below a predefined threshold, we linked them, assuming they represented the same person, and assigned a unique identifier (ID). This process continued for all points in each frame, allowing us to track individuals consistently throughout the video sequence.
Situated cartography: Contextualizing Carapungo entry park
As a link between the method and the results, the production of a cartography that serves to situate the research emerges, a foundational cartography we term “situated cartography.” Building on the concept of “situated knowledge” (Haraway, 2013), we stress the significance of understanding the spatial context to attain a profound, realistic, and “situated” understanding of Carapungo Entry Park dynamics, which is divided in the next regions: Bus Stop L (left), Bus Stop R (right), Ramp Entrance, Cantina, Bridge, Platform, and Building Edge.
We chose an unsupervised learning method based on proximity and two-dimensional distances happening in X and Y coordinates—Euclidean distance. This method, known as “Nearest Neighbor” (G. Gutin, A. Yeo and A. Zverovich, 2002), associates each individual with the subject at the shortest Euclidean distance with respect to itself. It is a recursive solution that makes possible to identify different relationship schemes and areas of occupation, as well as the interaction trend between people.
It is considered that, beyond architectural barriers (buildings, roads, lakes, etc.), the space occupied by each individual encompasses the maximum possible territory up to the space occupied by another individual and in the same proportion. Thus, the border that separates the territory occupied by a subject is half the distance that separates it from the closest subject. Following a Voronoi scheme by joining the subjects together and representing the perpendicular bisectors of the joining segments, it conforms a series of polygons in two-dimensional space or Thiessen Polygons—Voronoi Diagrams—(Aurenhammer and Klein, 2000).
Cumulatively between each frame, and ignoring the territories established by minimum distances (subjects compared to themselves between frames or compared to other subjects that travel the same space), the algorithm applied to the detection model yields relevant planimetries that expose the trends of occupation of human groups (Figure 3). Top: Evolving occupation frontiers generated by Voronoi algorithmic people detection (pedestrian movement shown in yellow). Down: Highlighted areas of detection (hence, different design strategies should be considered in each area). Authors, 2024.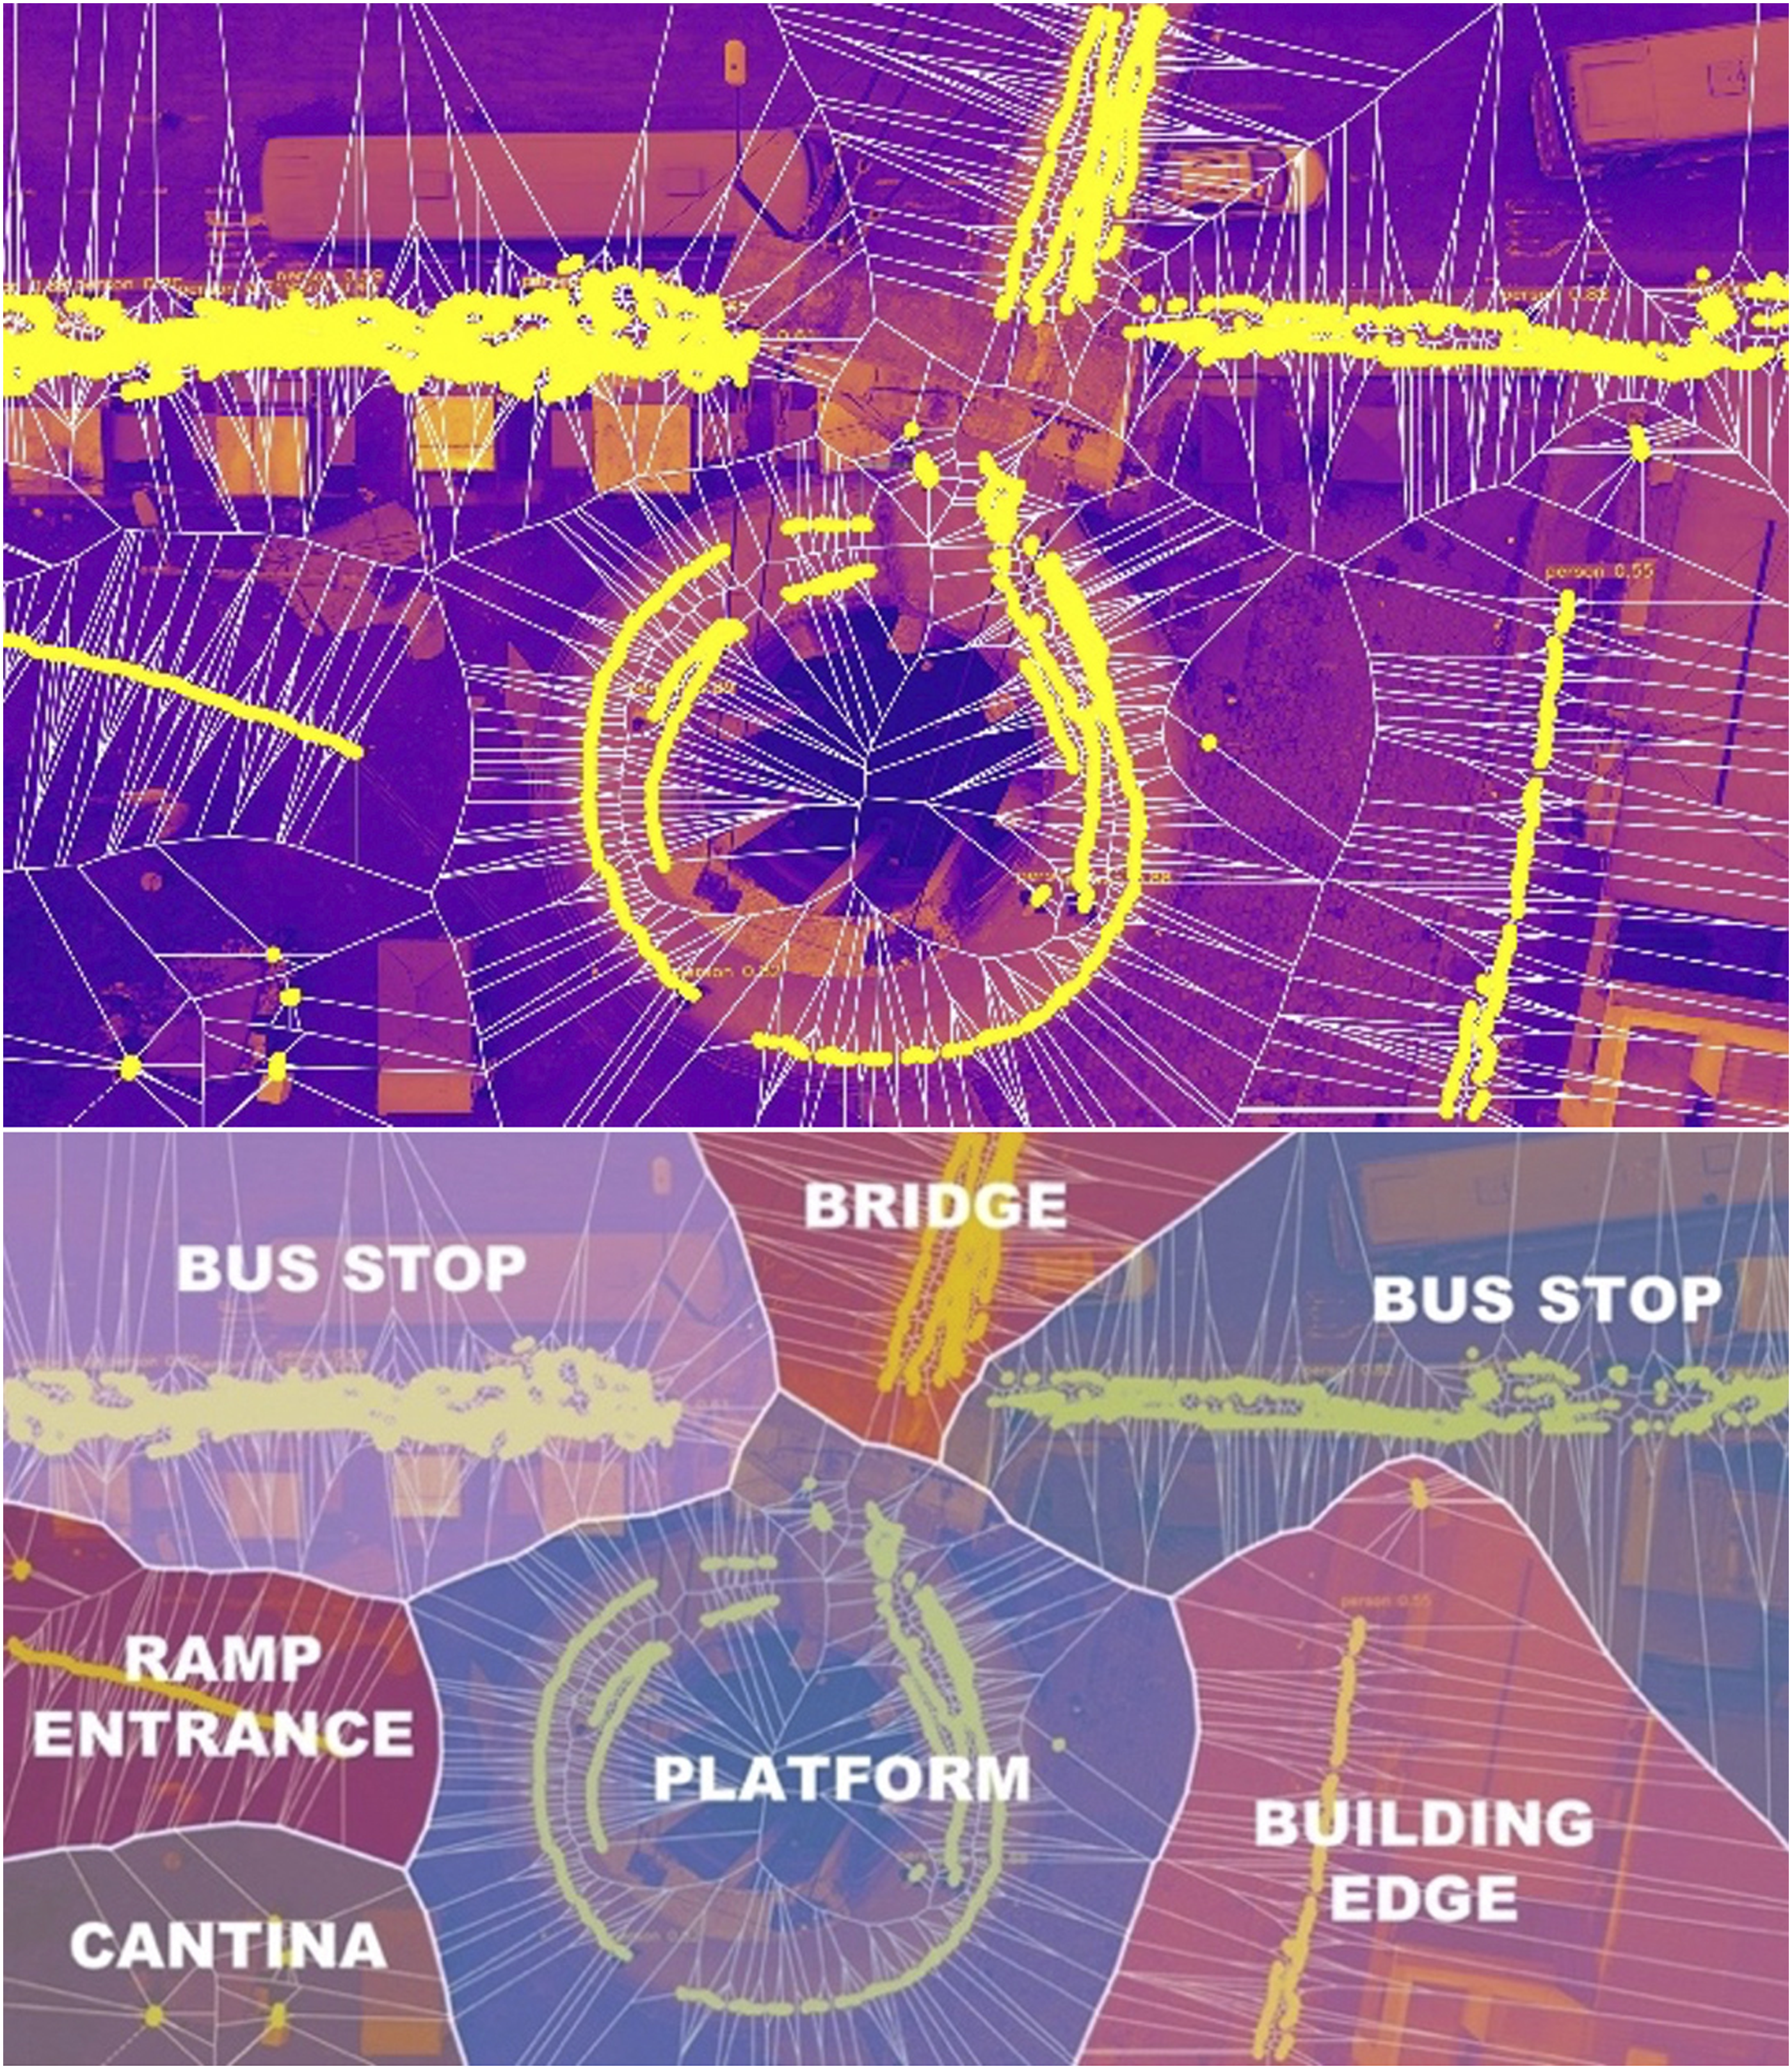
Results: Mapping occupancy and speed dynamics
With the application of CTV and DL methods, we create situated cartographies in Carapungo’s Entry Park to make visible the socio-spatial dynamics in a graphic, effective, and precise way. These cartographies not only detect human bodies in a complex informal public space but also identify their most common relationships and potential interactions in small-scale environments.
The results are divided into “Occupancy Cartographies,” where occupancy patterns are analyzed, and “Count & Speed Cartographies,” where user count and speed are tracked.
Occupancy cartographies
The situated cartography makes possible to identify when an individual cease to belong to one environment and begins to belong to another based on the location of other subjects and allowing the identification of inflection or breaking points in the same track. As illustrated in Figure 4, a person with a comparable Euclidean distance to different groups ceases to belong to the platform environment and begins to be associated with the bus stop environment. This individual occupies distinct territories during different temporal windows (frames 15 and frame 16). Cartographies in relation to occupancy with the built environment. Authors, 2024.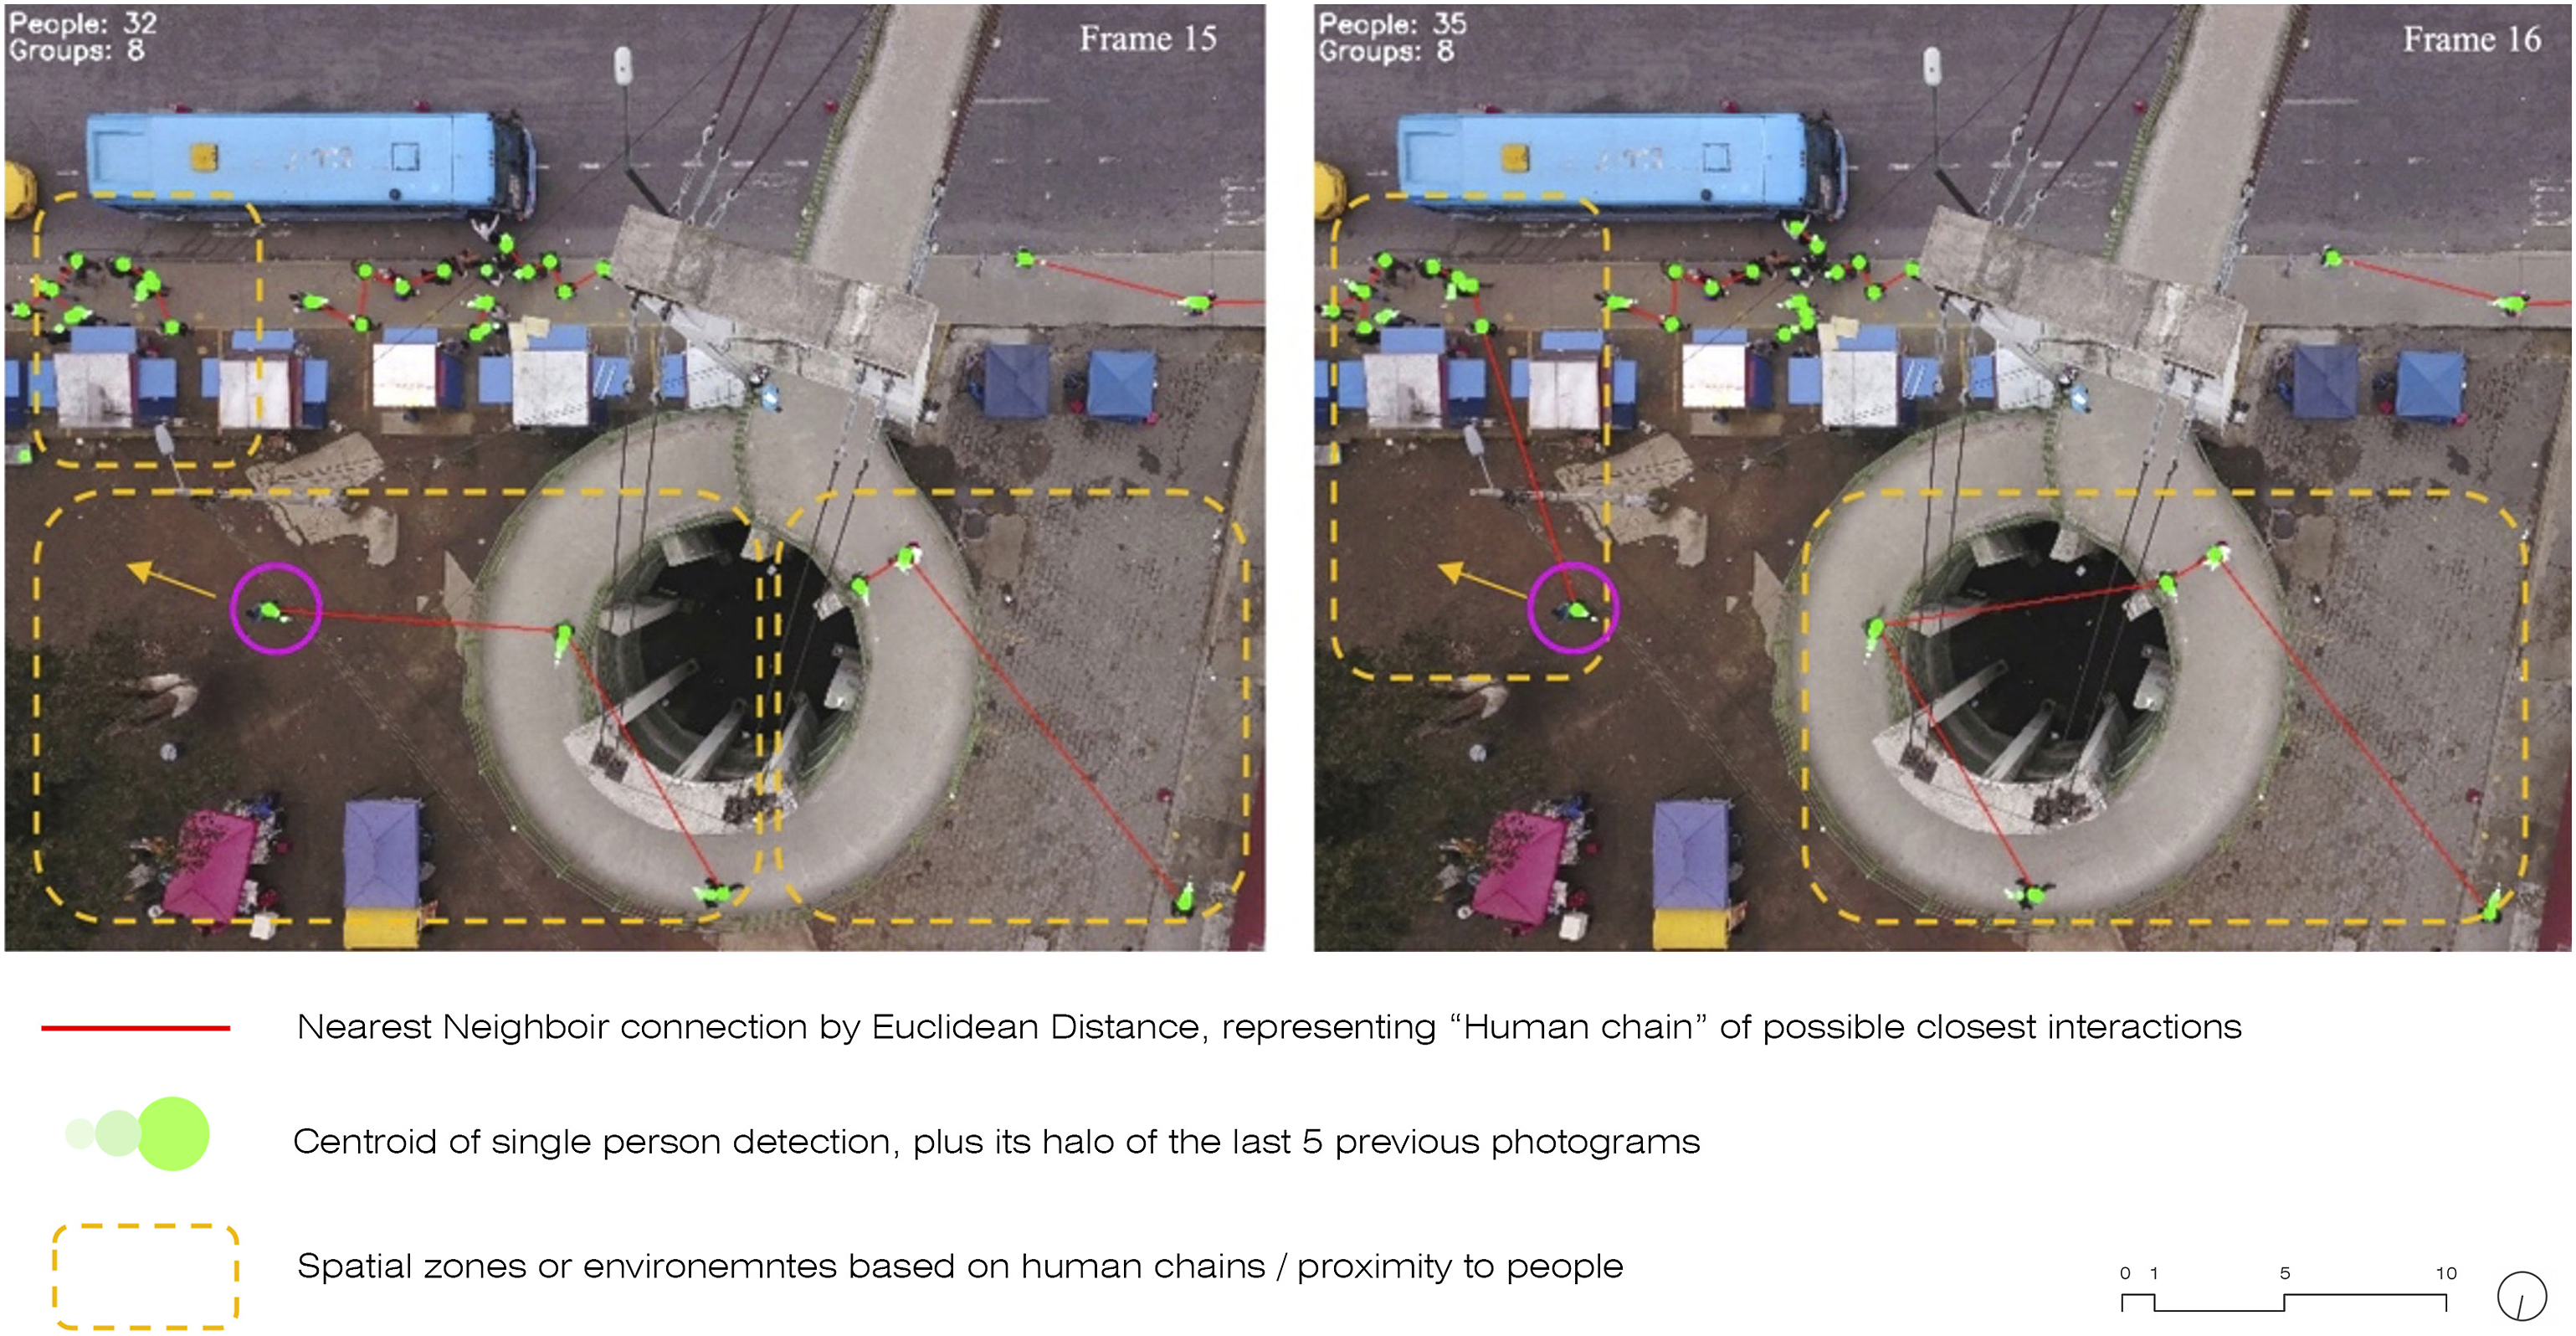
Those areas untouched by relational axes indicate environments with a limited tendency for people interaction and, consequently, a low level of occupation (Figure 5). This is especially notable as Carapungo Entry Park is a transit area where individuals consistently seek the quickest or most visually accessible route towards the Pan-American Highway to check for their bus’s arrival. Acknowledging this observation, these spaces stand out as potential candidates for future projects. The minimal human activity and interaction in these zones suggest the prospect of introducing new initiatives or developments, offering opportunities for strategic planning and the optimal utilization of these currently underutilized spaces. Agglomerative models based on pedestrian nearest neighbor links show four low-occupational-rate areas (design opportunities). Authors, 2024.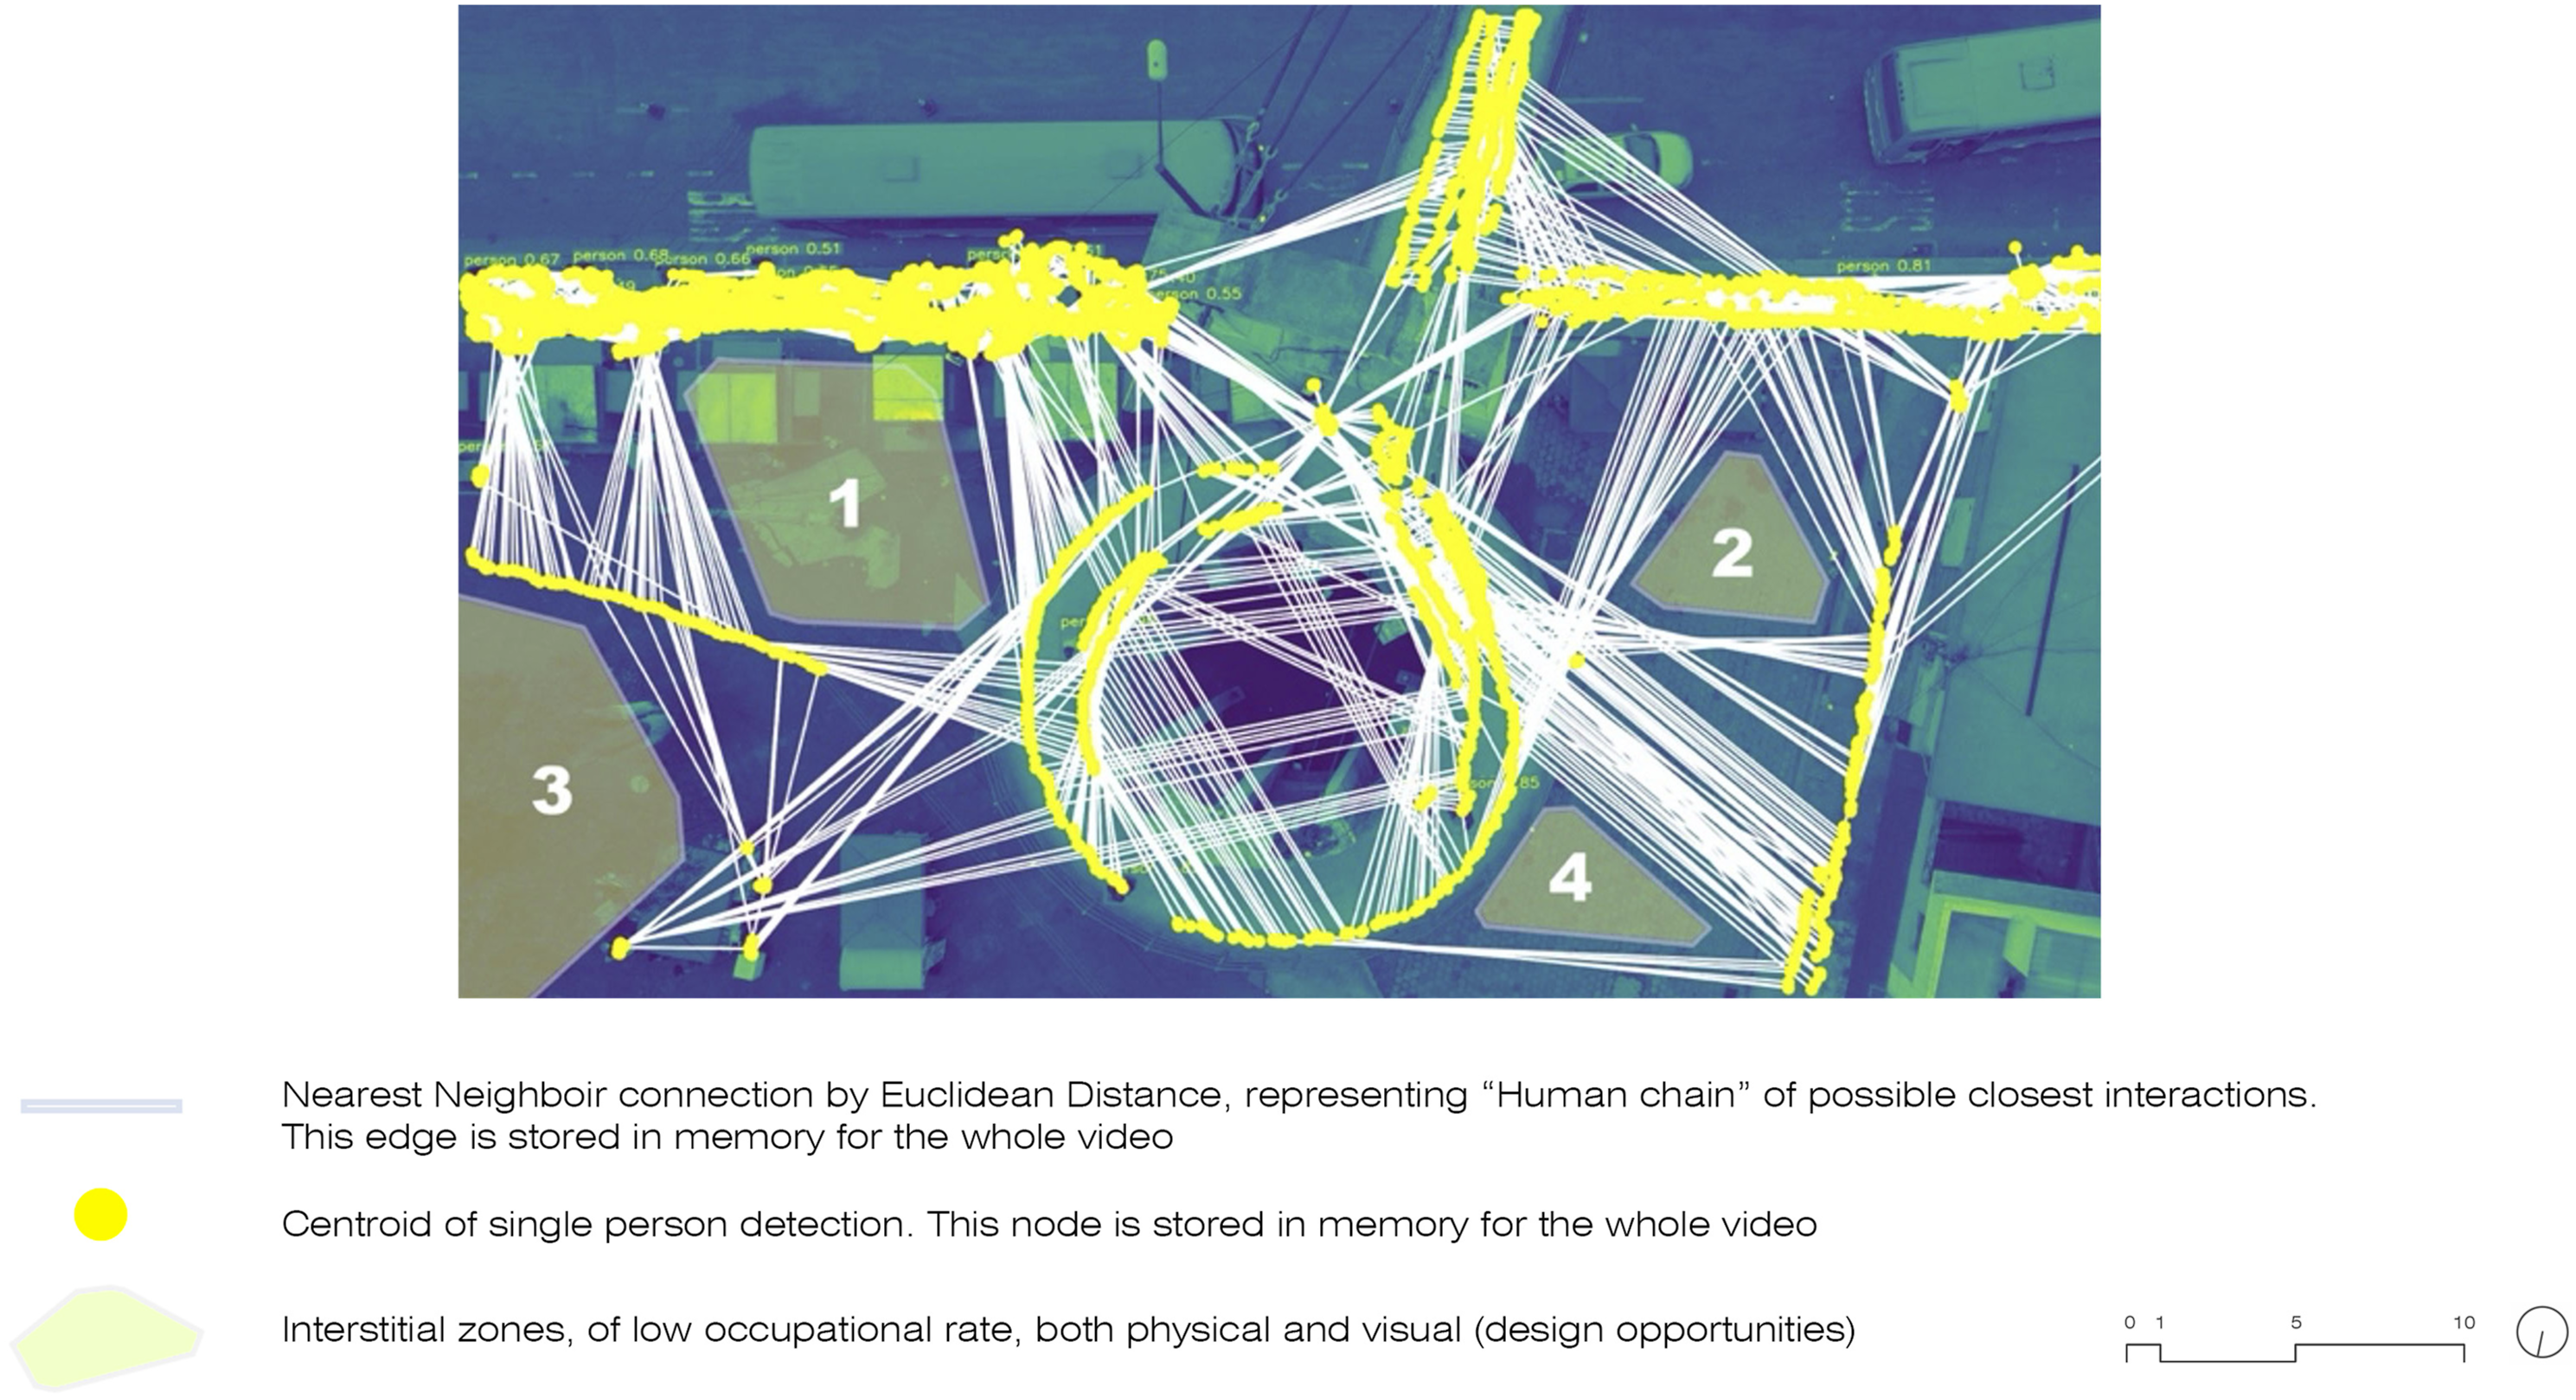
Population counts & speed cartographies
We have made visible the “fluctuation in people count” and the “variations in their velocity” throughout the video in relation to the specific location through three different graphs, with the aim of critically comparing their strengths and weaknesses. The visualization methods used to present this information are as follows: “Timeline Graph,” “Strip-Diamonds Graph,” and “Stacked Area Graph” (Figure 6). “Timeline,” “Strip-Diamonds,” and “Stacked Area” graphs illustrating population count and speed of movements. Authors, 2024.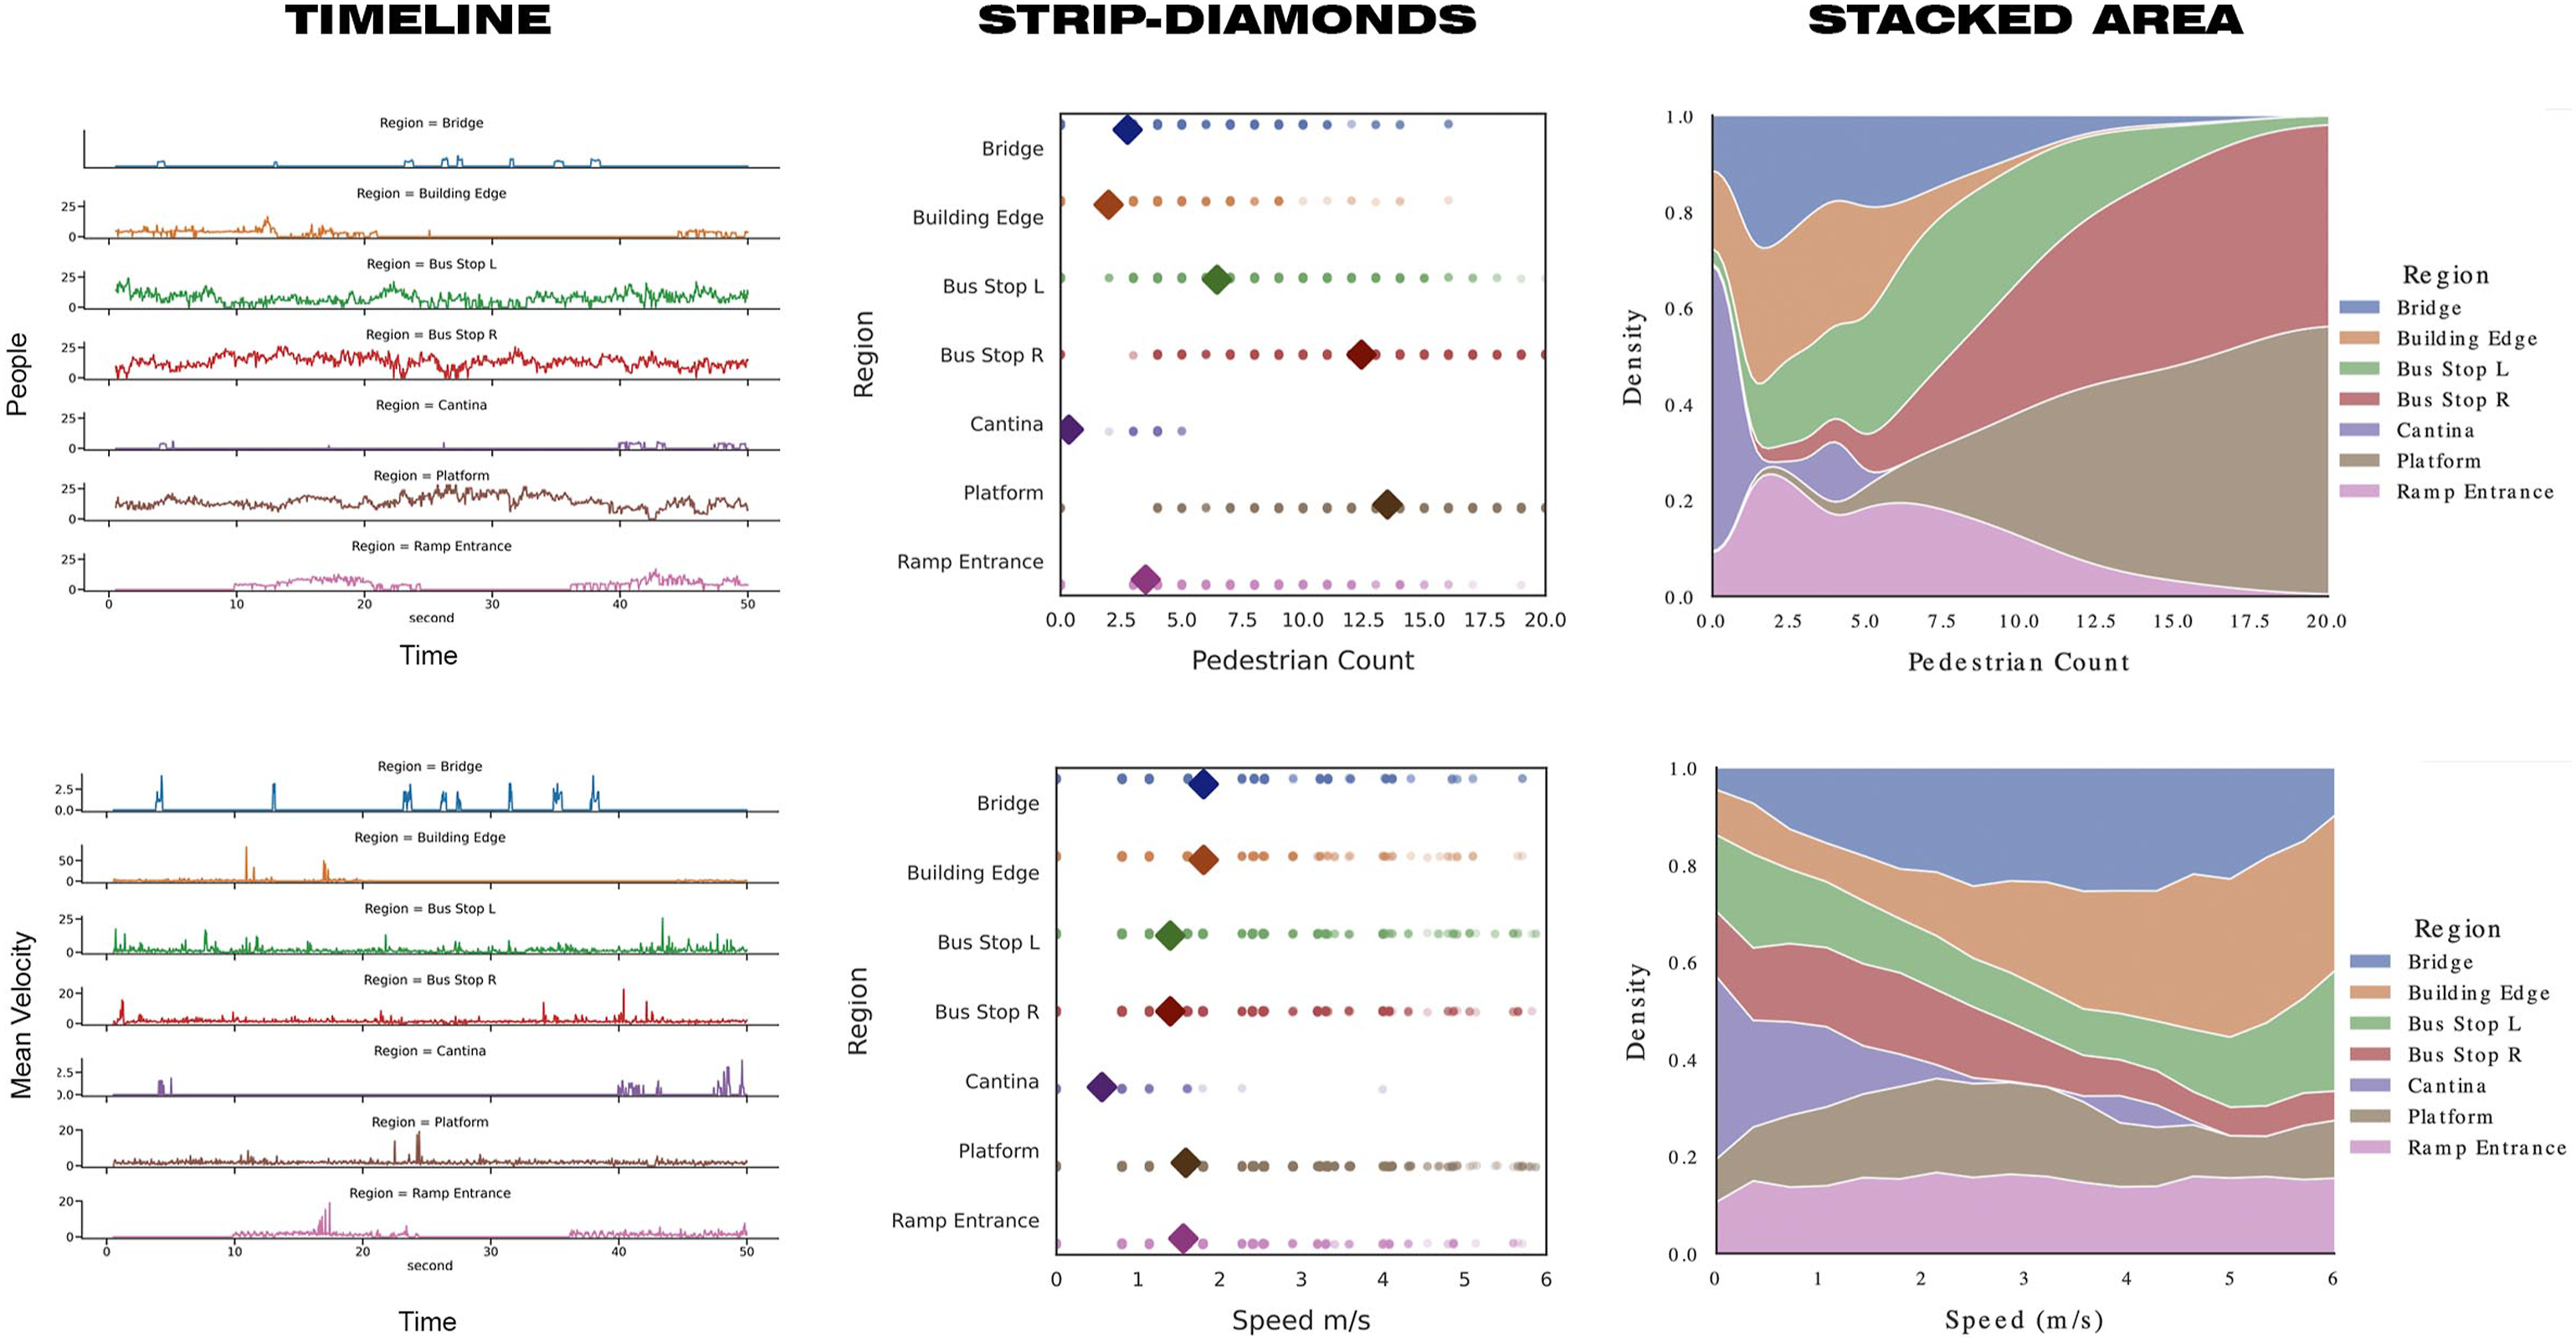
In the three graphs, we can see how Bus Stop R, Bus Stop L, and Platform are the regions that accommodate the highest number of people, evidencing how many people cross the bridge to reach the bus area and how people move incessantly along the entire Pan-American Highway without knowing exactly where their bus will stop. While the “Timeline Graph” shows a higher and constant number of people at both bus stops, both the “Strip-Diamonds” and the “Stacked Area Graph” emphasize that there is more population at the platform and at Bus Stop R. It is worth noting that the diamond-shaped symbols represent the average population count for each distinct region. Furthermore, there is no doubt that the region with the fewest people is the area near the cantina. However, the “Stacked Area Graph” depicts a significant crowd gathered at the cantina early in the video, suggesting that this diagram may have limited relevance for our objectives.
In terms of speed, we can observe that the graphs are even less similar, allowing us to analyze and compare which one is the most useful. In the “Timeline Graph,” we observe a constant movement in both bus regions, emphasizing the restless anticipation of people awaiting the bus’s arrival. We also see spikes in speed over time in the other regions, illustrating how people rush through those areas punctually to catch the bus. The bridge area and the cantina stand out, with the latter being unrepresented in terms of the number of people but now noticeable as some individuals rush through there towards the end of the video to catch their bus on time. In the “Strip-Diamonds” graph, we notice that it extrapolates the results and lacks the precision of the previous one. However, by looking at the diamond, it shows that the mean speed remains relatively consistent across all regions, except for the Cantina, where a more relaxed pace is observed. Similarly, the “Stacked Area Graph” provides extrapolated values, with the Entry Ramp area taking center stage, despite its almost negligible presence in the “Timeline Graph.”
In conclusion, the “Timeline Graph” offers the most specific information and precise information for counting people and speed. It allows us to pinpoint specific moments of activity, such as individuals rushing to catch the bus, rather than relying on extrapolations that may distort reality, as seen in the “Stacked Area Graph.”
In our final analysis, we develop a heat map designed to visually represent smoothed speed values within the zone captured in the video (Figure 7). In this cartography, the color scheme serves as a visual indicator: cooler colors, such as blues, represent lower speeds, while warmer colors, like reds and oranges, signify higher speeds. This heat map allows us to discern notable patterns in population movement. Particularly, we observe that the Bus Stop R region appears as the hottest spot on the map. This suggests a significant concentration of high-speed movement within the area. Heat Map of population speed in the video. Authors, 2024.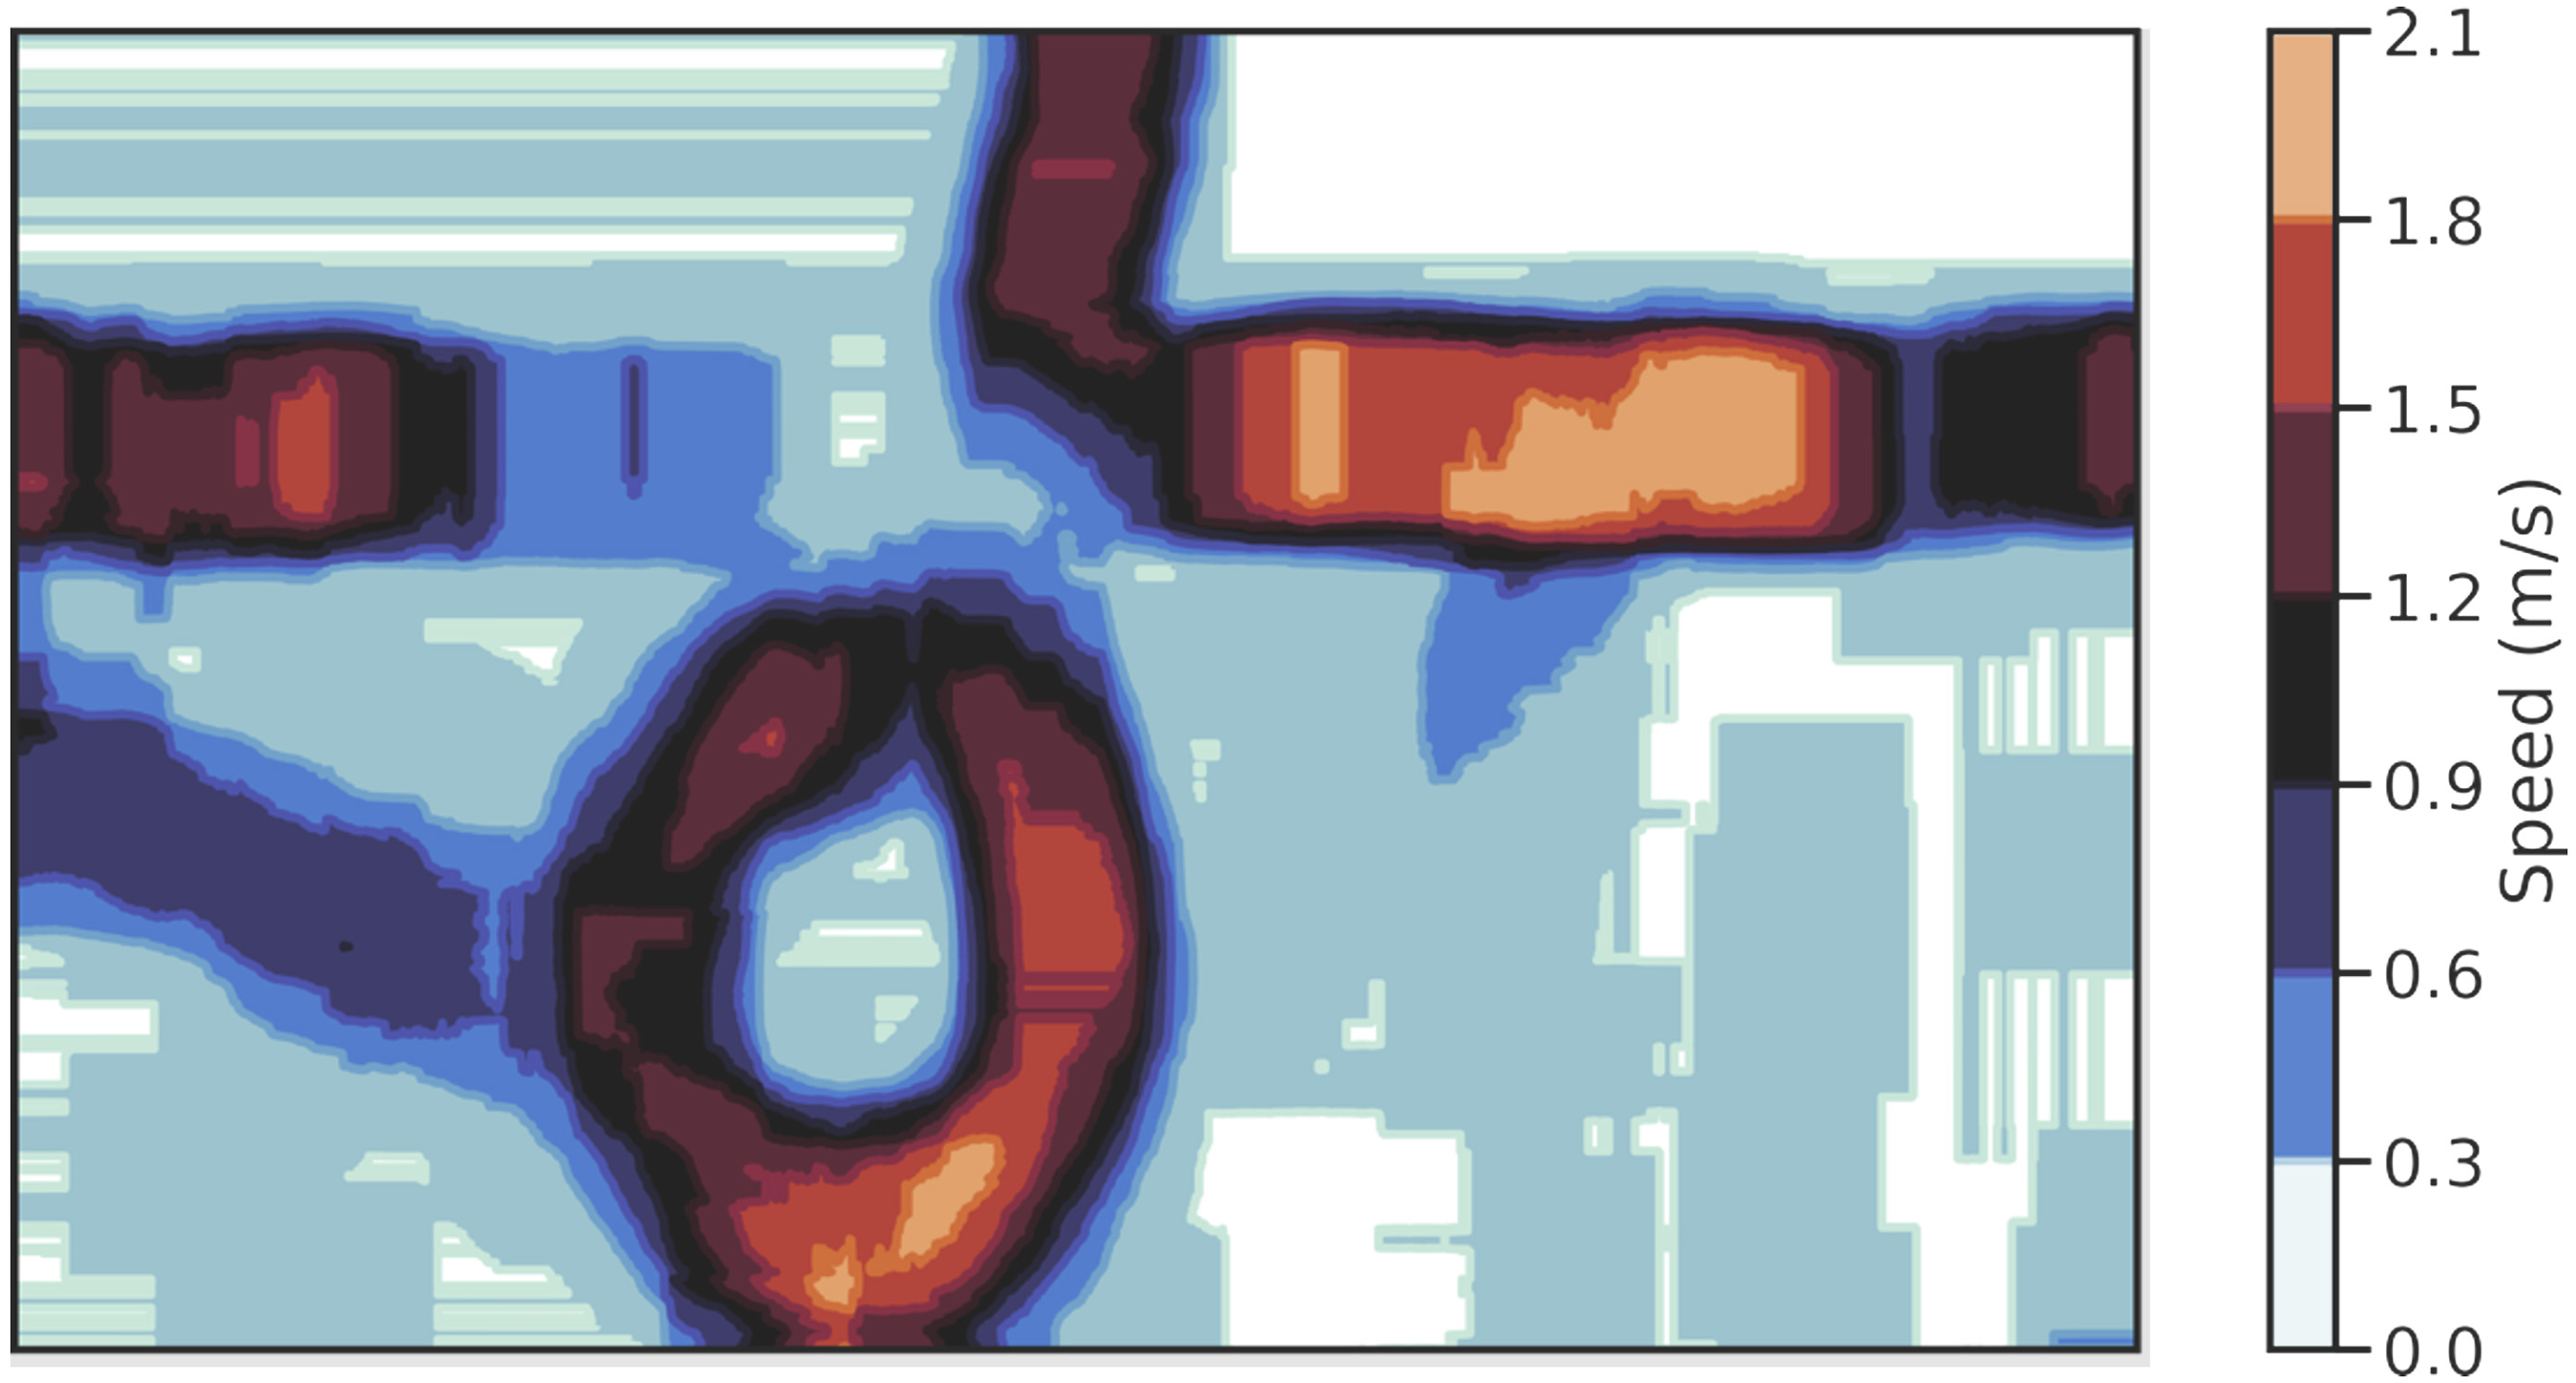
Discussion
The use of AI in the field of urban planning and urban design provides us with new models and tools to visualize situations and patterns in a more immediate way. Furthermore, this information can be used as an important parameter to consider in urban design, planning policy, and decision-making. Our case study shows a prevalent urban scenario in Global South cities, characterized by insufficient planning, outdated infrastructure, and pervasive informality. In this work, we explore two main topics: AI-generated cartographies and data production, aiming to inform future urban projects addressing informality and inadequate public infrastructure. The discussion of these results focuses on visible parameters to evaluate spatial implications.
Occupancy and count & speed cartographies: Making visible situations and patterns
The “Occupancy” and “Count & Speed” cartographies reveals varying interaction levels on the sidewalk—a makeshift public space at a bus intermodal hub. However, it inadequately handles the load of people and transportation services. This urban element becomes a crowded, chaotic, and dangerous location for pedestrians, commuters, and drivers within this space. In a 2-m width, 11-m length sidewalk, parallel to the Pan-American Highway, the 45 people trying to catch a bus in 30 s represents a complexity and danger of precarious urban design that does not adapt to current inhabitants needs. Moreover, this situation is quotidian—it happens every working day during rush hour—and for the duration of the peak hour. Hence, the repetitiveness of this action affects directly to the neighborhood.
The complexity of this scene may produce a feeling of insecurity within users, which can lead to decrease in overall mobility. As for the spatial conditions of the area, Carapungo Entry Park intends to be used as a place where people gather and interact, though this regular conflict erodes the social cohesion within the community. For being such a common clashing dynamic, it has also brought to the area, negative perceptions in relation to security and mobility, marginalizing even more the neighborhood. The data and cartographies underscore the imperative to address this hazardous congestion by either designing a bus station capable of accommodating the substantial flow or implementing a soft design approach to enhance the signage system. Additionally, cartography identifies a potential waiting area within the park, enhancing pedestrian flow towards buses, taxis, and private cars.
These cartographies indicate that the most used and occupied areas are the smaller in the framed space, and simultaneously, can cast extents of the rest of spaces that are underused. This model provides a quantitative delineation of several invisible relationships to human eyes, as they are not physically constructed, and additionally, they offer a variety of micro-occupancies in a complex public space that otherwise would be difficult to capture with simple first-person photographic or video analysis taken from ground level, which is one of the most common methods for in-situ urban analysis.
“Occupanncy” and “Count & Speed” cartographies should be understood as predictive cartographies that summarize patterns of mobility in pedestrians, neighborhood-scale agglomerations, and the potential composition of amenities in such informal places.
Application and benefits of models: Infrastructural design through precise cartographic technique
Harnessing AI helps us understand how people navigate conflictive urban spaces, informing the design of more livable and efficient areas (Ibrahim et al., 2021), especially in informal public spaces. AI offers an automatic, pragmatic, fast, and objective method to cartography and count people in a specific urban area, under temporal and contested situations often overlooked by local governments, public institutions related to urban planning, design and mobility, and planners responsible for improving infrastructure and transportation issues. This understanding aids in setting policy priorities. However, challenges include the rendering time of DL models, access to powerful hardware, difficulty detecting people when they are not wearing bright clothing, when the ground colors are not cobbled, or if there is a lack of green surfaces, and the lack of precision of satellite images, making drone use essential if allowed. Drones can be used here as there are no restrictions yet.
This information can be used to, firstly, make visible the reality and its everyday problems, and secondly, to provide spatial evidence that can lead to propose a spatial solution related to this problem; in this case, the lack of public infrastructure in aspects of mobility and public space, by using soft design (Alavi et al., 2019; Stojanovski et al., 2020). Additionally, the model could be used to identify areas where pedestrian infrastructure may be deficient or unsafe in respect of the intensity of flux, such as crosswalks or sidewalks, and prioritize improvements in those areas through urban planning and policies (Ye et al., 2021; Yigitcanlar et al., 2021). We reached a tool that is relevant for possible projects’ proposals, as it considers the particularity and identity of the locations, the use, area of occupancy, movement detections, movement representation, speed of pedestrians’ movements, flux, and relationships between people and others, and the built environment.
Moreover, we have been able to assess people’s movement speed, which is a useful characteristic for distinguishing between places where people want to spend more time and places where they want to move quickly. With the ability to detect people, we can identify patterns of staying versus moving, as well as the type of movement, such as relaxed or rushed. By applying this approach to data gathered from people recognition technology, urban planners can make more informed and effective decisions, resulting in better urban development outcomes.
Conclusion: Unveiling the potential of AI in complex and overlooked public spaces
This paper has investigated the application of Artificial Intelligence to localize and depict patterns of behavior of the inhabitants of Carapungo in an informal bus station during the morning rush hour. We chose Carapungo’s Entry Park because its complexity in terms of spatial configuration (the most populated parish in Quito, the presence of the Pan-American Highway, the lack of adequate public infrastructure of mobility, commerce, public space), and social interactions (informal and formal practices, passengers and commuters waiting in a non-waiting area, people crossing the Pan-American Highway), demands to take into account all these situations that occur at a daily basis. The need to frame these circumstances, led us to use AI tools to have a wider perspective of this conflictive area.
This approach has been possible thanks to several drone recordings, which significantly reduce mapping time and provide an accurate visual depiction of people’s positions, relationships, and quantities in this small-scale urban situation. For our model development, we carefully selected a one-minute drone video captured at a 30-m altitude. Employing both CVT and a DL model based on YOLOv5 training, our dual approach aimed to segment moving actors within the urban scene, identify their flows, and quantitatively represent them through various cartographies designed to transform complex data into easily understandable visualizations for urban designers and policymakers.
AI holds transformative potential in urban design, as demonstrated by our Carapungo’s Entry Park case study. Our model enables planners and policymakers to evaluate resilience standards for informal public spaces, integrating local insights with experimental AI models. Through cartographies, our research explores relationships among people, the built environment, and movement, refining approaches to informal practices as urban design parameters. The visualization of all these complex situations through these cartographies, are a clear document that argues the need for urban policies and planning processes. Additionally, it is possible to estimate population density, analyze movement patterns, and social interactions, which suggests optimal layouts for public spaces. This methodology simulates various urban design scenarios to assess their impact on the community, environment, and overall functionality of the space where there are such conflictive and complex settings. It is a deeper understanding that informs more effective planning strategies, facilitating the evaluation of urban plans for better solutions.
Exploring these and on-going case studies, we aim to introduce such findings to municipal authorities, fostering a connection between on-the-ground research, quantitative data, and the formulation of effective public space policies. The pivotal question arises: Can AI serve as a tool to enhance public spaces inclusively, or does it risk becoming another tool that inadvertently reinforces societal stratification? This inquiry is vital for ensuring that technological advancements contribute to equitable and accessible urban environments.
Footnotes
Acknowledgement
This article is result of the project “Post-Public Space. Spatial practices based on informality”—ARQ.AMG.20.02, supported and funded by Universidad de Las Américas, Quito, Ecuador.
Declaration of conflicting interests
The author(s) declared no potential conflicts of interest with respect to the research, authorship, and/or publication of this article.
Funding
The author(s) disclosed receipt of the following financial support for the research, authorship, and/or publication of this article: This work was supported by the Universidad de Las Americas, Quito, Ecuador; ARQ.AMG.20.02.
Data availability statement
Data sharing not applicable to this article as no datasets were generated or analyzed during the current study.