
Abstract
The global climate-change crisis, along with public health and economic competitiveness challenges in cities around the world have underscored the need for analytic tools to examine the relationship between city design and sustainable mobility. Car-centered travel demand models and land-use-transportation interaction models have historically analyzed zone-to-zone trips along major roadways, largely omitting pedestrian and bicycle trips and creating a gap in the ability for planners and urban designers to systematically assess non-motorized outcomes of development interventions. We present the Urban Network Analysis tools to address this gap. UNA tools offer an accessibility-based framework for analyzing how built environments influence pedestrian travel in both existing and newly planned built environments. Developed as a free plugin for Rhinoceros 3D since 2015 and applied in several cities and research projects internationally, this paper describes the current Urban Network Analysis modeling framework and discusses the unique contributions the framework offers compared to existing pedestrian modeling approaches. Using Somerville, MA as case example, we demonstrate several commonly used functions for planners: examining pedestrian accessibility over networks; identifying critical walking routes to destinations; estimating foot-traffic on street segments; identifying frustration points for pedestrians; and evaluating how development changes may impact pedestrian activity in their vicinity. Such analyses can provide analytic evidence to pedestrian infrastructure planning and investment, and enable planners, designers, and policy makers to prioritize projects that increase sustainable mobility outcomes.
Introduction
After a century of prioritizing the automobile, many cities now recognize the importance of centering pedestrians in their transportation policies and planning practices (Speck, 2013). Such a direction change is a welcome response to longstanding calls to reorient planning for automobility to planning for accessibility (Handy, 2018). An expanded focus on urban walkability has been catalyzed by three main concerns: urban sustainability (Berger et al., 2014), public health (Roe and Aspinall, 2011), and economic competitiveness (Litman, 2003).
In light of the cross-sectoral importance that walkability has begun to hold in urban planning and public policy, still few analytic tools are available to researchers and practitioners to evaluate the anticipated impacts of pedestrian infrastructure changes and land use improvements. The National Cooperative Highway Research Program (NCHRP) has produced several reference reports on the current practice of forecasting active transportation—walking and biking (Transportation Research Board, 2014, 2016). Yet a clear need remains for analytic approaches to address pedestrian mobility at a neighborhood and project resolution, where day-to-day urban planning decisions are taken.
Most land-use and transportation interaction models operate with traffic analysis zones, zip codes, or Census tracts as spatial units of analysis, modeling travel patterns between them at the urban or metropolitan scale (Ortúzar and Willumsen 2011). Though technological improvements have brought several models, such as SimMobility (Adnan et al., 2016) and MatSIM (Axhausen et al., 2016) down to the scale of individual parcels, their transportation focus has largely remained on motorized trips, not walking and cycling, with few small-scale and proprietary exceptions (Ramboll, 2023). Albeit powerful for describing multi-modal mobility patterns between urban regions, most transportation models do not connect in their resolution to specific sites, the quality and character of public spaces and streets that pedestrians interact with.
Pedestrian network interaction models are unique in this aspect, establishing a direct analytic bridge between the work of an urban designer and travel demand for pedestrian mobility. Their origins and destinations can be defined at the resolution of individual address points, or even spaces within buildings in case of three-dimensional circulation networks, and their network representation allows for a detailed differentiation of individual footpath segments, including their perceived quality attributes. This makes it possible to evaluate land-use transportation interactions for individual pedestrian journeys, which have been largely omitted from regional travel demand models. It also opens the opportunity to include a more detailed representation of pedestrian experience along the routes—sidewalk dimensions, the presence of ground floor amenities, the presence of greenery, etc.—as part of route quality attributes.
This paper introduces the Urban Network Analysis (UNA) framework that addresses some of these challenges within the Rhinoceros 3D software environment. The UNA framework offers researchers and practitioners practical tools for modeling pedestrian activity in urban environments and introduces several unique contributions to pedestrian modeling and representation. The framework enables designers, planners, and transportation scholars to estimate non-motorized trip distribution over spatial networks at a high spatial resolution in sizable urban areas. The UNA toolbox was developed as a free plugin for Rhinoceros 3D—an increasingly popular software platform for urban designers—with a particular intent to make pedestrian modeling tools available to users who not only investigate built environments, but also design them. We use the Rhinoceros graphic user interface to provide a relatively simple and intuitive visual interaction framework for UNA, enabling users to not only import, analyze, and export data to/from Rhino, but to also inspect the network datasets visually, and graphically interact with analysis results, thus facilitating rapid visual feedback cycles to improve design-analysis-redesign iterations.
The paper is structured as follows. We first discuss the literature on pedestrian modeling and introduce the innovations in the UNA framework. We then discuss how the UNA framework performs three of its most used analysis workflows—analyzing pedestrian accessibility, forecasting pedestrians flows over street networks, and detecting frustration points for pedestrians, where a destination may be in sight and close by along a straight-line distance, but the shortest network route to reach it multiple times longer (Porta et al., 2005; Vragovic et al., 2005). The following section illustrates an implementation of these UNA tools in Somerville, MA, around recently built Green Line Extension (GLX) light-rail stations. The discussion section describes shortcomings, further research and development needs, including implementation steps for other contexts.
Literature
Quantitative approaches for predicting trip volumes, route choices and infrastructure utilization rates have been commonplace for motorized traffic modeling for decades (Adnan 2016; Ortúzar and Willumsen 2011). Cities use such analyses to inform motorized transportation policy, land use policy, development rights, as well as infrastructure investment decisions (Erhardt et al., 2020). Including detailed pedestrian journeys in urban travel demand models has been relatively rare.
Models that describe pedestrian activity on city streets fall into three broad groups: (a) aggregate “sketch planning” or “direct demand” models, where pedestrian volumes are estimated based on area characteristics without examining individual trips (Matlick 1996; Munira and Sener 2017; US DOT 1999), (b) individual-level agent-based models (Batty 2003; Kerridge et al., 2001), and (c) trip-level network flow models.
We shall not elaborate the first (a) type of model, since it does not operate with individual trips, but rather estimates aggregate demand for pedestrian journeys without detailed trip distribution and route assignment considerations. Though Space Syntax—one of the most well-known network analysis approaches among urban designers (Hillier et al., 1976)—has sometimes been used as a predictor for pedestrian travel demand, it is actually not a travel demand model, but also a version of a “sketch planning” model. It does not model trips per se, but rather analyzes the centrality of street segments (or axial lines, a special form of street segment representation) and correlates the resulting street centralities with pedestrian volumes (Sharmin and Kamruzzaman 2018).
We will also not elaborate on (b) high-resolution agent-based pedestrian models here, which have been discussed at length elsewhere (Crooks et al., 2021) and tend to be confided to relatively smaller application sites, where the focus lies primarily on inter-agent dynamics (e.g., how agents may behave when crowding or congestion occurs with other agents (Friis et al., 2013)). Our literature review focuses primarily on the third category of models (c)—trip-level pedestrian flow models on networks. These include models, such as PedContext, MoPed, sDNA, Depthmap, Urbano, and MCA, which estimate individual-level pedestrian movement trajectories, but do so mathematically, without visualizing individual agents’ journeys. The number of trips traversing each network link is estimated using graph-analysis methods, which leads to faster computations that can be scaled to significantly larger study areas than agent-based approaches. This makes network analysis an attractive option for planners and urban mobility researchers, whose neighborhood-scale work stands to particularly benefit from estimates of how active mobility choices interact with urban form and land use patterns.
Table S1 presents a review of two comparable models to the UNA framework—MoPed and sDNA—both of which model pedestrian movement over networks. MoPed is a four-step model designed to predict daily pedestrian trips within designated Pedestrian Analysis Zones (PAZ) consisting of 80 m by 80 m grid cells (Clifton et al., 2016; Zhang et al., 2022). The sDNA model estimates pedestrian volumes from a series of Betweenness indices, implicitly constructed from the four-step framework of pedestrian demand (Cooper and Chiaradia 2020; Cooper et al., 2019). Compared with MoPed, sDNA only considers one mode of trips—pedestrians—assuming that pedestrian travel demand is determined exogenously or in a later model calibration phase.
The UNA modeling framework is analogous to both sDNA and MoPed approaches, with four key distinguishing features. First, when multiple competing pedestrian destinations are available for a particular trip, the UNA framework splits individual trips to fractions and allocates pedestrian journeys to all competing destinations (within a given search radius) concurrently using the Huff destination choice model (explained in Section 3.2.2.). This helps capture the idiosyncratic destination choice preferences of different users and results in an arguably more realistic pedestrian trip distribution.
Second, for each origin-destination (O-D) pair, most existing approaches, including MoPed and sDNA identify a single, lowest-cost route. The UNA Rhino framework not only identifies a lowest-cost route between each O-D pair, but additionally finds all “plausible” routes between the same pair, which may be up to a given “detour ratio” longer than the lowest-cost route (see Section 3.2.4 for details). Pedestrian route choice literature has shown that people commonly choose routes that are up to 20% longer than shortest routes (Li and Tsukaguchi, 2005; Zacharias, 2001). The UNA pedestrian flow algorithm offers a “detour ratio” parameter to users, which determines the detour percentage above the shortest available route that the algorithm will use to find plausible routes between all O-D pairs. This offers a simplified framework for capturing idiosyncratic route choice presences of different user types and enables more realistic routing of trips over networks (Sevtsuk and Kalvo 2021).
Third, the UNA framework enables users to translate detailed pedestrian route characteristics (e.g., sidewalk dimensions, the presence of ground floor amenities, and traffic volumes or turns along the route) into a “perceived” length measure for each route (rather than geometric length). The resulting perceived lengths of segments can be used as an impedance metric for all network calculations, and route assignments (see Section 3.1 for details). The use of perceived segment costs also affects accessibility estimates. Nicer pedestrian routes feel shorter, making more destinations accessible, which in turn can contribute to higher trip generation levels. No prior pedestrian models to our knowledge have accounted for street qualities in route assignment.
Pedestrian route choice literature has shown how street qualities, such as sidewalk widths, crossings, sidewalk-facing businesses, traffic volumes, and greenery, affect pedestrian route choices (Lue and Miller 2019; Guo and Loo, 2013), while estimated coefficients describe how each route attribute (e.g., sidewalk width) affects route choice probability, coefficient ratios can be derived to represent a marginal rate of substitution between two attributes. This produces equivalent walking distance interpretations for different street quality attributes (Olszewski and Wibowo 2005), also known as willingness-to-walk ratios (Basu and Sevtsuk 2022). By capturing tradeoffs between two attributes, these coefficient ratios become useful measures for policy making. If route length is used as the reference variable, the effects of other route attributes can be expressed through equivalent walking distance. For instance, Olszewski and Wibowo (2005) have shown that in the context of Singapore, the trade-off between traversing a footbridge
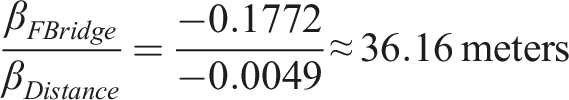
This suggests that the effort an elevated foot-bridge over a roadway is perceived as equivalent to 36.2 m of level walking. Put alternatively, a crossing a footbridge reduced the willingness-to-walk by 36.2 m Sevtsuk et al. (2024) discuss how similar willingness-to-walk coefficient ratios have been reported for a number of different street attributes, including the negative effects of unsignalized crossings (Lue and Miller 2019), large road crossings (Olszewski and Wibowo, 2005), narrow sidewalk dimensions (Guo, 2009; Guo and Loo, 2013), traffic volume (Guo and Loo, 2013), lack of overhead cover in a hot climate (Erath et al., 2015), and turns and elevation gain (Bongiorno et al., 2021) among others. Positive effects have been found for ground floor amenities (Guo, 2009; Guo and Loo, 2013), transparent building facades (Erath et al., 2015), and vegetation (Basu and Sevtsuk 2022). We make use of the equivalent-walking-distance coefficient ratios in the framework we develop below to explore how changes to pedestrian infrastructure, like street improvements, influence “perceived distance” to destinations, and affect pedestrian trip generation and trip distribution. This distance-equivalent interpretation of route qualities allows the model to account for street or sidewalk qualities in pedestrian travel, which in the UNA framework produces direct implications for pedestrian accessibility, trip generation, and trip distribution.
A fourth, more general contribution of the UNA framework is that it allow users to set up networks, origins, and destinations and their attributes in a highly visual and intuitive Rhinoceros user interface, enabling them to graphically interact with spatial network datasets, to fix or manipulate datasets before analysis, to run various analysis procedures within the same environment, and to visualize and/or export analysis results out to various file formats (e.g., to SHP, GeoJSON, CSV, or TSV files) for further presentation or processing in other software environments. Implementation in Rhinoceros3D makes it particularly easy to modify the network datasets in a CAD environment that offers a wide-variety of editing tools, which are not available in ArcGIS Pro, ArcMap or QGIS software. Having UNA tools in Rhino thus allows users to evaluate a specific plan or development proposal quickly, incorporating analytics into a fast and iterative design process, where designs can be altered, evaluated, and redesigned in rapid cycles to improve intended pedestrian mobility outcomes. While several data science tools (i.e., GIS, R, and Python) offer environments for spatial data analysis and manipulation, an implementation within the Rhinoceros GUI enables uniquely graphic and hands-on interactions with spatial network datasets.
Design of the urban network analysis toolbox for Rhinoceros3D
Network setup
An overarching feature of the UNA framework is that all spatial relationships are analyzed along networks. Most analysis workflows require users to provide three key inputs—a spatial network, along which movement is analyzed (optionally, with weights indicating “perceived” segment lengths), trip origin points (optionally, with weights indicating trip generation numbers) and destinations points (optionally with weights, indicating destination attractiveness).
Networks and origin-destination points can be either two- or three-dimensional, allowing analyses to range from interior building networks to large-scale planimetric urban networks. Networks can be created from any Rhino curve objects, with the expectation that network nodes are only formed if two or more intersecting curves share endpoints. The data needed to set up networks can be downloaded and imported to Rhino from existing sources, such as open GIS databases, CAD base maps, and Open Streetmap files, or traced directly in Rhino by the users. The UNA Rhino toolbox includes import and export tools for data exchange along with attribute information to and from GeoJSON files and table (CSV and TSV) formats. Network layers can also be imported from CAD files directly, but DWG, DXF, and Rhino 3DM files do not carry any attributes information. Similarly, point and line attribute weights can be either edited directly within the Rhino drawing environment or joined (using the UNA Join Attribute tool) from external table files, using Rhino objects’ Globally Unique Identifiers (GUIDs) as join keys.
Network segments can include weights or “perceived length” values, which may differ from geometric segment lengths. It is generally recommended that custom network segment weights be conceptually treated as “perceived length” (as opposed to travel time for example) to enable segments with custom costs and segments without custom costs to be consistently used in the same analysis. When networks are created with the AddCurveToNetwork tool, the “Weight” option on the command line allows any numeric network segment attributes to be assigned as custom segment costs. A “fallback” option defines what costs are used on segments if no custom costs are given—usually length.
Since route choice studies have also demonstrated that pedestrians can be deterred by route complexity, captured by the number of turns along the route (Broach and Dill, 2015; Bongiorno et al., 2021), UNA analysis tools also offer a Turn Penalty option, where two settings can be used to determine how turns along routes affect travel costs: (a) the Turn Angle variable defines the minimum angular deviation between two segments to be considered a turn (e.g., 45°) and (b) the Penalty variable defines the magnitude of the penalty incurred by each turn in the units of perceived distance (e.g., 30 m). When activated, the lowest cost routes not only minimize distance, but simultaneously also turns. The turn penalty option is integrated to accessibility calculations, pedestrian flow and facility patronage estimates (see Figure S2).
Having set up a network with origins and destinations, users can deploy a series of tools to describe and analyze pedestrian or bicycle mobility in built environments. In the following we demonstrate some of the most commonly used functionalities for planners: examining pedestrian accessibility to destinations, identifying critical walking routes to destinations, estimating foot-traffic on street segments, and detecting pedestrian frustration points in networks.
Pedestrian accessibility analysis
The UNA toolbox offers two types of pedestrian accessibility indices, including a number of user-specified parameters for adjustment: the reach index and the gravity index. The reach index, also known as the cumulative opportunities type accessibility index (Bhat et al., 2001) computes how many destinations can be reached from each origin within a given network radius. Reach of location [i] is defined within a given search radius r as:

where d[i,j] is the shortest path distance between origin i and destination j in graph G, and W [j] is the weight of a destination j. By default, the destinations are simply counted—for example, how many retail shops can be reached from each residential building within a 600-m walk? If destination weights are used, the index can also summarize how many destination weights—for example, square meters of retail space—are found within a given network radius. Despite its simplicity, the Reach index remains popular in mobility policy literature due to its ease of interpretation (Jaber et al., 2017).
The gravity accessibility index (Hansen, 1959) not only counts destinations that are found within the specified network radius but divides each destination (or destination weight) with a travel cost required to reach it. Gravity accessibility from location [i] to a set of destinations [j] within a given network search radius r is defined as:
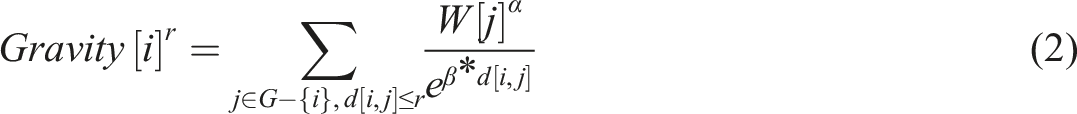
where W [j] is the weight of a destination j and
Users can also choose to specify a “plateau” distance in the command line options of the tool, in which case all destinations that lie with the given distance plateau (e.g., 100m) contribute their full weight or count towards the outcome. Beyond this limit, a distance decay effect penalizes their contributions according to the chosen distance decay function. Figure 1 illustrates access from address points to public transit stations in Cambridge, MA, within a 1000-m walkshed. Destinations include both bus and metro stops, where destination weights describe the level of service (departures per day) and capacity (vehicle size) of each station. Each MBTA train station is considered 5X the capacity of a bus stop. Gravity accessibility illustrated from address points to bus and rail public transit station in Somerville, MA.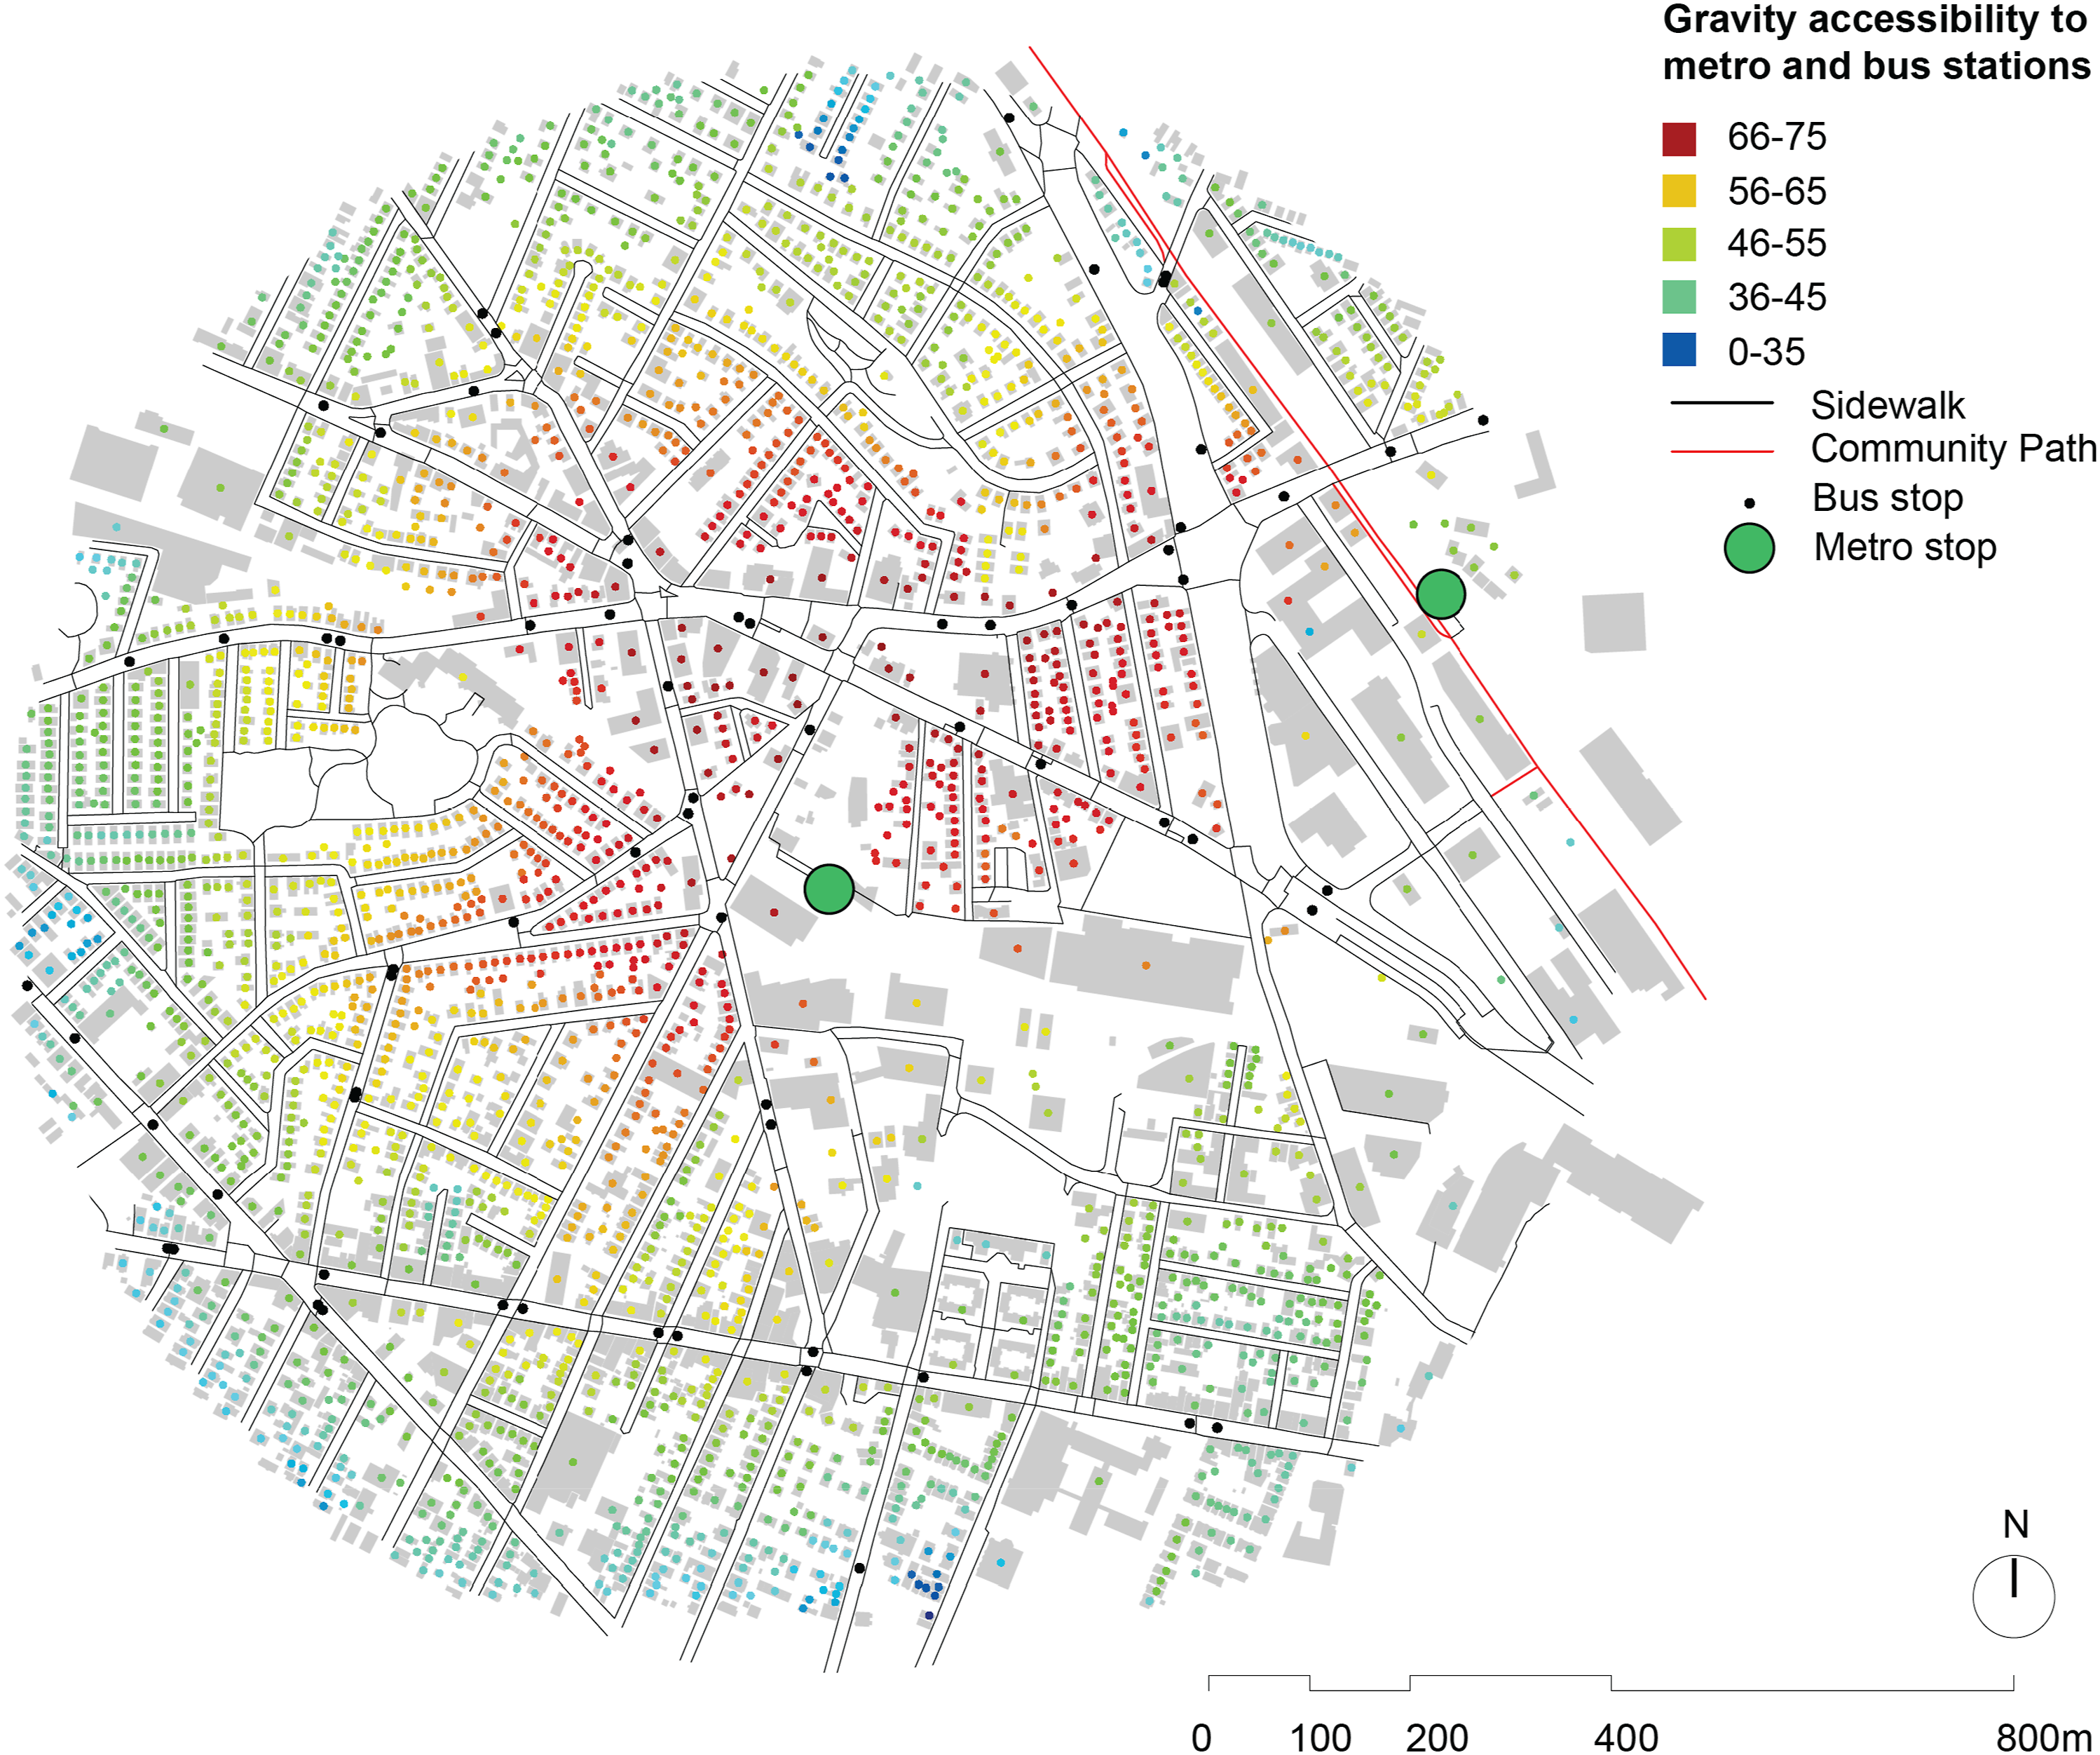
Due to its simultaneous emphasis on both destination weights and travel costs needed to reach each of the destinations, gravity accessibility remains one of the most commonly used metrics for capturing spatial accessibility to spatial destinations (Bhat et al., 2001; Geurs and Wee 2004). Gravity accessibility also forms a basis that is widely used in determining pedestrian trip generation and trip distribution outcomes in UNA toolbox pedestrian flow analyses (section 3.2).
Pedestrian flow analysis
One of the most common user applications of the UNA toolbox is to model how pedestrian or bicycle journeys distribute over spatial networks. The following describes how the UNA Patronage Betweenness tool estimates pedestrian journeys on networks, according to the four-step framework.
Trip generation
Trip generation describes where and how many trips originate for a given trip type. In the UNA framework, trip generation is determined by the spatial distribution of origin points, and the user-determined weights of these origin points (e.g., buildings, with weights describing number of residents). If origins represent places, where a person count may be unknown (e.g., bus stops), they can also be left unweighted, using the count of origin points as a default weight—in this case only one trip is generated from each point. In either case, these trip generation rates represent potential trip generation, which can be subsequently calibrated. Users can add different origin types for the same destination or trip type (e.g., to bus stops).
Prior research has shown that better pedestrian accessibility to destination can lead to more pedestrian trips being generated to such destinations (Hansen, 1959; Sevtsuk and Kalvo, 2018). The UNA framework allows trip generation rates to be elastic with respect to destination accessibility. To achieve this, users can first use the accessibility tool to measure gravity access from each origin to a given destination type (e.g., from home to transit stations), and then adjust trip generation rates at the origins with the gravity accessibility results, saving out a new elastic trip generation weight for each origin. A recent study in Beirut, Lebanon, has shown how this elasticity effect can be applied to generate more per capita walking trips destinations in areas of the city that have higher pedestrian access to destination (Sevtsuk et al., 2024). This is analogous to computing a walk score from each origin to a destination type (e.g., homes to parks) and setting trip generation rates higher in areas of high walks scores.
Trip distribution
Trip distribution determines how trips from given origins are assigned to destinations available within a given search radius. When an origin only has one destination available within the given network radius (e.g., single bus stop station within a 600m radius), then all trips are simply assigned to that destination. But in situations where several destinations are available, determining how trips are distributed among competing destinations is addressed with the Huff destination choice model in the UNA toolbox (Huff 1963; Sevtsuk and Kalvo 2018).
In the Huff model, the probability that a trip-maker at origin point [j] will patronize a particular destination point [k] is given as a ratio between [j]’s Gravity accessibility to that destination divided by [j]’s sum of Gravity accessibilities to all available destinations, including [k]:

The number of trips assigned from origin [j] to a particular destination [k] is found by multiplying the origin weight of [j] with the destination probability [j,k]:

Due to the simultaneous consideration of destination proximity and attractiveness in the gravity index, closer destinations, and destinations with larger weights, obtain higher destination probabilities and attract more pedestrian trips, while the total number of trips generated from an origin remains controlled by the origin weight (or optionally its elastic weight as described above).
A unique feature of the UNA framework is that we not only identify a single most likely destination with the Huff model, but distribute a proportional share of trips to all available destinations within a given network radius. Even if an origin generates a single trip while reaching multiple destination within the search radius, fractions of the single trip are distributed all of the destinations, corresponding to the Huff probabilities in equation (4).
Mode choice
The UNA toolbox pedestrian flow model does not inherently consider choice-making between different modes, but the quantity of trips modeled as pedestrian trips depends on model calibration (see section 4.2), which adjusts the generated trip levels to match observed pedestrian volumes on selected city streets.
Additionally, if local pedestrian counts are unavailable for model calibration, users can also combine the UNA toolbox pedestrian flow analysis with other, external mode choice models—such as SimMobility (Adnan et al., 2016) and MatSIM (Axhausen et al., 2016), which use a sophisticated daily activity schedule approach and produce detailed estimates of trips by mode and time of day—and import pedestrian trip generation weights accordingly.
Route assignment
To perform route assignment, the UNA toolbox uses a customized version of the Betweenness algorithm (Freeman, 1977; Sevtsuk 2021). Pedestrian route choice literature has shown that pedestrians do not always choose shortest routes and often deviate to routes that are more pleasant, safer, quieter or more interesting (Li and Tsukaguchi, 2005; Zacharias, 2001). The UNA detour ratio variable, defined as a ratio between the allowable route length and the shortest available route length, enables trips between origin-destination pairs to be routed along all “plausible” routes that are up to a certain factor longer than the shortest path. A detour ratio of “1.2,” for instance, will find all routes that are up to 20% longer than the shortest route between given origin-destination pair (Figure S2). To allow for idiosyncratic route choice preferences, each of the routes found is assigned an equal probability. Segments where most unique routes overlap, naturally obtain the highest probabilities. When networks have been set up using custom segment costs, then route-assignment also accounts for these custom segment costs (Figure S2).
Pedestrian trip volumes can be estimated for either network segments or “Observer” points. Observer points, which a user can add to the network just like Origin and Destination points, do not generate or attract any trips themselves—they simply count how many trips through them. This is useful for capturing estimated pedestrian volumes at exact locations (e.g., address points). While segment level trip volumes describe the total volume of trips that occur on any part of the segment, trip volumes at address points can differ from segment level estimates, depending on the spatial pattern of origins and destinations on the segment. The estimated pedestrian volume at an Observer point [i] for trips between specified origin-destination pairs [j,k] is defined as:

where r represents the maximum network distance between origin-destination pairs [j,k] surrounding observer [i],
Pedestrian frustration point detection
In addition to the UNA accessibility and pedestrian flow modeling tools, we also highlight the UNA Straightness tool, which can be used to detect locations, where pedestrians may be able to see their destination “as a crow flies,” but cannot actually walk to it without undertaking a significant detour. The Straightness index (Vragovic and Diaz-Guilera, 2005) illustrates how many times longer actual network walks are from origins to destinations in comparison to the straight-line distance. Straightness of an origin i and a given set of destination points j within a network search radius r is defined as:
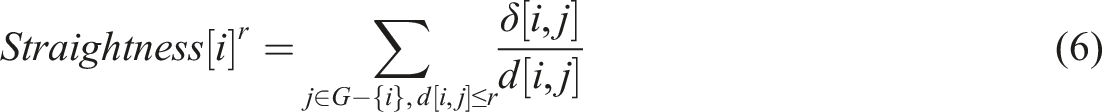
where
The implementation of this index in the UNA toolbox additionally allows users to automatically highlight “frustration points” in pedestrian networks: node-pairs, where the ratio exceeds a user-defined threshold (e.g., 5X), which we illustrate in our Somerville application below.
Application in Somerville, MA
We use the Union Square neighborhood of Somerville, MA, to illustrate the application of the UNA modeling framework in practice. This area is interesting for pedestrian mobility analysis for several reasons. It is highly walkable, featuring a citywide WalkScore of 89 (out of 100), and 92 around Union Square (WalkScore, 2023). Pedestrian trips constitute a quarter of all trips around Union Square (City of Somerville, 2024). Union Square recently witnessed the opening of a new Green Line light-rail station, creating a significant new node for walking trips. There are also several large urban development projects in progress, some partially built (USQ redevelopment), some under way (Boynton Yards), totaling 353,000 square meters of high-density, mixed-use transit-oriented development (USQ Development, 2023) (Figure S4). These developments along with transit improvements will considerably increase foot-traffic in the area in the coming years, accommodation of which will require advance planning.
Detecting critical walking routes to rail stations
We first illustrate how UNA toolbox can be used to detect critical walking routes to key destinations, such as transit stations. Setting the newly constructed Green Line stations in Union Square and East Somerville as destinations, we considered four types of address-level origins located within an 800m (half-mile) walkshed around the station as potential pedestrian trip generators: residents, jobs, retail amenities, and bus stops, based on data obtained from Census (2020), InfoGroup (Infogroup, 2019), and MassGIS (MassGIS, 2023). From residential buildings, we set the trip generation to correspond to the number of residents, from jobs and amenity locations the number of jobs. Trips from bus stops remained unweighted, producing just one estimated trip from each bus stop. The resulting pedestrian flows from each of these origins to the two stations (Union Sq and East Somerville) are shown in Figure 2. Estimated critical routes to Green Line Extension stations (highlighted in green dots) from homes, jobs, amenities and bus stops in Somerville, MA. Units intentionally not marked because they are uncalibrated to actual volumes.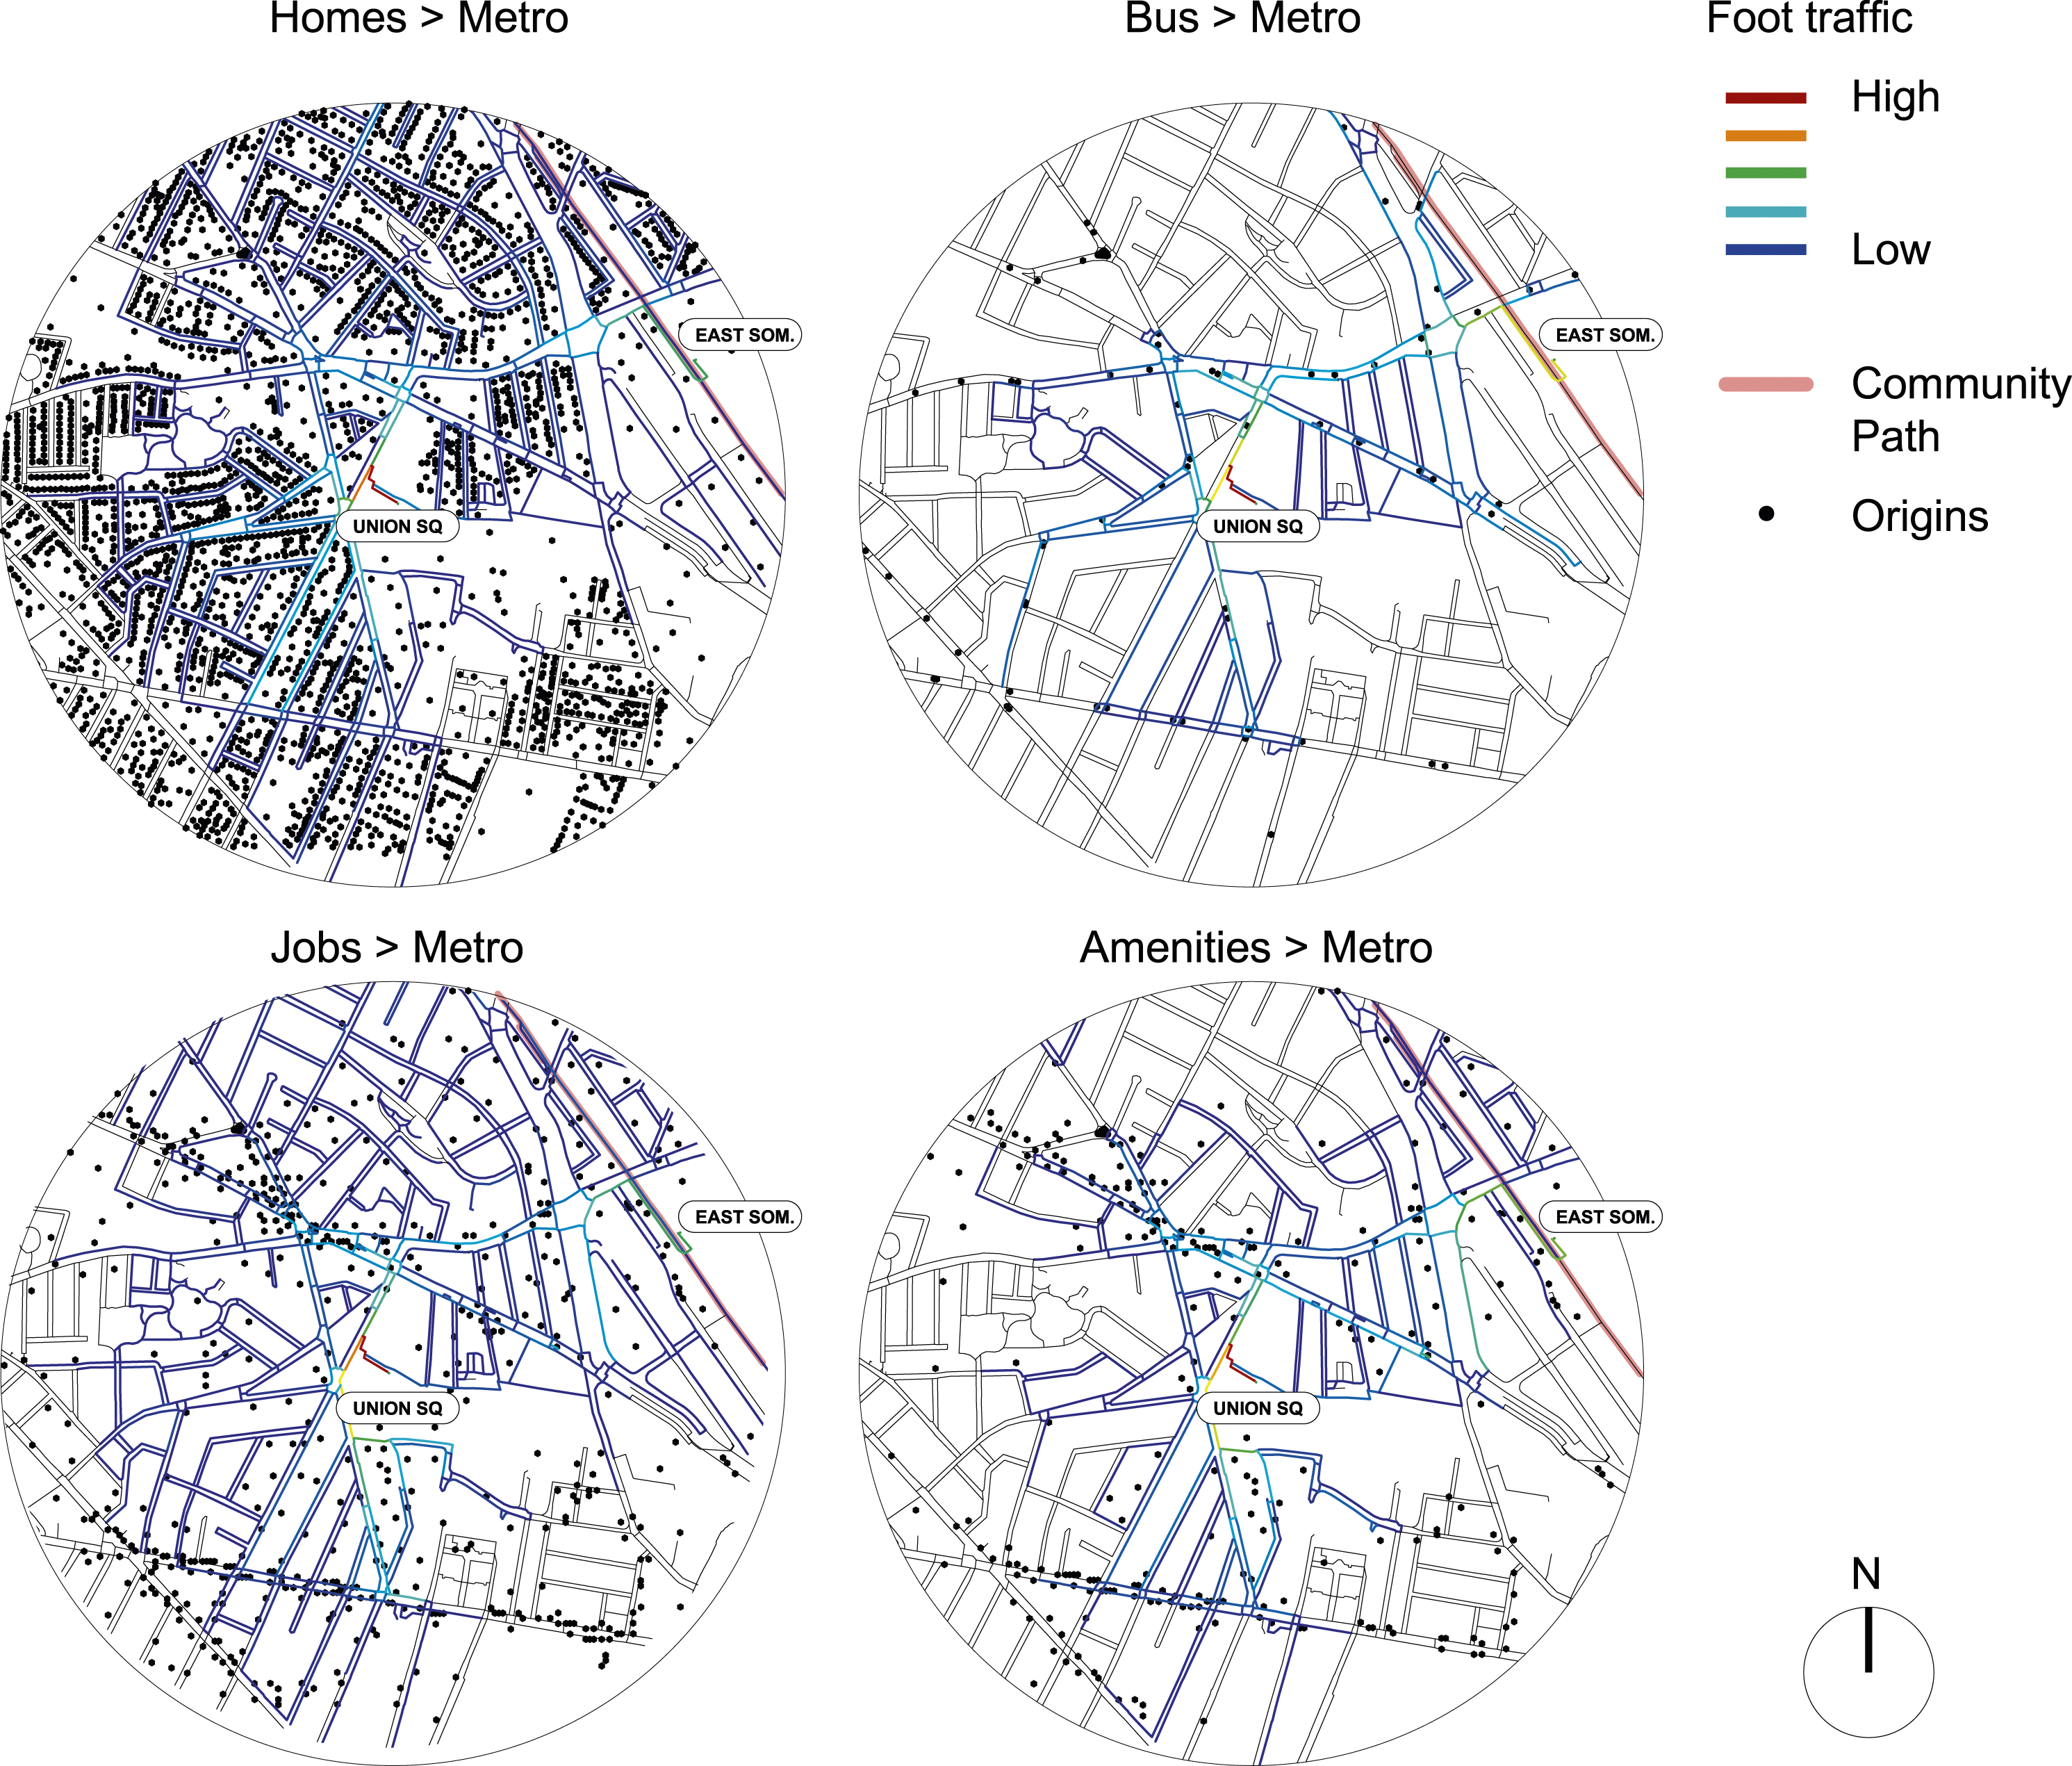
We set the detour ratio to 1.15 to find all routes to stations that are up to 15% longer than the shortest available path. To distinguish quality differences between walking paths, we set the perceived length of all segments on the Somerville Community Path—a popular rail-trail with no traffic and outstanding pedestrian quality—to 75% of their actual length, thereby making it more attractive for route assignment (Figure 2). We also applied an exponential distance decay rate with a beta value of 0.001 (in meters) to all origins, generating fewer trips to stations from origins that lay further away.
Calibrating estimated pedestrian volumes with observed counts
We calibrated the estimated pedestrian flows in Somerville with observed pedestrian counts from the City of Somerville’s 2024 pedestrian count survey (City of Somerville, 2024). Somerville conducts annual pedestrian counts at the same 42 locations and 78 sidewalk segments city-wide during AM and PM peak travel periods with volunteer human counters who are trained for the occasion (see Figure S5 and S6). At each location, two separate streets are typically counted (sometimes one), using the “screen-line” method, which tallies all pedestrian movements across an imaginary screen line, regardless of the direction of movement. We used PM count hourly totals, which started between 4:45 and 5:15 p.m. in September 2019 and lasted an hour, describing total pedestrian trips on observed segments between ∼5 and 6p.m. and matched the counts to segments used in our pedestrian model.
To calibrate our model, we estimated pedestrian trips in all of Somerville (not only Union Square study area) for 13 trip types using the UNA Patronage Betweenness tool (see Table S2 for settings). This initial set of estimated flows included O-D combinations between homes, jobs, subway stops, bus stops, retail amenities, parks, public institutions and schools. All trips were estimated with an exponential decay rate using a beta value of 0.001, a detour ratio of 1.15 and a search radius of either 800m or 400m depending on trip type. To avoid an “edge effect,” the data we used was extended another 1/2mile outside the borders of Somerville for both the network and all destination types.
Model calibration coefficients for high and low amenity access areas during the 2019 PM peak period in Somerville, MA.
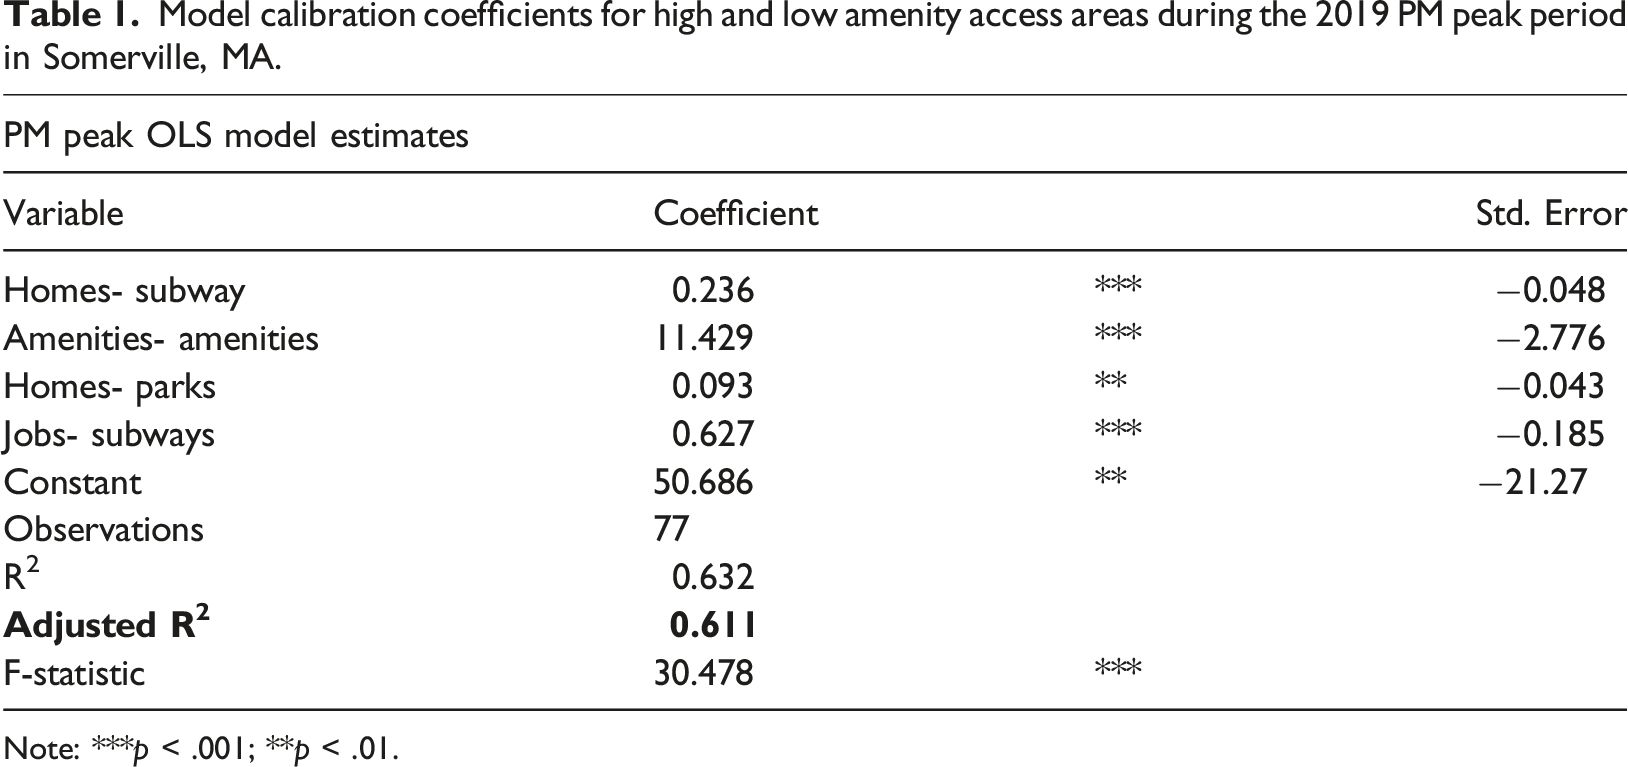
Note: ***p < .001; **p < .01.
To operationalize the calibration, we used the estimated coefficients to adjust our initial trip generation rates for each trip type. For instance, we multiplied our initial trip generation coefficient corresponding to the number of residents for trips between homes and subway stations with a coefficient of 0.236, thus estimating that 23.6% of residents who live within 800m from a subway station walk from a station to their home during the PM peak. While a calibrated 2019 baseline model was produced for all of Somerville, Figure 3 illustrates a part of the calibrated pedestrian volume estimates around our Union Square focus area. Calibrated hourly foot-traffic estimated for the baseline (2019) ∼5-6p.m. period.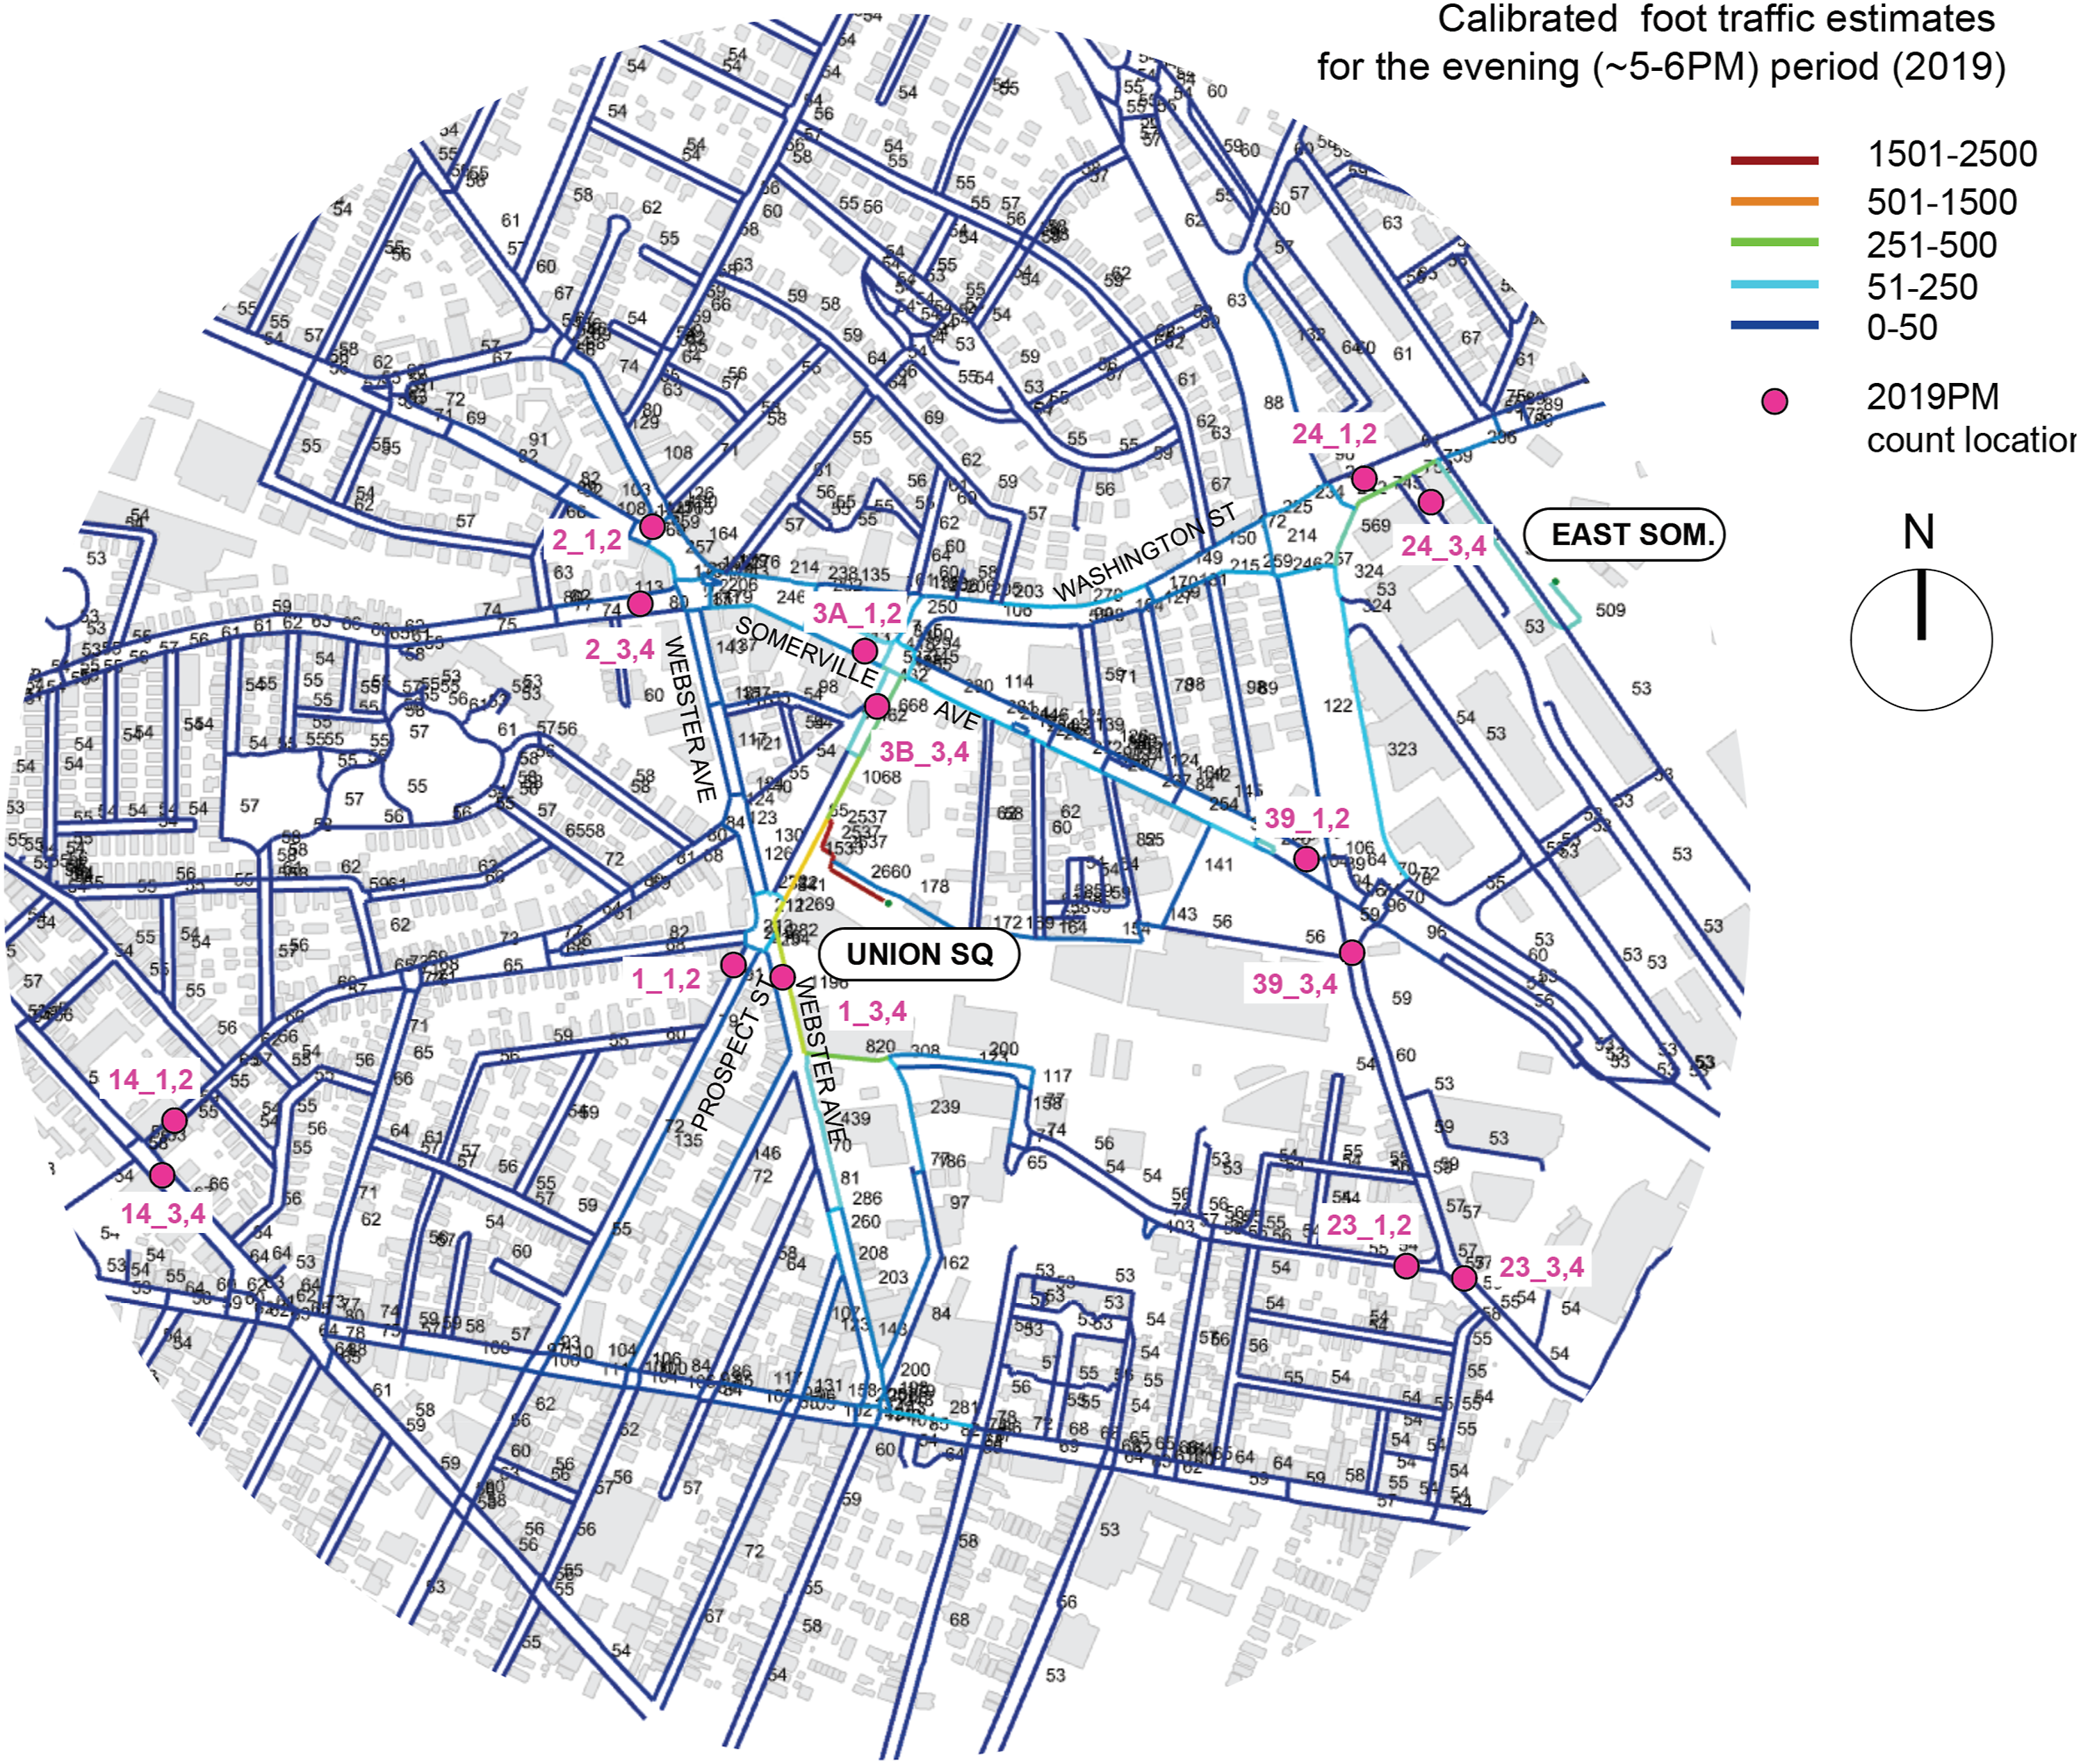
The citywide bivariate correlation between observed and estimated pedestrian volumes is 0.79, with the Mean Absolute Error of 62.9 pedestrians per hour (see Figure S7). Out of the 77 total count locations in Somerville, 14 locations are found within our Union Square study area (Figure 3). The actual and predicted pedestrian volumes for these segments are reported in Table in S4. Both the prediction and actual averages are 134 pedestrians per hour, the mean absolute error (MAE) is 59. Even without accounting for street qualities, street closures, and only four origin-destination types, the PM model explains 61% of variation in count data. According to a 2020 NCHRP report on Traffic Forecasting Accuracy Assessment Research, the mean percent difference from forecast (PDFF), which is a measure of spread, in typical vehicular traffic flow models in the U.S. is 17% (Erhardt et al., 2020). In our Somerville model, the city-wide mean PDFF was 0.2% and the Union Square area mean PDFF was -1.9%.
A calibrated pedestrian flow model provides a powerful tool for decision-makers to guide the investment of scarce taxpayer US dollars to the pedestrian realm at places where most pedestrian journeys can be impacted. The highest pedestrian flows are estimated along the east sides of Prospect St and Webster Ave, leading to Union Square station. Interestingly, the western sidewalks of both streets have notably lower estimated pedestrian volumes, suggesting that asymmetrical prioritization of sidewalk improvements may be justified. The Prospect and Western intersection and the Somerville Ave and Prospect intersection form important junctions, with over a thousand pedestrian crossings per hour. The results can also be used to examine how upcoming urban developments would likely impact present trip generation and trip distribution in the area.
Estimating pedestrian impacts of upcoming redevelopment projects
We digitized the proposed development changes in Union Square and Boynton Yards (Figure S4) as new or changed land use points in the Rhino UNA model and added them to the 2019 baseline. The updated building points serve as both new origins (updated residential job numbers) and new destinations (new amenities on ground floors). Based on current Somerville conditions, we assumed a mean of 92 gross square meters for newly created residential units, with an average of two residents per unit. For commercial buildings as well as amenities, we assumed 15.5 square meters of gross floor area per worker. Given that the proposed redevelopment plans do not exactly detail where and how many ground floor amenities will be located, we used the presently observed ratio of amenities per square meter of developed space to distribute new amenities along commercial ground floors of new developments. In total, these estimates amounted to 2868 new residents (40,245 square meters of residential space), 10,841 new jobs (201,435 square meters of new commercial floor area), and 1251 new amenity workers (23,237 square meters of new amenity space), depicted in S3.
Figure 4 illustrates how these land use changes are estimated to impact PM peak pedestrian flows in the area using the calibrated 2019 pedestrian flow model as a basis. Model outputs can also include post-intervention trip generation estimates for each trip type separately (not shown here). There is an average 12% increase in pedestrian flow per network segment. The largest increase in pedestrian volumes is projected around the Union Square Green Line station, where an additional 5796 pedestrians are expected during the evening peak period at full buildout. Large increases are also expected around Boynton Yards, where present pedestrian flow is very low (under 200 peds/hours). At completion, projected pedestrian flows on Columbia Street and Windsor Place at Boynton Yards are projected to accommodate 1500–2500 pedestrians during the evening peak hour—a 10-to 20-fold increase, surpassing the presently most foot-trafficked streets around Union Square. Estimated change in foot-traffic after USQ and Boynton Yards redevelopment in Somerville, MA. Labels describe the number of additional or reduced pedestrians per hour during the PM peak period.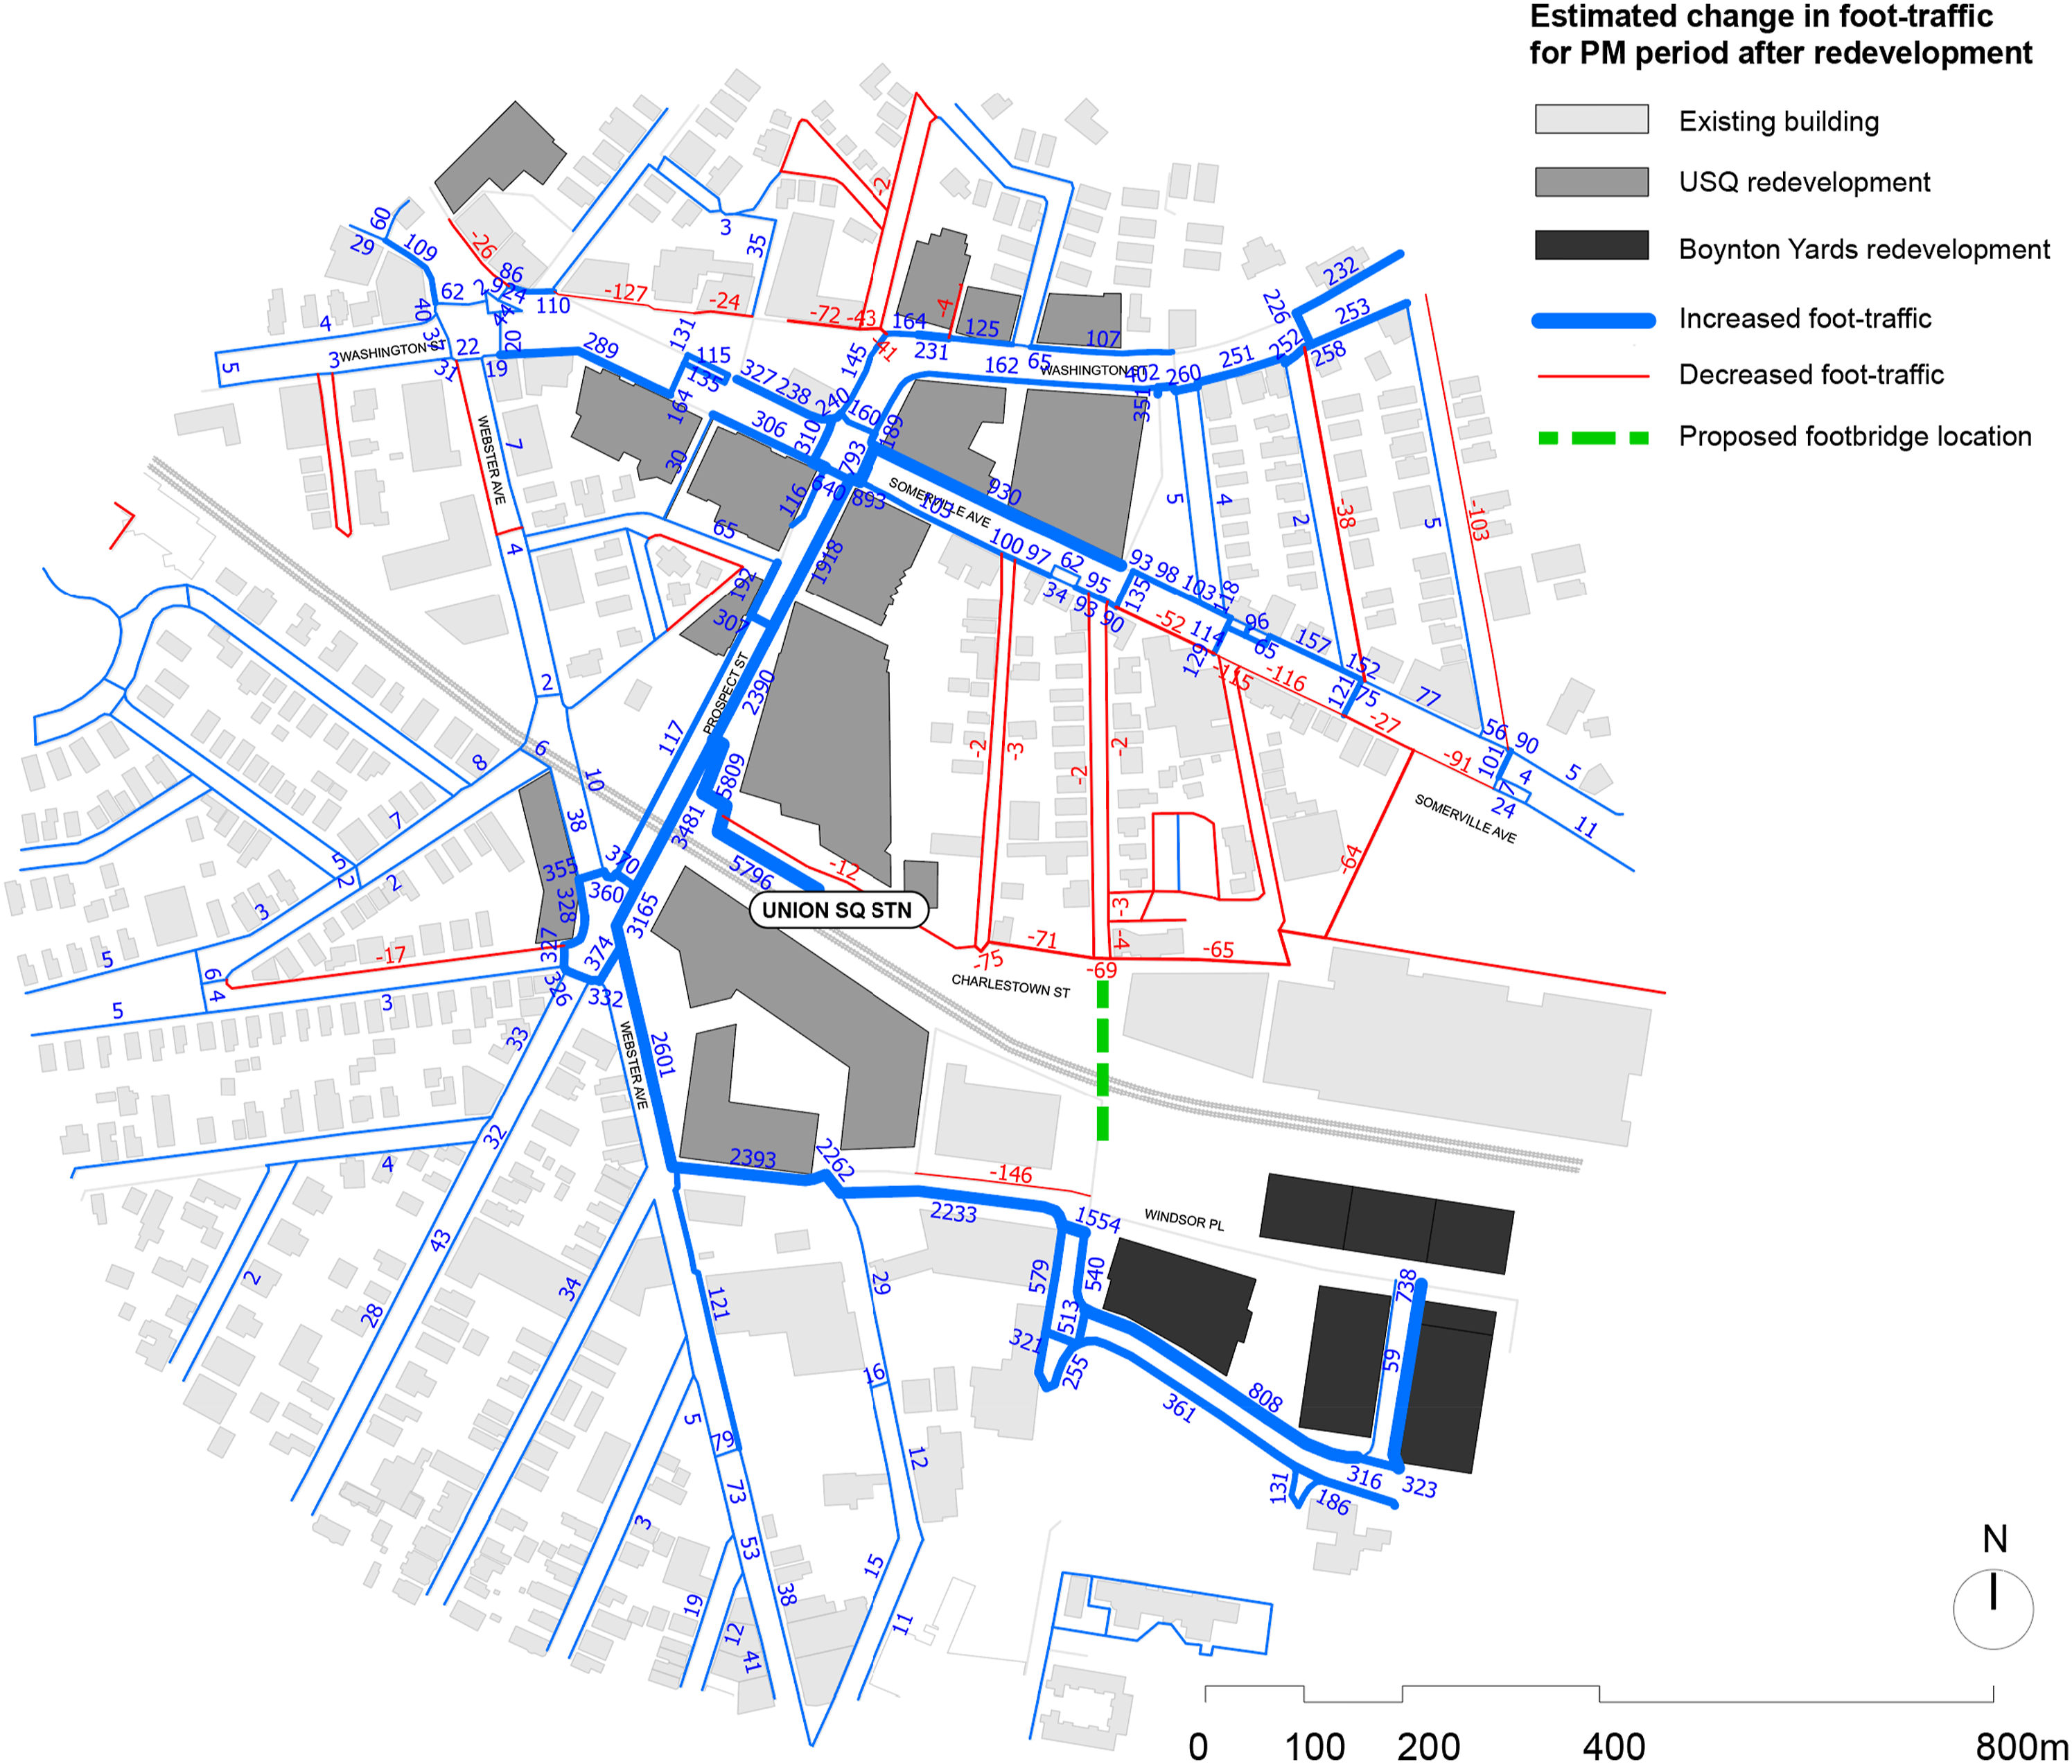
These projections could enable authorities to inspect whether and how existing sidewalk are in sufficient condition to accommodate the future growth in pedestrian volumes. For instance, the Prospect St and Webster Ave crosswalk is projected to have over 3000 additional pedestrians during the PM peak, more than doubling its present (already heavy) usage. This projection could justify a more pedestrian friendly intersection design, the cost of which the city could negotiate with the developer of Boynton Yards, which will generate most of the additional flow. The eastern sidewalk on Prospect Street is also projected to have over 3000 additional pedestrians—another priority location for investment into a wider sidewalk. This sidewalk would have a total of about 70 pedestrians per minute per meter of sidewalk, which would far exceed the level of service of its present four-foot sidewalk—assuming a comfort limit of 20 peds/minute/meter of sidewalk, as suggested by Transport for London, (Transport for London, 2010). Similar to traffic impact assessments that are commonly used to justify traffic capacity improvements from new developments, the pedestrian impacts illustrated here could inform pedestrian infrastructure improvements in response to new developments.
Detecting pedestrian detours
We used the straightness tool to detect node-pairs around Union Square, where a destination is within a 100-m distance, but where the shortest network route to reach it is at least five times longer (Figure S8). We refer to the node-pairs for which network walks exceed this ratio as “frustration links.” Not all such locations may be important or viable for route shortening or improvement—many indicate locations where a zebra crossing is lacking, or suggest through block connections that traverse private lots. However, one area stood out as a potentially attractive site for a footbridge from Boynton Yards over present Commuter Rail tracks to the Union Square Green Line station, highlighted in green in Figure 4.
We tested how the presence of such a footbridge would attract pedestrian journeys during the PM peak period by adding a new link to the network, while keeping land uses and the rest of the network identical to Figure 4. Rerunning the model with the new hypothetical footbridge in place suggested that it would attract 951 pedestrian trips per hour during the PM peak period across all trip types shown in Table 1, with the jobs to subway trips contributing the vast majority (n = 906). Discussing these findings with city officials, we learned that Somerville is, in fact, already considering a footbridge at this location due to the notable size of the Boynton Yards development, and its present inefficient pedestrian connection to the Union Square light-rail station.
Discussion
The tools described in this paper can support planners and urban designers in understanding how both existing and future built environments generate pedestrian activity. The UNA Rhinoceros3D toolbox is designed as a flexible set of tools that address various pedestrian mobility and access questions. Rather than offering complex and interconnected workflows that automate the whole process of a developing a pedestrian accessibility or flow model, the tools allow users to measure or model specific tasks (e.g., capture accessibility between certain O-D pairs), the results from which can plug into other workflows. For instance, results from accessibility analyses can be saved and subsequently used as trip generation inputs to pedestrian flow analysis. Estimated pedestrian flows between one type of O-D pairs can be combined with others to calibrate a combined model that corresponds to observed pedestrian volumes. And calibrated flow models can be used to assess how infrastructure or land use changes may impact future trip generation and trip distribution. A modular design of the tools has been intentional to increase user control over workflows and to support applications for wide variety of pedestrian modeling scenarios.
The tools face several limitations that could be improved in future research and development. In its present form, the framework does not allow dynamic accounting for topographic slopes since this would require directional segment analysis. The model only outputs total trips per segment, without distinguishing start-to-end trips from end-to-start trips for each segment. Directional outputs could help incorporate penalties for uphill walking as well as other direction-specific route costs. Furthermore, directional outputs could lead to more accurate model calibration if pedestrian counts have been noted separately from right to left and left to right on observed segments. The model’s mode choice estimation could also be improved, possibly by incorporating multimodal accessibility estimations to each destination type, like Clifton et al. (2016).
To set up UNA toolbox analyses in other cities and contexts, user inputs that are needed include a network along which trips are to be routed as well as origin and destination points. The US Census Topologically Integrated Geographic Encoding and Referencing (TIGER) files can be used as road-centerline networks in all US cities. Sidewalks and crosswalk networks are more difficult to find but available in some cities as part of Open Streetmap data, and they can be generated in other contexts based on orthorectified aerial imagery. For neighborhood- and site-scale analyses, users can also document pedestrian networks by tracing over aerial imagery. Origin and destination points can be generated as centroids of GIS features—including building footprints and Census polygons. For open space data, such as parks, it can be useful to denote a larger space as a point grid, where each point represents a fraction of the total surface area. This ensures that accessibility analyses do not need to reach a single, arbitrary open space centroid as a sole destination, but can instead access a proportion of park area that lies within their walkshed distance.
Model calibration requires observed pedestrian count data, which is not widely available. For specific districts or projects, pedestrian counts can be collected with human observers, like the data we used from Somerville. However, observations from a single day can be affected by anomalies, special events, weather, etc. It is preferable to average data for a given period from multiple days, which is made possible with automated pedestrian counters. An exemplary system of infra-red pedestrian counters has been installed by the City of Melbourne, Australia, at around 90 locations in the city center, which offers hourly open data to interested users through an API (City of Melbourne, 2021).
The way we have applied the 2019 model calibration coefficients to estimate how future land uses changes will impact pedestrian activity around the Union Square study area implicitly assumed that pedestrian behavior (how people walk between land use patterns) will remain constant at the 2019 levels, even if the environment itself will have substantially changed after redevelopment. It is possible, and even likely that some changes in pedestrian preferences and behavior will lead to somewhat different pedestrian-land-use interaction over time. To examine how stable pedestrian preferences vis a vis land use interactions are throughout time, model calibration could be repeated on different years of count data, and the calibrated coefficients from 1 year compared to following years. While this remains beyond the scope of this paper, the longitudinal nature of pedestrian counts in Somerville would allow such comparison to be made in future research. We also refer the reader to examine such longitudinal pedestrian behavior differences in a longitudinal pedestrian flow model implemented in Melbourne, Australia (Sevtsuk et al., 2021).
Many cities have set themselves ambitious mode shift goals to decarbonize their transportation sector, targeting large increases in walking and public transit journeys. Practical steps of achieving such mode share shifts are all too often left vague. Given that future mobility outcomes are shaped by urban design, land use and planning decisions, more collaborative work is needed to develop tools that city governments and planners alike can leverage to anticipate the effects of day-to-day urban transformation on active mobility outcomes. The UNA Rhino toolbar can be downloaded from https://unatoolbox.notion.site.
Supplemental Material
Supplemental Material - Modeling pedestrian activity in cities with urban network analysis
Supplemental Material for Modeling pedestrian activity in cities with urban network analysis by Andres Sevtsuk and Raul Kalvo in Environment and Planning B: Urban Analytics and City Science
Footnotes
Declaration of conflicting interests
The author(s) declared no potential conflicts of interest with respect to the research, authorship, and/or publication of this article.
Funding
The author(s) received no financial support for the research, authorship, and/or publication of this article.
Supplemental Material
Supplemental material for this article is available online
References
Supplementary Material
Please find the following supplemental material available below.
For Open Access articles published under a Creative Commons License, all supplemental material carries the same license as the article it is associated with.
For non-Open Access articles published, all supplemental material carries a non-exclusive license, and permission requests for re-use of supplemental material or any part of supplemental material shall be sent directly to the copyright owner as specified in the copyright notice associated with the article.