
Abstract
The accessibility and quality of urban mobility networks (UMN) depend on a multitude of static and dynamic conditions for each individual. Promoting sustainable mobility, such as walking, requires a very specific assessment of UMN’s qualities given the specific needs of pedestrians. The objective of this research is to provide a new approach for the comprehensive, mode-specific understanding of a UMN as a base for good planning and decision making. With the Accessibility Score (AccessS), we propose an integrated, indicator-based, holistic geospatial framework for the quantified assessment of qualitative UMN attributes identified in an extensive literature review.
Keywords
Introduction
Mobility is one of the driving forces behind the rise and growth of cities and global urbanization (Brenner and Schmid, 2014; Lefèbvre, 1970). The availability of different means of transport in combination with planning has fostered cities to expand into today’s agglomerations (Rode et al., 2017; van den Berg, 1987). Today’s cities and urban regions face a multitude of ‘grand challenges’ (Højgaard et al., 2012), such as the consequences of climate change, environmental pollution, and resource scarcity, crossing administrative boundaries in cause and effect (Carlow et al., 2022). Road transport in Europe is responsible for more than 26% of EU’s overall carbon emissions (EEA, 2022; EFTE, 2018). In 2019, Germany’s total emissions of transport reached 164 million t CO2-equivalent accounting for 20% of Germany’s greenhouse gas emissions (Hendzlik et al., 2023). Mobility increases life chances, for example, through access to education, labour markets, goods, services, and social participation (Konietzka, 2012; Svallfors, 2005). However, concurrently it also hampers the quality of life, for example, due to noise and other emissions (EEA, 2017; Jakubiak-Lasocka et al., 2015; Le Thi, 2020), loss of green spaces and biodiversity (Gnap et al., 2020), increased land consumption (EEA, 2021, EEA - European Environment Agency, 2006; UBA, 2020), or also the disadvantaging of certain (mobility) groups (Maksim et al., 2009). A fundamental change in the planning and development of urban mobility networks is required to achieve global climate targets (UN, 1997; UNFCCC, 2015).
Cities and urban regions are built on interactions. Accessibility describes the ‘potential of opportunities for interaction’ and is also a ‘measurement of the spatial distribution of activities about a point, adjusted for the ability and the desire of people or firms to overcome spatial separation’. In the context of newly emerging transport modelling, Dalvi (1979) describes accessibility as ‘the ease with which any land-use activity can be reached from a location, using a particular transport system’ (Koenig, 1980). This is essentially still valid today. Accessibility is a complex concept since it ‘relates to individuals, their purposes, preferences and decision-making processes’ (Dalvi and Martin, 1976) and depends on the characteristics of the urban mobility network and the spatial distribution and density of opportunities (Pyrialakou et al., 2016).
The objective of this research is to provide a new holistic geospatial assessment framework by integrating (1) different openly accessible geospatial data and (2) transport-mode specific impact factors on accessibility. The modular structure enables its extension, allowing new data and findings to be integrated or supplemented. Since data aggregation and assessment happen for individual network segments, the Accessibility Score (AccessS) provides a fine-grained analysis of the accessibility of urban mobility systems by integrating and visualizing diverse computed values. As a proof-of-concept AccessS was developed and tested for the city of Braunschweig, Germany (2.3), focussing the MoT ‘Walking’.
Literature review
This study focuses on the integrated assessment of factors impacting pedestrian-choice behaviours (Geurs and van Wee, 2004) on micro-scale. The accessibility and quality of urban mobility networks are dependent on a multitude of static and dynamic conditions (Gerike et al., 2024; Götschi et al., 2017; Rojas López and Wong, 2019) such as the availability and quality of infrastructures (Handy and Niemeier, 1997; Mumm et al., 2022; Ogilvie et al., 2012), urban form and built environment (Ewing and Cervero, 2010; Kelly, 1994; Rode et al., 2017; Saelens et al., 2016), or weather (Böcker et al., 2015; Otim et al., 2022). Their impact can vary for each mode of transport (MoT) and each individual user. Optimizing the accessibility and quality of one MoT often leads to trade-offs with others. These diametrical effects are currently largely discussed for automobility (e.g. Dantsuji et al., 2021; Zheng and Geroliminis, 2013), which began to find mass-adaptation in the middle of the last century with lasting effects on cities today (Gunn, 2011; Reichow, 1959). While on large scale, automobility has contributed to the improved accessibility of certain geographic areas for certain user groups (Newman and Kenworthy, 1991), locally, negative effects for cyclists and pedestrians are also evident (Cervero and Radisch, 1996; Szell, 2018).
In recent years, the necessary shift towards carbon-neutral mobility has been widely discussed (Elits, 2023). In metropolitan areas such as Copenhagen and Amsterdam, significant efforts have been made to develop and implement, today much acclaimed concepts of decarbonizing mobility and readjusting the fair allocation of public spaces by focussing the needs of cyclists and pedestrians (Nello-Deakin and Nikolaeva, 2021; Rudolph-Cleff and Hekmati, 2023).
To stimulate and prioritize sustainable urban mobility in planning, a more accurate description of the accessibility of urban mobility networks for specific MoT is essential. It should comprise static (i.e. infrastructure, land use, and spatial qualities) and dynamic conditions (i.e. environmental factors, weather, ephemeral events, and traffic) (Tempelmeier et al., 2019). However, currently, urban transport planning and management (UTPM) relies on models primarily combining trip generation, trip distribution, mode choice, and route choice (McNally, 2007) to simulate travel demand. These models are thus not suited to assess the complex interdependencies between static and dynamic conditions and their impact on different MoT (Long et al., 2013).
In the literature, numerous aspects and conditions impacting accessibility and thereby the quality of an MoT such as walking (e.g. Ewing and Handy, 2009; Saelens et al., 2016), cycling (e.g. Hartanto et al., 2017; Saelens et al., 2016), and public transport (PT) (e.g. Dijkstra et al., 2015) are discussed with view to sustainable mobility (EC, 2020). The objective of this study is to translate qualitative indicators from the literature (see Methodology, subsection Indicators) into a quantifiable data-based assessment method using geospatial analysis (see Methodology, subsection Data analytics).
Damidavičius et al. (2020) provide an extensive overview of scientific approaches assessing the sustainability of urban mobility. In these studies, the USN is analysed and evaluated in its entirety based on differently defined indicators (cf. Litman, 2009). Methodologically, multi-criteria analysis (MCA) and cost-benefit analysis (CBA) are typically used (e.g. Beria et al., 2012; Campos et al., 2009; Melkonyan et al., 2022; Miranda and Rodrigues, 2012), whereby the weighting of the individual criteria is based on expert and stakeholder surveys. Numerous studies employ methods from network analysis (NA) to evaluate the quality and accessibility of a transport system (Chen et al., 2023). Space Syntax (SpS) is a prominent and widely used space-related method in this context (Mohamed and van der Laag Yamu, 2023). Introduced by Hanson and Hillier (1984), it employs graph theory to analyse urban spatial configurations. It posits that spatial layouts influence human behaviour and interactions (Turner and Penn, 2002). Using graph theory, it assesses urban layouts with regards to connectivity in order to gain insights into movement, visibility, and social interactions in urban environments (Batty and Longley, 1994). However, relevant factors to describe and evaluate accessibility such as the physical properties or qualities of the urban space, land use, or socio-demographic data are not considered in SpS. To address those method-based limitations (Pafka et al., 2020), other studies extended SpS by integrating additional data and methodological components, such as the Urban Network Analysis Toolbox. It uses buildings as spatial units for analysis (Sevtsuk, 2014); or, Karamitov and Petrova-Antonova (2022) who developed a method for assessing the pedestrian accessibility of PT stops in their respective service areas. Indices like the Walkability Index by Frank et al. (2010), the commercial product Walk Score® (2024), and others (Lefebvre-Ropars et al., 2017) take a different focus by emphasizing urban form and function. They compute the cumulative sum of land use, residential density, and intersection density in their model (Jeong et al., 2023). Overall, these approaches enable the evaluation of the accessibility of an area on the basis of a macroscopic view but do not take into account urban design features on micro-scale (Frank et al., 2010; Karamitov and Petrova-Antonova, 2022). That is the starting point for studies such as by Jabbari et al. (2018) or Garau et al. (2024) which combine NA with MCA. The latter, like also the work of Lam et al. (2022), add features of the built environment that are positively associated with walking, such as sidewalk density or green spaces. Yet what all these approaches have in common is that the methods generally assess larger territorial level, for example, statistical districts, not least due to data availability. Lam et al. (2022), for instance, employ the postal code areas as analytical unit which merges the data previously rasterized on a 25 m grid. To fill this research gap, we suggest to combine different mobility-associated elements and functions on macro- and micro-levels for the analysis and evaluation of accessibility.
Geospatial data analysis is widely applied in spatial and urban research as well as planning (Biljecki et al., 2023; Tao, 2013). The increasing amount of data holds great potential to better understand mobility behaviour, user needs, and deficits in cities and urban regions (Bolten and Caspi, 2021; Verma et al., 2021, 2023). As a basis for the data-based analysis of urban mobility networks in the German context, the authors identified, analysed, indexed, and categorized 113 data sources with 190 relevant data sets (D4UM, 2020). Despite this multitude of data sources, one fundamental problem is their availability. This concerns not only the data retrieval but, in particular, also the licensing restrictions of proprietary and user-generated data (D4UM, 2020).
Material
Data and software
This study utilizes QGIS 3.28 (2022) and spatial data from (i.) Open Street Map (OSM, 2021), (ii.) Copernicus Sentinel multispectral satellite imagery (ESA, 2021) and (iii.) supplemental data. The graphical representations of the computed data are generated on the basis of the GIS maps using Adobe Illustrator (Adobe, 2022). i. ii. iii.
Research area
This research is done for the city of Braunschweig, Germany, which is with a population of 250,000, a typical small ‘large city’ (<0.5 M inh.) by German standards. It is located between Hanover and Berlin north of the Harz Mountains along the river Oker and stands as one of the major urban centres in the polycentric region ‘Hannover Braunschweig Göttingen Wolfsburg’ set in a rural landscape. With the city’s rich history, Braunschweig showcases a blend of elements of traditional, medieval, and baroque to modern and contemporary planning epochs – that are also represented in the USN. The metropolitan region is characterized by close commuter linkages between its larger cities and smaller settlement units (Carlow et al., 2021). Braunschweig covers an area of 192.1 km2 with a mobility network of overall 919 km for all MoT (OSM, 2021). Due to the availability of data, the city size, and clear structure including different historical phases, we opted for Braunschweig as our case study area.
Methodology
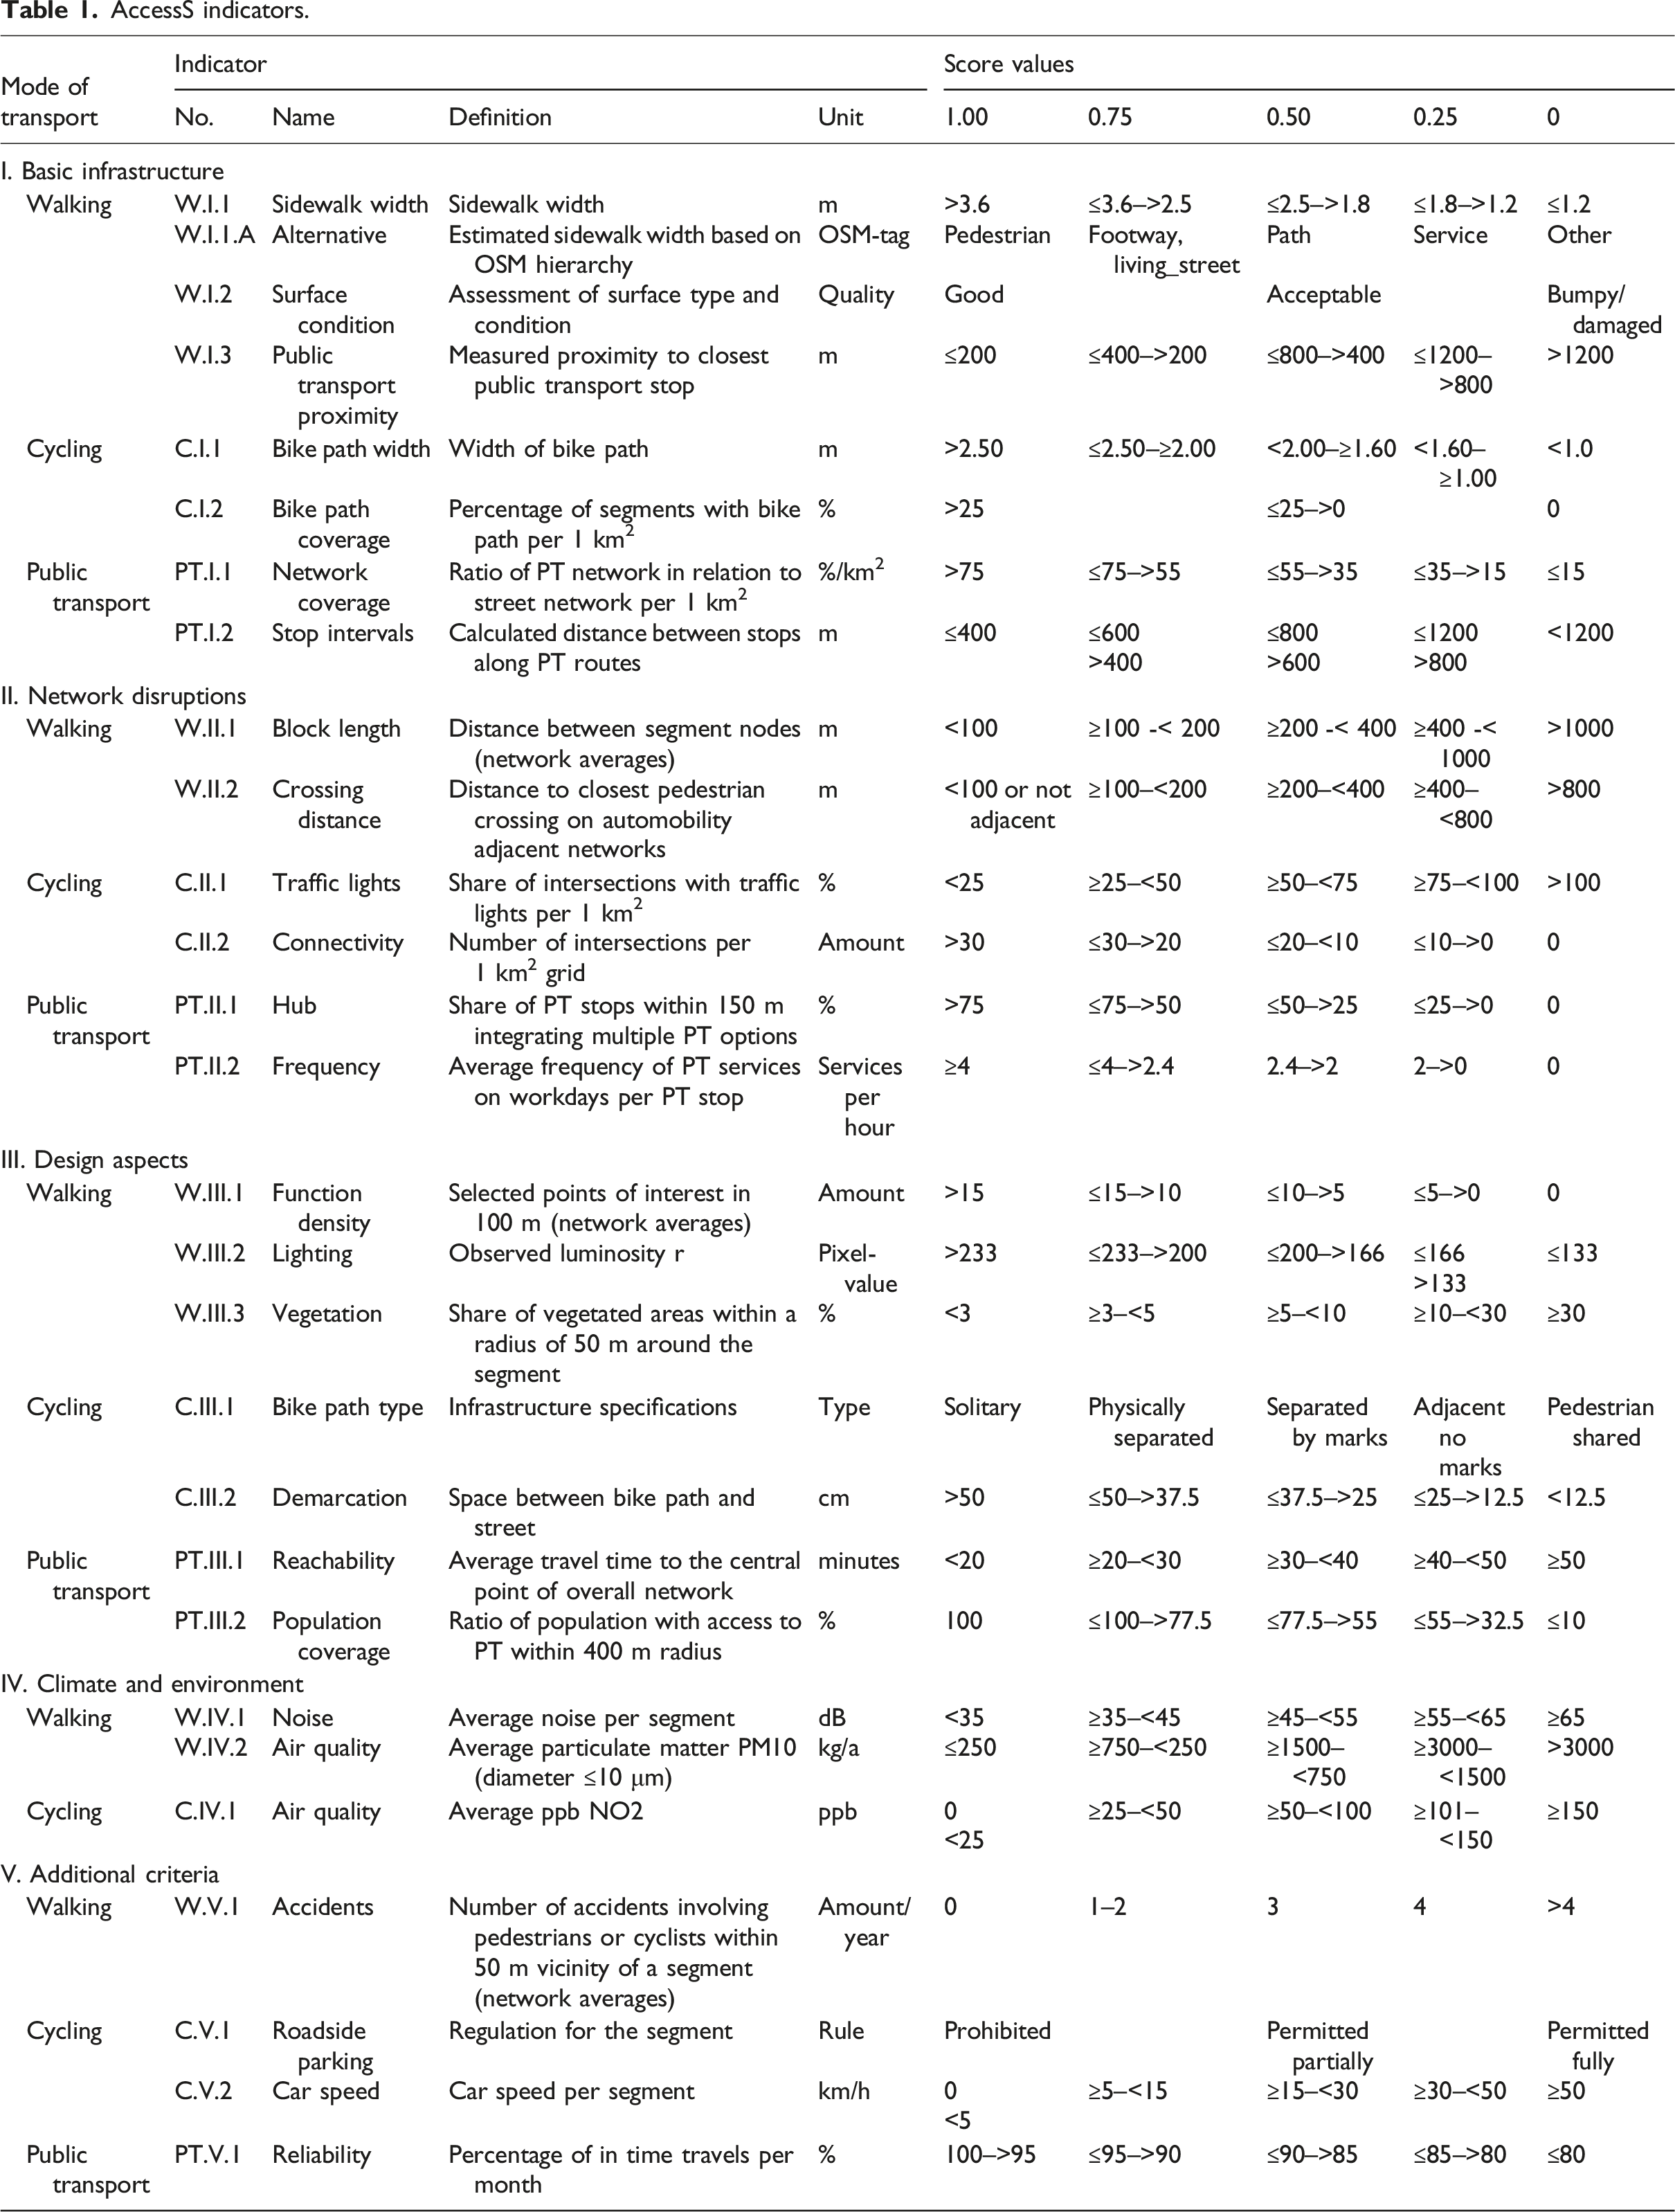
AccessS indicators.
Indicators
A literature review was conducted to identify impact factors on accessibility for the different MoT, which have been translated into indicators. A brief overview of the literature is given in the following, while details of how we conceptualize this quantified assessment are presented in Table 1. I. Basic Infrastructure: It describes basic infrastructural conditions of the physical network. This comprises the following: for MoT ‘Walking’, the width of the sidewalk (FGSV, 2002), condition of the surface (FGSV, 2002; FGSV, 2011), and proximity to PT services (El-Geneidy et al., 2014); for MoT ‘Cycling’, the width of the bike path (FGSV, 2010) and bike path coverage (Costa, 2008); for MoT ‘PT’, the stop intervals as well as network coverage (Carlow et al., 2021; Costa, 2008). II. Network Disruptions: It identifies conditions that disrupt the continuity of the network as well as measures to resolve these potential obstacles. This comprises the following: for MoT ‘Walking’, the block length (Sevtsuk et al., 2016; Stangl, 2015) and availability of zebra crossings (BMVI, 2001; PGV-Alrutz - Planungsgemeinschaft Verkehr and VMBW - Verkehrsministerium Baden-Württemberg, 2019); for MoT ‘Cycling’, availability of traffic lights (Hartanto et al., 2017) and connectivity described by the intersection density (Winters et al., 2011); for MoT ‘PT’, the availability of PT hubs (Costa, 2008) and PT frequency (Costa, 2008; Dijkstra et al., 2015). III. Design Aspects: It describes the quality of the built and un-built environment in which a segment is located. This comprises the following: for MoT ‘Walking’, function density (Dovey and Pafka, 2020), lighting (Cervero and Kockelman, 1997), and availability of green spaces or vegetation (Costa, 2008); for MoT ‘Cycling’, the type of bike path (FGSV, 2010; Hartanto et al., 2017) and its demarcation (van Acker et al., 2012); for MoT ‘PT’, the reachability (Costa, 2008) and population serviced (Costa, 2008). IV. Climate and environment: It considers dynamic conditions that impact health or comfort. This comprises the following: for MoT ‘Walking’, the noise level (Costa, 2008; Haag et al., 2018) and both for MoT ‘Walking’ and ‘Cycling’ the air quality (EPA, 2011; Winters et al., 2011). V. Additional Criteria: They include additional indicators for the safety of the network or enhancing features. This comprises the following: for MoT ‘Walking’, the share of accidents with involvement of pedestrians and cyclists (Costa, 2008; Osama et al., 2020); for MoT ‘Cycling’, if roadside parking is allowed (Blecic et al., 2015; van Acker et al., 2012) and car speed (Blecic et al., 2015; Wahlgren and Schantz, 2012); for MoT ‘PT’, the reliability of services (Costa, 2008; Soza-Parra et al., 2019).
Data analytics
The AccessS-framework follows a five-step process to analyse, evaluate, and visualize the accessibility of each segment of the network based on the indicators described previously. In this article, we focus on the description and discussion of AccessS for the MoT ‘walking’.
Step 1: identifying and aggregating suitable data for quantifying each indicator
In the first step, a data source for the assessment of each indicator is identified (Supp Table S01). After downloading the respective data in its original geometric type (points, lines, and polygons), the geometry types are aggregated and homogenized to match the indicators (Step 1).
Step 2: setting up MoT network
The “network ways” (segments) for the MoT walking and cycling are obtained utilising OSMnx, the PT network, is obtained through quick-OSM (2.1). These filtered network ways in line geometry type are used as a spatial base for evaluation by applying spatial analysis methods (Step 3) over the indicators’ data (Step 1).
Step 3: geospatial analysis
The indicators are quantified using GIS employing one of these three methods: i. ii. iii.
Step 4: scoring and weighting
The scoring process is carried out in two sequential steps; first the resulting computed values are represented as scores for each indicator; second the resulting scores are combined in a unified score. i. ii. The equal-scoring equation is as follows: AccessS Braunschweig: Score per indicator for MoT walking (Supp Figures S02–S12 for high-resolution maps).

Step 5: spatial visualization: inverse distance weighting (IDW)
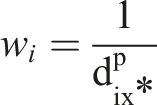
For spatial representation of the AccessS, a deterministic method of multivariate interpolation to map the values of known points (segments) to a finite set of points with unknown values has been adopted. Inverse distance weighting (IDW) is typically used to generate topographic elevation maps from a set of points with known altitude. In this implementation, Shepard’s method of IDW is applied to translate the accessibility values from the network segments to a regular two-dimensional symmetric spatial matrix according to the following formula: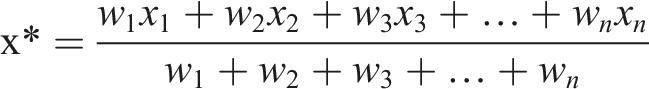
Results
The two main objectives of this study are (1) to provide a more holistic, data-based assessment framework and thereby (2) to describe the accessibility to the different MoT networks based on integrated geospatial data. Based on this the indicators and values can be validated and weighted in the course of further studies.
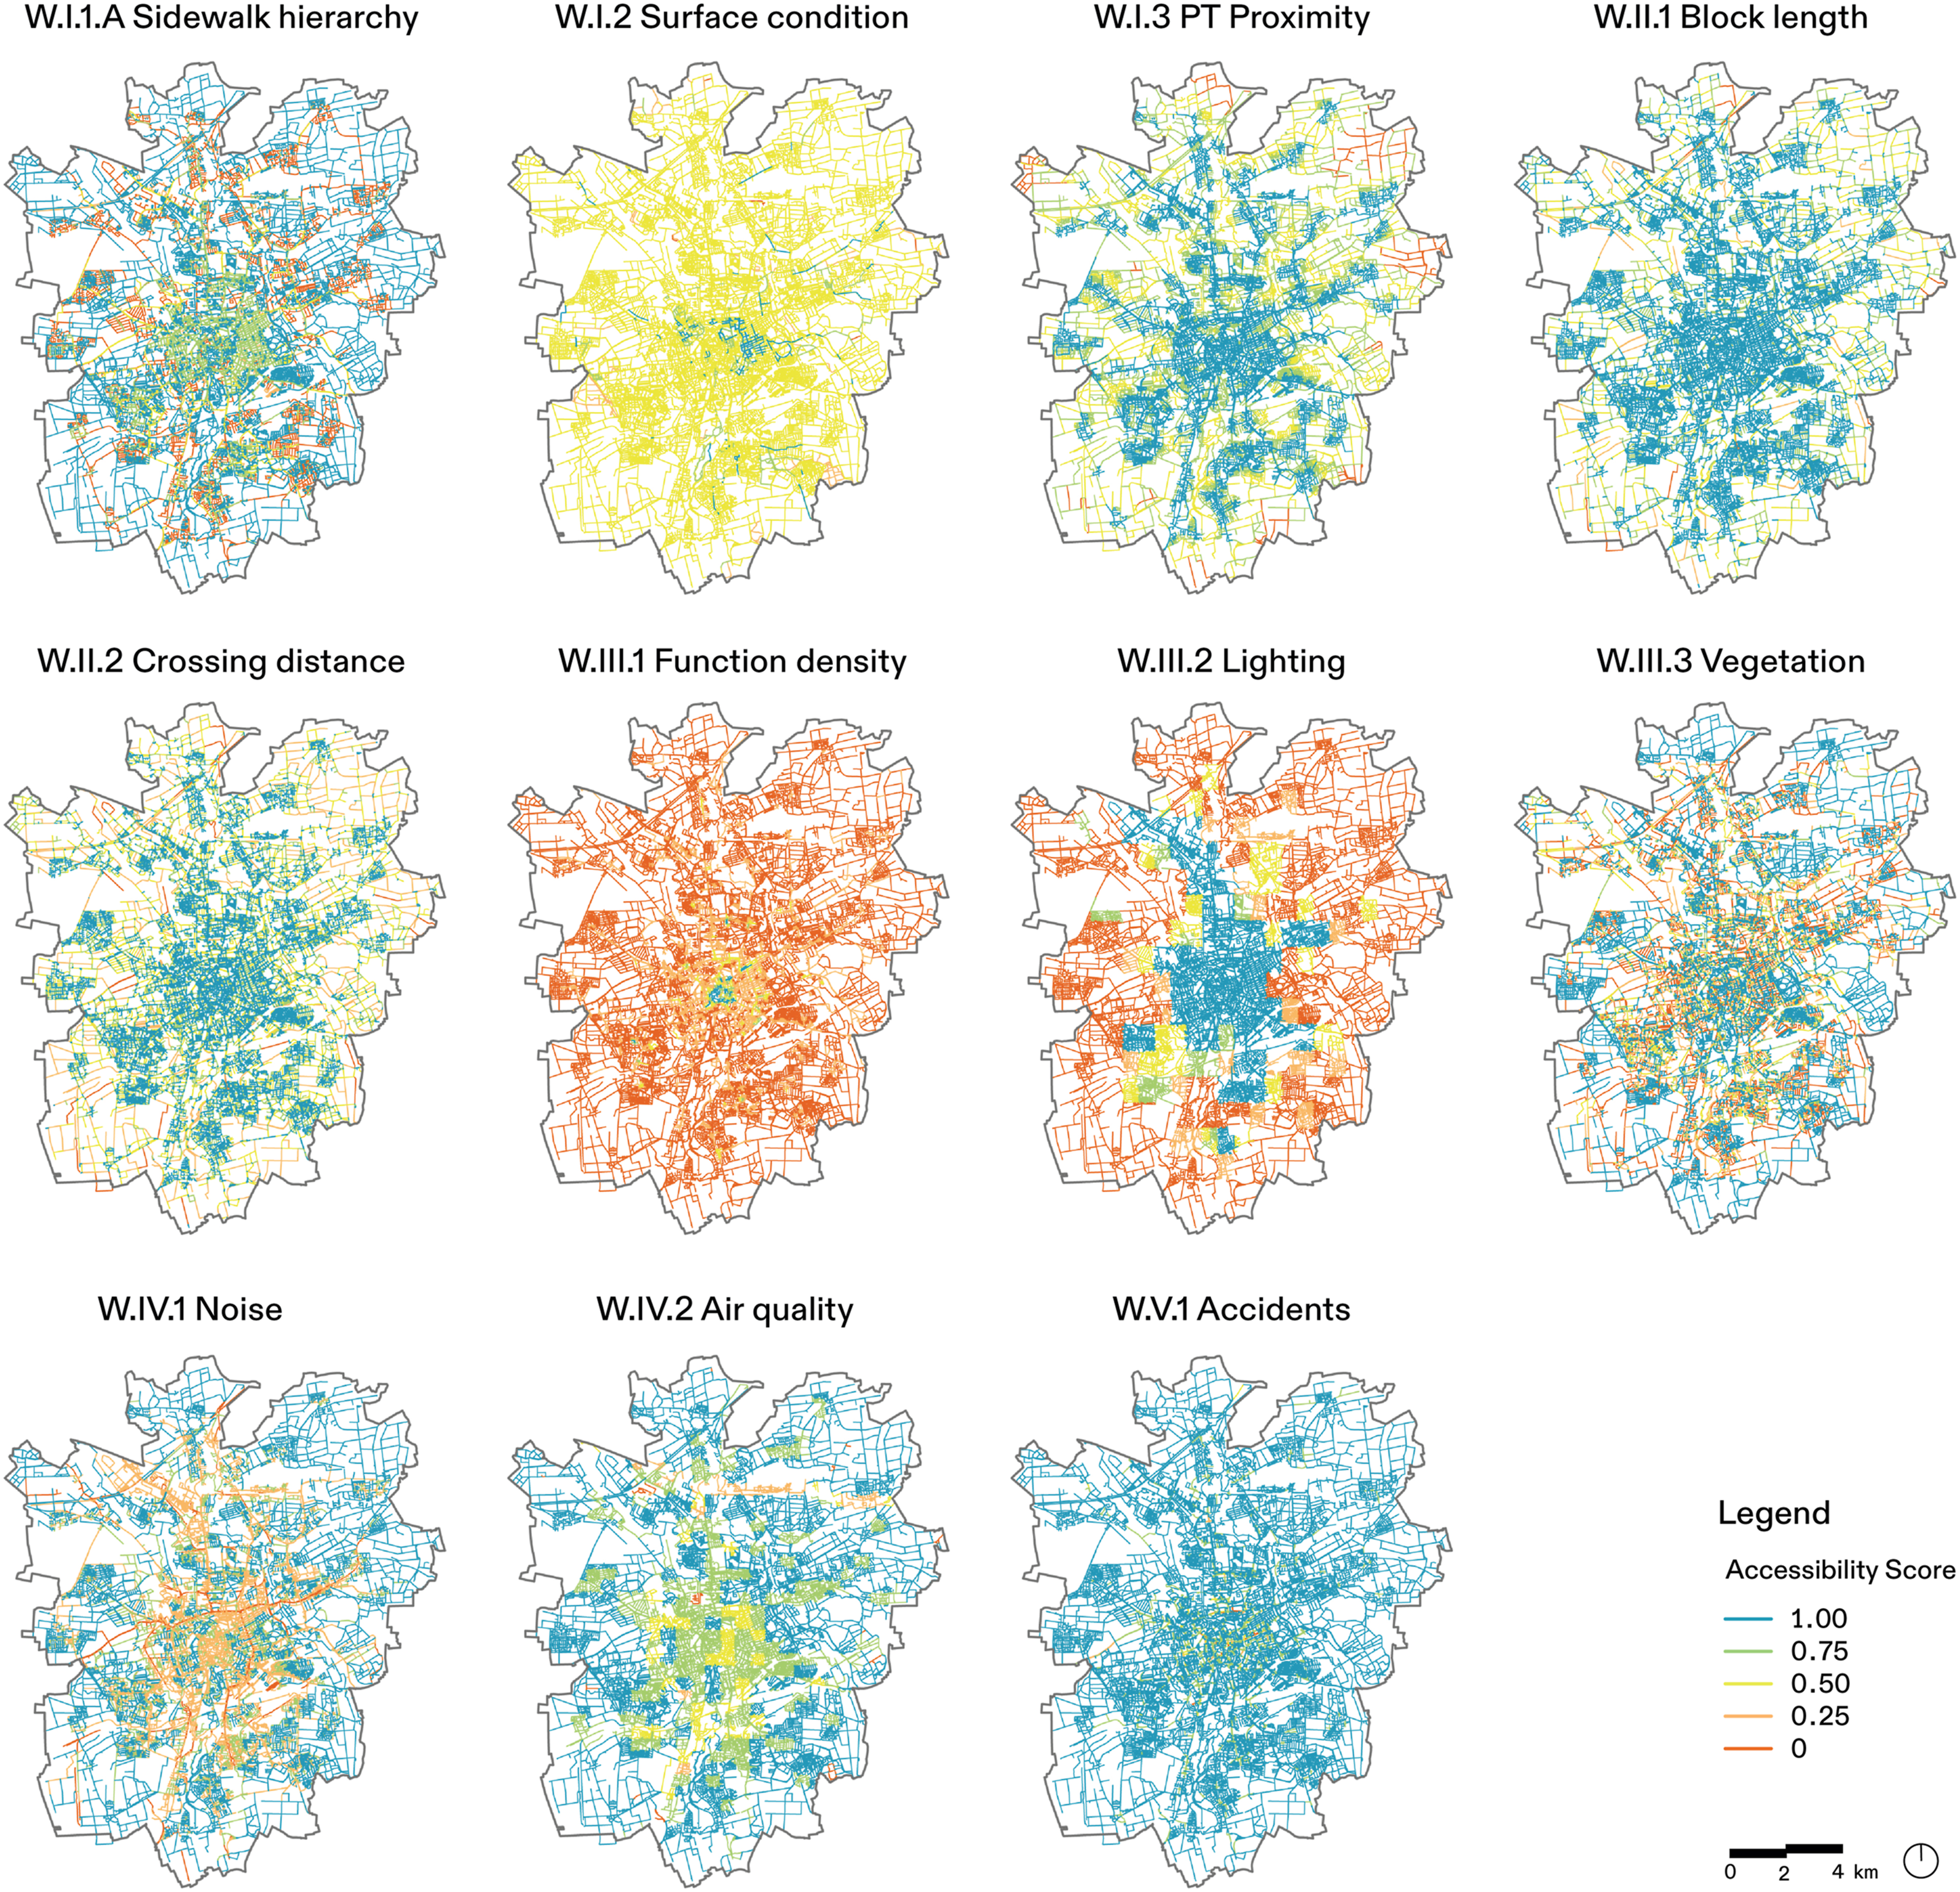
Evaluating the walking network according to the AccessS criteria (Table 1) results in 11 unique values for each segment (Figure 1). The weighted sum of these values (see Methodology Step 4) describes the AccessS for each segment of the walking network. The results follow the normal (Gaussian) distribution. It has a mean average of 0.684 which indicates an above-average pedestrian accessibility in the city. The ‘pedestrian’, ‘footway’, and ‘steps’ OSM tagged segments received the highest AccessS (over 0.7) on average. Car adjacent or car-based segments such as ‘trunk’, ‘primary’, and ‘secondary’ segments received the lowest scores (below 0.6) on average, confirming the assumed negative impact of automobility on nearby pedestrians.
AccessS walking Braunschweig: breakdown of the AccessS per indicator.
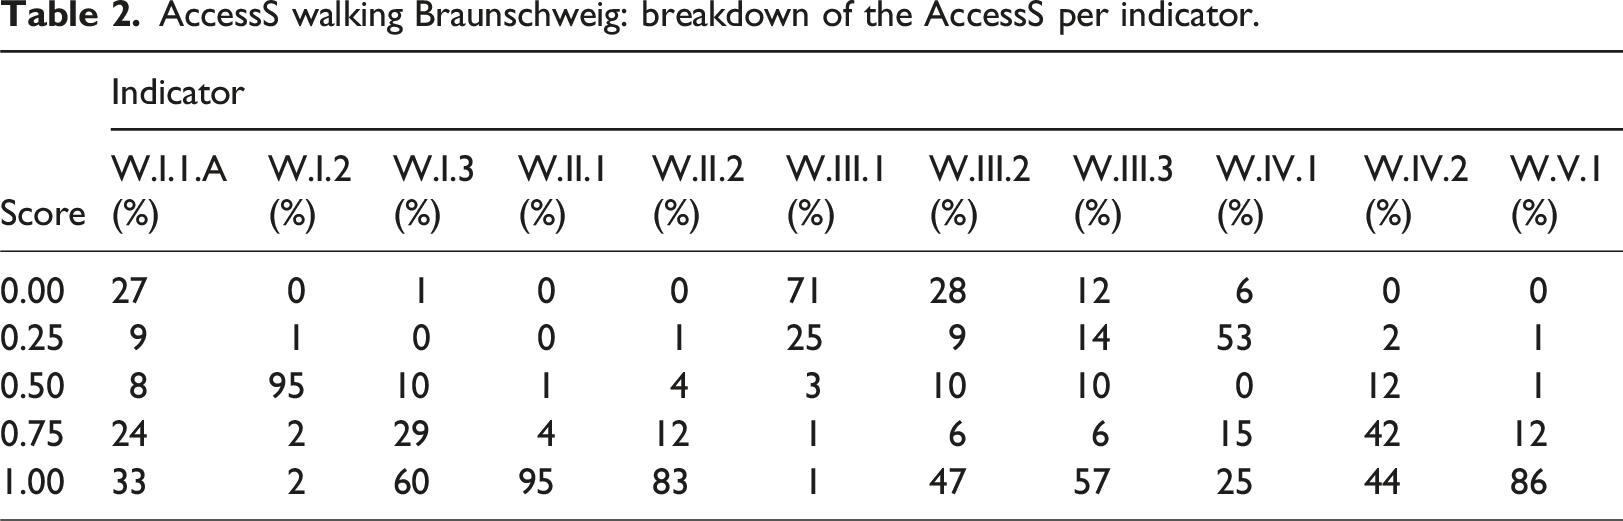
More than 55% of the segments of the MoT walking network score above 0.5 (Table 2: W.I.1. A). Braunschweig is well covered by PT, with around 90% of all walking segments within 400 m reach of a PT stop and over 99% within 800 m (Table 2: W.I.3). A total of 83% of walking segments in Braunschweig are either not adjacent to car lanes or within 100 m reach of a zebra crossing, around 4% of walking-segments are further than 400 m away from a crossing (Table 2: W.II.2), with the lowest scoring located on the outskirts of the city (Figure 1). About 70% of walking segments have none of the defined functions (dining, business, and tourism) available within a 100 m distance, whereas about 25% are within 100 m of at least one function, and about 5% have five or more functions within reach (Table 2: W.III.1), most of which are concentrated in the inner city (Figure 1). More than 50% of the walking-segments have excellent lighting conditions, while 28% have poor (Table 2: W.III.2), most of which are located in the outer areas (Figure 1). Areas with little to no vegetation account for about 12% of the total number of segments (Table 2: W.III.3) which are scattered mainly near the bypass and in industrial areas. High vegetated areas surround more than 60% of the walking-segments, in particular in parks, residential areas, and in the vicinity of the Oker River (Figure 1). Noise generated by vehicular traffic has a noticeable impact on the pedestrian network. About 60% of walking-segments face an estimated noise level above 55 dB during day time (Table 2: W.IV.1), most of which are adjacent to motor roads or located in downtown areas (Figure 1). Overall, air quality in Braunschweig appears to be good on an annual average basis, with an estimated 85% of walking segments scoring 0.75 and above (Table 2: W.IV.2). Approximately 170 accidents involving pedestrians or cyclists were recorded in Braunschweig for the analysis year, with 14% in the immediate vicinity of walking-segments (Table 2: W.V.1). A number of these recorded more than two accidents, so that these sections are to be classified as critical (Figure 1).
The areas of ‘Low Accessibility’ evident in Figure 2 are mostly superordinate roads (highway and national road) such as the A391 running tangentially in the west of the city with adjacent commercial and industrial zones and the B1 national road to the north running through an industrial agricultural landscape. Clearly visible is the interchange in the south of the city where A391 and A39 connect. The areas of ‘Low Accessibility’ to the east are state roads in the rural hinterland, with adjacent fields and forests. AccessS Braunschweig: spatial visualization applying IDW (MoT walking).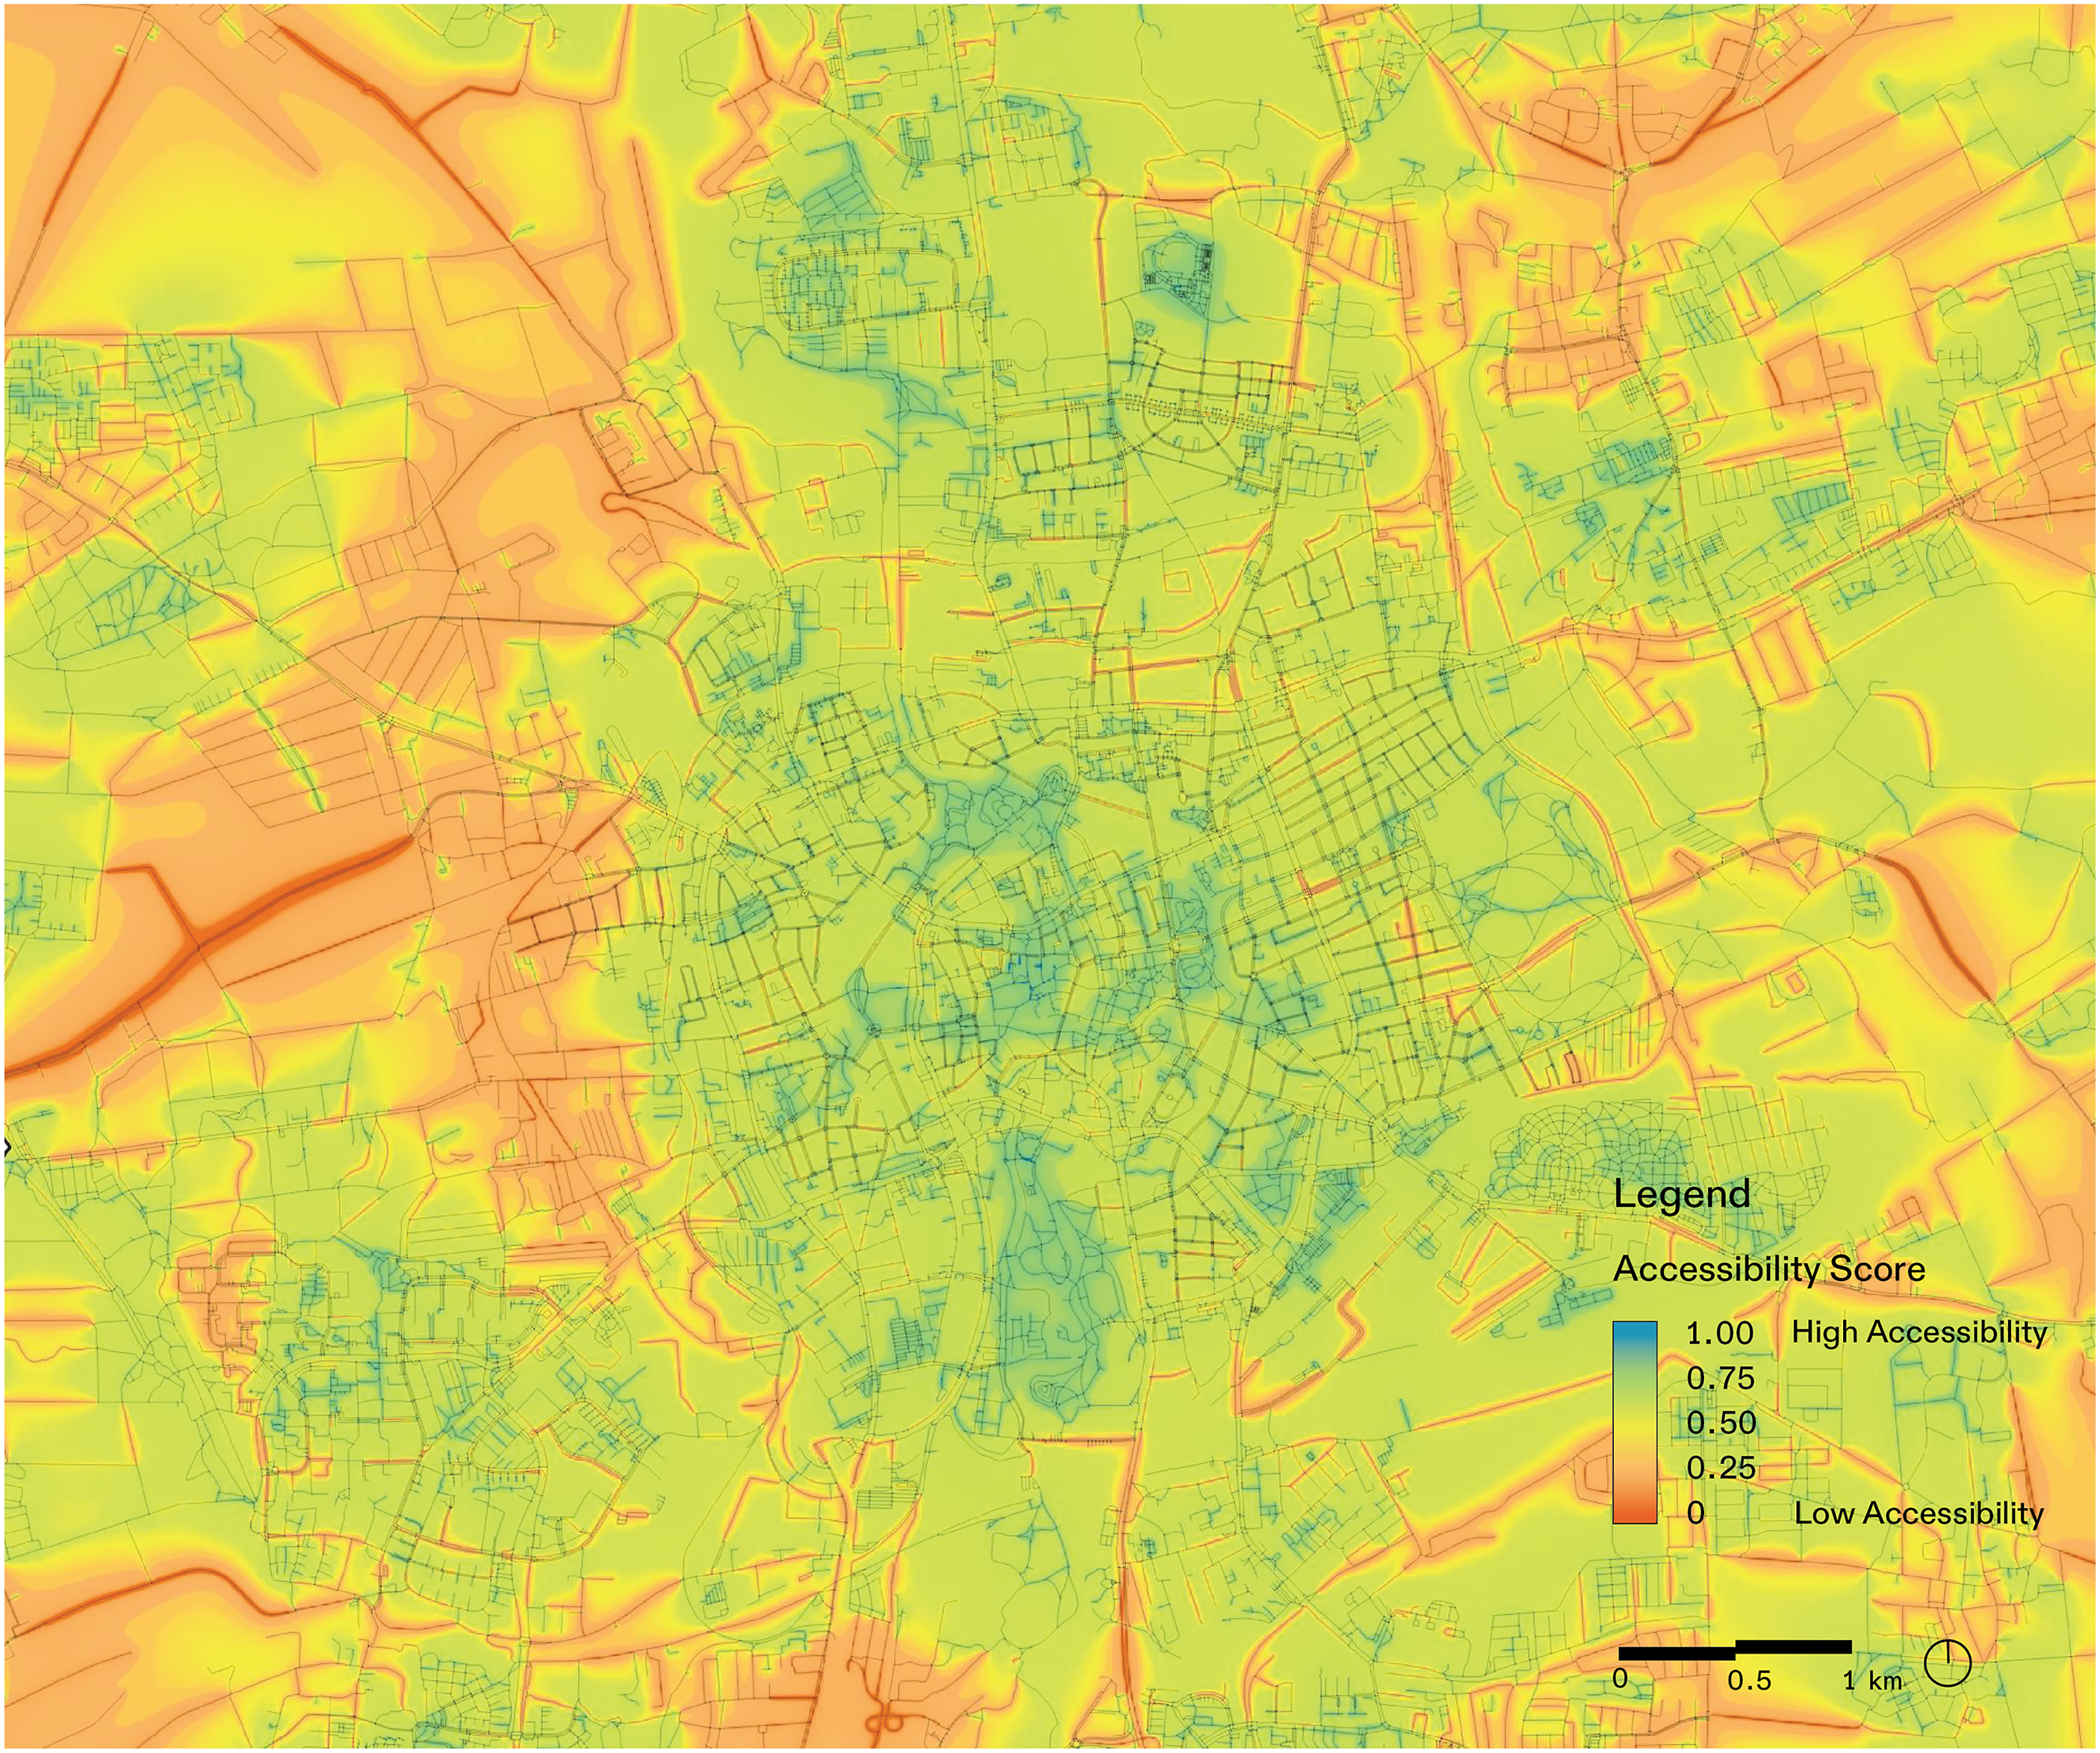
To a large extent, the areas with an AccessS of 1.0 are located in parks, such as the Bürgerpark in the southern city centre, the Prinzenpark northeast of it, the northern Gausspark, and further north at the lake Ölper See. The pedestrian zone in the city centre is also clearly identifiable as an area with very good walking conditions. These are essentially areas where motorized traffic is not allowed or strictly limited. The larger contiguous areas along the city fringe and outside the city with high accessibility are often allotment gardens for which essentially the same applies. Also, the large housing estates such as Weststadt in the west or Schwarzer Berg in the north exhibit a regular pattern of high accessibility.
Even though large areas visualized by IDW are shown in green (AccessS 0.75), in fact the segments themselves show a medium level of accessibility to a large extend. This applies in particular to the areas of the Wilhelminian period, such as the western and eastern ring areas, but it is also evident for the other built-up mainly residential areas of the city.
Discussion
Data availability poses a key challenge for assessing walkability in cities. Even if we were able to identify data needed to describe the defined walkability indicators, accessibility, data quality, and temporal and spatial resolution are often irreconcilable hurdles. Thereby, the deficiency of OSM data has a noticeable impact on the study, for example, the lack of information on sidewalk width addressed by using the segments tag (OSM highway’s hierarchy) as an alternative indicator. However, indicators like W.I.2 surface conditions are difficult to be replaced by existing alternatives, where more complex automated approaches, for example, deep-learning-based image classification, are necessary to predict the missing values. In this case, unclassified segments are assigned an average value of 0.5, which results in a significant peak of this value.
And yet, the results show that the developed process of a sequential geospatial analysis and integrated scoring approach is in principle able to accurately represent the accessibility of the mobility network by the proximity or reachability of the spatial and service network, taking into account system interruptions as well as other physical characteristics. Thereby, it enables the evaluation and empirical verification of the accessibility of transport networks for different MoT such as walking or cycling. Given the open availability and high geographic coverage of the data used, the framework is scalable and applicable to other cities. The quality of the analysis can be significantly increased with the aforementioned availability of relevant data.
Further refinements are possible in the respective geospatial analysis methods applied and data added. For example, the proximity analysis method can be enhanced by implementing a graph-based (non-Euclidean) measurement system, which ensures that the calculated distance reflects the realistic travel distance from the street segment to the object of interest using the chosen MoT. To enhance the spatial resolution of the analysis, each network way can be divided into equally distanced subsegments, resulting in enhanced resolution calculations on the cost of time and higher computation demand. Also, the AccessS is based on the evaluation of each individual segment and does not relate it to the network as a whole. Presumably, the approach would benefit from further sophistication in terms of actual reachability at the network level, for example, using network analytics such as PageRank.
Even if the results of the developed and applied method are promising in terms of applicability and feasibility, consequently, this requires for the evolution of the AccessS (a) the validation of individual indicators and their evaluation through field studies and human-centred experiments, (b) the weighting of individual indicators in terms of their relevance related to the impact on, for example, pedestrian friendliness, and c) the availability to integrate new relevant data sources. This also includes expanding it to include other indicators.
By assessing the connectivity of mobility and urban spaces in the network, AccessS provides an assessment framework which potentially allows to gain new insights for sustainable mobility design and urban design. A key principle of the AccessS is that sustainable neighbourhoods are created by efficiently connecting origins and destinations and developing urban spaces that support diverse modes of mobility.
Outlook
We consider this study to be a proof of concept of the AccessS. In addition to the challenges and questions already outlined in chapter 5, which future research may address, the potential for application (and enhancement) in science and practice deserves to be further explored. The AccessS framework itself is an adaptive concept which allows for integrating and validating new insights and the refined describing of mobility behaviour, preferences, and needs of pedestrians gained through further studies. In the further development, also with regard to productive systems, the linking with reliable, constant, and current (up to real-time) data sources (or platforms) is necessary. Alongside the mostly static indicators that currently form the basis of the AccessS, a significant added value for research and practice lies in the linkage with dynamic data, for example, socio-demographic information, weather and climate, infrastructure conditions, ephemeral events, construction sites, or MoT-dependent street user volumes. Building on the research, applications such as dashboards, GIS integrations, or an evaluation module within a digital twin can be developed for holistic urban transport planning and management. Furthermore, the AccessS for different MoT could be compared to identify trade-offs between the three.
Supplemental Material
Supplemental Material - Accessibility Score – Data analytics for the holistic assessment of urban mobility networks and the case of Braunschweig
Supplemental Material for Accessibility Score – Data analytics for the holistic assessment of urban mobility networks and the case of Braunschweig by Olaf Mumm, Majd Murad, and Vanessa Miriam Carlow in Journal of Environment and Planning B: Urban Analytics and City Science.
Footnotes
Acknowledgements
We acknowledge the contribution of Maycon Sedrez to this study as a research associate at ISU – Institute for Sustainable Urbanism at Technische Universität Braunschweig.
Declaration of conflicting interests
The author(s) declared no potential conflicts of interest with respect to the research, authorship, and/or publication of this article.
Funding
The author(s) disclosed receipt of the following financial support for the research, authorship, and/or publication of this article: This work was partially funded by the German Federal Ministry of Education and Research (BMBF) under the project ‘Data4UrbanMobility’ (grant ID 02K15A044).
Data availability statement
The datasets generated during and/or analysed during the current study are available from the corresponding author on reasonable request.
Supplemental Material
Supplemental material for this article is available online.
References
Supplementary Material
Please find the following supplemental material available below.
For Open Access articles published under a Creative Commons License, all supplemental material carries the same license as the article it is associated with.
For non-Open Access articles published, all supplemental material carries a non-exclusive license, and permission requests for re-use of supplemental material or any part of supplemental material shall be sent directly to the copyright owner as specified in the copyright notice associated with the article.