
Abstract
The Space-Time Budget (STB) method is used to collect spatial and temporal features of an individual’s activities and is an important technique to explore relationships between the environment and crime. This spatial and temporal approach to the study of everyday activity spaces reveals much about victimisation experiences, the relationship between place, time, and perceptions of safety, and where and when offending may occur. Few studies, however, consider the relationship between living in a criminogenic place (neighbourhood crime) and people’s daily activity patterns. Drawing on disaggregate app-based data for 50 participants tracked over a 7-day period, we use sequence analysis to first delineate time allocation to each activity on a minute-by-minute basis. Next, using result from the sequence analysis we introduce the multiple discrete-continuous extreme value (MDCEV) model to understand how neighbourhood crime and socio-demographic characteristics influence individuals’ time allocation to discrete daily activities. Results reveal that neighbourhood drug and violent incidents exert restrictions on an individual’s propensity to spend time outside the home. Females and older people appear more likely to be constrained by the presence of neighbourhood crime (in particular drug and property incidents) as they allocate less time to outdoor activities. The principal utility of the current study is its methodological advancement and the practical insights for urban planning regarding the design of crime prevention strategies to increase guardianship in public places.
Keywords
Introduction
Individual activity patterns describe the myriad of places that people frequent and spend time as part of their daily activities (Bhat and Koppelman, 1999; Timmermans et al., 2003). As a cornerstone of time geography (Hägerstrand, 1970; Lenntorp, 1976), analysing the temporal and spatial dimensions of everyday individual mobility activities (Kwan, 1998) provides an important framework to understand individual and collective behaviours. Studies to date have understood activity patterns through the lens of time allocation to activities including work, education, leisure, and caring duties. This approach has contributed to a broad range of fields including urban planning (Anderson, 1971; Forer and Kivell, 1981), public health (Casas et al., 2010), and recreation (Fennell, 1996).
Activity patterns are also core to a voluminous scholarship concerned with crime prevention (Boettner et al., 2019; Browning et al., 2021). For example, Routine Activity Theory proposes that crime is the assemblage of a willing offender, a potential victim and the absence of a capable guardian (Cohen and Felson, 1979). Individual exposure to potentially risky social and physical environments is therefore a function of an individual’s activity nodes and the time spent in particular places (Brantingham and Brantingham, 1993). Activity patterns provide additional theoretical insights pertaining to the relationship of place and crime. Studies incorporating activity patterns reveal the importance of overlaying the conditions of the places people live with their routine activities (Browning et al., 2017). From one, one might conclude that people who live in violent neighbourhoods may be more likely to stay at home compared to those who live in safer neighbourhoods. While scholarship examining this relationship is limited, there is some evidence suggesting that in criminogenic neighbourhoods, parents are more likely to exert enhanced parental control over their adolescent’s activities (Furstenberg et al., 2000; Maimon and Browning, 2012).
To better capture activity patterns, time spent in activities, and their association with crime, Wikström (2007) pioneered the development of the Space-Time Budget (STB). The STB is a method which helps to generate the data that captures the interaction of particular individuals with specific environments at a location and time (convergence) (Hardie and Wikström, 2021). The STB methodology captures hourly activities of individuals alongside detailed information describing the purpose of the activity (e.g. shopping, sports, and commuting), its location (e.g. shopping centre, university, and home), and with whom the activity is undertaken (e.g. alone, with friends, with colleagues, or with parents). Wikström (2007) and his colleagues’ introduction of the STB methodology in criminology, through its application in the Peterborough Adolescent and Young Adult Development Study (PADS+), resulted in a more granular understanding of the interaction between the environment, an individual’s own characteristics and their experiences with crime. The data collected based on the STB methodology is used to delineate how people allocate their time across various activities (e.g. at home, work, and school). For instance, Wikström et al. (2012) find that young people aged 13–17 tend to follow a similar activity pattern between the weekday hours of 8 a.m. and 4 p.m. as they spend majority of time at school. Their research also reveals that young people have an average of 5 to 6 h of spare time after school and spend half of this spare time (around 3 h) with peers, often on the way home.
To visualise the time spent in different activities in a given day, a conventional approach used in STB related research is to calculate the percentage of time allocated in each time unit (e.g. for a given hour) (e.g. Copperman and Bhat, 2007; Wikström et al., 2012). A recent approach that has been widely used to temporally explore and visualise people’s time spent in activities is sequence analysis. Sequence analysis offers the opportunity to empirically determine sequences of daily activities which take place across a set of given physical locations in a day (e.g. McBride et al., 2019; McBride et al., 2020; Shi et al., 2022; Su et al., 2020). Specifically, by employing sequence analysis, each time unit (e.g. minute or hour) of an individual’s time spent in a specific location or activity is classified into a ‘state’ (e.g. at home, at the workplace, and at school). This approach examines transitions between ‘states’ and in doing so captures the amount of time allocated to each ‘state’. Current scholarship has employed sequence analysis to delineate time allocation in activities using highly granular units of time, including activities hour by hour and even minute by minute (McBride et al., 2020; Su et al., 2020, 2021). Additionally, sequence analysis advances traditional approaches that are often employed to examine time spent in different activities (e.g. visualising the percentage of time allocated in each time unit by plotting a suite of line charts) in its capacity to delineate between different broad types of daily activity patterns (i.e. comprised a set of distinct states) such as a ‘home day’, ‘a work at home day’, and ‘a mostly out of home day’. We suggest that sequence analysis is a useful complement to existing empirical approaches used in STB studies (e.g. Averdijk and Bernasco, 2015; Wikström et al., 2012) as it allows for the development of broad classifications of an individual’s activity patterns. Classifying people’s activity patterns using sequence analysis affords new opportunities for STB studies to reveal and visualise heterogenous activity patterns across a given population.
A large scholarship in criminology (e.g. Dong et al., 2020; Hoeben and Weerman, 2014; Wikström et al., 2018) has employed the STB methodology to explore person-environment interaction. For example, the study by Dong et al. (2020) identified that being in a public space without capable guardians and engaging in unstructured activities increases the probability of violent victimisation during both the day and night. Using an artificial neural network approach, Wikström et al. (2018) found that people’s crime propensity (e.g. their personal morals and abilities to exercise self-control), and criminogenic exposure (e.g. engaged in unstructured activities in residential areas of poor collective efficacy) led to a higher probability of committing a crime. In another study using the STB methodology, findings revealed that the absence of guardians, being in a public place, the presence of adolescents, and alcohol consumption increased an individual’s risk of victimisation (Averdijk and Bernasco, 2015).
The STB research reveals that a criminogenic environment is likely to influence victimisation or offending, yet what is less clear is how exposure to criminogenic settings influences an individual’s time allocation for a particular setting along with their daily activities. There is some evidence of how this might work. For example, Janssen et al. (2014, 2016) examined the association between parenting and adolescents’ time spent in criminogenic settings (e.g. pubs and parks), showing that parental monitoring reduces adolescents’ time spent in criminogenic settings. Examining young people aged between 13 and 17 years old, Wikström et al. (2012) identified that individuals with a high crime propensity tend to spend time in non-residential land uses such as commercial and entertainment. However, these studies aggregate the time spent in different places (e.g. public places after dark) into a single measure and thus are not able to fully capture the potential heterogeneity of public places when understanding the relationship between parenting and time spent in different types of criminogenic setting. Parenting may exert different types of influences on spending time in different kinds of public places after dark. For example, parental control may be lessened for adolescents wanting to spend time going to the movies or out to dinner. In contrast, it might be heightened for those who are likely to spend time in or around areas after dark that increase the risk of delinquency or victimisation (e.g. parks or pubs).
In the current study, we consider if and how a multiple discrete-continuous extreme value (MDCEV) modelling approach that are often used in transport studies (Bhat, 2005; Calastri et al., 2017; Kapur and Bhat, 2007; Palma et al., 2021) can be used to extend the current approaches used in STB scholarship. The MDCEV modelling approach can identify individual and household characteristics, car availability, and land use characteristics that together act to shape activity decisions. For example, young people are more likely to engage in outdoor activities, and low-income households’ show a preference for in-home activities (Calastri et al., 2017, 2020; Kapur and Bhat, 2007). Higher level of land use mix increases the probability of engaging discretionary activities but decrease the preference of performing mandatory activities (Khan et al., 2022). In the present research, we apply the MDCEV model to examine the relationship between socio-demographic characteristics, neighbourhood crime, and time allocation to activities. In particular, we assess if the levels of crime in a neighbourhood crime influence the time allocated to activities outside of the home and if this patterning is distinct from people living in safer neighbourhoods (e.g. DaViera et al., 2020; Foster and Giles-Corti, 2008; Mahmood et al., 2012). Furthermore, to better reflect and visualise the time spent in each activity, we further the work of Su et al. (2020), and McBride et al. (2019) and adopt a sequence analysis to delineate time allocations to each activity at a fine temporal granularity (i.e. minute by minute) and delineate groups of daily activity patterns (such as ‘home day’, ‘work at home day’, and ‘mostly out of home day’). The utility of this study is twofold: (1) introducing a new modelling approach (using the MDCEV modelling approach) to enrich the existing criminology STB research; and (2) placing a focus on time spent on individual daily activities and how these activities might be shaped by neighbourhood crime.
Analytic approach
Case study context – South East Queensland
South East Queensland (SEQ) is a political and administrative region of Queensland, Australia, with approximately 3.8 million population (2020) covering 35,248 square kilometres (idcommunity, 2021). The SEQ region consists of major population centres of Queensland such as Brisbane, Gold Coast, Sunshine Coast, and Ipswich. SEQ is in the subtropics where there are relatively small annual variations in temperature. Brisbane, the State capital of Queensland, has an average maximum temperature of 22°C (mid-winter) and 29°C during mid-summer. We know that an individual’s activities and indeed crime are shaped by prevailing weather conditions (Corcoran and Zahnow, 2022); however, given the low intra-annual temperature variability, temperature is expected to exert only a small influence on individuals’ daily activities (Tompson and Bowers, 2015). To this end, there are relatively small seasonal variations in crime for and thus SEQ offers an interesting case study context to understand the way in which an individual’s time allocation to daily activities might be shaped by crime.
Data
Pilot study (individual activity trajectories)
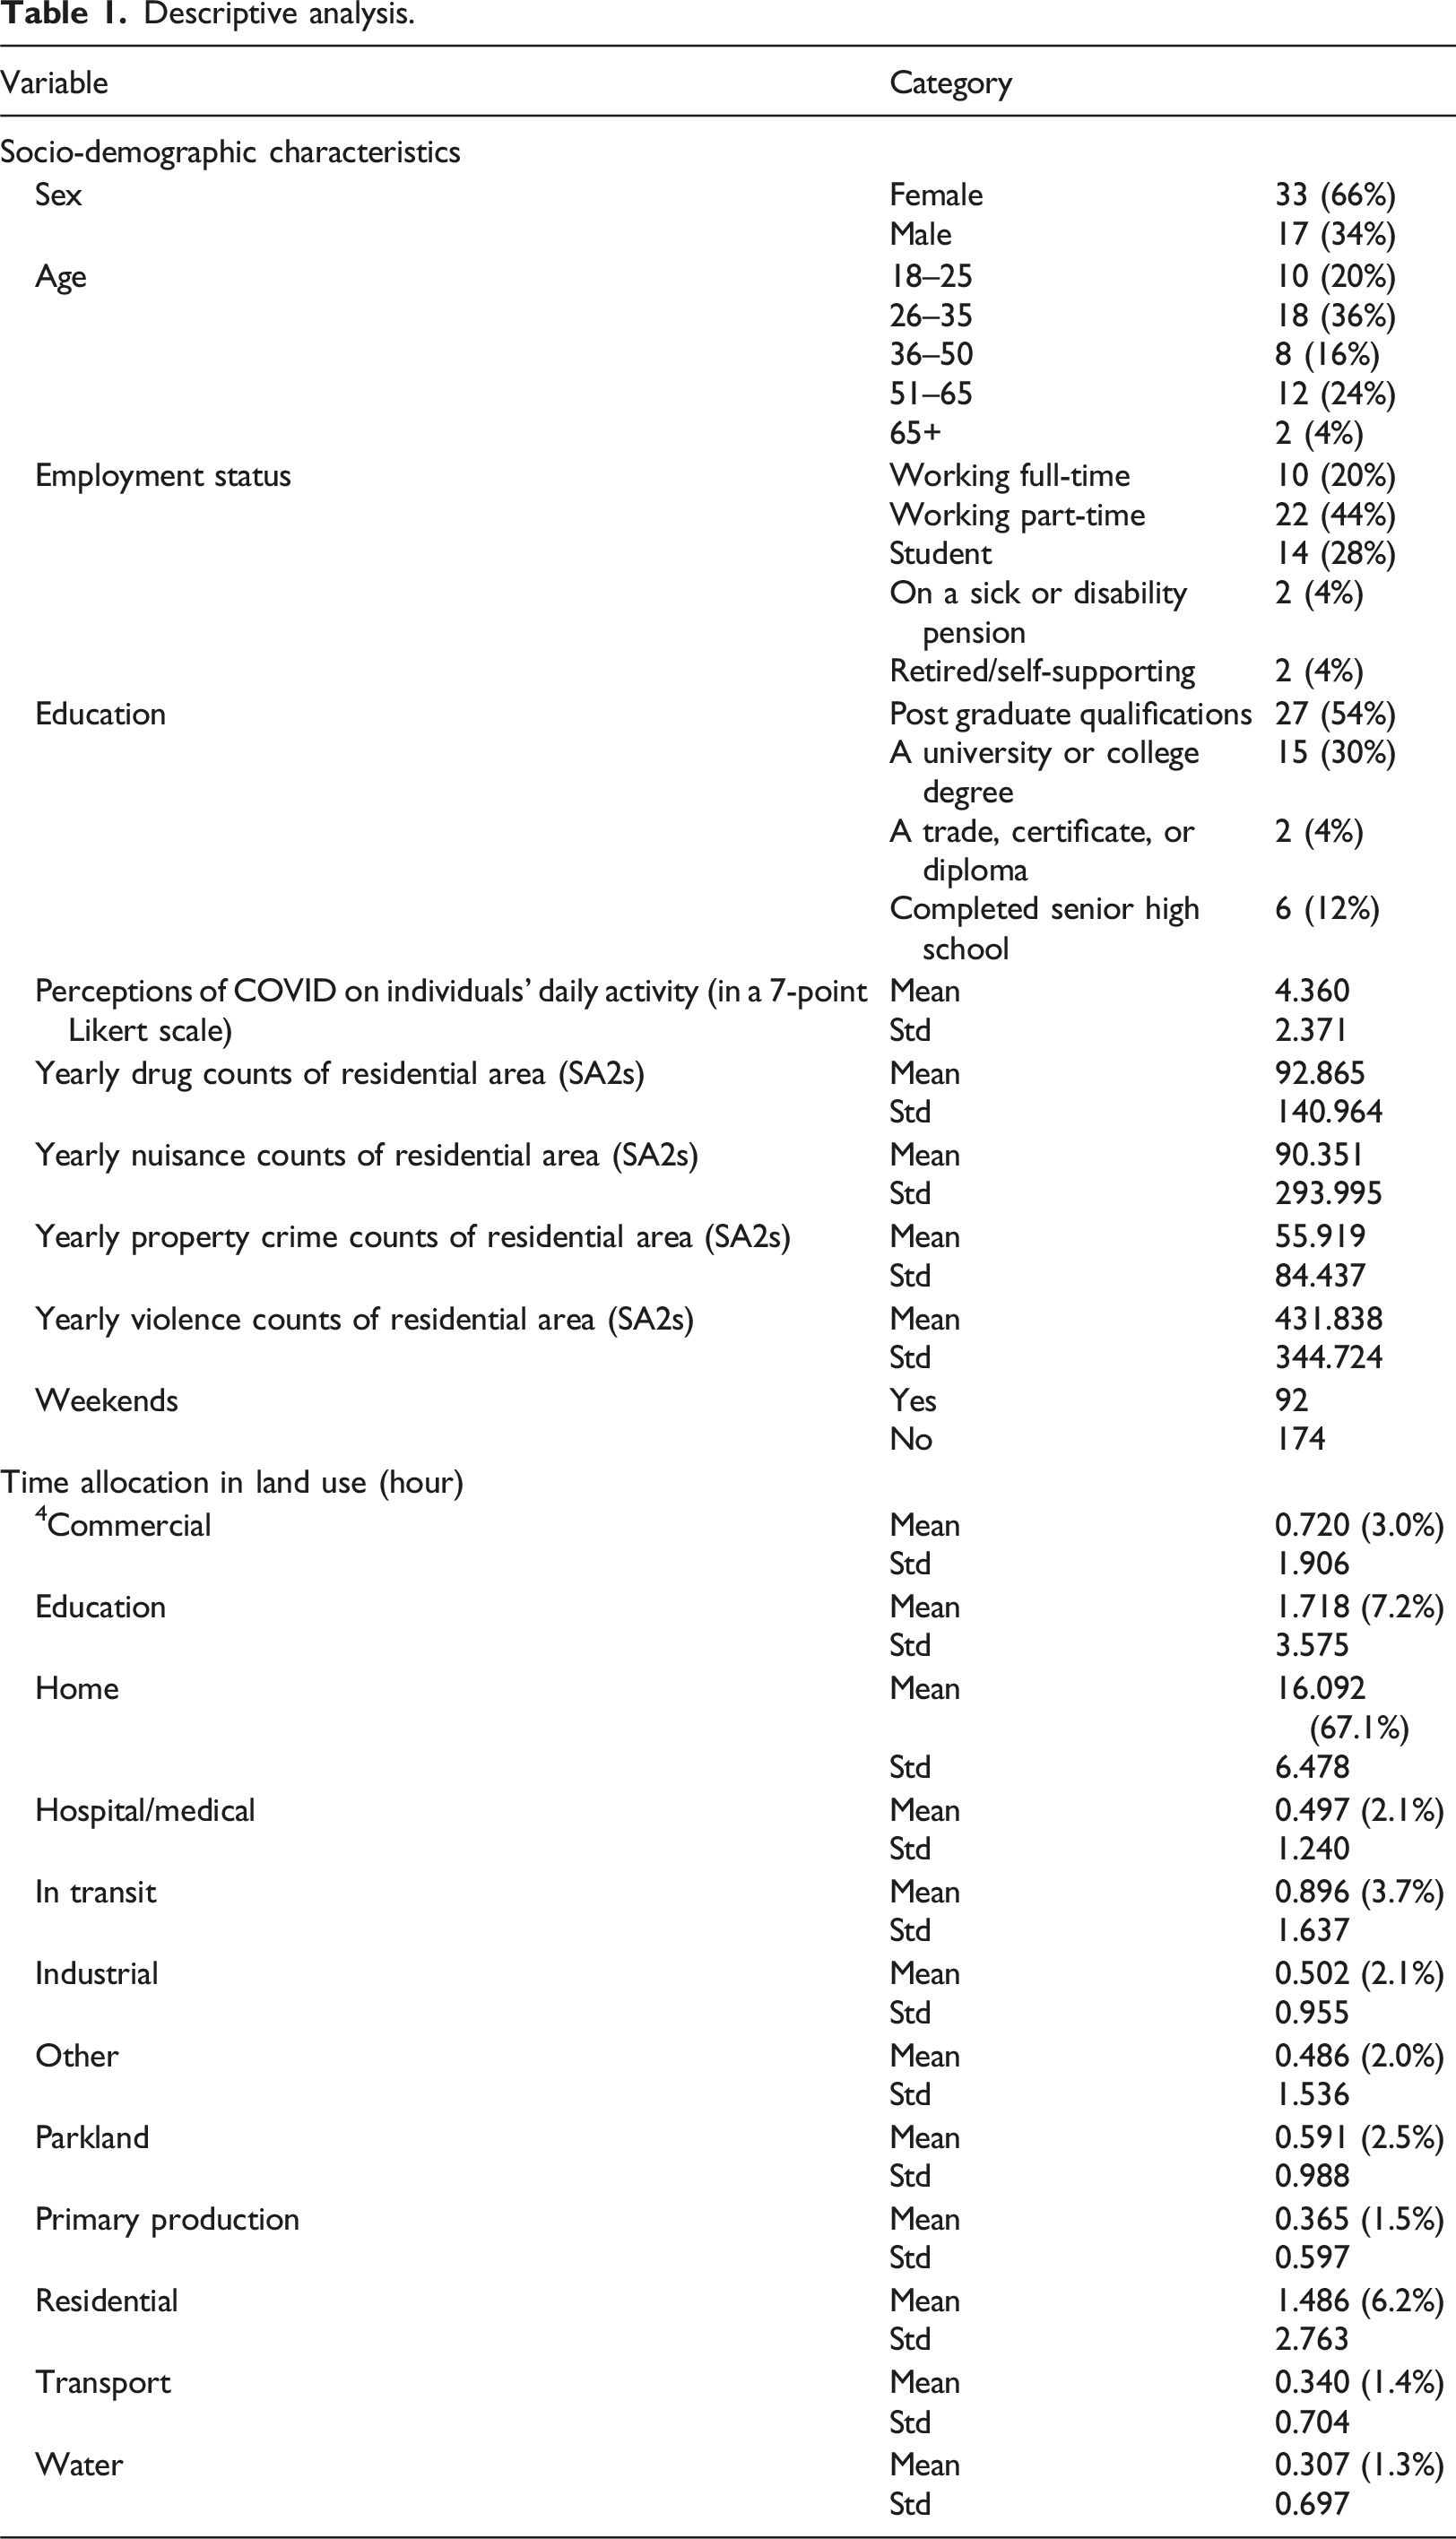
We used a pilot dataset collected from 3rd June to 23rd June in 2022 as part of an Australian Research Council (ARC) project using the app ‘Catalyst’ developed by MetricWire. 1 There were a total of 64 participants aged 18 over who completed 7 days of tracking. The app captured socio-demographic characteristics (e.g. age, sex, and education) and perceptions of COVID-19 influencing their daily travel, followed by passively recording participants’ locations over the 7-day survey period. Of the 64 participants, 50 participants completed the socio-demographic survey and completed tracking for at least 2 days, generating a total of 266 trajectories 2 .
The app was configured to send all participants five short surveys per day, regardless of whether they were physically at or outside their home. The survey collected individuals’ perception of risks, their primary purpose for being in a particular place (e.g. shopping, working, and recreation), and whether other people were present. On average, 24% of participants who left their home and completed 1 survey while only 4% of participants fully completed all surveys (5 surveys) per day. This indicates that useful information in the form of perceptions of risks and activity types was unable to be consistently captured for all participants. As such, for the current study, participants’ locational data was integrated with land use data to infer the places where they were located and activities that were being undertaken. That is, the ‘measured’ time spent in land use in this study serves as a proxy measure for an individual’s ‘activity’.
Land use
Land use data was retrieved from the 2021 Australian Census at the mesh block level which is the smallest geographic unit, containing 30–60 dwellings (Australia Bureau of Statistics, 2021). 3 There are 10 land use categories that are uniquely assigned to a given mesh block including commercial, education, industrial, parkland, residential, and hospital/medical, and transport (i.e. road or rail features), primary production (i.e. agriculture), water (i.e. water bodies), and other.
Crime
While we know that neighbourhood crime is important for the way people use space, we do not know the way in which crime influences individual’s daily activity (Carver et al., 2008; Ferrell and Mathur, 2012; Foster and Giles-Corti, 2008). When examining crime, we delineate four crime types (namely, drug, nuisance, property, and violence) and this draws on previous studies that use similar classification (Lee et al., 2021; Zahnow et al., 2021). To understand how the neighbourhood’s crime rates shape people’s daily activities, these four types of crime were considered in this study. Counts of crime for mesh blocks over the period 2021–2022 were downloaded from the Queensland Police Service (Queensland Police, 2021). The existing literature shows that the counts of crime (i.e. police recorded crime) exert influences on individuals’ activities (e.g. Astell-Burt et al., 2015; Zahnow et al., 2021) but limitedly reflect the fear of crime (Prieto et al., 2020). A limitation of the pilot data is the unavailability of crime perceptions, but it is an important feature to capture in future work. Given that the mesh block level is the smallest geographic unit with only 30–60 dwellings, the crime data is aggregated to Statistical Areas Level 2 (SA2s) which contain a population between 3000 and 25,000. The crime incident types (drug, nuisance, property, and violence) were aggregated to the SA2s to characterise crime in participants’ home neighbourhood. According to the correlation matrix, drug incidents are highly correlated with both violence (0.948) and nuisance (0.899) incidents, and there is a strong correlation between nuisance and violence incidents as well (0.893). The correlation matrix is attached to the supplementary document which also clarifies the reason why we do not combine these four variables (drug, nuisance, property, and violence) into one variable (neighbourhood crime).
Descriptive statistics
Descriptive analysis.
Results and discussion
Sequence analysis
A sequence refers to a subject moving from one discrete ‘state’ to another at the time points. The states represent the types of land use that people stay or visit during their daily travel. In total, we use the 10 types of land use (as identified through the ABS Census) for mesh blocks. Given that crime incidents are more likely to impact walking and cycling compared to driving vehicles (Foster et al., 2014; Kramer et al., 2013), the states are coded as ‘in transit’ when moving by cars. The state ‘home’ refers to staying at home. Following by the work of Su et al. (2020), this study uses a fine-grained operationalisation of time allocation to land use. As a result, a total of 1440 min is used as the daily sequence for the sequence analysis. For instance, a sequence with the length of 5 min is coded as x = (Residential, Residential, Parkland, Parkland, Parkland), meaning that an individual spends 2 min staying in residential, and 3 min in parkland. An example of data structure for the sequence analysis is shown in Figure 1. An example of data structure for the sequence analysis.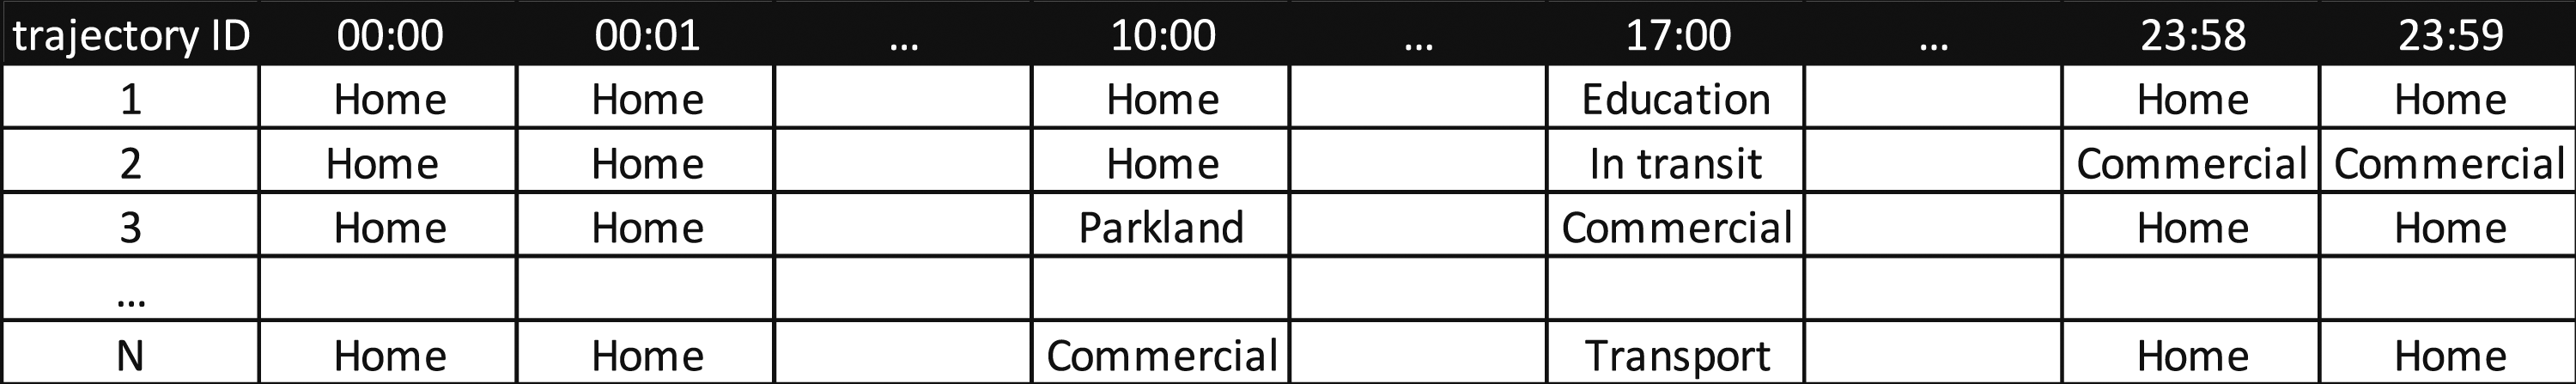
Individual daily activity sequences (i.e. time allocation in land use) are constructed to include 12 states (i.e. including 10 land use types, ‘home’, and ‘in transit’) with the total minutes in each day (1440 min) for each individual trajectory. Using the agglomerative nesting clustering (AGNES) to identify different clusters of sequences alongside three metrics; point biserial correlation (PBC), average silhouette width (ASW), and Hubert’s C coefficient (HC) to empirically determine the most appropriate number of clusters (for more information see Supplemental materials). Using the three metrics alongside a visual inspection of the clustering outcomes suggest that three clusters is the most meaningful for our dataset (Figure 2). Results from the sequence analysis (the x-axis refers to a 24-h period from 00:00 to 23:59).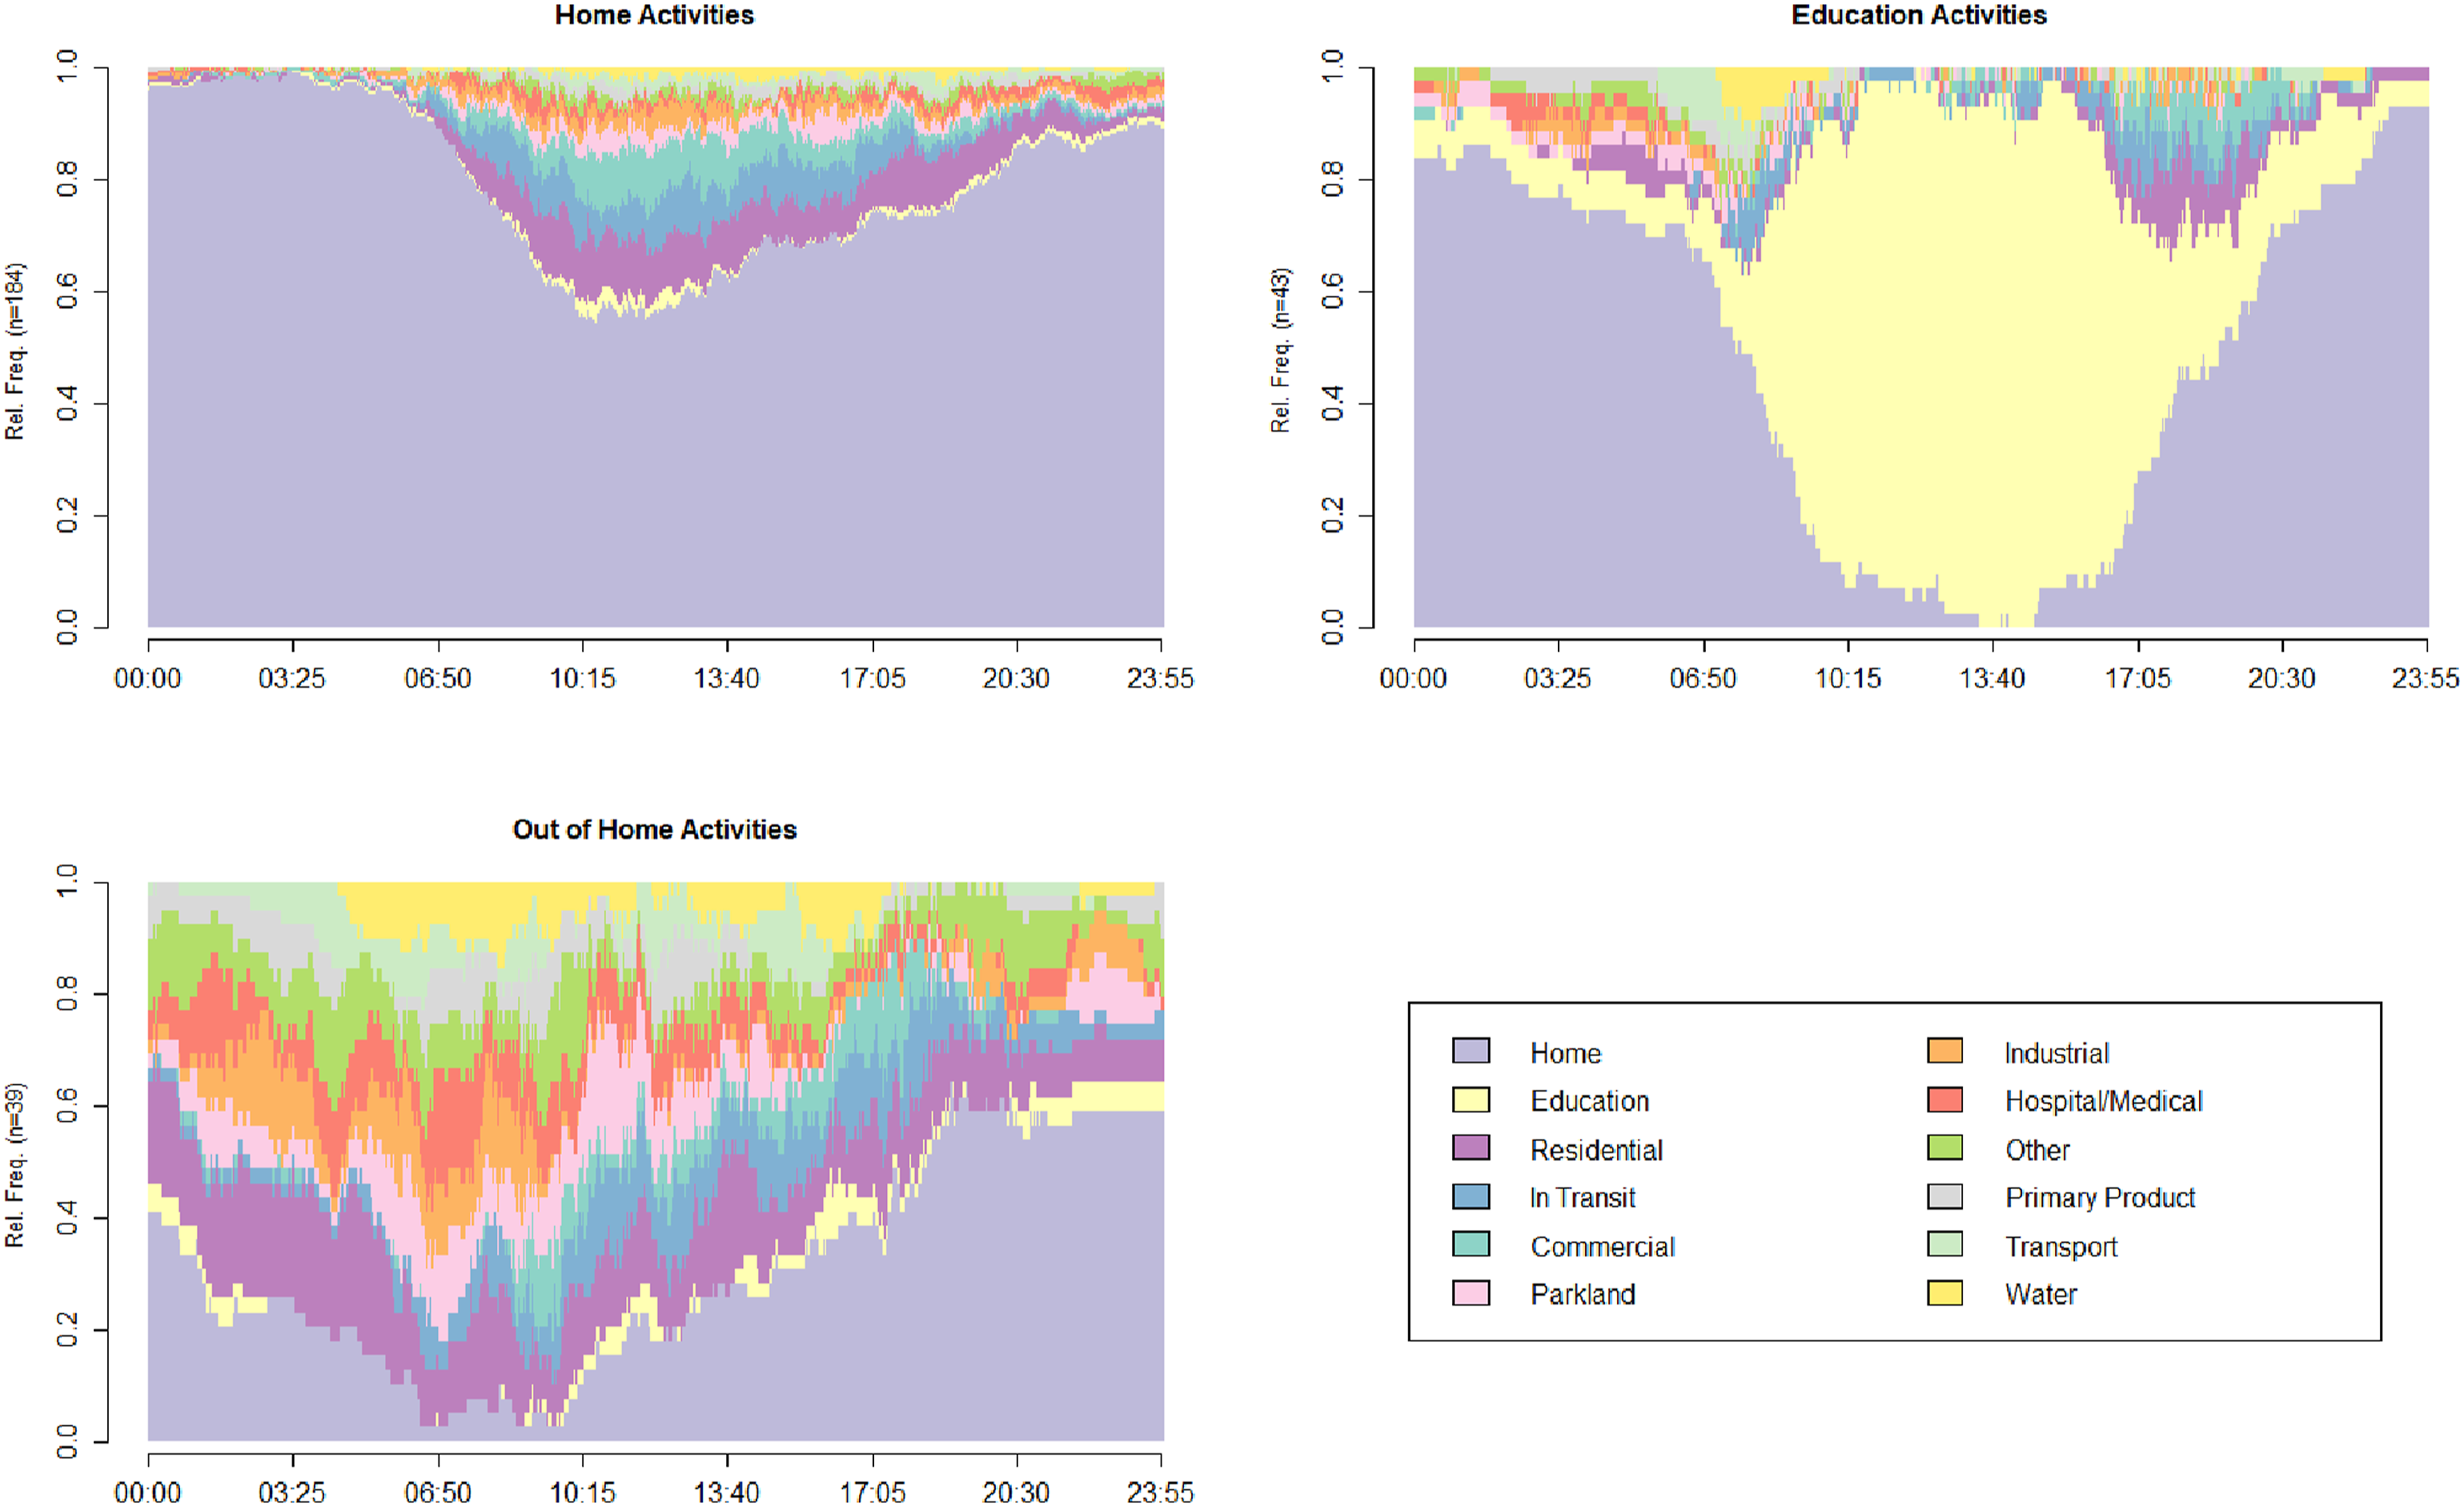
Figure 2 depicts the three individual daily activity (time allocation in land use) patterns. The name of each cluster is determined according to the characteristics (particularly the duration in each land use type) of their activities. • Cluster 1 (n = 184, 69%): home activities. Trajectories within this cluster show that participants spend a large amount of time on staying at home. • Cluster 2 (n = 43, 16%): education activities. Trajectories in this cluster show that participants spend most of the time in education land use between 6:50 a.m. and 6:00 p.m. • Cluster 3 (n = 39, 15%): out of home activities. Trajectories in this cluster spend most of time outside home and there is no clear preference of spending time in a specific land use type.
MDCEV model results
The MDCEV model was first introduced by Bhat (2008) and has been widely used to model discrete-continuous choices and understand the duration of activities. Multilevel regression has also been widely used to explore factors influencing time allocation in specific settings, including criminogenic settings (Averdijk and Bernasco, 2015; Hoeben and Weerman, 2014; Janssen et al., 2016). However, a certain type of setting (e.g. criminogenic settings) includes several types of places (e.g. pubs, parks, and dark alleys) so aggregating the time spent in different places into a single measure is commonly used when employing the multilevel regression. The MDCEV model, on the other hand, allows for a more fine-grained analysis to shed light on how factors influence the time allocation in each specific type of setting, acknowledging the potential heterogeneity in these relationships.
The purpose of employing MDCEV is twofold: (1) to estimate the relationship between socio-demographic characteristics and crime incidents in participants’ residential areas and time allocation choice and (2) to understand the relationship between daily activity patterns (the results of sequence analysis) and time allocation choice. The second point also helps to capture the preference of time allocation choice and how this varies across different individual daily activity patterns. The descriptions and equations of MDCEV model are in the supplementary document.
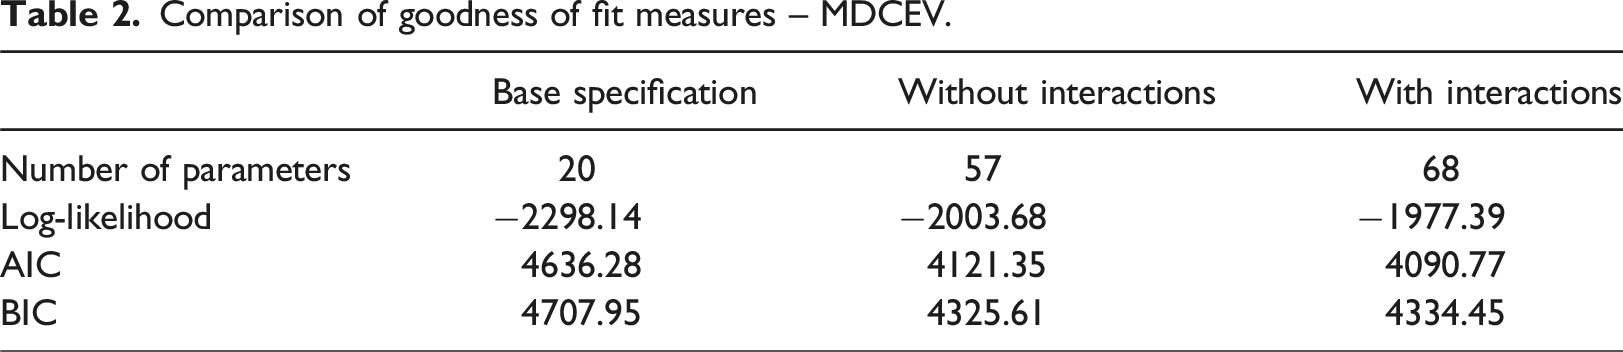
Comparison of goodness of fit measures – MDCEV.
Baseline utilities
MDCEV results with interactions.
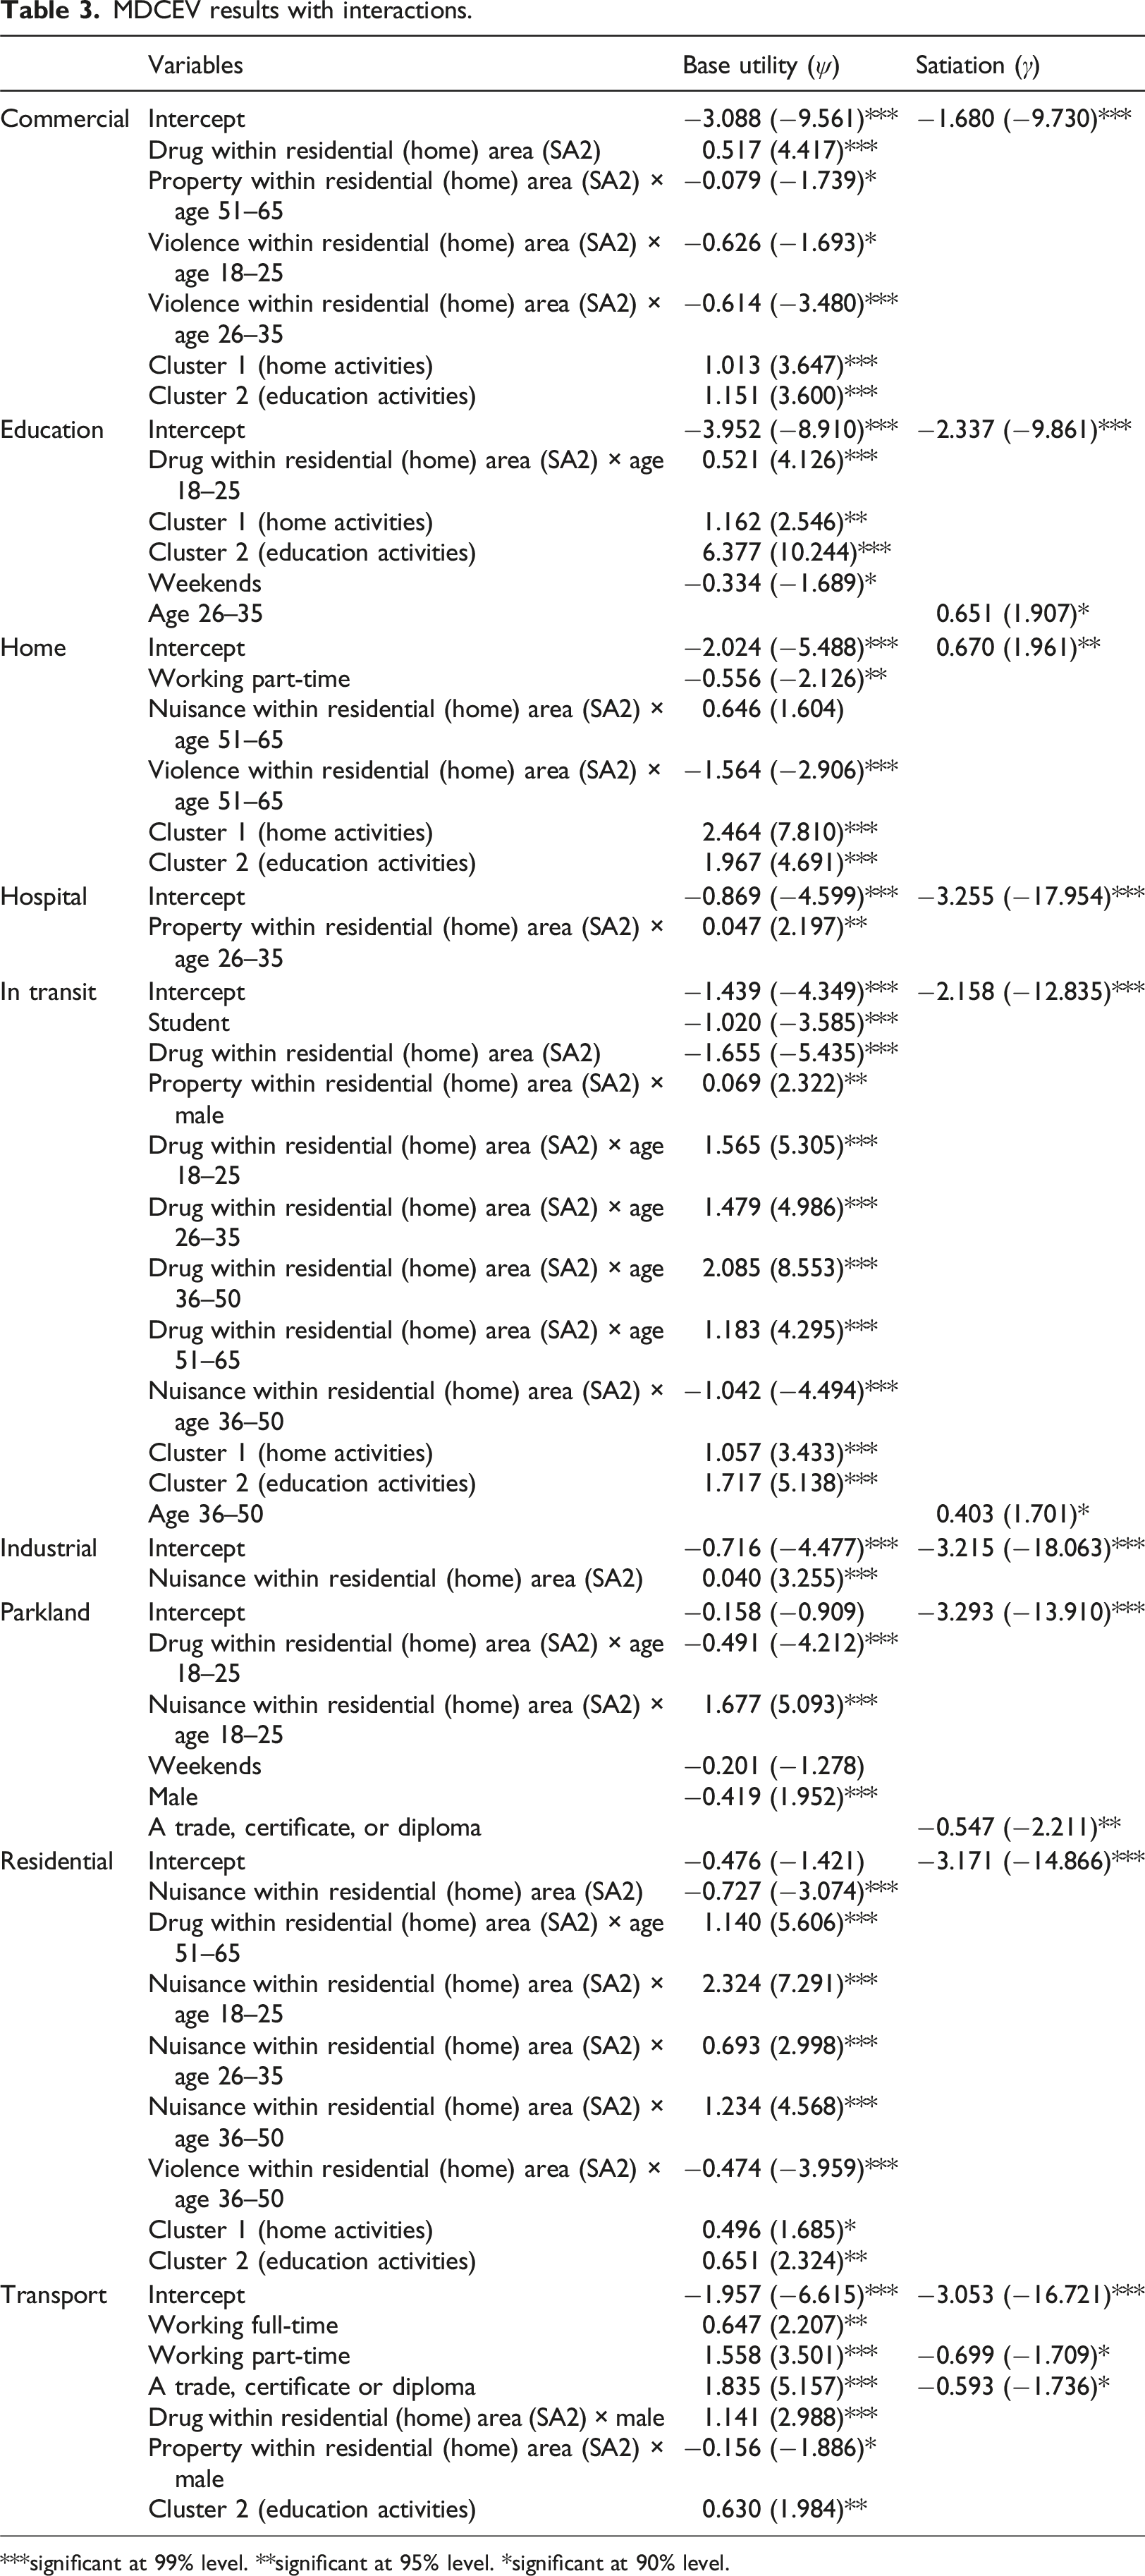
***significant at 99% level. **significant at 95% level. *significant at 90% level.
We next turn to clarify the relationships between neighbourhood crime and participants’ time allocation. Drug and nuisance are negatively related to the choice of ‘in transit’ and residential, respectively, indicating that these two crime incidents may reduce the probability of outdoor activities around their home locations. In comparison, participants tend to choose to spend time in commercial and industrial land use although the incidence of drug and nuisance around their home locations are high. This suggests that participants engage in activities in commercial or industrial areas which tend not to be geographically proximate to their home residential areas.
By considering the interactions with crime and gender, result suggest that when living in an area with high levels of drug incidents, men are more likely to choose to spend time in transport land uses (e.g. roads and public transport stations). Males living in residential areas with higher levels of property incidents are more likely to choose ‘in transit’ indicating a higher likelihood of travelling by car or public transport instead of using active transport. Examining the interactions with crime and age, compared to the 65 and older age group, drug incidents are negatively related to the choice of spending time ‘in transit’ compared to participants in other age groups. Drug incidents also reduce the probability for 18–25 years olds to choose to spend time in parkland, a type of environment known to have criminogenic potential (Ries et al., 2008). Looking to nuisance incidents, participants aged 36–65 are more likely to stay at home and tend not to choose ‘in transit’ compared to those aged 65 and above.
For participants aged between 18 and 35, nuisance is negatively related to the choice of spending time in parkland and residential land uses. Property incidents in participants’ residential areas reduce the probability of engaging activities in commercial areas with regards to participants aged between 51 and 65. Interestingly, people aged between 26 and 35 are related to time spent in hospitals or medical facilities. It is likely that they work in hospitals or medical facilities so a high level of property crime may not hinder their mandatory activities. With regards to violent incidents, being aged between 18 and 35 years is negatively related to the choice of spending time in commercial land use. This suggests that this age group would engage less in the activities such as shopping and dining in areas where there is a higher volume of violent incidents. For those aged between 36 and 50 years, violent incidents are negatively related to the choice of residential land use, suggesting that this age group is less likely to engage in some activities (e.g. walking the dog) around their home locations. Compared to participants over 65 years of age, participants aged between 51 and 65 years are less likely to stay at home in areas where there are higher levels of violent incidents. By estimating the relationship between time allocation choice and the interaction with age and crime, our findings broadly align with existing literature, which has found that crime incidents in home neighbourhoods tend to restrict the mobility of older people (e.g. engaging in social activities) (Föbker and Grotz, 2006; Pain, 1997; Temelova and Dvorakova, 2012).
The activity patterns generated by the sequence analysis are also estimated in the MDCEV model for validation purposes. Compared to the home activities group (cluster 1), education activities group (cluster 2) is more likely to choose to allocate time to ‘in transit’ and education land uses but the probability of staying in commercial and residential land use is similar. Activities within cluster 2 (education activities) are more likely to choose transport land use in comparison to out of home activities group (cluster 3).
Translation parameters (
)
As mentioned in the supplementary material, to account for the heterogenous satiation across individuals, the translation parameters are parameterised as
The estimate results depict that males are more satiated by spending time in parklands. This may be because women are often exposed to harassment in public places (Rosenbaum et al., 2020). Individuals with part-time jobs are more satiated by transport, showing that they are less likely to spend time in transport land use. Individuals between age 26 and 35 are less satiated by education and therefore they tend to spend more time in the universities or other education institutions. Individuals between 36 and 50 years of age have a lower satiation by moving through motorised vehicles. With regards to the education background, individuals with a trade, certificate, or diploma appear to be more satiated by parkland and transport. This shows that individuals with a trade, certificate, or diploma tend not to spend time in parks and appear to be sensitive of spending time in transport land use.
Conclusion
The aim of this study was to introduce the MDCEV modelling approach as an analytic technique that could be usefully applied to STB research in criminology. To this end, we lay out an empirical example of applying the MDCEV model that we hope might guide future STB research, through charting how land use data can be integrated with participants’ locational data to infer mobility activities (a proxy measurement) and exploring how neighbourhood crime shapes time allocation across each activity. The existing STB literature (e.g. Averdijk and Bernasco, 2015; Janssen et al., 2014; Janssen et al., 2016) reveals the relationship between the levels of crime and time allocation to a specific setting of which includes several places (e.g. pubs, parks, and dark alleys). The methods they used are unable to identify the different level of the influence of crime on the time spent in each place (e.g. the influence of crime on pubs vs parks). To better understand the relationship between socio-demographic characteristics, neighbourhood crimes, and time allocation to activities, the current study enriches the existing STB literature in two important ways. First, by delineating time allocations to each activity at fine-grained time intervals and identifying three groups of daily activity patterns. Second, through introducing the MDCEV model, this study explores the extent to which the neighbourhood crimes influence individuals’ time allocation across individual activities.
By using a sequence analysis, this study reveals how participants spend their time in each activity. Results indicate there are three types of daily activity patterns in this sample which include home activities, education activities, and out of home activities. The estimation results of MDCEV model show that the number of drug and violent crime incidents in participants’ residential neighbourhoods reduce the propensity of engaging in activities outside home. Females and older people (65 years and older) are more likely to be influenced by crime (particularly drug and violent crimes) in residential areas and therefore reduce the probability of allocating time outside the home. These findings align with crime scholarship reporting that females and older people’s activities in their home neighbourhoods are influenced by crime (Föbker and Grotz, 2006; Temelova and Dvorakova, 2012; Whitley and Prince, 2005). The results of MDCEV model also enrich the existing STB literature (Averdijk and Bernasco, 2015; Hoeben and Weerman, 2014; Janssen et al., 2016) by providing new insights into the relationship between criminogenic settings of the places where people live and the way in which this influences the temporal features of their daily activities. More specifically, through using the MDCEV model, the influence of factors (e.g. social environments, crimes, and socio-demographic characteristics) on the decision of allocating time to each activity in a specific setting (e.g. criminogenic setting) can be captured while aggregating the time spent in various places into a single measure is needed by using the conventional model such as the multilevel regression.
There are three main limitations associated with the current study. First, given that this is a pilot study, the sample is relatively small and non-representative. A representative dataset would allow for the inclusion of random parameters in a MDCEV model that would capture the preference heterogeneity in time allocations to activities (e.g. Calastri et al., 2020; LaMondia et al., 2008; Shin et al., 2012). Second, due to limitations associated with app functionality, we are unable to account for perceptions of risk. If the app can successfully detect the stops in real time and then trigger a short ecological momentary assessment to participants, we can then capture useful information such activity purpose, the time (daytime/night-time) of the activity, and where participants are accompanied by others. As the current study does not have such information, we employ land use data as a proxy measure for inferring participants’ activities that in turn may lead to some systematic bias. Specifically, spending time in an area with a commercial land use type could mean participants are performing work, leisure, or shopping activities. To this end, future studies need to unpack the relationship between time allocation to points of interest (e.g. shopping mall, pubs, and workplace) and the corresponding perceptions of risk. A cross-nested or nested MDCEV could then be employed to identify whether the activities are correlated under a certain nesting structure. For example, the activities such as household chores, working from home, and in-home recreation could be grouped under a group of home activities. With the information of the time (daytime/night-time) of the activity, and its corresponding crime perceptions, future studies could seek to disaggregate the day into periods (e.g. day and night) and estimate the MDCEV model for each (Pinjari and Bhat, 2010). Additionally, future studies could consider splitting time allocated in each activity into multiple episodes when estimating an MDCEV model. For instance, working for 3 h, having a break with colleagues, and then continuing to work for another 4 h is not behaviourally the same as working for 7 h continuously (Palma et al., 2021). Third, by using the app to collect the STB data, participants’ GPS data might be inaccurate to reflect the location of activity and require a complex process to cleanse the data. The app needs to be well-designed, function reliably, and not rapidly deplete the phone battery.
In summary, we chart a new method for STB studies by introducing the MDCEV modelling approach and sequence analysis. Here we direct the method to answer a specific question around neighbourhood crime and how this might act to shape an individual’s time allocation across various daily activities. To this end, we reveal interesting relationships between place, time, and neighbourhood crime through analysing granular spatial and temporal data describing individuals’ activities. In doing so we contribute to the STB literature (e.g. Averdijk and Bernasco, 2015; Janssen et al., 2014; Janssen et al., 2016) methodologically alongside offering new insights into how various factors (e.g. crime and socio-demographic characteristics) influence time allocation in each activity. Thinking beyond the current study that employs pilot data and when deployed to a larger representative data set its utility to inform practical crime prevention strategies emerges by considering the impacts of drug and violent crime on out of home activities, and ultimately guardianship availability. Moving beyond the specific application of our method examining neighbourhood crime, we suggest that our empirical approach can be readily redeployed to analyse STB data.
Supplemental Material
Supplemental Material - A step in time: A sequence analysis and choice modelling approach to examine time allocation in individual activities and the role of neighbourhood crime
Supplemental Material for A step in time: A sequence analysis and choice modelling approach to examine time allocation in individual activities and the role of neighbourhood crime by Ying Lu, Chloe Keel, Rebecca Wickes, Danielle Reynald, and Jonathan Corcoran in Journal of Environment and Planning B: Urban Analytics and City Science.
Footnotes
Declaration of conflicting interests
The author(s) declared no potential conflicts of interest with respect to the research, authorship, and/or publication of this article.
Funding
The author(s) disclosed receipt of the following financial support for the research, authorship, and/or publication of this article: Australian Research Council; DP200100830.
Data Availability Statement
Data sharing not applicable to this article as no datasets were generated or analysed during the current study.
Supplemental Material
Supplemental material for this article is available online.
Notes
References
Supplementary Material
Please find the following supplemental material available below.
For Open Access articles published under a Creative Commons License, all supplemental material carries the same license as the article it is associated with.
For non-Open Access articles published, all supplemental material carries a non-exclusive license, and permission requests for re-use of supplemental material or any part of supplemental material shall be sent directly to the copyright owner as specified in the copyright notice associated with the article.