
Abstract
Many scholars and planners emphasise the role of compact cities in sustainable urban development. Compact urban form is seen as a way to encourage people, for example, to drive less and walk more, which reduces transport-related GHG emissions. This argument, however, is strongly dependent on local amenity development that can support such local living. In plan-making, a common practice is to try to ensure the realisation of services with a high Gross Floor Area (GFA) residential infill development to raise the local population density. In this paper we are seeking quantitative insight on the resolution under which urban density, as measured by GFA volume, correlates with the growth of urban amenities and liveability. Specifically, we are seeking the direction in which correlation changes when moving from a larger geographical scale (low resolution) towards a smaller scale (high resolution) of walkable reach. Our study shows a clear correlation between urban amenities and planned GFA at low-resolution scales, but that correlation decreases at higher-resolution scales (walkable neighbourhood level), indicating that urban amenities tend to cluster in different locations than density is planned. Based on these findings, we argue that, if the aim of urban planning is to foster the growth of local amenities, it should shift its focus towards larger patterns of urban development rather than emphasising GFA in detailed plan-making.
Introduction
In recent literature many scholars, as well as planners, promote that compact cities encourage people to drive less and walk more, which will reduce transport-related GHG emissions (Berghauser Pont et al., 2021; Boulange et al., 2017; Cervero and Kockelman, 1997; Dovey and Pafka, 2020; Heroy et al., 2023). Most of these studies focus on the relationship between amenities and transport behaviour (travel modes). The conclusion is that travel modes are often more sustainable near the locations of amenities. This perspective promotes densification as a tool to house more people close to amenities. There are two issues worth noting with this idea. Firstly, in planning practice, the conclusion is often inversely used as an argument for higher GFA volumes to support the future development of local amenities. Secondly, as a goal and concept for planning, it is very old concept and has been re-applied throughout the 20th century again and again without considerable re-conceptualising (Mumford, 1989). At the dawn of the 21st century, the expansion of cities, coupled with an increase in fuel consumption, gave rise to the ‘fight against the sprawl’ (Brooks et al., 2011; Bruegmann, 2005; Janssen-Jansen, 2005). As a consequence, the planning and construction of new suburbs fell out of favour among urban planners, and the focus shifted to infill development near centre areas where existing amenities are located (Bruegmann, 2005; Finland’s Report on the Implementation of the New Urban Agenda, 2021; Janssen-Jansen, 2005). Following the global COVID-19 pandemic, there has been renewed interest in suburban neighbourhoods and their amenities, both within academic circles and in urban-policy discussions. This resurgence in attention is especially evident with the rising popularity of the ‘15-min city’ concept (Heroy et al., 2023; Moreno et al., 2021), which draws from the same ideals of local living assuming that interactions between residents and urban amenities can be scaled down in a more compact form. Some scholars have noted that the 15-min city concept has also been strongly used by property-investment and -management companies, even though the model is surrounded by major uncertainties about how people make decisions or how businesses and services are provided in the city (Vaattovaara and Joutsiniemi, 2023). Another perspective on compact cities stems from a morphological school that focuses more on the spatiality of the concept than mobility. Many morphologists have questioned existing paradigms regarding how compactness is measured in practice and have tried to conclude a more relevant set of parameters for sustainable urban form. Their general goal is to redefine compactness with a set of multiple measures, like the ‘five Ds’ (Diversity, Density, Destination accessibility, Design of network, Distance to transit) or ‘Urban DMA’ (Density, Mix, Access; Dovey and Pafka, 2020; Ewing and Cervero, 2010), all of which are mostly met by historical urban centres.
The common denominator among these perspectives is the concept of urban amenities. It is believed that, through these amenities, compactness becomes essential not just for sustainable mobility but also for driving economic growth (e.g. Glaeser, 2007, 2012; Peck, 2016). Many scholars and urban planners have concluded (or ‘insisted’, as Heroy puts it) that the sustainability goal of mobility and the economic goal of amenity development can be both met by dense land-use (Heroy et al., 2023). From this perspective, the existence of local amenities is also linked to the goal of urban liveability. From a new-urbanist perspective, the amenities should be located not so much in the local mall but in the brick-and-mortar shops in the street level of residential buildings to support the ideas of lively streets and the urban buzz. Either way, whether in the mall or the street side, high density is believed to be the main tool to achieve those amenities, which will contribute to liveability. The latter idea of street-side life is much promoted in the famous Urban Design Compendium series, a comprehensive work by the Urban Task Force for the British agency for Homes and Communities (Evans et al., 2007; Walton et al., 2000). The reports strongly emphasise the quality of design rather than pure volumes, but the effect of density is still believed to be evident for local economic development and services (Evans et al., 2007: p. 46; Walton et al., 2000: p. 91). Under the theme of sustainability, the World Bank and many development banks have similar policies guiding city development (Heroy et al., 2023). Some policy papers promote quite high density goals. In 2014 UNHABITAT announced ‘A New Strategy of Sustainable Neighbourhood Planning: Five principles’, which declared that there should be a goal of at least 150 people per hectare for sustainable urban development (UN Habitat, 2014). Also in Finland, many articles, policy papers and pamphlets are following the same rule and arguing for densification with sustainability justifications that rely on local amenity development (Ilmastonmuutoksen Hillinnän Liikenteessä, 2018; Ilmastotavoitteita Edistävä Kaavoitus: Näkökulmia Kuntakaavoitukseen, 2015; Kuvaus, 2016; Soininvaara et al., 2012; Tiitu et al., 2021).
Even though there does not exist a clear consensus among scholars even on the agglomeration effects of densification, it is still the dominating ideal in planning practice (Berghauser Pont et al., 2021). According to Peck (2016), there has been extremely well resourced ongoing global diffusion since the millennium based on Glaeser’s neoclassical urbanology, which ‘colonis[es] the city as a projected space of economic rationality’. Peck even uses the term Glaesernomics for the school of thought composed usually as a set of research-based policy guidelines while being more ideological than scientific by cherry picking statistical proofs for the tenet Peck (2016). Urban amenities and density have played a central role in all Glaeser’s works. In addition to his seminal paper ‘Consumer City’, the same message was strongly repeated in Glaeser’s book Triumph of the Cities (2011), as well as in the Survival of the City (2021), written during the global COVID-19 pandemic. Key policy guidelines for city leaders are the same in all of these works: cities should support the consumer city phenomenon, and urban planning should not limit densification development but instead support it (Glaeser, 2012: p. 192). According to Peck, these strong opinions on the practice of urban planning stem from Glaeser’s view of an ideal city. Glaser’s city is ‘ordoliberal’, where public (planning) authority acts as an enabling hand for free-market space for competition. This is based purely on consumer choices, and the plans designating high volumes pave the road for ‘entrepreneurial freedoms’ to develop (Peck, 2016). This perspective has been also clearly visible in Finland, as the concept is nowadays equally widespread in both private- and public-sector strategies (Vaattovaara and Joutsiniemi, 2023). ‘The freedom’ to develop selective 15-min city locations in the city, however, is nowhere near a reality for most players, as central places tend to be more expensive to develop and require bigger investments. The bigger the project, the less there are competitors with enough financial resources. This, in turn, can flip the link between urban density and amenities upside down. Some scholars have noted that plans with high GFA may even limit the diversity of urban development. Varying plot sizes with lower GFA permissions provides development possibilities for a wider range of developers and operators, which in turn contributes not only to spatially compact structure (smaller plots) but also to diverse cities with different building types and amenities (Bobkova et al., 2019).
In sum, there is no clear consensus on the effect of density on the goal of achieving diverse urban amenities nor sustainable mobility, even from a theoretical perspective. Thus, more detailed research needs to be conducted from different perspectives to shed more light on the argument. In this paper, our aim is to study the introduced planning practice perspective by measuring the correlation between GFA and the number of urban amenities at different spatial scales. Our aim is to recognise the empirical direction of change in correlation when zooming in at the local level. The hypothesis is that, if there is low correlation between GFA and urban amenities at a certain scale, then, within that scale of plan-making, there cannot be causality, either, in the way many scholars and planners imply. With this method, we aim to answer the following research question: Does density, as measured by produced residential GFA, correlate with the amenity or daytime population growth at the local level, as commonly argued in planning practice? In other words, is there more liveability, ‘the life between buildings’, in the places where high building density has been planned and constructed?
Data
The study focuses on the Helsinki Metropolitan Area, encompassing the cities of Espoo, Kauniainen, Vantaa and Helsinki. From an urban-planning perspective, the Helsinki Metropolitan Area is a suitable case, as the city structure is the result of many publicly announced sustainability goals operationalised through a strong public sector, without uncontrolled laissez-faire development. This can be seen to lead to a clearer effect of practical design solutions and allow broader generalisations in the conclusions drawn from these practices in the scope of this study. The study area was geographically classified in the following manner. Due to its small size and its location within Espoo’s borders, the municipality of Kauniainen was grouped with Espoo for the purposes of this analysis. Helsinki was divided into two distinctive areas: the city centre area, which consists of the 19th and early 20th century city structure, and the ‘suburban’ area, which consists of the rest of the city. The area classified as ‘all suburbs’ is a combination of all the areas but Helsinki’s centre.
For urban building densities, we use detailed building type and Gross Floor Area (GFA) information of the residential buildings obtained from Statistics Finland. Residential GFA was used to focus on the research question, as the argument under study is primarily used within residential zoning, a dominating feature of urban planning for growth regions like the study area and connected to the goal of higher population density, as referenced in the earlier examples. For urban amenities, we use the detailed location data of all official registered company business locations. Public services were excluded, as their development rationales do not follow the market logic in the sense of the scope of this study. Both datasets are point data geolocated by the registered addresses of business locations and buildings derived from the so-called SeutuCD products from 2002 to 2018 created by Statistics Finland. Data for the company facilities in these products are 2 years older than the publishing year of the product, while data for buildings are roughly 1 year old. Despite this small timespan inconsistency, building data are treated timewise similarly, as the data representing the companies. We considered this 1-year time difference between the datasets irrelevant to the validity of our study. In this way, the data are also temporarily aligned with the data for the daytime population.
The data representing the daytime population are based on mobile phone data from the Helsinki Metropolitan Area, Finland (Bergroth et al., 2022) covering the same area as the amenities and buildings. They are temporally dynamic population distribution data shared at the level of 250 m × 250 m statistical grid cells. The data were collected and aggregated by one of the biggest mobile network operators in Finland between October 2017 and January 2018. According to these interpretations, the study focuses on the time periods 2000–2001 and 2016–2017, representing, respectively, a period of strong growth and a time when the view of the sustainability effects of compactness were quickly becoming widespread in Finland (Vaattovaara and Joutsiniemi, 2023).
The data for daytime population consist of hourly population distribution, which was calculated separately for regular workdays (Mon–Thu), Saturdays and Sundays. Saturday records were selected for further analysis in the paper, as they illustrate the phenomenon of ‘consumer urbanism’ better than the workday or Sunday records without the effect of differences in work–life patterns or the typical idea of Sunday as a day to spend mostly at home. By doing this, we also minimise the effect of people commuting outside of the region. We translated the original percentage distributions into daytime population estimates using the residential GFA sum of the coverage area of records as a multiplier for the local estimates, indicated by percentiles. By doing so we created working values that kept the original relational integrity, even if neither the precise values nor the true total daytime population could be derived from the aggregated cellular data. This way we highlight overarching trends in correlations to see whether high daytime population distributions geographically followed the GFA.
The data used to represent the spatial units (hexagons) in our analyses are based on H3 (https://h3geo.org), an open-source, hierarchical, geospatial indexing system for agglomerations developed by Uber Technologies. The Hexagon data were used via dedicated Python methods 1 that enabled us to automate the analysis process. H3geo-hexagon data were used to do the correlation calculations at different spatial resolutions.
Methods
Pre-processing
Before correlation calculations, the datasets were prepared in three steps (see Figure 1). We use the term ‘urban amenities’ for the set of actual company retail space locations that belong in the following industry classes: Wholesale and retail, Accommodation and food service activities, Information and communication, Financial and insurance activities and Other service activities.
2
For this classification, we categorised business location data equally according to TOL1995-classifications for the 2000 data and TOL2008-classification for 2016 data. Finnish TOL-classifications are based on European NACE coding (NACE Rev. 2, 2008). The purpose of European NACE (Nomenclature statistique des activités économiques dans la Communauté européenne) classifications is to facilitate the analysis of trends for policy-making. Classification of urban amenities was also divided into two subclasses using the registered number of workers for each facility. One-person companies (OPCs) within selected industry classes were separated from larger firms, as most OPCs are located in private entrepreneurs’ homes. OPC firms rarely have retail spaces for clients, even if their industry class is similar to that of those that do. Workflow of the study.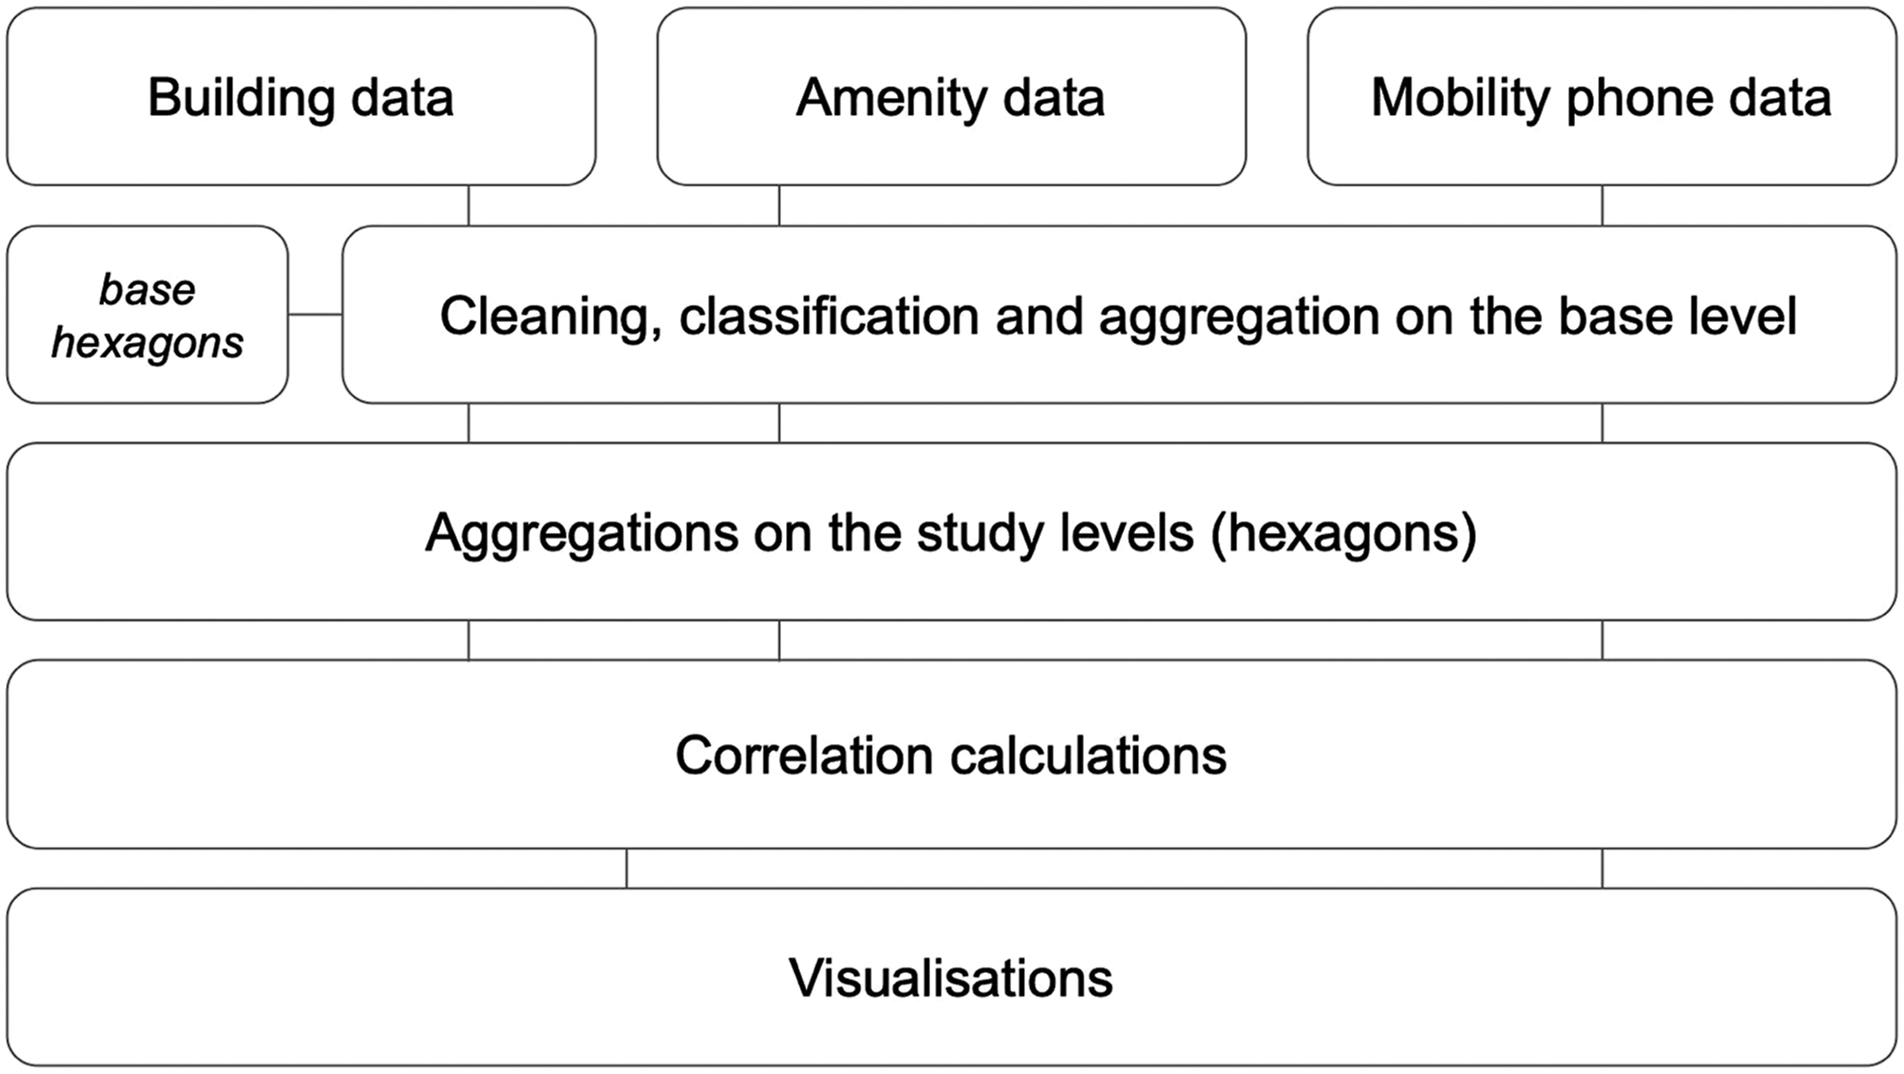
Aggregating the data
After the initial classifications, all indices were aggregated on a hexagonal grid of selected scales using the Python methods developed for them.
3
The hexagon methodology was leveraged for agile exploratory data analysis (EDA) on changes between resolutions. Hexagons also minimise edge effects due to their low perimeter-to-area ratio, making them the most efficient shape for tessellation of the study area at different scales. Resolution level 9 (marked as ‘h9’ in Figures) was used as a base resolution for the analyses. To summarise and aggregate the data, we made a spatial join between the h9-level hexagonal grid and the point data that represented the location of urban amenities, buildings and mobile phone data. For daytime population data, we regrouped the aggregated hourly values into four parts: Night (00:00–06:00), Noon (06:00–12:00), Afternoon (12:00–18:00) and Evening (18:00–24:00). We then took the maximum daytime population values for each time interval for each base hexagon. By doing the temporal aggregation using maximum values, we aimed to avoid the effect of people’s random schedules on the interpretation of the results. The base resolution (h9), with hexagons covering 8.1 ha each, represents the size of a close neighbourhood, which many consider walkable (Figure 2). In addition, the h8 resolution, in which one cell covers roughly 0.6 km2, was treated as walkable. The larger h7 resolution, in which cells cover roughly 4 km2 (equalling a 2.5 km diameter area), was treated as being too large to be considered a single uniform walkable area. According to the survey made of the same region in the same era, at the scales of h9 and h8, most residents prioritise local shops for daily errands, skipping them if the distance is more than 1 km (Culley, 2020). According to the recent literature review, similar distances for similar effects have also been found in many international studies (Heroy et al., 2023). Hexagons at resolutions h9 (sample size 3023 hexagons), h8 (sample size 848 hexagons) and h7 (sample size 193 hexagons) on a map with buildings. Each hexagon at resolution h6 (sample size 42 hexagons) covers a 28 km2 area containing seven hexagons of resolution h7.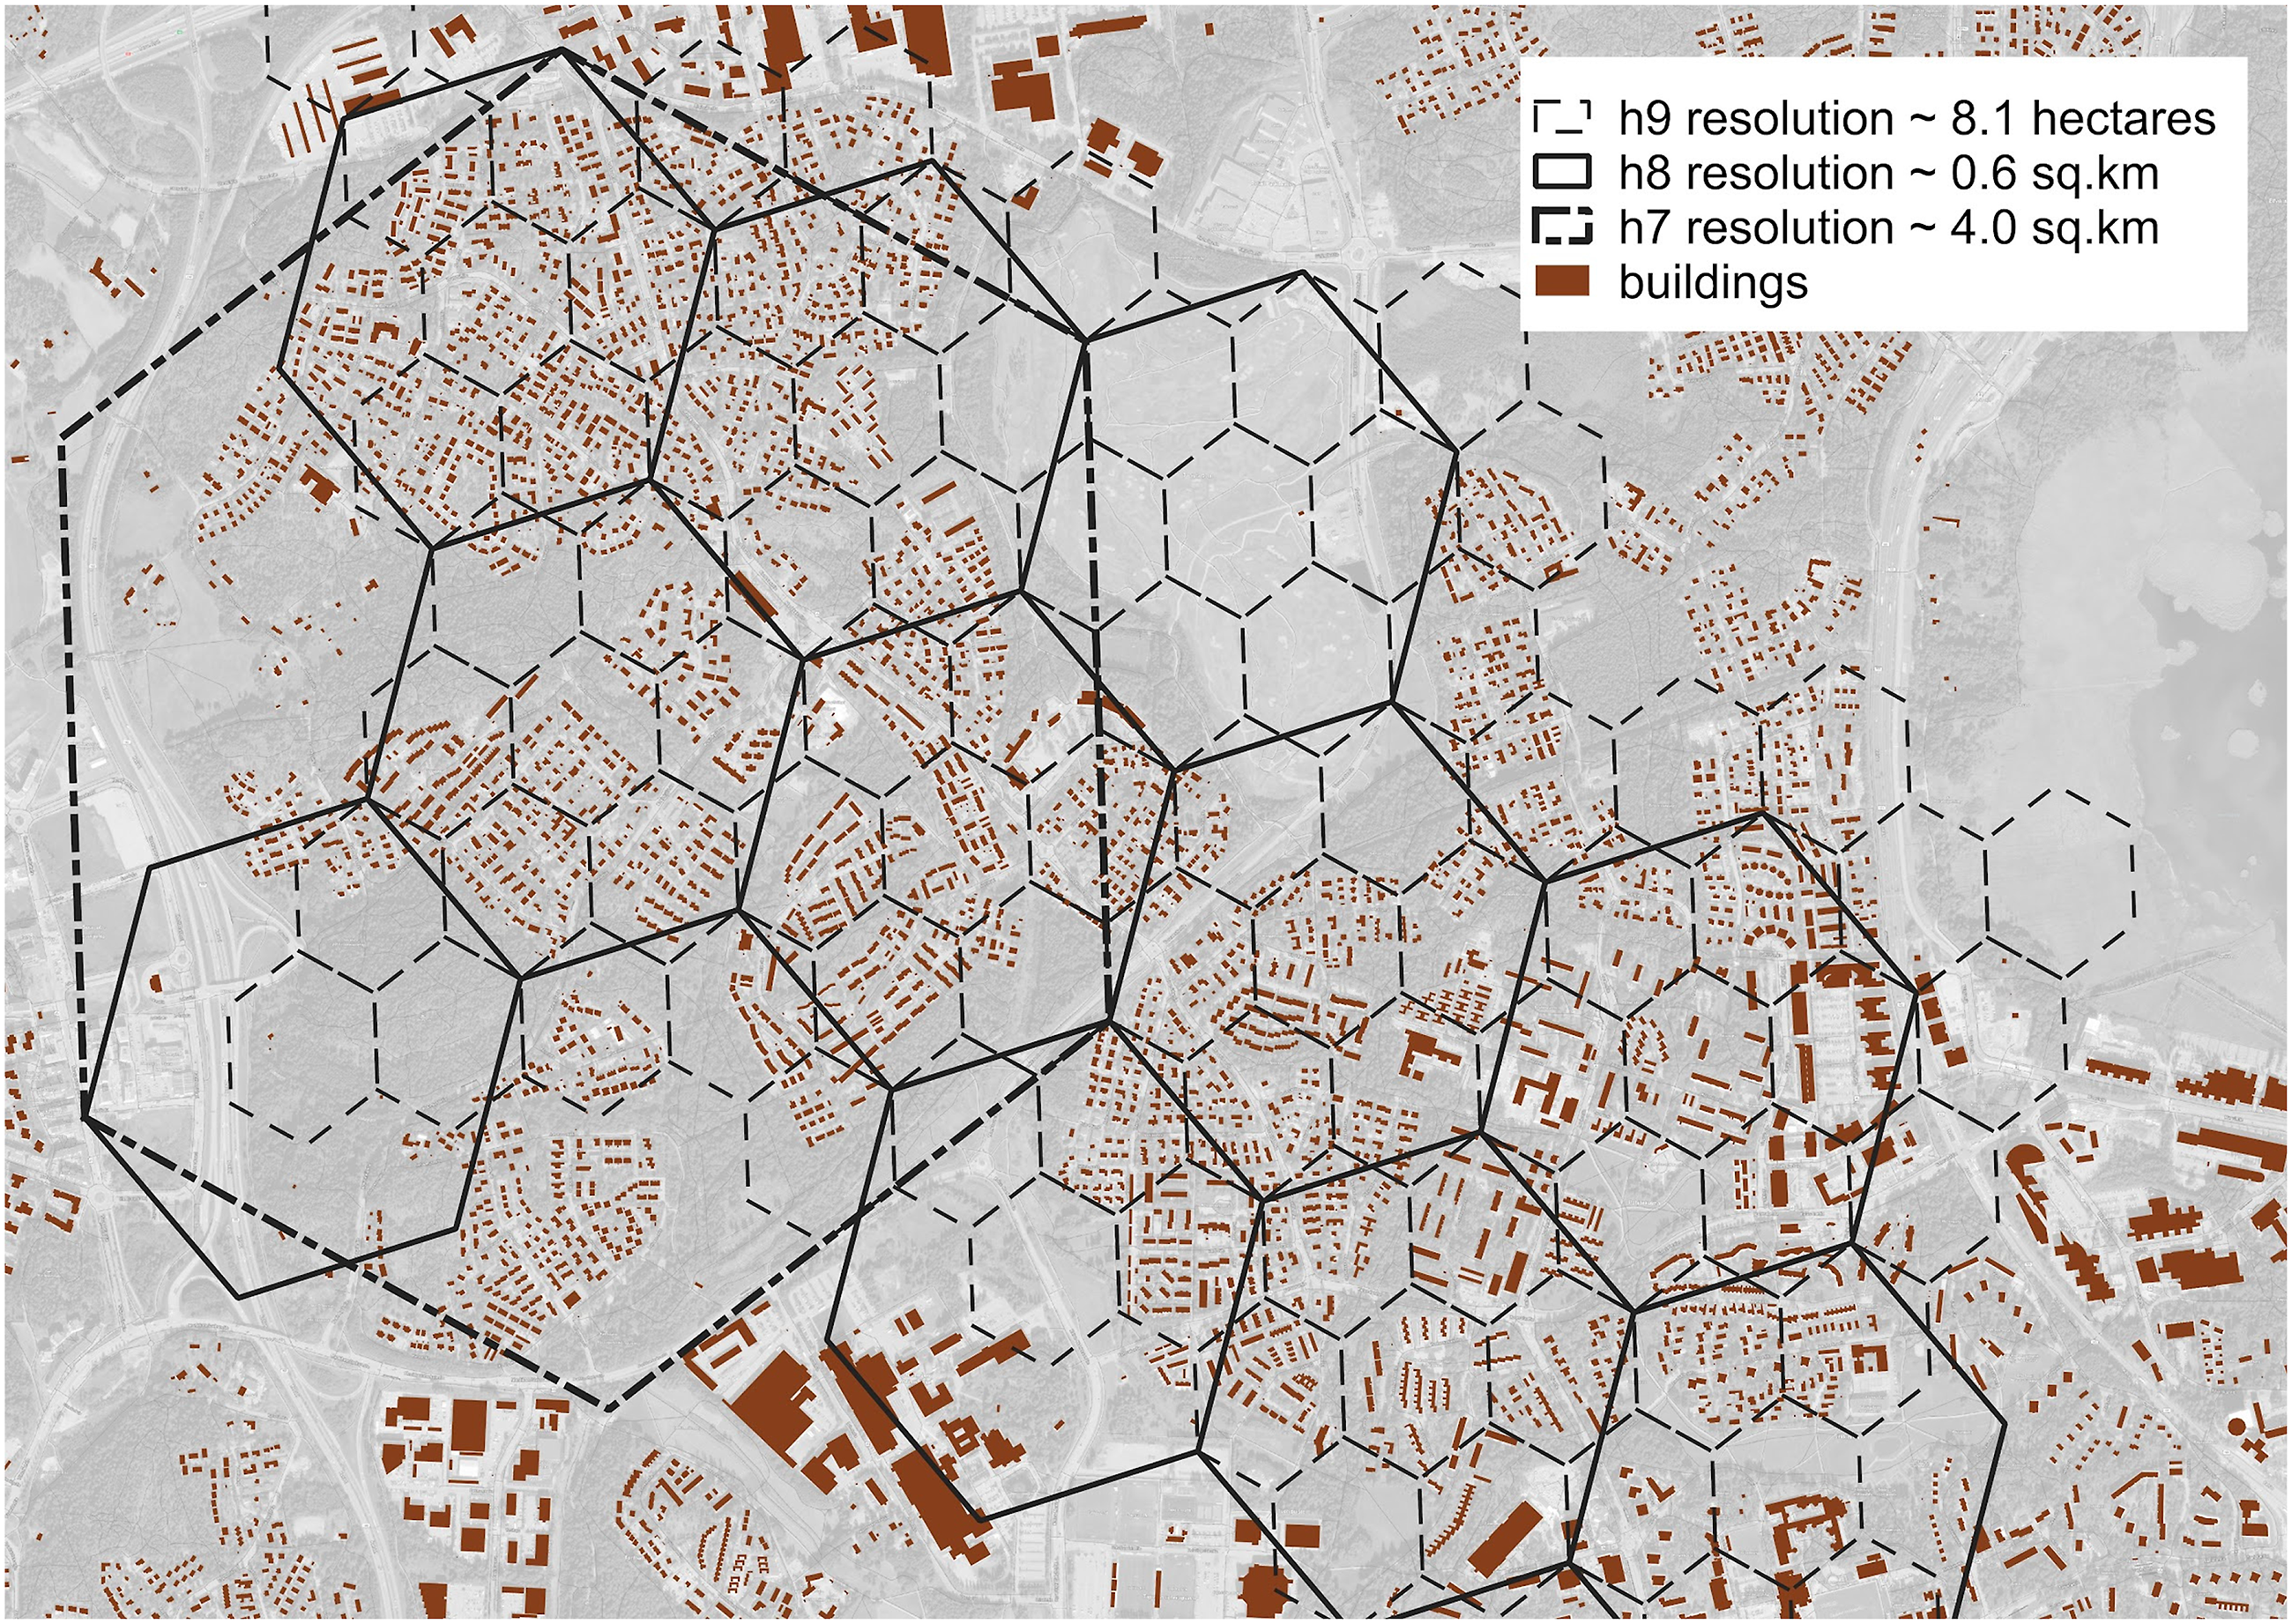
Correlation calculations
During the third phase, we examined the shifts in correlations between amenity data and daytime population data in relation to the GFA, considering various resolutions. As described, the planning argument of sustainability of density relies on the belief in an approximately linear relationship between the GFA and the amenities. Based on this notion, we chose to use Pearson’s correlation coefficient to assess the linear relationships in the data. Correlations were calculated using the Pearson’s correlation coefficient method in the Pandas-library (The Pandas Development, 2023). 4 We decided to use the power transformation with Pearson’s correlation calculations because of variances and the skewness of the data: the city structure of the region is scattered and multicentred, so the low values dominate in the data. We applied a power transformation to mitigate the influence of these issues and improve the linearity of the data. To find the most suitable transformation power coefficient for each sample size, the Box Cox method provided by Scipy-library (Virtanen et al., 2020) was applied for each resolution. 5 Each resolution was also studied using scatter maps with Pearson trendlines to verify the possible changes in p-values for statistical significance. p-values for the Pearson correlations were statistically significant (p < .001) for each resolution for both study years. The p-value ‘roughly indicates the probability of an uncorrelated system producing datasets that have a Pearson correlation at least as extreme as the one computed from these datasets’, as explained in the Scipy-documentation. 6
In the lowest study resolution h6, the generated sample (number of hexagon cells) was rather small in sub-parts of the region. For this resolution, values of the whole suburban region (excluding the 19th-century city centre) were used in all graphs as a common ‘reference correlation’ to increase the sample size. With these adjustments the graphs illustrate how correlation changes in different parts of the city when zooming in towards more local scales.
Visualisations
We visualised the correlations using line-graph pairs of correlation coefficients calculated for each geographical resolution. We use the term ‘correlation loss’ because the results show a clear declining trend in the Pearson’s correlation coefficient values (i.e. correlation loss) when moving towards the neighbourhood scale.
For urban amenities, the figure pairs compare the study years 2000 and 2016 with two-line graphs (Figure 3). The solid line visualises the change in correlation with urban amenities, excluding the records for one-person companies (OPC). The dashed line visualises the change for OPC records only. As pairs, the urban amenity graphs visualise the change in time. The red arrows indicate the direction of the development at resolution level h8. The arrows help to spot differences in the figure pairs for a given resolution. Correlation loss in amenities for sub-parts of the region: Helsinki city centre, Helsinki suburbs, Espoo and Vantaa.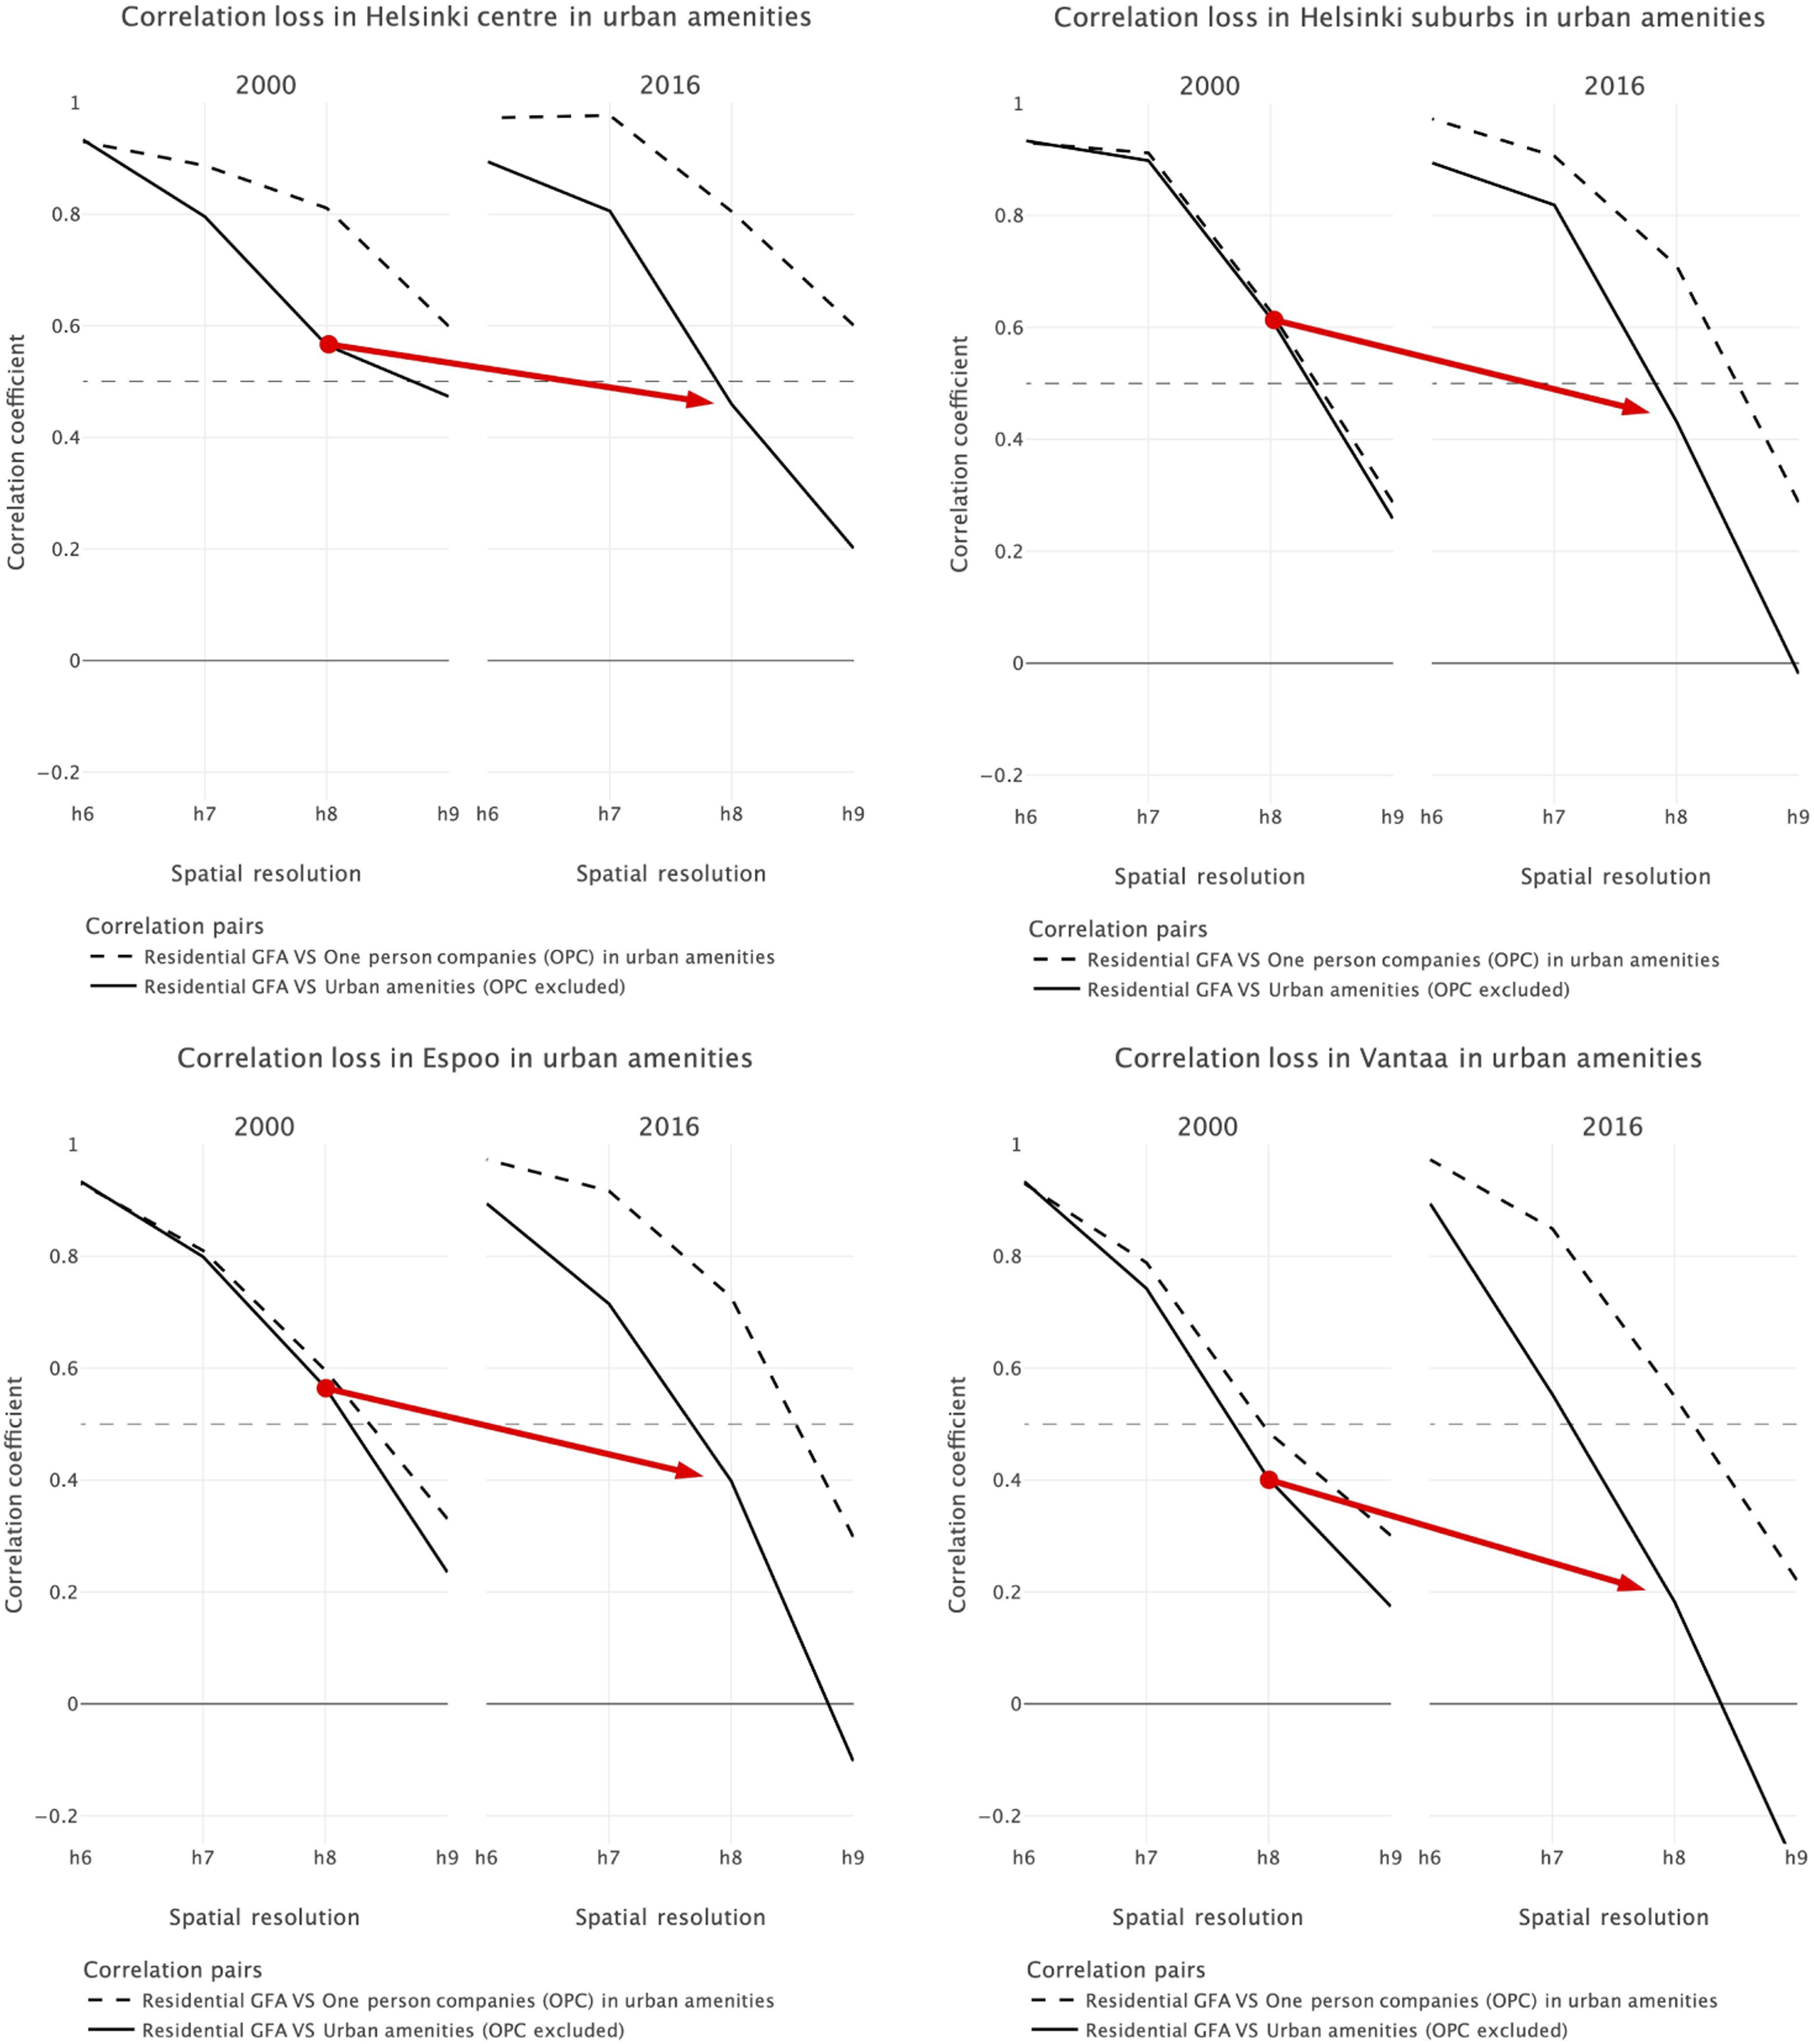
In Figure 4, we compare the daytime population to the total GFA and residential GFA with line graphs for each time interval. The red arrows indicate whether there is a difference between daytime population correlation and the type of GFA with which it is calculated in the same resolution. The downward direction of the arrow indicates whether the daytime population is following more general urban development (Total GFA) than the urban population density defined by residential GFA. Even if the visualisations are similar in nature, they are not comparable in number, as the nature of the phenomenon forming the data differs for GFA and daytime population. Correlation loss in daytime population for sub-parts of the regions.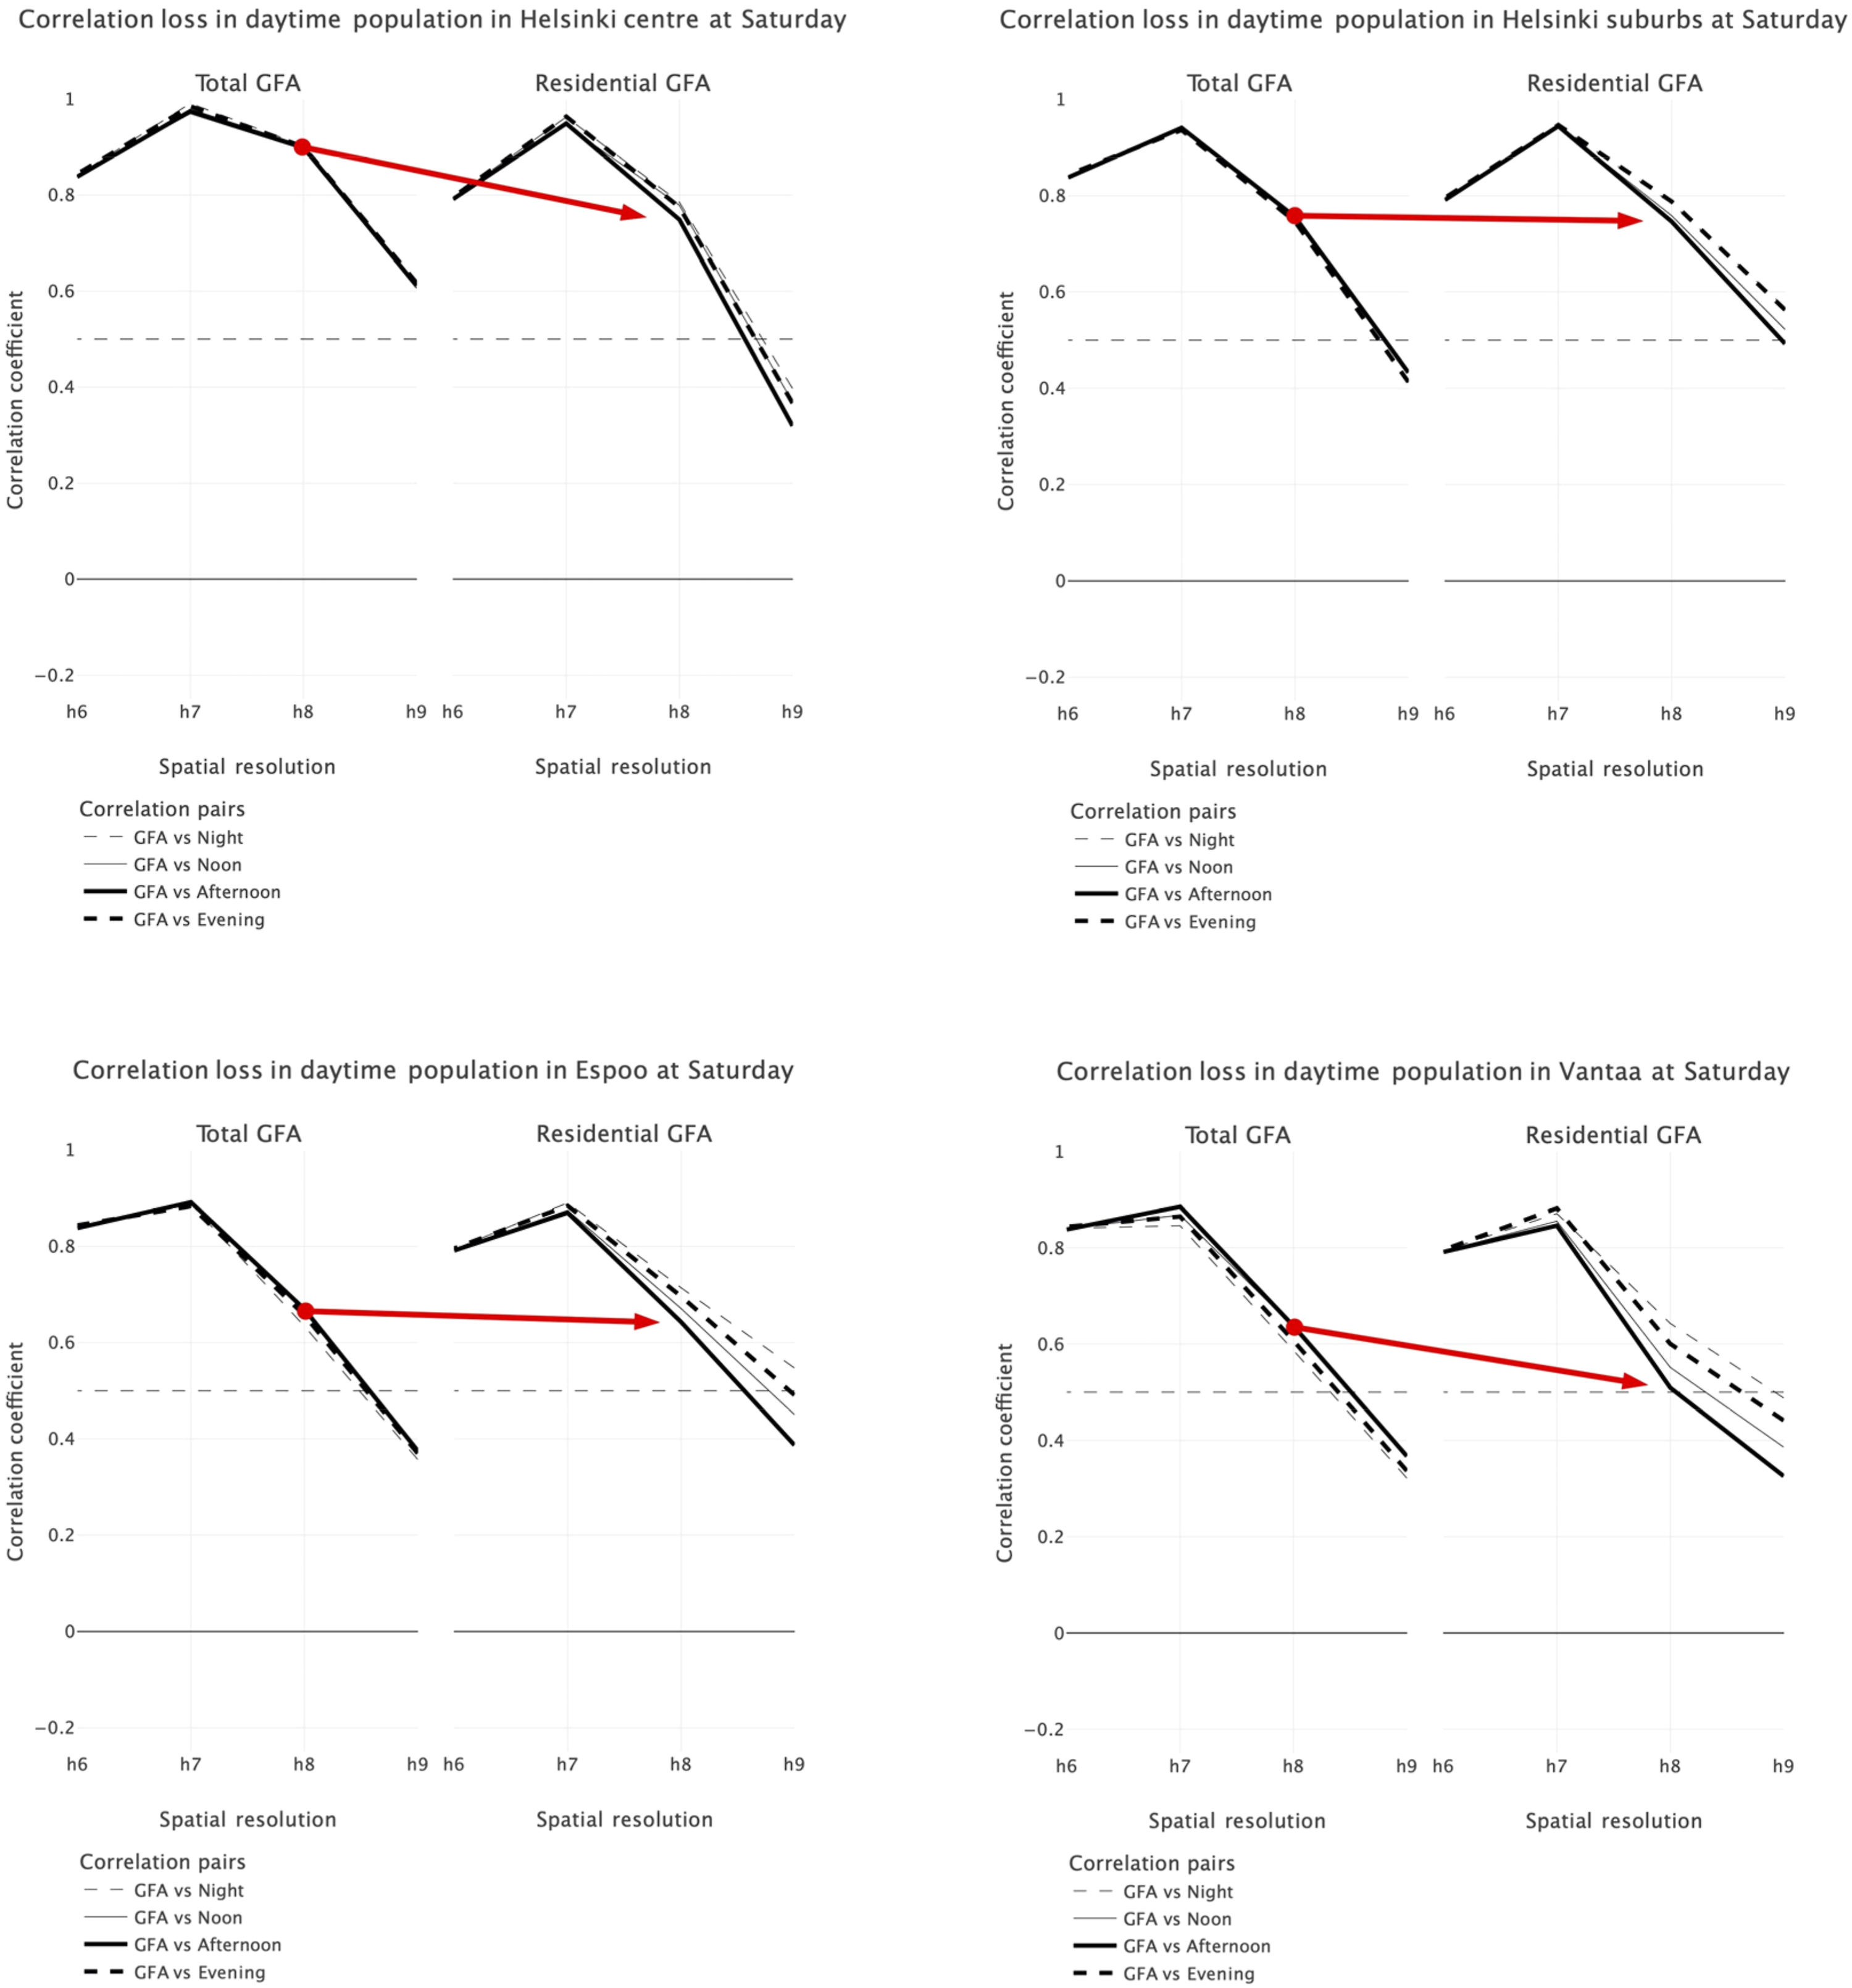
Results
Our results show a similar pattern in all parts of the studied region. There seems to be a clear correlation between residential GFA and the number of urban amenities (the solid black line) at the larger scale, but correlation decreases when moving towards walkable scales. The declining trend in correlations between 2000 and 2016 indicates that there is a rising disconnection of GFA-based planning goals and true urban amenity development. When comparing the GFA with OPCs (the dashed line), we can see a more positive development. This might indicate the general private entrepreneurial activity within the industry, which in turn might resonate more with the general growth of the city region.
The increase in urban development, according to the data characterised by a 33% growth in selected amenities between 2000 and 2016, has not been evenly distributed with respect to the growth of GFA. Throughout the region, including Helsinki centre, the correlation between amenities and residential GFA has diminished.
In Figure 4, we visualise the correlation loss between the daytime population and GFA using Saturday records in 2017 in different parts of the region. We filtered out high total GFA locations (densely built centres, like shopping malls) by cutting off the top decile at the base level resolution to remove the dominating impact of regional centres. 6 This allows us to see the baseline trend occurring more in the regular neighbourhoods, which is in line with our research question.
The daytime population behaves differently compared to urban amenities. The increase in daytime population correlation when moving from base resolution level h6, indicating the general correlation level in the region, to resolution h7 inside each city, reports a higher correlation at this scale. The aim of the method was to study the change in correlations when zooming in within the selected subregions from the regional scale. With daytime population data, the distribution of the summed records at resolution h7 contains fewer undeveloped areas than at resolution level h6, which covers the suburban region and indicates the base level correlation to compare. This results in higher correlation values within the sample of resolution h7, indicating how each subregion compares with the regional base level of correlation. This difference in samples likely results in the correlation increase because the daytime population is much more unevenly distributed than urban amenities within the h6 sample hexagons, as the records in the central subregions are emphasised by the daytime population coming from outside the study area. This hypothesis should, however, be confirmed in further studies, because the effect is visible in all subregions and not only in the Helsinki centre. The correlation between daytime population and GFA seems to diminish only when zooming in at the most local-level resolution h9. In addition, there are no considerable differences between the times of day or between GFA types. These notions imply, that the logic behind the values is likely different in different subregions and at different times of the day, therefore calling for more detailed data and research to determine the relevance of GFA to the daytime population. The general growth of the city region leads to higher densities of activity in general (Brueckner, 2011). In addition, the growth of the region will also increase polycentric development, which brings another layer of challenge to local-level analytics (Derudder et al., 2020). Polycentric development more directly affects the dynamic daytime population than more-static amenities. This makes it difficult to deduce the local effect of GFA in a way similar to the study of amenities.
To summarise the results, we focused on understanding how the correlation between the production of GFA and urban activity, as measured by amenity growth and daytime population changes as we zoom into a local scale. Specifically in Figure 3, the arrows show how the correlation shifts over the study time. Looking at these trends, we can conclude that the disconnection between residential GFA and urban amenities has been rising quite similarly in all parts of the region. Furthermore, Figure 4 uses similar arrows to highlight the contrast in the correlation of the daytime population with higher residential GFA (represented on the right side) compared to the overall situation in the city (shown on the left side). This insight is telling: the daytime population is following the same logic at local scales, but the differences are milder and more variable at the regional scale.
Discussion
Our results indicate two higher-level conclusions: (i) urban amenities tend to be merged in different places than high GFA development is taking place; and (ii) the density of a larger urban structure seems more relevant for amenity development, because the direction of the change in correlations is clearly downwards (correlation loss) even if there has been significant growth in the region between the study years. The daytime population deepens the insight with different views. The daytime populations in the Helsinki centre and Vantaa correlate slightly less with residential GFA than with overall development. These disparities are milder in the Helsinki suburbs and Espoo, where the urban structure is more multicentred. This indicates that the daytime population spreads more equally with residential development when there is no dominating urban centre around.
Our first conclusion aligns with previous research. In the Helsinki region, a large share of the urban amenities built since the millennium has been concentrated in the malls (Culley, 2020). Furthermore, even if most residential development in the region since the millennium has been measured as infill development instead of sprawl, the ‘urban functions’ – amenities in this context – have continued to sprawl (Finland’s Report on the Implementation of the New Urban Agenda, 2021).
The second observation stems from the general rise in regional connectivity in the metropolitan area. Large-scale infrastructure projects are often localised in such a way that those areas become not suitable for extensive housing, only for retail. Thus, amenities in these areas likely stem from infrastructure investments, with retail developers, like mall builders, leveraging these prime locations. This will in turn be reflected in the daytime population distribution by concentrating it, which will in turn be reflected in other urban amenity providers, including public-sector services. As a result, high population growth (residential GFA) will happen in other places, which in turn will contribute to longer travel needs for many. In today’s economic context, aiming for compact cities with excessive centralisation may foster agglomeration economies for some stakeholders but does not seem to bring the desired sustainability effect. Instead, on a larger scale, some scholars have been recognised that it contributes more traffic, fragmented land-use, segregation, loss of biodiversity and even urban sprawl (Berghauser Pont et al., 2021; Ferreira and Batey, 2011; Florida, 2017; Neuman, 2005).
In general, our results also reflect distinct variations in the history of urban development across the studied cities before the examined years. Urban structures established before the turn of the millennium show distinct differences in every city studied. For instance, urban planning in Espoo has been officially focused around five centres for many decades (Maisala, 2008), whereas Vantaa’s growth was primarily concentrated around the historical rail-station town of Tikkurila before the millennium. This is visible in the daytime population graphs (Figure 4). More geographically balanced land-use reflects a more equal correlation between GFA types; the distribution of ‘liveability’ is not as concentrated in Espoo as in Vantaa. Helsinki, on the other hand, has long enjoyed being the very centre of the strongly monocentric region. The Helsinki city centre attracts a non-local daytime population more than the edges of the city, leading to a higher correlation with total GFA. These disparate historical foundations have undeniably influenced their respective developments. The trajectory of change after the millennium, however, has followed remarkably similar patterns across the region.
Our results indicate a discrepancy between ideals and reality by revealing that general simplifying assumptions on density impacts in infill development used in planning practice does not consistently hold in the scale which is meaningful for the sustainability goals. In reality, the development of amenities is influenced both by global industry changes within each business sector and by their real-estate implementations through local land-use planning. The understandable hypothesis is that businesses, whether chains or private entrepreneurs, will develop in places where operation is economically viable. In addition, retail spaces provided by developers will be built according to the needs of the market. Everyday cooperation within the established developers and chains of service providers (convenience stores, cafes or kiosk franchisors) may limit the non-chain private entrepreneurs to access the markets if developed retail spaces are directed for the same co-operators. What results is that the lack of need by the established side is treated as a signal from the market not to develop retail spaces at all in certain locations. Hence, there might be hidden needs of facilities within the non-chain entrepreneurs that should be studied more from the perspective of more equal and diverse local economies. Nevertheless, we argue that, if there had been strong demand for retail spaces according to dense development, this would have been reflected in the decisions and be visible in the data. The discrepancy is very familiar for many planners who try to force mixed-use land use in residential development projects.
From a climate perspective, it is profoundly questionable whether the goal of liveability related solely to the use of consumer amenities is reasonable at all for public land-use planning. Lifestyle based on the frequent use of consumer amenities creates high intensities in carbon footprint production (Heinonen et al., 2013). This perspective is, of course, conditional on what we consider consumer amenities and how sustainably these amenities are operated. This study did not focus solely on consumer-oriented services in the data, but we argue that consumer-related services (e.g. shops, cafes and restaurants) are a very central part of the liveability for which contemporary urban design aims. Hence, considering that mobility sustainability objectives seem to go unmet and recent climate studies suggest that, even when these objectives are achieved, their mitigation effects are commonly eclipsed by the influences of the very lifestyle (consumer urbanism) for which those amenities were designed, we strongly recommend a thorough re-evaluation of ideals behind the planning practice. Furthermore, our observations have led us to question the sustainability of the compact city hegemony if its essence is only based on the liveability of consumer urbanism. This realisation mirrors Richard Florida’s self-reflection on his earlier views on urban revival: ‘I found myself confronting the dark side of the urban revival I had once championed and celebrated’ (Florida, 2017). In Finland’s medium-term climate plan, consumers are encouraged to halve their carbon footprint in household consumption (housing, transport, food, other goods and services). According to the evaluation report, this goal is to be achieved with the help of policy guidance by 2035 (Salo et al., 2023). The report states that policy guidance should be strengthened by influencing the supply side of the selected themes. Land-use planning is not discussed in the report as a separate policy method, but the need for ‘developing an urban structure that promotes low-emission consumption’ is stated as one of the key solutions (Salo et al., 2023). This underscores the need to re-evaluate our understanding of urbanism and the theoretical basis in use for it in planning practice.
Final remarks
It is easy to agree on the sustainability goals behind the compact city concept, but it is mainly through changes in people’s lifestyles and the development designed for them that the deep sustainability of the city can be supported by urban planning. What kind of urban amenities are related to the climate-friendly lifestyle, and what is the role of the environment’s compactness in those? Based on our study, we suggest that urban planning should move away from viewing density as a single measure that can be used to achieve sustainability objectives while rethinking the definitions, taxonomy and role of ‘urban amenities’ on a larger scale from climate perspectives. The former could ease local development and generate more diversity instead of pure density (Bobkova et al., 2019). The latter could contribute to the goal of sustainable lifestyles if the diversity of amenities for non-consumer urbanism as well can be found nearby for many.
It is also noteworthy that the conceptualisation of lifestyles is central to the theories used in planning practice, from garden cities to the contemporary 15-min cities. This lifestyle perspective is occasionally subliminal in both the level of city politics and planning practice, creating a gap between the means and the ends. Indeed many scholars see a ‘theory-practice gap’, even though the gap is not due to a lack of theory but rather a lack of understanding of which theory is in use (Moroni, 2010). The need for renewing theories has also been recognised by scholars working for theories both in planning (Batty and Marshall, 2009) and of planning (Mazza, 2017).
The compact city goal seems to be a combination of theories of a sustainable local urban lifestyle operationalised through the theories on density effects used in plan-making and urban-design practice. The problem is that outcomes seem to lack the desired effect. In addition, many sustainable goals are buried under the dominance of GFA designation tradition backed by compact city ideals (Berghauser Pont et al., 2021; Lehnerer, 2009; Nordregio et al., 2018; Säynäjoki et al., 2014). Hence, we argue that only by decoupling the language of urban design and plan-making from GFA designations can we move forward towards more climate-friendly cities. While the GFA in plans is a reliable metric for return on investments in the property-rights-driven real-estate market – even facilitating the trade of an unbuilt future – it falls short as a measure for urban development in the anthropogenic era of climate change.
Supplemental Material
Supplemental Material - Compact city and urban planning: Correlation between density and local amenities
Supplemental Material for Compact city and urban planning: Correlation between density and local amenities by Teemu Jama, Henrikki Tenkanen, Henrik Lönnqvist, and Anssi Joutsiniemi in Environment and Planning B: Urban Analytics and City Science.
Footnotes
Declaration of conflicting interests
The author(s) declared no potential conflicts of interest with respect to the research, authorship, and/or publication of this article.
Funding
The author(s) disclosed receipt of the following financial support for the research, authorship, and/or publication of this article: This work was supported by The Emil Aaltonen Foundation.
Supplemental Material
Supplemental material for this article is available online.
Notes
References
Supplementary Material
Please find the following supplemental material available below.
For Open Access articles published under a Creative Commons License, all supplemental material carries the same license as the article it is associated with.
For non-Open Access articles published, all supplemental material carries a non-exclusive license, and permission requests for re-use of supplemental material or any part of supplemental material shall be sent directly to the copyright owner as specified in the copyright notice associated with the article.