
Abstract
Active travel to school (ATS) is promoted due to its benefits for health, mental well-being and the environment. Although the impact of the urban form on ATS has been extensively researched, findings have remained contradictory. Existing studies have mainly relied on aggregated, area-based measures, scarcely applying disaggregated, network-based measures of accessibility, street configurations, connectivity or urban density. This study addresses issues related to aggregation and the lack of ATS-specific network measures to evaluate the connectivity of routes to school. We examined the associations of route betweenness, reach and weighted reach with ATS, while adjusting for age, gender, traffic and proximity to school. Population data are disaggregated within a 50-m accuracy of address points. We introduce ‘route betweenness’, a new network-based measure for assessing the connectivity of entire shortest routes. We measured network accessibility around homes as reach (i.e., the number of streets reached through the network), and urban density as weighted reach (i.e., as the floor area or population accessible within walk-/cyclable distances). ATS was measured through self-reported walking or cycling to school (yes or no). The results show positive associations of route betweenness with ATS. The findings further indicate that, whilst higher connectivity and accessibility around home can increase ATS, the connectivity of the network along the way to school, as grasped by route betweenness, is even more important.
Keywords
Introduction
Active travel to school (ATS) – that is, walking or cycling – is associated with increased physical activity (Khan et al., 2021) and improved mental well-being among adolescents (Stark et al., 2018), as well as with lower transportation-related greenhouse gas emissions compared to private motorised or public transport (Singleton, 2014). Although personal factors, demographics and parental attitudes influence mode choice for school travel, research has shown that urban form strongly impacts ATS (Ji et al., 2022).
There is growing scientific consensus that proximity to school increases the propensity to walk or cycle to school, but the exact impact of network connectivity, density and land-use diversity on ATS remains disputed (Prince et al., 2022; Wong et al., 2011). The contradictory findings could be context-dependent, but there is also an increasing acknowledgement that contradictions could result from aggregation over different geographical areas (Ji et al., 2022; Prince et al., 2022). For instance, density and street network connectivity around homes or schools have commonly been measured as the population and number of streets or intersections per census area or traffic analysis zone (TAZ) (Mitra, 2013; Wong et al., 2011). Although such aggregated, area-based measures are simple and easy to implement, they have three limitations. First, the connectivity between area units is not considered, while people often move beyond area borders. Second, aggregated measures cannot account for network configurations and connections between individual street segments (Knight and Marshall, 2015). Larger areas mitigate the first issue (Dill, 2004) but augment the second (Iacono et al., 2010). Third, variations in area units and sizes lead to different outcomes, depending on the size and shape of the area units used for aggregations (Modified Area Unit Problem; Berghauser Pont and Haupt, 2021: 90–91).
Network analysis offers an alternative, disaggregated methodology, and allows for the representation of the continuity or discontinuity of pedestrian/cycling routes. Network measures have shown associations with adult pedestrian and cyclist mode choice (Cooper, 2018; Ozbil and Peponis, 2012) and flows (Berghauser Pont and Marcus, 2015; Cooper, 2018; Sevtsuk, 2021). However, the application of network-based measures in ATS research has been limited. There are multiple potential reasons for this. First, network-based measures are more complex compared to area-based methods. Second, network analysis requires detailed models of pedestrian and cycling networks that include shortcuts and barriers (Zhang and Zhang, 2019), which until recently have been limited in extent and availability (Minghini and Frassinelli, 2019). Third, network analysis typically considers accessibility and connectivity across entire networks within certain areas, whilst for ATS, the connectivity between home and school matters more than the connectivity from anywhere to anywhere else (Larsen et al., 2012; Panter et al., 2010).
Yet, methodologies focusing on the connectivity of the network between home and school are limited to measures capturing barriers, directness and steepness of the shortest metric routes (e.g., Panter et al., 2010; Timperio et al., 2006), or connectivity measures aggregated within buffers around metric shortest routes to school (e.g., Larsen et al., 2012). Although such methods can grasp some network properties between home and school, network configurations are not captured. Moreover, metric distance is not the sole variable determining route choice (Cooper, 2018; Shatu et al., 2019). Pedestrians prefer cognitively easy-to-navigate routes and cyclists avoid sharp turns (Hillier and Iida, 2005; Shatu et al., 2019). Recent studies have shown that pedestrians and cyclists prefer to minimise both distance and directional changes (Shatu et al., 2019). However, with the exception of studies by Ozbil et al. (2021) and Rybarczyk et al. (2023), there has been a lack of ATS studies accounting for the effect of directional changes on route choice.
Thus, the main goals of our study were to: a) Examine the associations between the odds of active travel to school and disaggregated, network-based measures of network accessibility, connectivity and urban density, and b) Contribute to ATS research by developing network-based methods for assessing the connectivity of shortest routes between home and school.
Previous ATS studies have applied network measures capturing network configurations, network flows or network accessibility around home locations (Helbich et al., 2016; Ozbil et al., 2021; Rybarczyk et al., 2023) or the centrality of schools (Kim and Lee, 2016). Previous research outside the context of ATS has also applied the network centrality measures ‘betweenness’ or ‘closeness’ (Porta et al., 2006; Sevtsuk, 2021), which describe connectivity properties for individual links or nodes in a network but not for entire routes. Based on the established betweenness centrality (Freeman, 1977), we introduce two new betweenness measures that improve on previous route-based connectivity analyses (Larsen et al., 2012; Panter et al., 2010; Timperio et al., 2006) by accounting for network configurations and network link density, and by proxying the mean flow of pedestrians, cyclists or adolescents encountered on the way to school.
Methods and data
Population and study area
ATS data are from participants in the adolescent part of the fourth population-based Trøndelag Health Study Young-HUNT4 (2017–19) (Guddal et al., 2019; HUNT, 2022). Young-HUNT4 covers public health issues, including mental health, quality of life and health behaviours (Bjerkan et al., 2022). The Young-HUNT studies are approved by the Data Inspectorate of Norway (ref.no.: 17/00426-7/GRA) and the Regional Committee for Medical Research Ethics (ref.no.: 2016/801). All participants or their legal guardians gave informed consent before participating in the Young-HUNT study.
We included participants from the Norwegian municipalities Stjørdal (population: 24287) and Levanger (population: 20169), which we considered representative of the Trøndelag county, with a mix of urban and rural areas. Middle and high schools invited adolescents aged 13–19 years to participate. The valid response rate was 57% among middle school (1190 of 2090) and 54% among high school students (939 of 1750). The sample comprises adolescents from five schools in the municipality centres and three schools in villages within the municipality borders (Figure 1). Location of (a) Levanger and (b) Stjørdal in Norway. Blue lines in the maps show the network links reached within 5000 m from schools. Dots mark the location of schools and circles with an R (R) indicate schools in rural locations. Map source: R Basemaps OSM Streets (Schwalb-Willmann, 2022).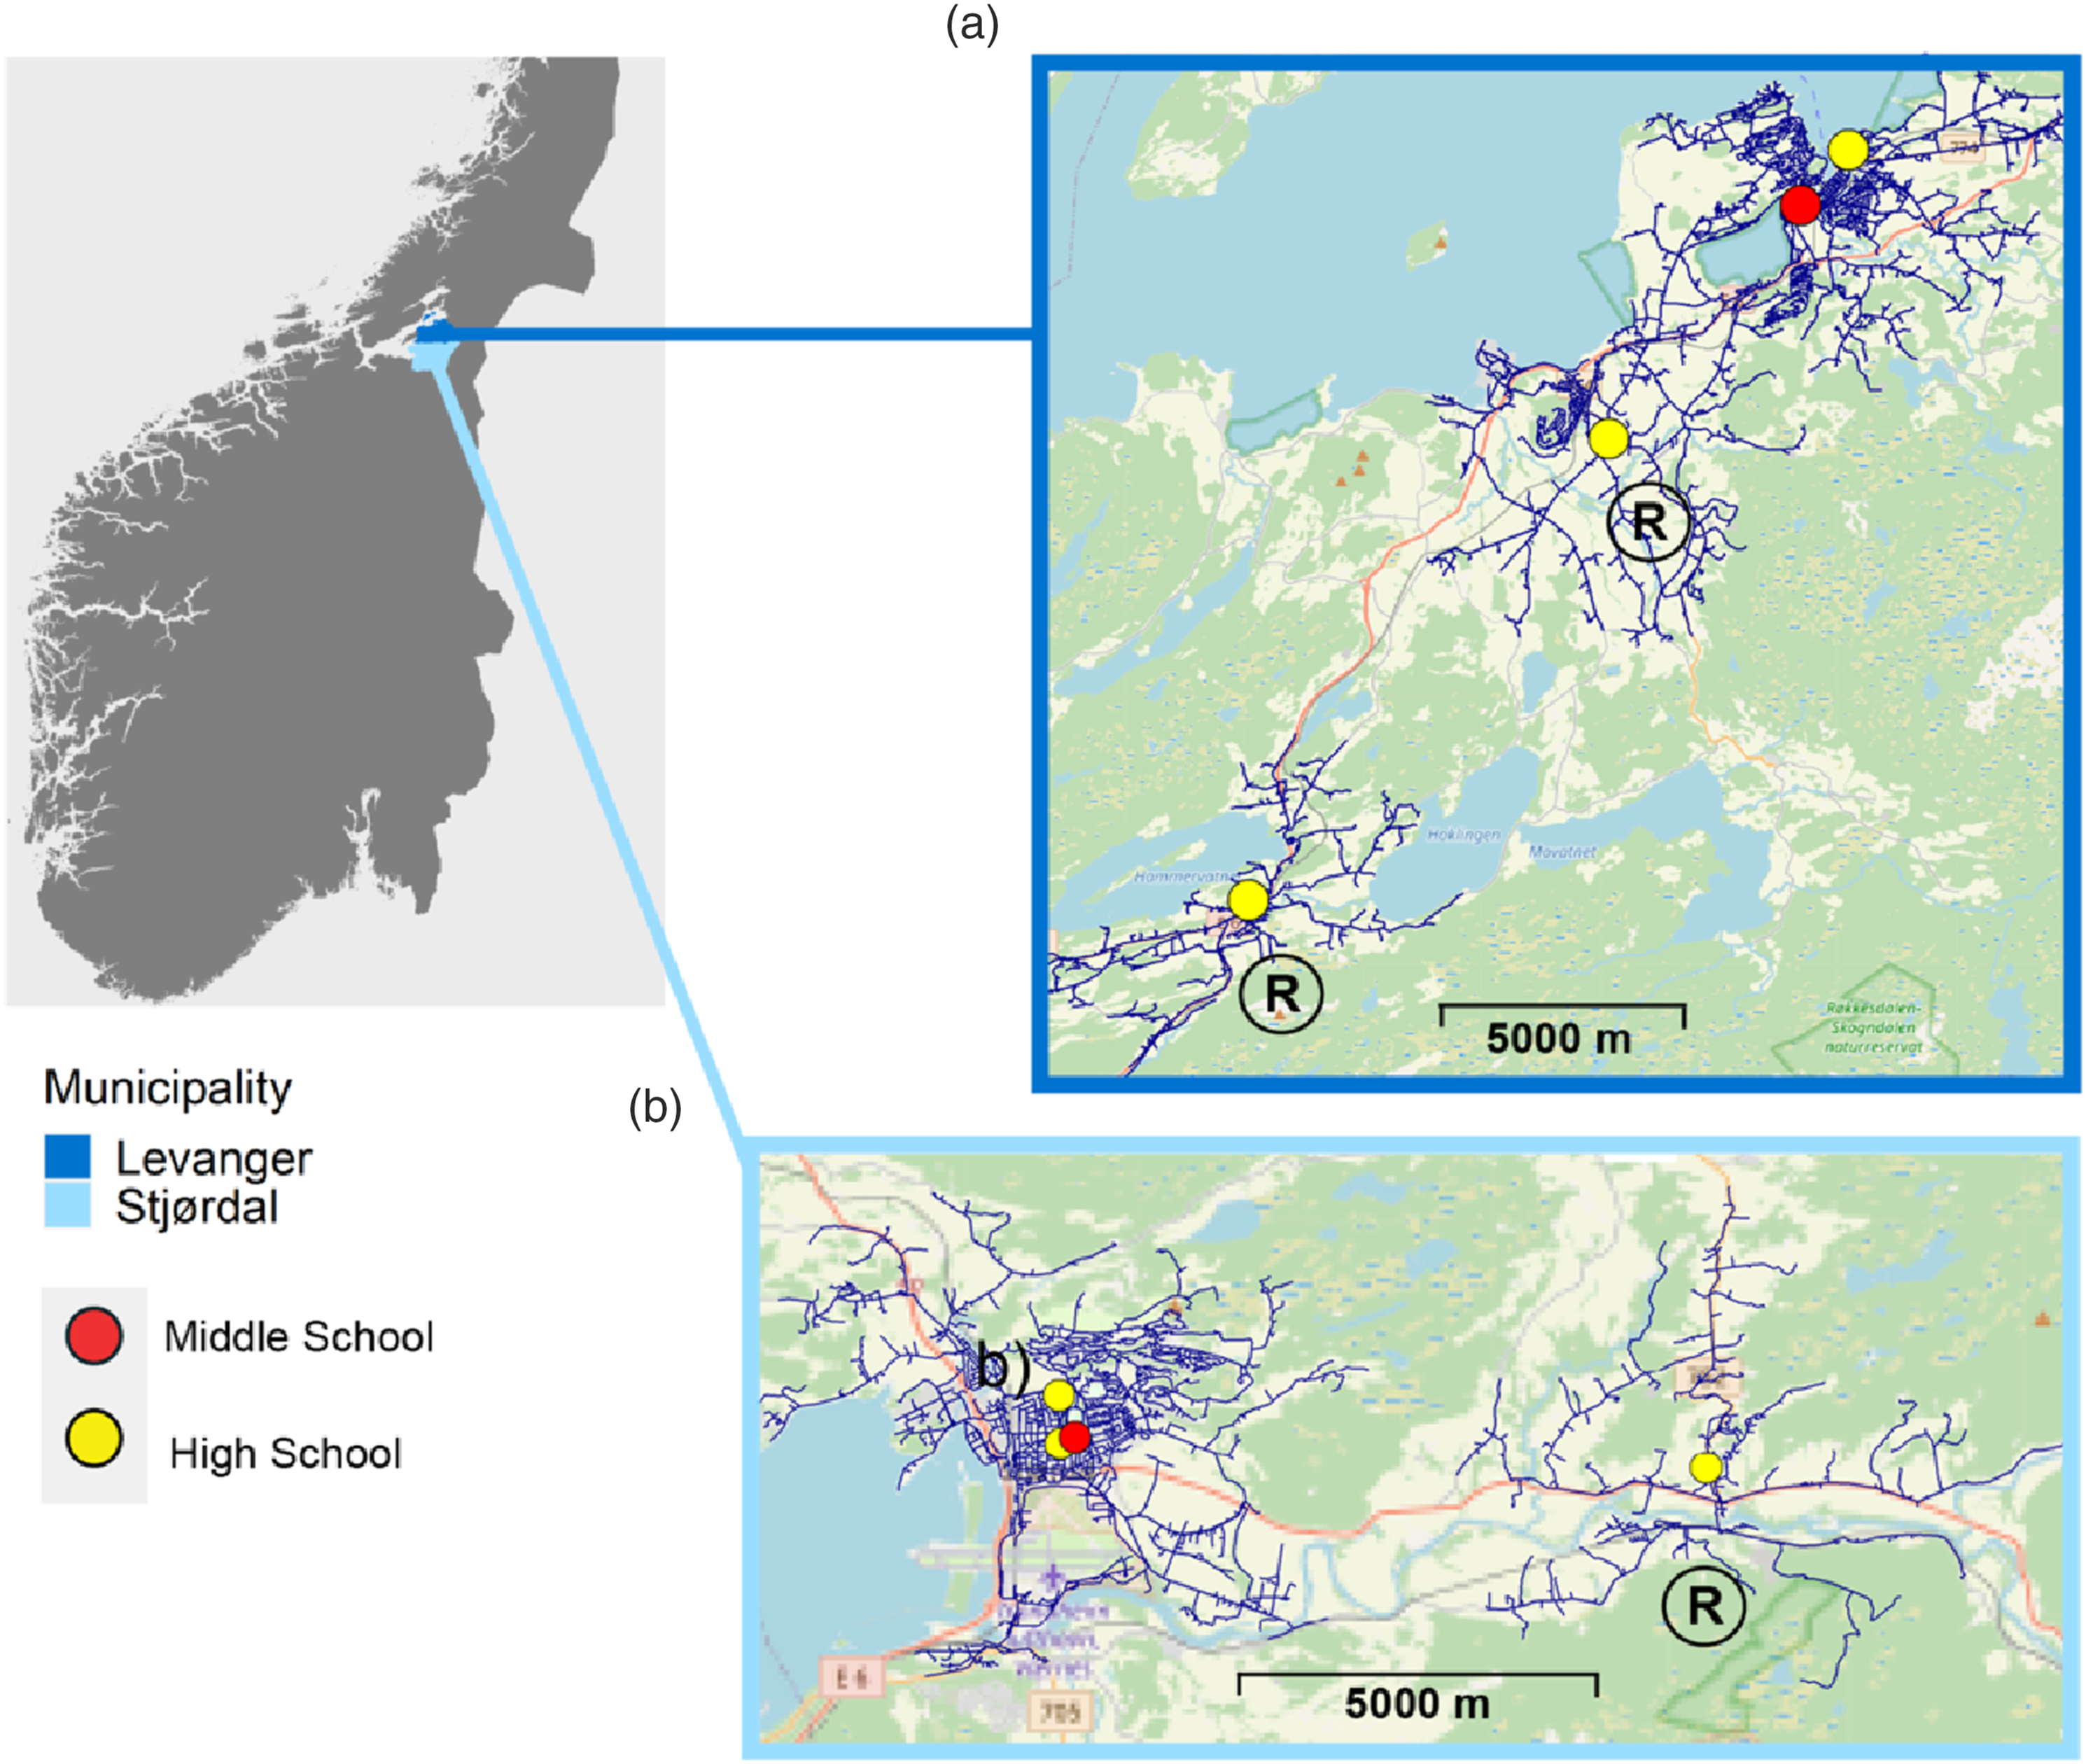
Sample
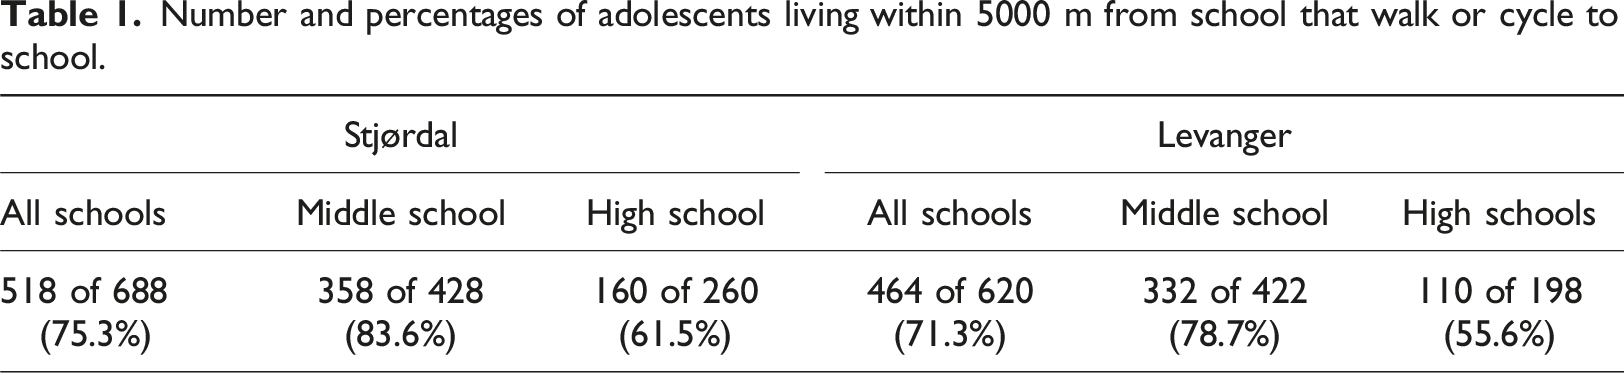
Number and percentages of adolescents living within 5000 m from school that walk or cycle to school.
Linking adolescents and schools
Several predictor variables in our study require address-level origin-destination relationships. In Norway, adolescents in middle schools (‘ungdomskoler’) are assigned to a school according to the school district in which they live, so we assigned middle school adolescents to their school based on their home address. High school (‘vidergående skole’) adolescents may choose their schools. Thus we used the school reported in the questionnaire. Adolescents attending school in municipalities other than Levanger or Stjørdal or who did not report their school were excluded from the analysis (n = 327).
Outcome variable active travel to school (ATS)
Travel modes to school were obtained in an interview by asking: ‘How do you usually travel to school’? The possible answers were by (a) walking or cycling, (b) public transport, (c) car or (d) scooter/moped. In this study, the outcome variable is binary – that is, walking or cycling to school (1) versus all other transport modes (0). No distinction between walking and cycling was possible. If adolescents gave multiple answers that included walking or cycling ‘yes’, they were considered to participate in ATS.
Network
The study uses detailed walking and cycling networks, including streets shared with vehicles. The networks were derived from road centreline maps from the Norwegian road authorities (NVDB, 2023) and OpenStreetMap (OSM; Boeing, 2021). We inspected and corrected the networks for missing connections and errors based on OSM, Google Earth, field visits, maps and orthophotos.
Predictors
Distance
Proximity to school is an important predictor variable for active travel, but distance along shortest routes is also a parameter for the variables ‘reach’ and ‘betweenness’. We calculated two shortest route metrics using the sDNA toolbox (Cooper and Chiaradia, 2020), following Cooper (2018), Cooper et al. (2021) and Sevtsuk (2021). The first metric is the shortest possible distance along a route in metres. This measure is called shortest network-Euclidean distance in sDNA.
Cyclists’ and pedestrians’ preference for avoiding sharp turns and junctions may lead to route choices that differ from metric shortest routes (Shatu et al., 2019). To account for the effect of distance, turns and junctions, we applied a second distance metric defined by Cooper et al. (2021; Supp Equations S1 and S2) that calculates shortest routes by minimising angular and metric distances along links and angular changes at junctions. In the following, this metric is termed ‘metric-angular distance’. Supp Figure S2 illustrates the shortest metric and metric-angular routes for an origin-destination pair.
Reach
Reach is a measure of network accessibility and network density (Feng and Zhang, 2019; Peponis et al., 2008). We calculated reach in sDNA as the number of links reached from home locations within a given network radius (Supp Equation S3). Reach with a radius of 1000 m for all links in the study areas is shown in Supp Figure S3.
Density
We measured urban density as reach weighted by population and floor area (Ståhle, 2008; Supp Equation 4). We obtained population data from the Norwegian national online cartographic database (Geonorge, 2023), where data are aggregated on 250 × 250 m cells. To disaggregate the data, we distributed the population evenly over the dwellings in each cell. The Norwegian Mapping Authority (Kartverket, 2023) provided data on the total (residential and non-residential) floor area for each building as ‘bruksareal’ (Norwegian Building Authority, 2022).
Betweenness and OD-betweenness
Betweenness is a centrality measure defined as the number of shortest routes between node pairs in a network that pass through a node (Sevtsuk, 2021). Betweenness can also be considered a flow model, where agents travel from every node to all other nodes. The betweenness of a node then corresponds to the sum of agents – in our case, pedestrians and cyclists – passing through that node (Cooper, 2018). We calculated betweenness in sDNA (Supp Equations S5 and S6), where betweenness is calculated for the midpoint of a link and considered representative for the entire link (Cooper and Chiaradia, 2020). This measure may also be referred to as link-weighted betweenness (Cooper, 2018), as distinct from betweenness weighted by lengths (e.g., Turner, 2007) or by opportunities/attractions (e.g., Berghauser Pont and Marcus, 2015). We applied link-weighted betweenness because link density (as measured by reach) can serve as a proxy for the density of origins and destinations (Chiaradia et al., 2014; Cooper, 2018; see also Methods section of the Supplemental Material). This also implies that the number of total pedestrian or cycling trips generated and assigned to the network scale with the square of links reached within a given radius (Cooper et al., 2021, their Equation 3). In this paper, betweenness refers to link-weighted betweenness unless stated otherwise.
Betweenness, as described above, is a measure of flows on shortest route from ‘everywhere to everywhere else’. For specific applications, the ‘OD-betweenness’ – that is, the flow between specific origin-destination pairs – can be more relevant. As this study targets ATS, we also calculated flows between homes (origins) and schools (destinations). Therefore, the OD-betweenness of a link represents the likely flow of adolescents walking or cycling to school through that link.
Modelling pedestrian and cyclist flows with betweenness and OD-betweenness assumes that flows follow the shortest routes. This assumption will not always hold for individuals (Shatu et al., 2019), but betweenness has been shown to capture a large share of variation in observed cycling and pedestrian flows (e.g., Berghauser Pont and Marcus, 2015; Cooper, 2018; Formolli et al., 2024; Sevtsuk, 2021)
Distance thresholds for betweenness
When estimating flows of pedestrians and cyclists, it is important to limit flows between origin and destination links to typical trip lengths (radii or catchment areas) for these transport modes (Sevtsuk, 2021). Corresponding to typical walking and cycling distances (Chillón et al., 2015; Cooper, 2018) and travel distances reported by study participants who engage in ATS, we applied metric radii that range from 500 to 5000 m.
Route betweenness
Although betweenness is suitable for flow modelling, it is less suitable for mode choice studies, as betweenness describes only part of a route, whereas, for mode choice, properties of the entire route from origin to destination are more relevant. Betweenness can also differ substantially between two adjacent streets and address points, with these differences unlikely to impact travel behaviour. Therefore, we developed two versions of ‘route betweenness’ to provide variables describing the mean betweenness of entire routes instead of individual route links. First, we extracted metric and angular-metric shortest routes between homes and schools as polylines (‘geodesics’) in sDNA. We then used a GIS intersect operation to spatially join these polylines with the network containing the betweenness values, and summed up the betweenness values of all links joined to the polylines. To prevent the measure from being a proxy for distance to school, we normalised the sum by the number of route links (the algorithms are provided in the Supplemental GIS Algorithms section). Based on the betweenness measure used, we obtained two new measures: i. ‘Route betweenness’, based on link-weighed betweenness, can be considered a proxy for the potential for adolescents to meet any pedestrians or cyclists on the shortest route to school, assuming actual pedestrian/cycling travel demand is correlated with link density. Route betweenness is also a measure of the connectivity of shortest routes. Betweenness increasing with link density also implies that routes have a high route betweenness when they pass through, start or end at locations with dense, well-connected networks and high trip generation. ii. ‘Route OD-betweenness’, based on OD-betweenness, can be considered a proxy for the potential of adolescents to meet other adolescents on the shortest route to school.
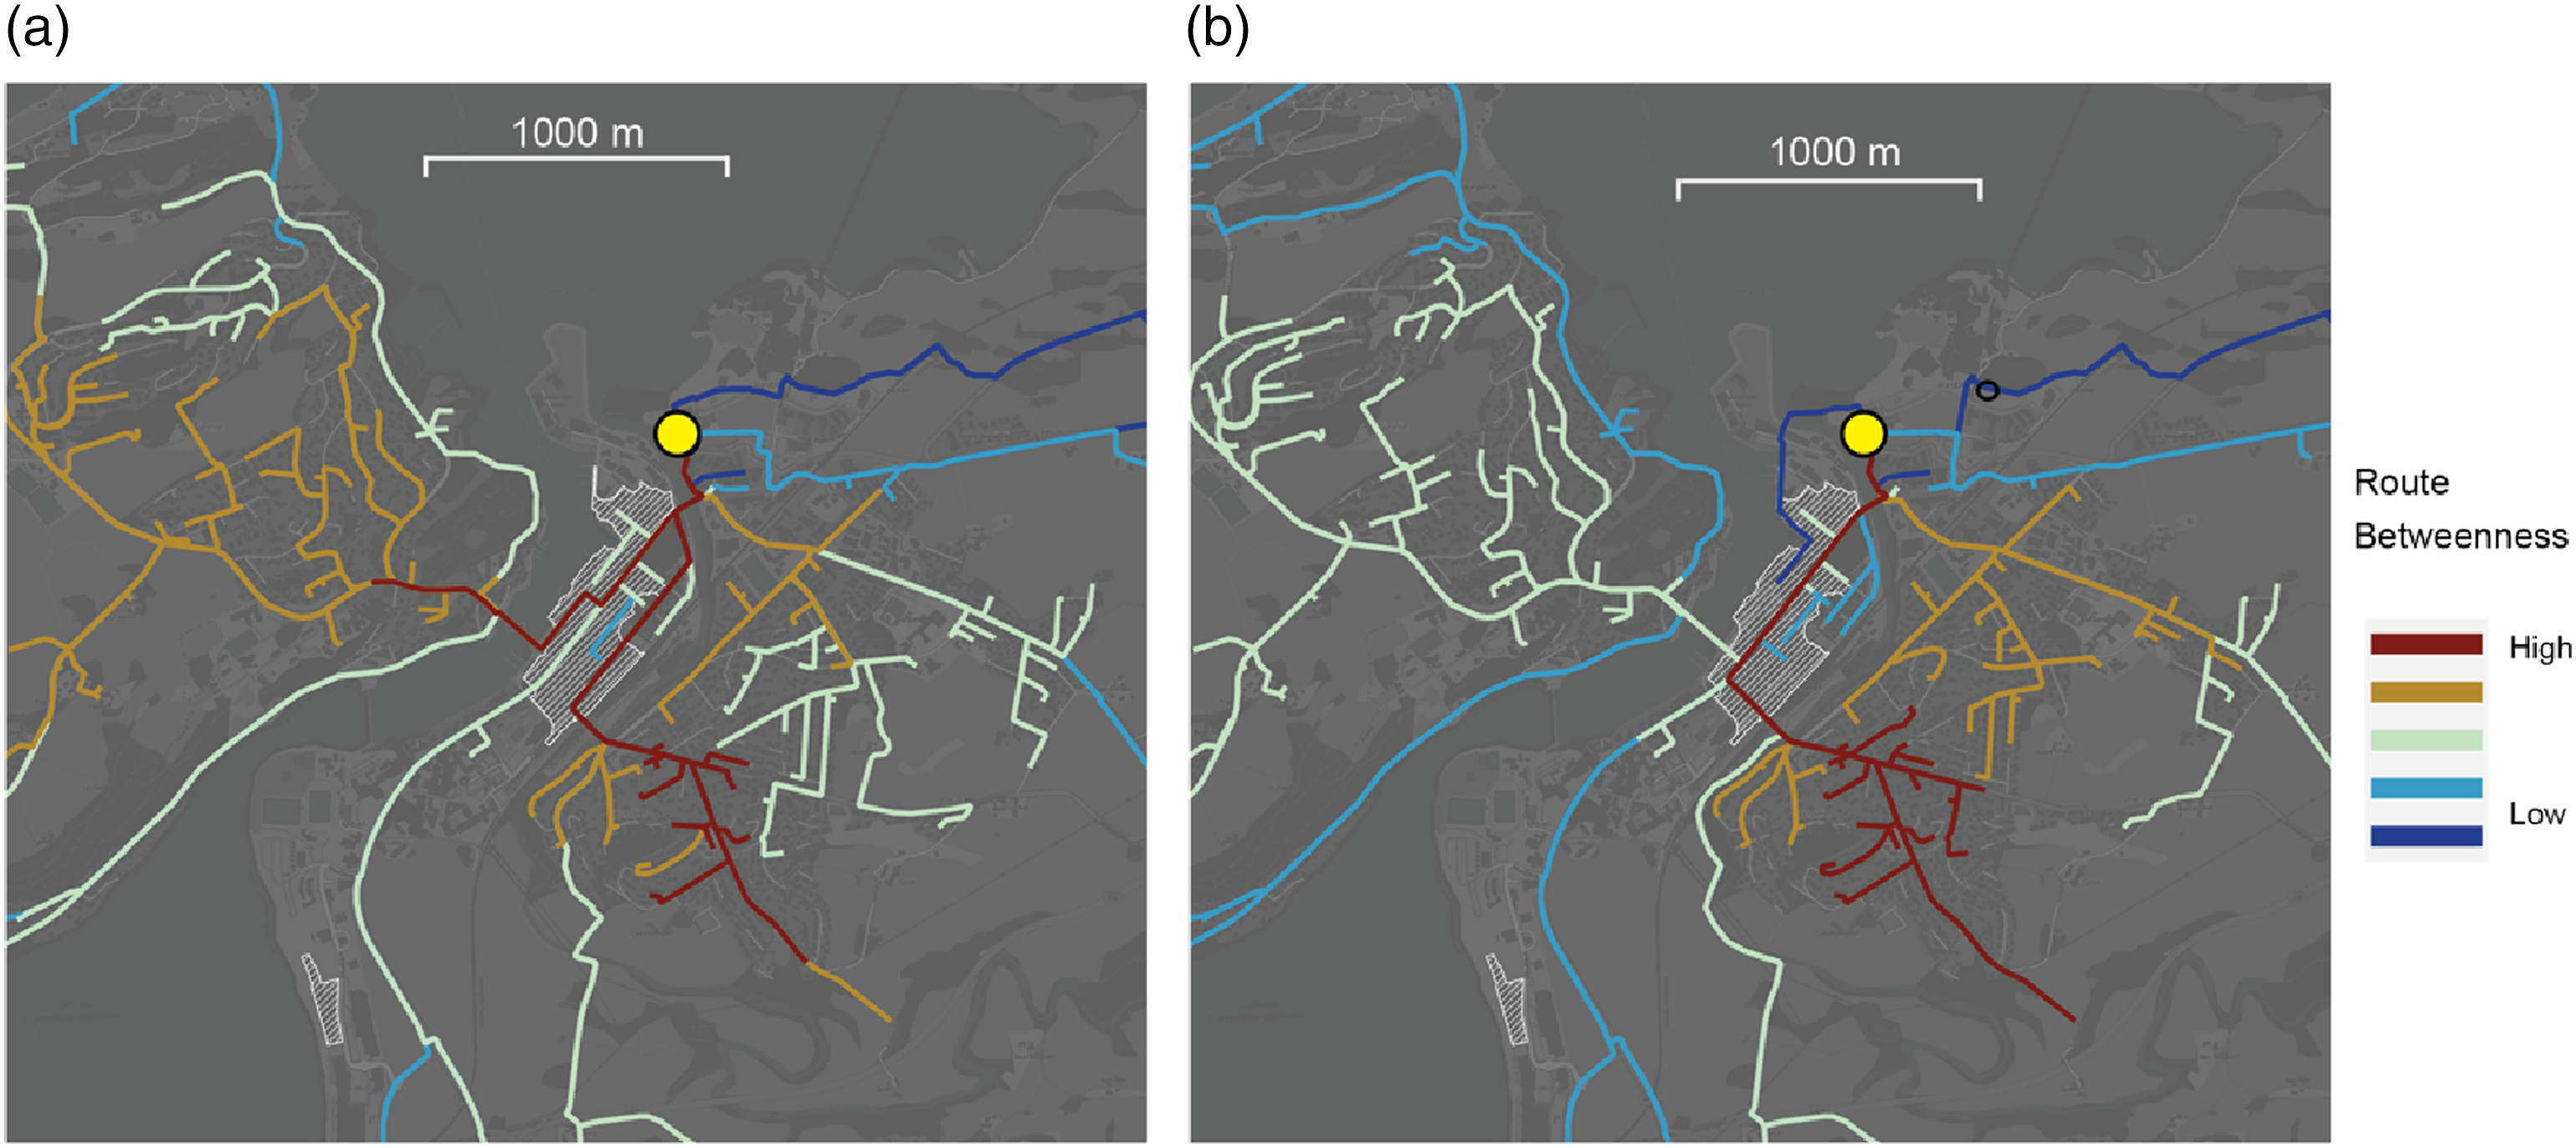
Figure 2 illustrates an example for (a) betweenness and (b) route betweenness, showing that betweenness values are limited to single links, whilst route betweenness captures the mean betweenness along the shortest route. The route with the highest route betweenness intersects 75 links between home and school, accumulating 832770 betweenness points. The value of route betweenness is therefore 832770:75 = 11104. For an example of the calculation of route OD-betweenness, see the Methods section of the Supplemental Material. A comparison of metric (2000 m) and metric-angular route betweenness (1000 m) is shown in Figure 3. (a) Metric-angular betweenness 1000 m for Levanger; (b) Route betweenness 1000 m for Levanger middle school, showing how route betweenness applies to entire routes from home to school; routes stacked higher have higher values. Comparison of route betweenness metric 2000 m (a) and metric-angular 1000 m (b), showing how angular-metric models a direct route through the centre zones (white area). Map Source:OpenStreetMap (2024).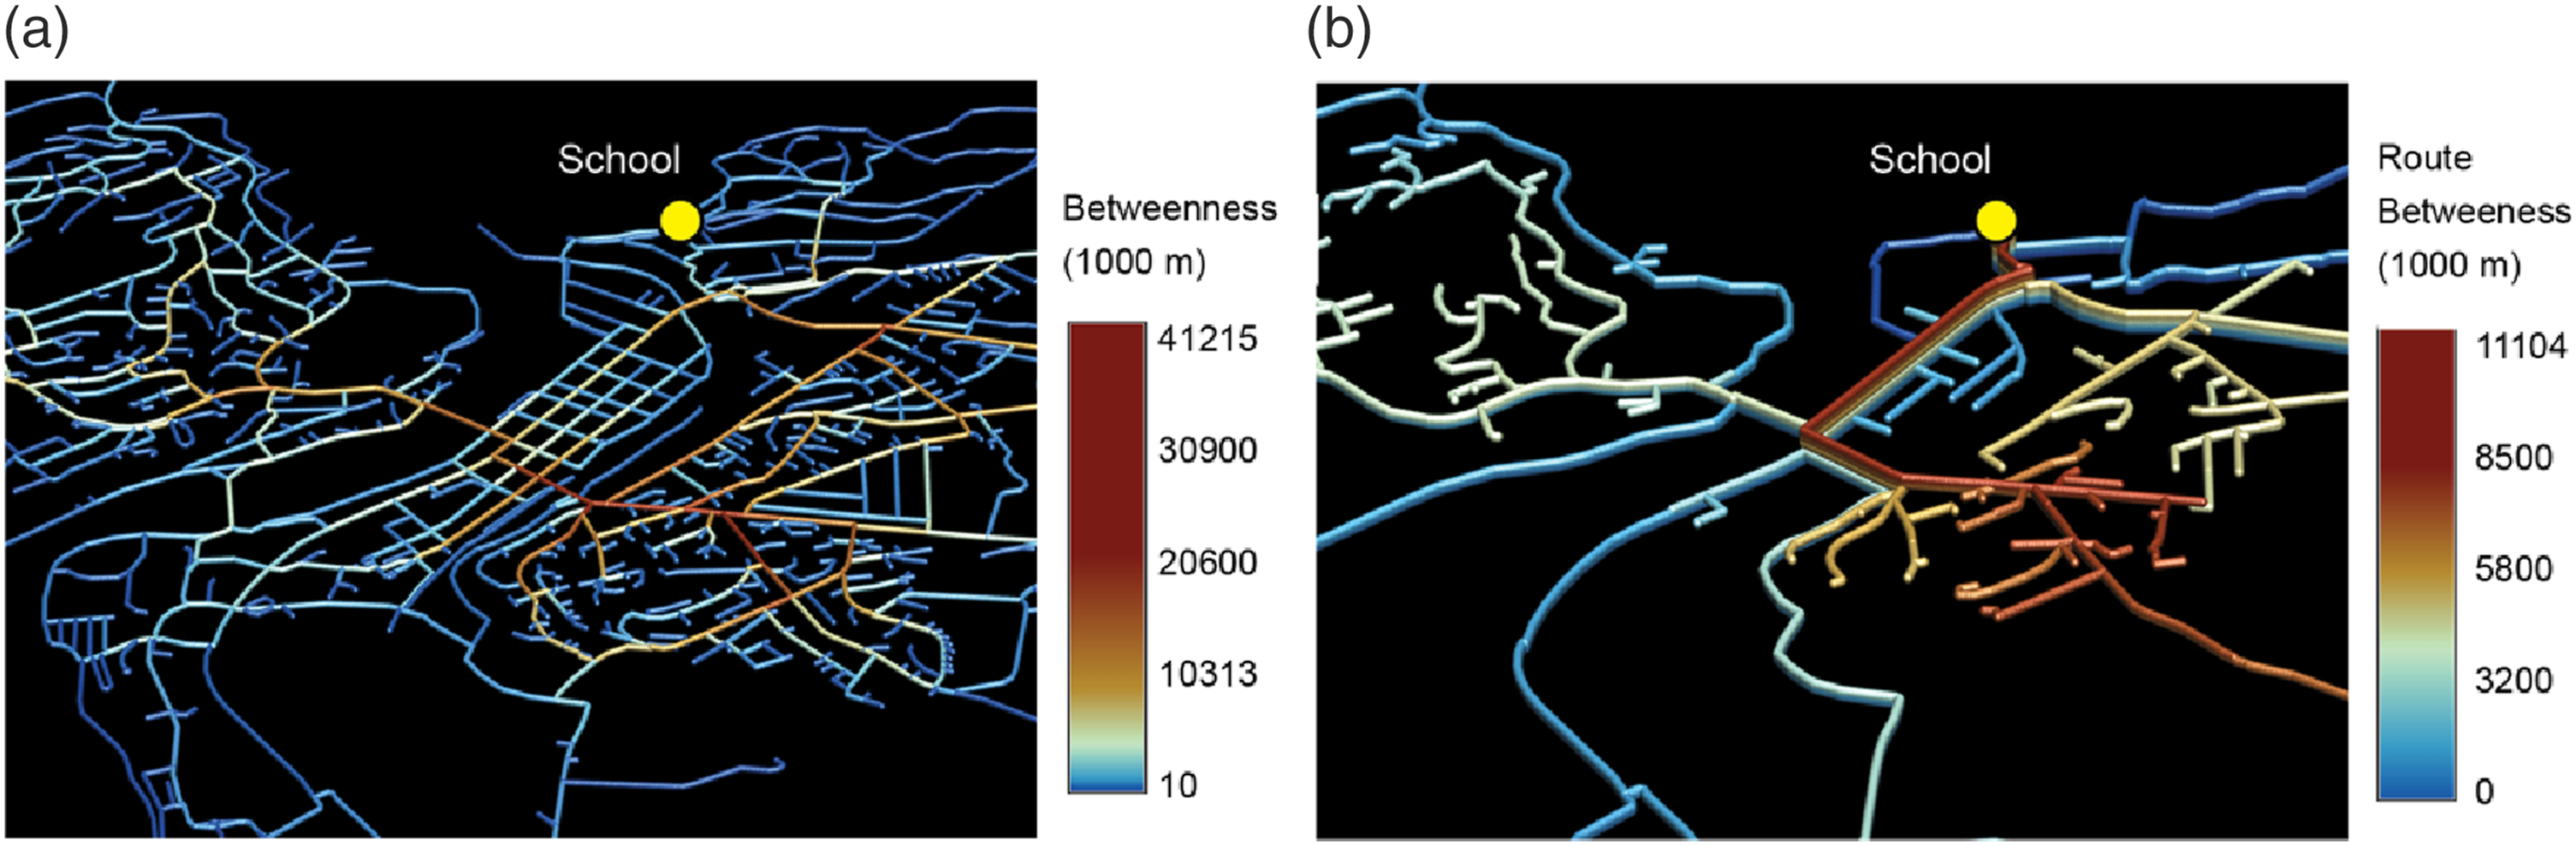
Covariates
We included age, gender and four covariates that may influence the decision to walk or cycle to school: proximity to school, centre zones (Figure 3) and food outlets, as well as exposure to traffic along the shortest routes to school. Proximity to centre zones served as a measure of access to shops, amenities and mixed land use. Exposure to traffic is a safety concern for parents (Vasey et al., 2022) and may induce a sense of vulnerability in children (Morris et al., 2022). We operationalised the exposure to traffic as the sum of annual average daily traffic (AADT) along the shortest route to school. A definition of centre zones and food outlets and considerations for assigning traffic to the network are described in the Methods section of the Supplemental Material.
Statistical analyses
Given the binary outcome (ATS ‘yes’ or ‘no’), we applied logistic regressions. First, we determined bivariate associations of route betweenness, route OD-betweenness, reach and the covariates with ATS. Based on the Akaike information criterion (AIC), we limited the number of variables carried forward to the multivariate analyses for (a) reach versus weighted reach and (b) metric versus metric-angular distances for proximity to school and AADT.
Second, we progressively built multivariable models. A base model estimated the effects of proximity to school, age, gender and AADT for all students in both municipalities. We then added route betweenness, route OD-betweenness and covariates. Reach was added last due to possible multicollinearity. The radii yielding the best AIC for reach and route betweenness/OD-betweenness were found by varying radii and shortest route metrics. A sensitivity test limited the analysis to adolescents living within 3000 m from school (Supp Table S2). In addition, we determined the best-fit metrics for individual schools. Due to the small sample sizes in the rural schools, these analyses were limited to urban schools (Figure 1).
Third, we stratified the analysis by school types and municipalities, limited to best subsets explaining the maximum variance with the lowest number of predictors. The best-subset selection compared all possible combinations of variables from the adjusted full model under AIC optimisation (Bertsimas et al., 2016). Variable inflation factor (VIF) permitting, we included variables from each best subset in all models to keep models comparable. The Supplemental Methods section contains additional details on VIF and model assumptions.
Results
Model selection
Descriptive statistics for variables used in the multivariable models.
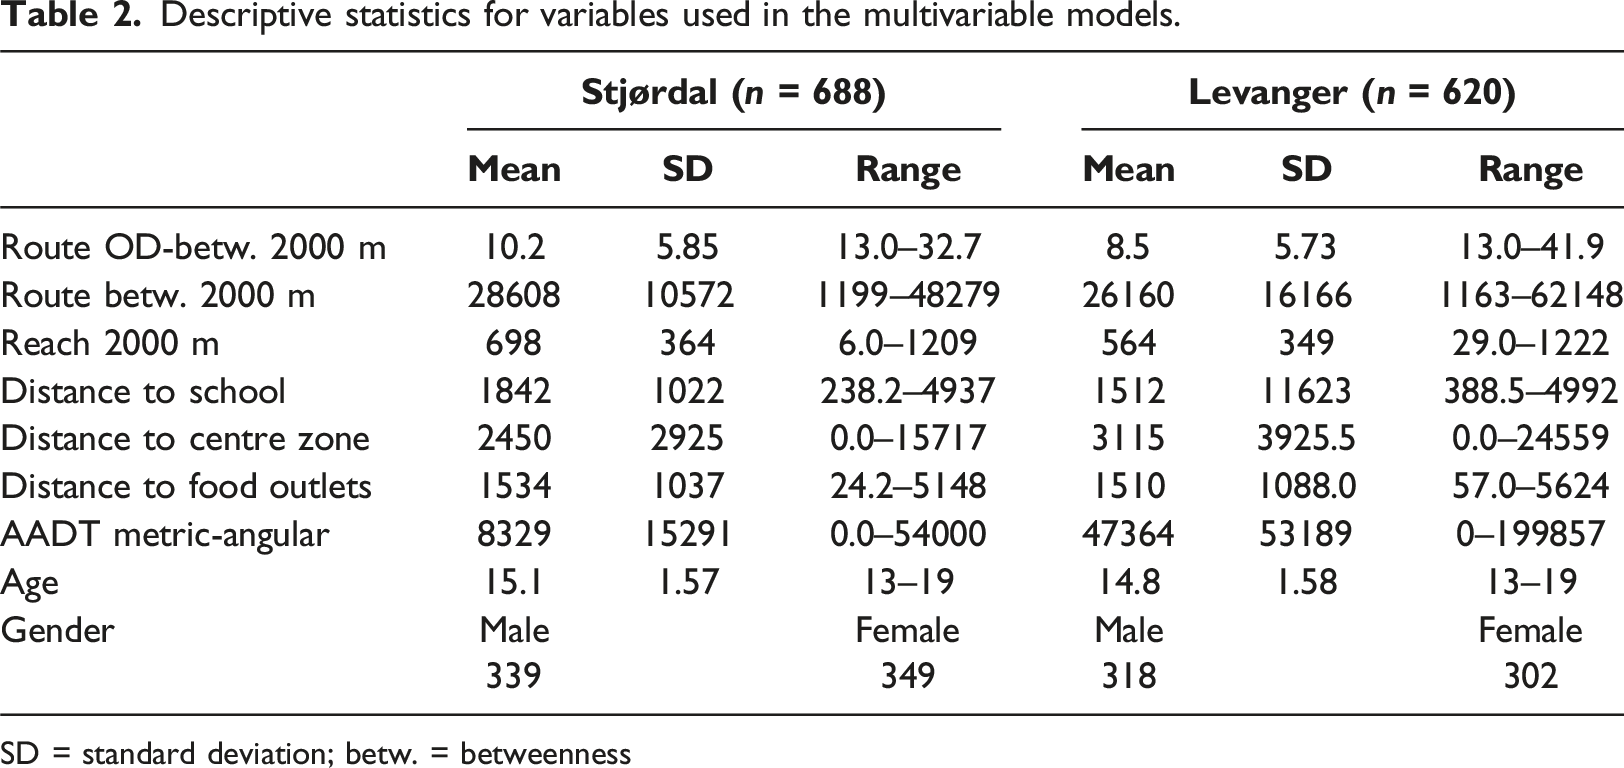
SD = standard deviation; betw. = betweenness
Maximally adjusted full model
Multivariable logistic regressions for the outcome walking or cycling to school ‘yes’ or ‘no’.
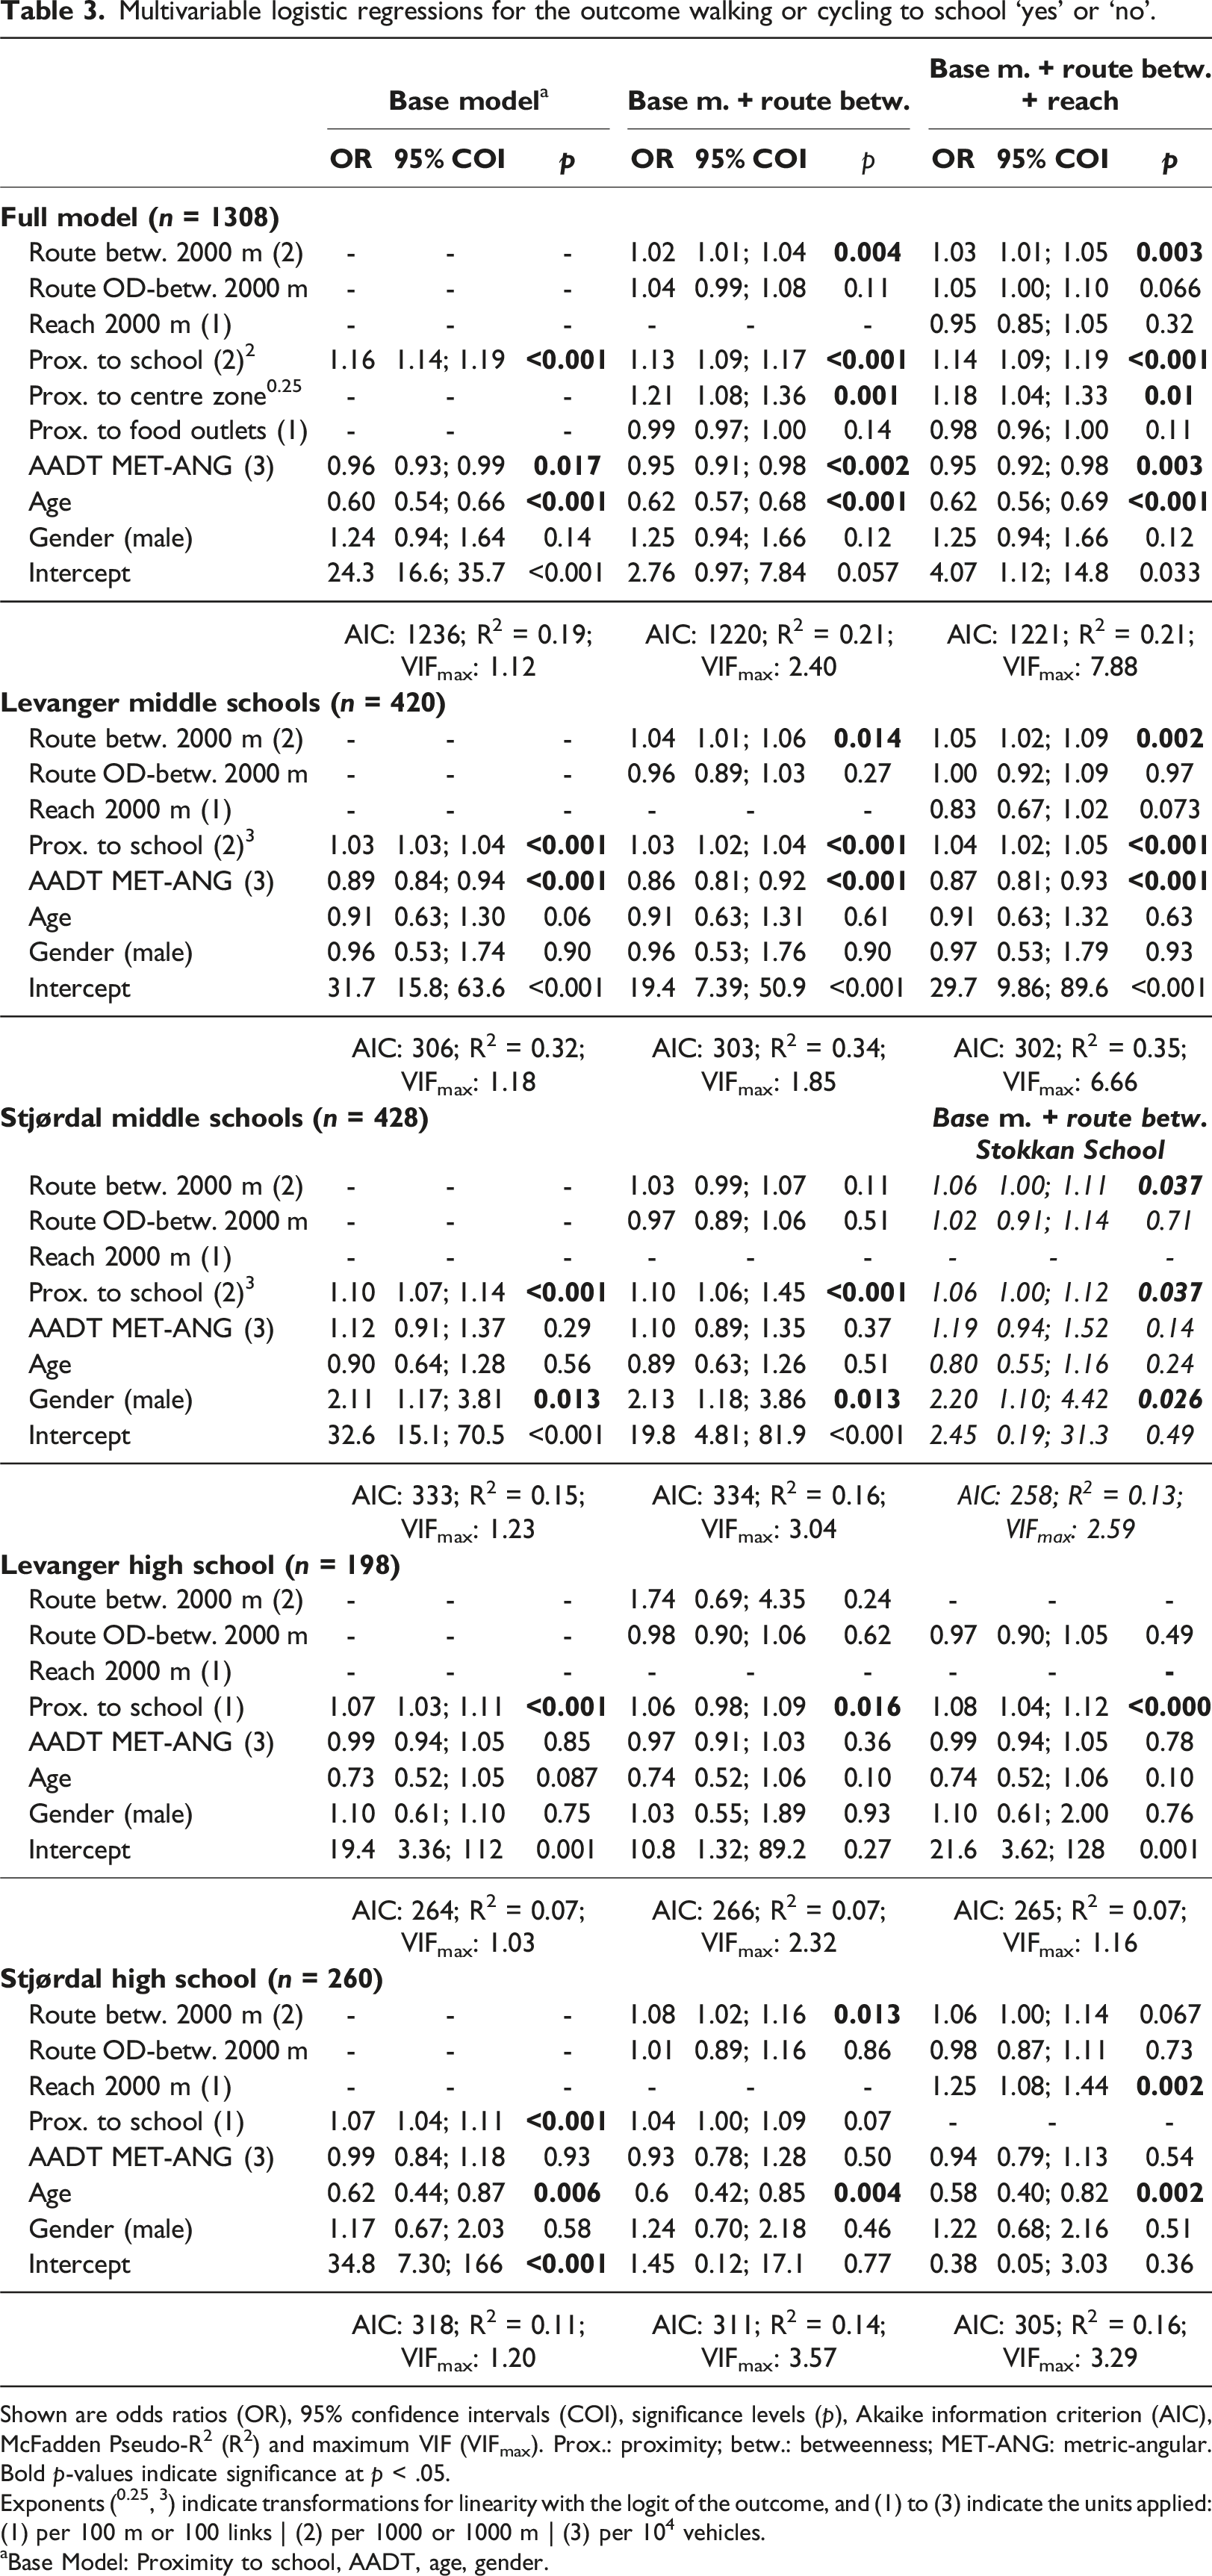
Shown are odds ratios (OR), 95% confidence intervals (COI), significance levels (p), Akaike information criterion (AIC), McFadden Pseudo-R2 (R2) and maximum VIF (VIFmax). Prox.: proximity; betw.: betweenness; MET-ANG: metric-angular. Bold p-values indicate significance at p < .05.
Exponents (0.25, 3) indicate transformations for linearity with the logit of the outcome, and (1) to (3) indicate the units applied: (1) per 100 m or 100 links | (2) per 1000 or 1000 m | (3) per 104 vehicles.
aBase Model: Proximity to school, AADT, age, gender.
The sensitivity test confirms the significance of route betweenness (Supp Table S2). Supp Figure S5 shows a probability plot for the base model plus route betweenness for all schools.
Stratified multivariable models
The best-subsets selection identified route betweenness, route OD-betweenness, reach, proximity to school and AADT as predictors (Supp Table S4). Table 3 shows the results for the corresponding stratified multivariable models.
For Levanger middle schools, adding route betweenness improves the model fit over the base model. The result for the base model plus route betweenness suggests that intersecting, on average, 1000 more links that are part of other people’s shortest routes increases the odds of ATS by a factor of 1.04. For an increase from the mean to the maximum, the odds of ATS increase by a factor of 2.90. However, when stratifying further by urban and rural locations (Figure 1) – that is, Levanger (n = 311) versus Skogn and Åsen (n = 111) – the impact of route betweenness is limited to Levanger, whilst in Skogn and Åsen, proximity to school is the main determinant of ATS (see Supp Table S3).
For Stjørdal middle schools, adding route and route OD-betweenness does not improve model fits over the base model. However, the location, mean distance to schools and samples differ between the middle schools. For adolescents from Stokkan school (located at the edge of Stjørdal’s centre; Figure 1(b); 350 adolescents), route betweenness is significantly associated with ATS. For the other two middle schools, route betweenness has a limited impact on ATS due to a high mean distance to school (3537 m; Halsen, n = 28), low mean route betweenness (3234; Hegra, rural location, n = 50) and low sample sizes. We omitted reach due to multicollinearity and show results for Stokkan Middle School instead (in italics).
For Levanger High School, adding route or route OD-betweenness does not improve the fit over the base model. A possible explanation is the correlation of route betweenness with proximity to school (r2 = 0.72). This suggests that adolescents following streets with high route betweenness live relatively close to school. Due to multicollinearity (VIF = 8.13) and guided by the best-subset analysis, we omitted route betweenness and reach in the third model, where route OD-betweenness remains insignificant at the p = .05 level.
For Stjørdal High School, only adding reach significantly improves the model fit. Due to the school’s central location, reach is – unlike in other models – positively associated with ATS, but correlated with proximity to school (r2 = 0.86). We thus omitted proximity to school in the third model. The result suggests that reach is a stronger predictor than proximity to school. This does not imply that proximity to school has a limited impact on ATS, but rather that reach describes more variation in ATS. Route betweenness is significant at the p < .1 level in both models.
Models for individual schools
Multivariable logistic regressions for Levanger Middle School (centre; n = 311).
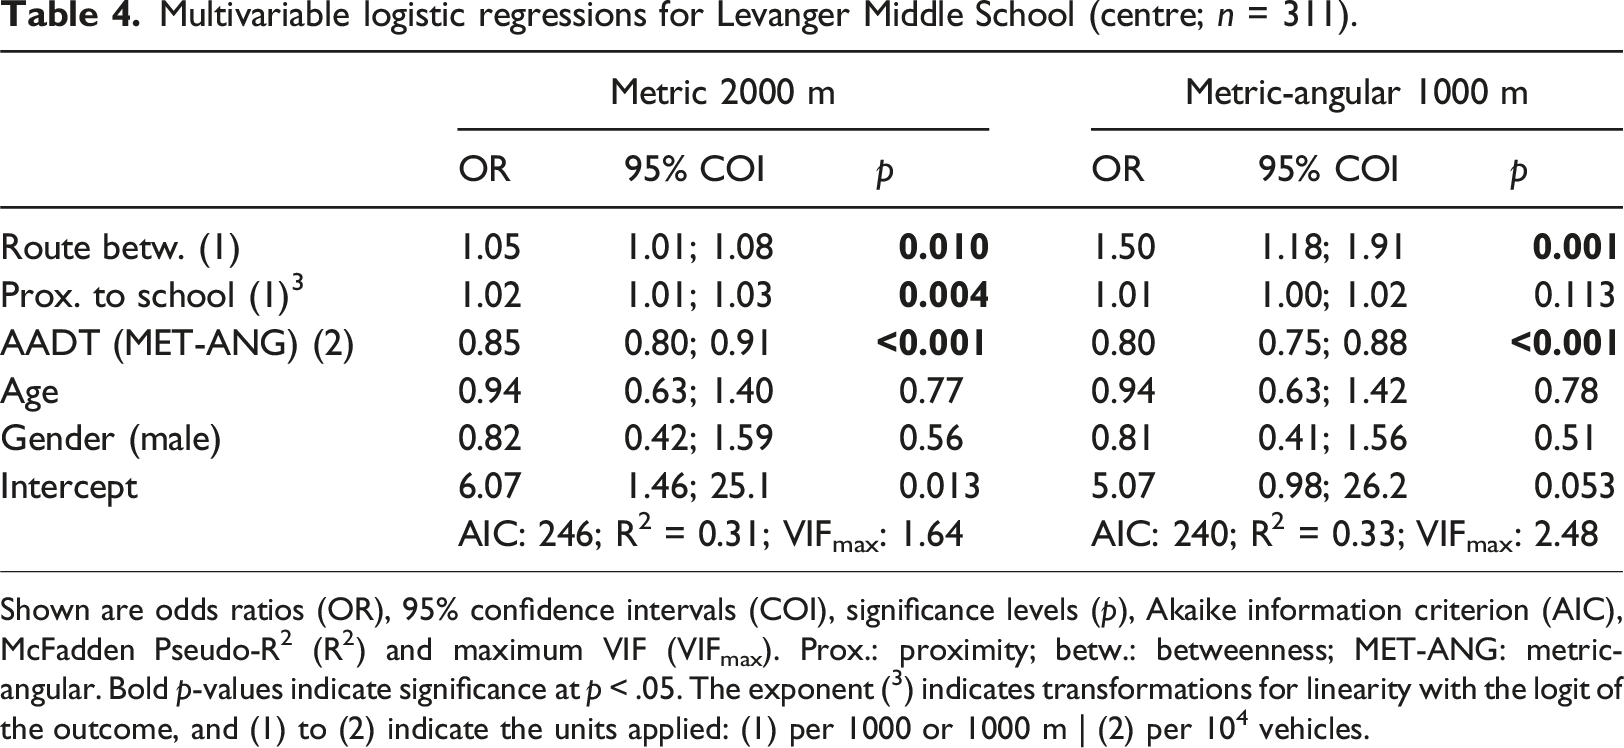
Shown are odds ratios (OR), 95% confidence intervals (COI), significance levels (p), Akaike information criterion (AIC), McFadden Pseudo-R2 (R2) and maximum VIF (VIFmax). Prox.: proximity; betw.: betweenness; MET-ANG: metric-angular. Bold p-values indicate significance at p < .05. The exponent (3) indicates transformations for linearity with the logit of the outcome, and (1) to (2) indicate the units applied: (1) per 1000 or 1000 m | (2) per 104 vehicles.
Discussion
This study examined the associations between the network-based measure ‘reach’ and two novel network measures, ‘route betweenness’ and ‘route OD-betweenness’, with ATS. Reach measured network accessibility, connectivity and density around homes. In contrast, route betweenness and route OD-betweenness measured the connectivity of the network between homes and schools, and the potential to meet other people (route betweenness) or adolescents (route OD-betweenness) along the shortest routes to school.
Route betweenness showed significant and positive associations with ATS in most adjusted models. For the shortest route to school, route betweenness proxies the number of links that an adolescent theoretically shares with the flow of a city’s population travelling through the network. Route betweenness is also a connectivity measure, as routes have high route betweenness when they pass through or start/end at locations with dense, well-connected networks and high trip generation.
We found that the probability for ATS at maximum route betweenness is 10% higher than at average route betweenness and 20% higher than at minimum route betweenness. These findings could be linked to the perceived importance of social interaction for ATS reported in qualitative studies (Morris et al., 2022). Increased connectivity and the presence of other people walking or cycling may also nudge parents towards encouraging their children to walk or cycle to school (Aranda-Balboa et al., 2020). However, the results also indicate that the impact of route betweenness is limited to urban environments, where streets with high betweenness and through-movement are likely to host attractions, shops or other amenities (Sevtsuk, 2014) that further encourage ATS (Romero, 2014). Streets in rural areas have limited flows of pedestrians and cyclists, and meeting others may, therefore, play no significant role.
Route OD-betweenness, a proxy for sharing routes with other adolescents and classmates, showed positive and significant associations with ATS in the bivariate analysis. This aligns with previous research showing that social interactions with friends and classmates can positively impact ATS (Waygood et al., 2021). However, route OD-betweenness is, on average, higher for routes originating closer to schools, and significance levels are thus low once adjusted for proximity to schools.
In accordance with Ozbil et al. (2021), network reach around home showed a positive impact on ATS in the bivariate analyses, but the measure also correlates with other predictor variables. More specifically, proximity to school, route betweenness and route OD-betweenness together explain 84 to 88% of the variance of reach. Reach thus reverses its associations (i.e., negative) with ATS in most multivariable models. Route betweenness is likely a more appropriate measure in the context of ATS than reach. Reach measures accessibility to everywhere in the network within a given radius from home locations, but this network may or may not include the shortest routes connecting homes and schools. In contrast, route betweenness specifically considers the connectivity of the network between homes and schools.
A radius of 2000 m for route betweenness, route OD-betweenness and reach showed the best model fits. This is a relatively large radius compared to previous studies targeting ATS and physical activity in adolescents (Smith et al., 2021). The radius of 2000 m may correspond to the distances to school commonly walked or cycled (Supp Figure S1). Walking and cycling were also not distinguished, and the unknown proportion of adolescents who cycle may contribute to the high radius.
We also found that metric measures yielded better model fits than metric-angular measures, which contradicts previous research (Formolli et al., 2024; Hillier and Iida, 2005; Shatu et al., 2019). There may be several reasons for this. First, adolescents are usually familiar with their route to school, and directness and navigational complexity may not be a problem. Second, on streets with mixed traffic, betweenness may not only estimate the distribution of pedestrians/cyclists but also of vehicle flows, particularly on angular shortest routes (Hillier and Iida, 2005). Thus, more direct routes minimising metric-angular distances may expose adolescents to more traffic and are thus avoided. Third, the networks in both municipalities are not dominated by grid-like layouts, which may limit options to minimise turns without routes becoming substantially longer (Sevtsuk and Basu, 2022). The exception is the middle school in Levanger’s centre, where metric-angular shortest routes lead along centre streets with shops, amenities and a park, whereas several metric shortest routes bypass the centre. This, combined with Levanger’s relatively small centre, may explain the better fit of the metric-angular model and the 1000 m radius.
From an urban planning perspective, route betweenness complements betweenness. Betweenness highlights frequently used links and can indicate where safe cycling and pedestrian infrastructure are most important (Lowry et al., 2016). Route betweenness links betweenness to specific routes between OD pairs. For existing schools, a comparison of route betweenness with and without safe, dedicated walking/cycling infrastructure could help determine where improved infrastructure would impact flows not only on individual links but also on individual shortest school routes. Project proposals for the location of new schools could be evaluated based on the average route betweenness for home-school pairs.
Limitations
Several limitations and suggestions for future research need to be pointed out. First, walking and cycling to school were measured jointly, while research has shown that urban form can impact these travel modes differently (Helbich, 2017). The available control variables were limited to gender and age, while other factors, such as parents’ income and socio-demographic variables, have also been shown to play a role (te Velde et al., 2017). Safety can be a concern for parents and adolescents (Larsen et al., 2012). The only safety-related control variable in this study is the sum of AADT along shortest routes to school, with available AADT data limited to main roads. Although crime rates in Norway are low (Statista, 2022), crime along school routes can be detrimental to ATS, and should be considered in future studies.
Another limitation is the assumption that adolescents take the shortest routes to school, as the shortest route will not always be the route taken by an individual (Dessing et al., 2016). However, betweenness estimates flows and not individual routes; on an aggregated level, a large proportion of actual routes are likely to be captured.
The study used link-weighted betweenness justified by strong correlations between reach weighted by links and reach weighted by population and floor area. However, such network/land-use interrelations are not a given (Berghauser Pont and Marcus, 2015). In other settings, such as new residential or commercial developments, betweenness should account more explicitly for land use (Cooper, 2018; Sevtsuk, 2021). Further studies should also calibrate betweenness to measured flows, explore the effects of path randomisations (Cooper et al., 2021) and detour factors (Sevtsuk, 2021), and investigate the impact of slope, route conditions and winter maintenance (Cooper et al., 2021; Fossum and Ryeng, 2022).
Conclusion
Whilst proximity to school is a key predictor of ATS, our findings suggest that route betweenness – that is, the connectivity and density of the network along the way to school – also matters. Route betweenness is a measure of the connectivity of the network between home and school, but also of the potential to encounter other cyclists and pedestrians along the way. Route betweenness remains significant when adjusted for proximity to school and other covariates, with a notable positive impact on the probability for ATS.
Urban planners should consider route betweenness when planning new schools outside central city locations or when evaluating properties of networks around existing schools. A centrally located school will usually be close for many adolescents, and routes to the school will include sections with activities and people. A school in a non-central location will offer attractive routes for some but not for others. For existing schools, route betweenness can assist in identifying where investments in walking and cycling-friendly infrastructure and increased traffic safety along school routes are particularly important.
Supplemental Material
Supplemental Material - The impact of street network connectivity on active school travel: Norway’s HUNT study
Supplemental Material for The impact of street network connectivity on active school travel: Norway’s HUNT study by Peter Schön, Eva Heinen, Vegar Rangul, Erik R. Sund, and Bendik Manum in Environment and Planning B: Urban Analytics and City Science
Footnotes
Acknowledgements
The Trøndelag Health Study (HUNT) is a collaboration between HUNT Research Centre (Faculty of Medicine and Health Sciences, Norwegian University of Science and Technology NTNU), Trøndelag County Council, Central Norway Regional Health Authority, and the Norwegian Institute of Public Health. The authors also gratefully acknowledge the support from the Research Centre on Zero Emission Neighbourhoods in Smart Cities (FME ZEN) and the Research Council of Norway. The authors would also like to thank Crispin Cooper at Cardiff University for his help with questions regarding the use and specifications of the sDNA software, and Ann Legeby, Daniel Koch and Cheng Feng at KTH Stockholm for the productive feedback on an early paper draft.
Declaration of conflicting interests
The author(s) declared no potential conflicts of interest with respect to the research, authorship, and/or publication of this article.
Funding
The author(s) disclosed receipt of the following financial support for the research, authorship, and/or publication of this article: This work was internally funded by one of NTNU´s strategic research areas, NTNU Health. The research aims to promote better health, quality of life and sustainable health services to address the complex challenges of great importance to society.
Data Availability Statement
The Trøndelag Health Study (HUNT) has invited persons aged 13–100 years to four surveys between 1984 and 2019. Data from more than 140,000 persons having participated at least once and biological material from 78,000 persons are collected. The data are stored in HUNT databank and biological material in HUNT biobank. HUNT Research Centre has permission from the Norwegian Data Inspectorate to store and handle these data. De-identified data are sent to researchers upon approval of a research protocol by the Regional Ethical Committee and HUNT Research Centre. To protect participants’ privacy, HUNT Research Centre limits the storage of data outside HUNT databank and cannot deposit data in open repositories. HUNT databank has precise information on all data exported to different projects and can reproduce these on request. For more information see: ![]()
Supplemental Material
Supplemental material for this article is available online.
References
Supplementary Material
Please find the following supplemental material available below.
For Open Access articles published under a Creative Commons License, all supplemental material carries the same license as the article it is associated with.
For non-Open Access articles published, all supplemental material carries a non-exclusive license, and permission requests for re-use of supplemental material or any part of supplemental material shall be sent directly to the copyright owner as specified in the copyright notice associated with the article.