
Abstract
Mobile phones share location records, offering the opportunity to monitor and understand emerging population dynamics in urban centers. With the aim of supporting urban planning, this study introduces a scalable methodology grounded on extracting and organizing spatiotemporal statistics from decomposed population density data. The proposed methodology serves three major purposes: (i) assess the predictability of spatiotemporal citizen density patterns; (ii) detect emerging spatiotemporal trends in population density; and (iii) uncover multi-level seasonality patterns with guarantees of actionability. Additionally, it makes available an open-access tool for deploying the proposed methodology and analyzing mobile phone network data with easy-to-use spatiotemporal visualization and navigation facilities. The results obtained from real-world, large-scale mobile data in Lisbon, Portugal, demonstrate the effectiveness and validity of the proposed methodology in extracting actionable statistics in linear time to guide both tactic and strategic urban planning.
Keywords
Introduction
In recent years, location-aware technologies such as remote sensing, geographical information systems, and global positioning systems have led to increased data collection to model human mobility patterns in space and time. Amongst location-aware technologies, the usage of mobile phones as positioning sensors is creating new opportunities for urban planning and the creation of “real-time cities” (Kitchin, 2014). These cities implement systems for collecting and analyzing data in real-time, aiming to improve the efficiency and quality of life of the citizens. The analysis of mobile data along an urban footprint allows a deeper understanding of the complex population dynamics. By extracting patterns from these data, city officials and researchers can gain valuable insights into the behavior of urban populations, helpful in guiding decision-making and planning to the overall functioning of the city. In particular, the acquired knowledge from these patterns is key for urban applications, including human mobility, smart transportation, urban planning, public safety, healthcare, and environmental management (Calabrese et al., 2010; Ghahramani et al., 2020).
In this context, this work addresses the problem of acquiring actionable knowledge for urban planning by extracting population density patterns from large-scale mobile phone data along predefined spatiotemporal (ST) footprints. Recent studies in this field have explored the use of techniques such as Kernel density estimation (KDE) to model population density at regular time intervals (Ghahramani et al., 2018; Shi et al., 2020; Zhang et al., 2020; Kato, 2021; Wei et al., 2023), Kriging to study time-varying density changes (especially during peak hours) and identify high-traffic attraction zones (Lu et al., 2021), and spatial correlation data analysis to unveil the dynamics of the city and identify hotspots (Ghahramani et al., 2018). However, these studies do not address scalability requirements; real-time processing needs; relevant spatiotemporal usability principles to comprehensively assess the state of a city and prioritize information with actionable potential; and the inherent unpredictability of mobile phone position data that unusual events can cause.
To address these challenges, we propose an approach based on the spatiotemporal decomposition of population density series derived from mobile phone data. This is followed by extracting statistics that can be translated into practical actions with tangible impact (actionable statistics) (Silberschatz and Tuzhilin, 1995). Our approach has a linear time computational complexity and can be easily adapted to process streaming data efficiently (Wen et al., 2020). In addition, the results of our approach are not only easily understood and interpreted (usability) (Doshi-Velez and Kim, 2017) but can further be used to take meaningful actions and decisions (actionability) (Silberschatz and Tuzhilin, 1995). Four major contributions are provided: 1. Systematization of relevant spatiotemporal statistics from population density for urban planning, including the predictability of citizen density (RQ1), the presence of linear or emergent trends (RQ2), and the explainable variability due to seasonality (RQ3); 2. Criteria to rank and fix spatial and temporal scales for guided knowledge extraction; 3. Open-access application with easy-to-use spatiotemporal visualization and navigation features; 4. Application of the methodology in the above 1 to 3 entries to the city of Lisbon, followed by an analysis of the main patterns of population density and their practical implications for urban planning.
Accordingly, the remainder of this paper is organized as follows. First, we highlight Related work on mobile phone data analysis field and further provide essential Background. The proposed Solution, comprising a methodology and open-access application for the spatiotemporal visualization of patterns of interest, is then introduced. Results and practical implications for the introduced case study are further discussed. Finally, major Conclusions are drawn.
Related work
Pioneering works considering mobile phones as wearable sensors were conducted by the MIT Media Laboratory through the Reality Mining project (Eagle and Sandy Pentland, 2006). By collecting data from 100 mobile phones over 9 months, the project provided publicly available datasets for urban sensing data analysis. Most studies on urban dynamics from mobile phone data consider call detailed records (CDRs) data, commonly aiming to: (1) understand urban mobility dynamics (Ratti et al., 2006; González et al., 2008; Song et al., 2010; Toole et al., 2015); (2) support intelligent transportation (Järv et al., 2012; Berlingerio et al., 2013; Zhong et al., 2017); (3) infer land-use (Soto and Frias-Martinez, 2011; Pei et al., 2014; Ríos and Muñoz, 2017); (4) improve responses to disasters (Bengtsson et al., 2011; Cinnamon et al., 2016; Wilson et al., 2016). Below, we select notorious contributions that focus on how population density changes over time and refer the interested reader to a recent survey on this topic (Ghahramani et al., 2020) and references therein.
Ratti et al. (2006) used mobile phone data to understand urban systems, the authors extensively review location-based services and highlight their utility, going beyond urban planning ends. The authors used mobile phone records from Milan, Italy, as a case study to compare call activity across different areas throughout the day, providing spatial-aware visualizations to highlight the intensity of cell phone activity. Similarly, Shen and Ma (2008) created a visual analytics tool to explore spatiotemporal mobile phone data, further incorporating social data to create a heterogeneous network that can be visualized as a 2D graph for gathering insights. The authors assessed their tool with MIT Reality Mining data and concluded that it could aid researchers as an effective data exploration technique.
In a different direction, Sevtsuk and Ratti (2010) analyzed mobility patterns in the city of Rome using call-volume data from a mobile phone network as a population density estimator. The authors combine spectral processing of the time series data (for unraveling seasonalities) with regression modeling, confirming that the population distribution in Rome follows a significant hourly, daily, and weekly routine. Deville et al. (2014) mapped phone call-record data from Portugal and France onto spatiotemporal data structures for population density estimation purposes, using census-derived population density as ground truth. Their results show that aggregated phone call activity from cell towers is a valid proxy to estimate citizen density and can further complement census data with finer spatial and temporal resolutions. Ghahramani et al. (2018) presented a spatial data analysis on CDR data from the city of Macau, performing correlation analyses to unveil the dynamics of the city. Their approach consists of measuring Moran’s indexes to study the correlations between areas and identify areas with a high probability of cluster formation (hotspots) using kernel density estimation (KDE) to identify areas with an increased call frequency.
In this work, we consider mobile phone data a proxy to estimate population density dynamics (Deville et al., 2014; Ricciato et al. 2020). Kernel density estimation (KDE) is a frequent option to model spatial population density at regular time intervals from GPS data crowdsourced from mobile devices (Ghahramani et al., 2018; Shi et al., 2020; Zhang et al. 2020; Kato, 2021; Wei et al., 2023). Recently, Zong et al. (2023) proposed a Federated KDE framework, able to keep location data on the devices and further leverage a random feature representation of the KDE solution (user’s information is irreversibly projected onto a small number of spatially delocalized basis functions) to ensure privacy.
Additionally, Lu et al. (2021) used Kriging to model spatial population density maps from
Complementary research studies include the integration of different population density maps from other sources with varying levels of concordance (Fries et al., 2021) and the adjustment of population density estimates using remote sensing data (such as nighttime light index, surface temperature, and land use data) (Wang et al., 2018). To address the related problem of detecting urban hotspots sensitive to varying population density levels, Cesario et al. (2023) proposed a clustering methodology to detect multi-density hotspots, including areas with nested density levels.
Background
Mobile phone networks utilize cell towers to transmit and receive signals from mobile devices. These structures are equipped with antennas and other necessary equipment for the effective communication of signals. Figure 1 depicts the cell towers of Vodafone mobile operator in Lisbon city, and the city division in regions using different spatial resolutions. Cell towers and spatial resolutions obtained at Lisbon, 2021. (a) Cell towers, (b) Location cells, (c) Traffic Analysis Zones, (d) Townships.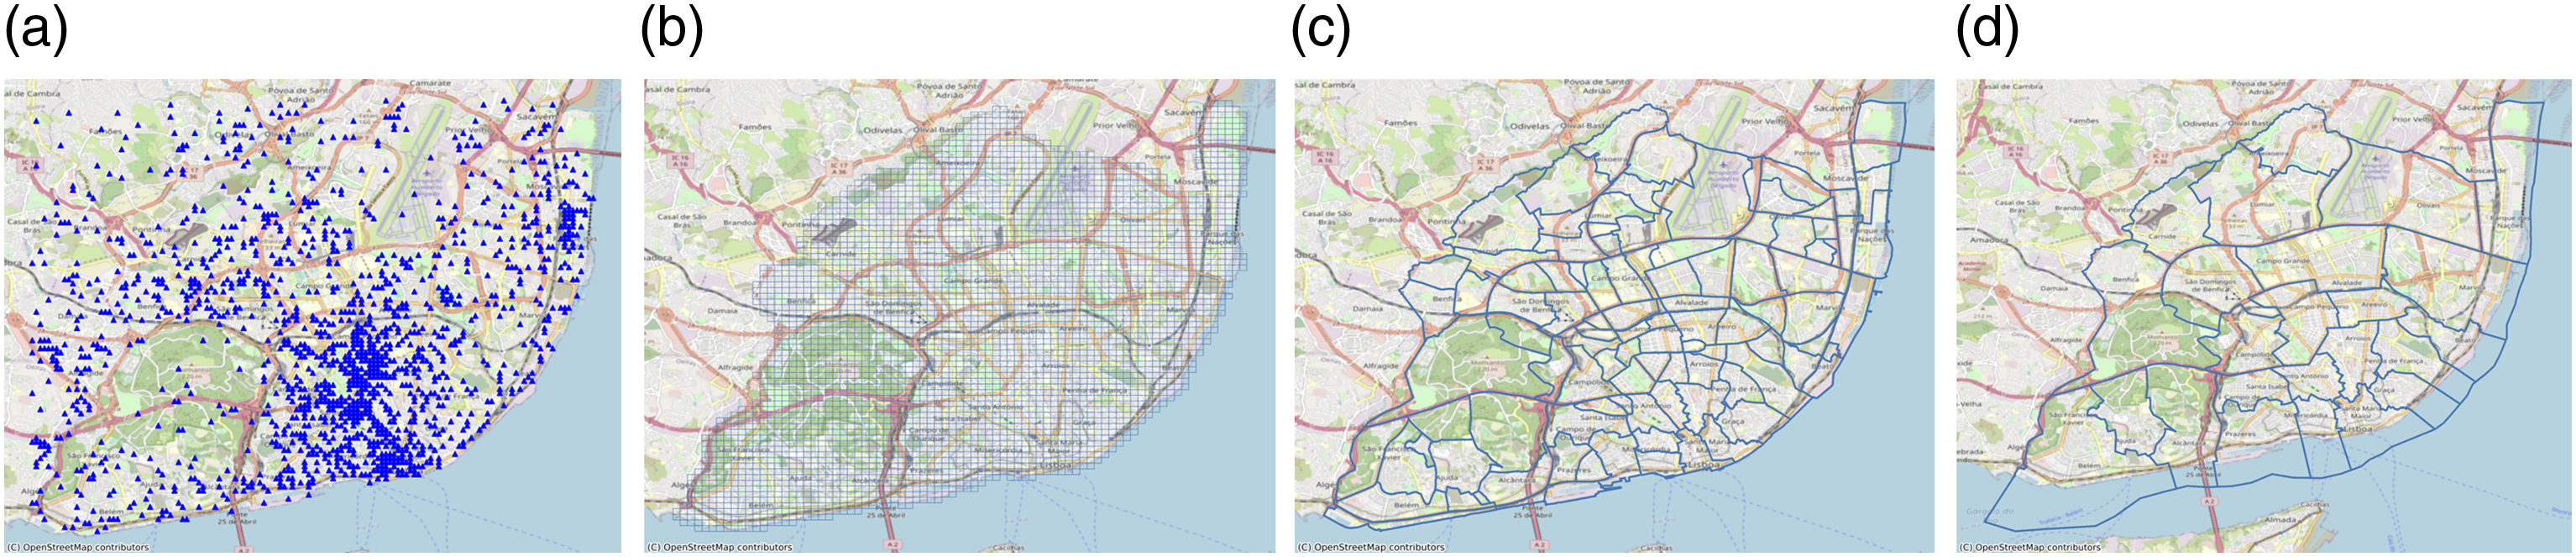
Mobile phone positioning refers to the ability to determine the location of a mobile device using information from the mobile phone network. This can be achieved through a variety of methods, such as using signals from cell towers to triangulate the position of the device (network-based positioning) or applications/sensors on a handset to log data (handset-based positioning) (Ghahramani et al., 2020). These methods, when used, generate spatiotemporal data composed of a massive volume of georeferenced timestamped records tracing the location of mobile phones over time.
Mobile phone data is often represented as raster data, which consists of measurements recorded at fixed locations in space and at fixed points in time (Atluri et al., 2018). Formally, these data can be described with a set of m fixed locations,
The set of observations at a spatial cell can be viewed as a time series Y, which can be multivariate when different types of measurements are being recorded. A time series is represented as a sequence of data points
Time series display different patterns: trend, seasonality, cycle, and irregular components. A trend shows a long-term change in the mean level (Wheelwright et al., 1998), while seasonality indicates periodic fluctuations that occur at regular intervals (Wheelwright et al., 1998). In contrast, cycle patterns occur when the data exhibit fluctuations at a non-fixed frequency (Beveridge and Nelson, 1981). Time series can be decomposed into these components using additive or multiplicative decomposition models (Brockwell and Davis, 2009). For instance, the additive decomposition,
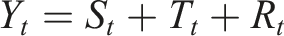
Models an observation Y t as the sum of trend T t , seasonal S t , and irregular/noise R t terms at time t. In this work, we use an additive decomposition model to decompose time series into trend, seasonal and residual components. The results of the method are obtained by first estimating the trend components by applying a centered moving average convolution filter (Proakis, 2007). This filter generates a continuous, slowly varying function that represents the general behavior of the time series. The trend is then removed from the original time series, and the average of the de-trended series for each seasonal period is returned as seasonal component. Finally, the residual component is calculated by subtracting the estimated seasonal and trend components. Figure S1 of the Supplementary Material provides an illustrative visualization of the application of this method to the targeted data.
Solution: Actionable spatiotemporal statistics of urban dynamics
Effective urban planning depends on a comprehensive understanding of the dynamic patterns of human density and mobility within the city. This understanding encompasses various critical aspects, including factors that challenge predictability (i.e., deviations from expected norms), the emergence of new trends, and fluctuations in citizen density over different time scales, whether daily, weekly, or annually. For instance, pinpointing urban zones and timeframes with high unpredictability, such as unexpected surges in traffic, provides an opportunity to investigate the root causes behind such phenomena. With this knowledge, urban planners can strategically adapt urban infrastructure and mobility initiatives, enhancing safety, optimizing traffic, and efficiently managing parking facilities. Recognizing emerging trends in population distribution is pivotal for informed decision-making regarding urban development, transportation planning, and the allocation of public services in areas experiencing substantial growth. Furthermore, a comprehensive grasp of how population density varies with changing seasons can provide valuable insights for urban planners, facilitating synergy with other sectors and guiding event planning, resource management, and optimizing urban services.
The proposed methodology aims to extract this knowledge from large-scale mobile phone data using key statistical measures from time series data. Despite the well-established role of decomposition techniques, to our knowledge, their use to explore massive mobile phone data with rich spatial content in urban domains remains unexplored. This section proposes a methodology for extracting actionable statistics from decomposed mobile phone time series data for knowledge acquisition or urban dynamics. The solution is presented in two parts. The first part describes the target population density statistics and the computational complexity associated with their calculus. The second part, described in Supplementary Material, presents an open-access graphical tool that deploys the proposed methodology user-friendly and intuitively, allowing for easy visualization and navigation of the extracted knowledge. The approach provides scalability advantages, enabling the handling of large datasets and real-time processing capabilities, ensuring timely analysis. It also offers usability, making the acquired knowledge easily accessible and interpretable. Furthermore, the approach incorporates statistics of actionability to prioritize and highlight the most relevant information, enhancing its practical value.
Methodology
Consider a mobile phone time series Y, where each data point measures the number of terminals in a particular location s at a specific time t and its decomposition into trend, seasonality, and residual factors. The residual component highlights time points where the population density is not explained by trend and seasonal factors, generally denoting unexpected or unpredictable changes in citizen density. Complementarily, the trend component can reveal areas of a city where the number of terminals is increasing or decreasing, which may indicate areas of growth or decline. Finally, the seasonal factors can reveal alternating densities at certain times of the day/week/month/year.
The proposed methodology consists of exploring the content of these components (e.g., indices with statistical properties of interest) at varying spatial granularity from large-scale mobile phone data to identify actionable patterns of citizen density in urban centers. The quantification of pattern importance is essential to pinpoint phenomena that may require attention at specific locations in the city and times within the week. To quantify importance, we compute trend strength, seasonal strength, residual strength, as well as complementary fitting scores.
The trend strength measures the degree to which the data points in the series exhibit a consistent upward or downward movement over time,
Considering the introduced indices, we propose the unified score, denoted as Score
unified
, to compare and evaluate trends extracted from the data at different locations and spatiotemporal granularity. This score takes into account both the strength and linearity of the trend components, as well as the overall estimated rate of change in population density, Linear trend, seasonal and residual components of daily population density series in Lisbon regions. (a) Linear trend estimated in Olivais, Lisbon 2021, (b) Seasonal component in Lumiar, Lisbon 2021, (c) Residual component in São Domingos de Benfica, Lisbon 2021.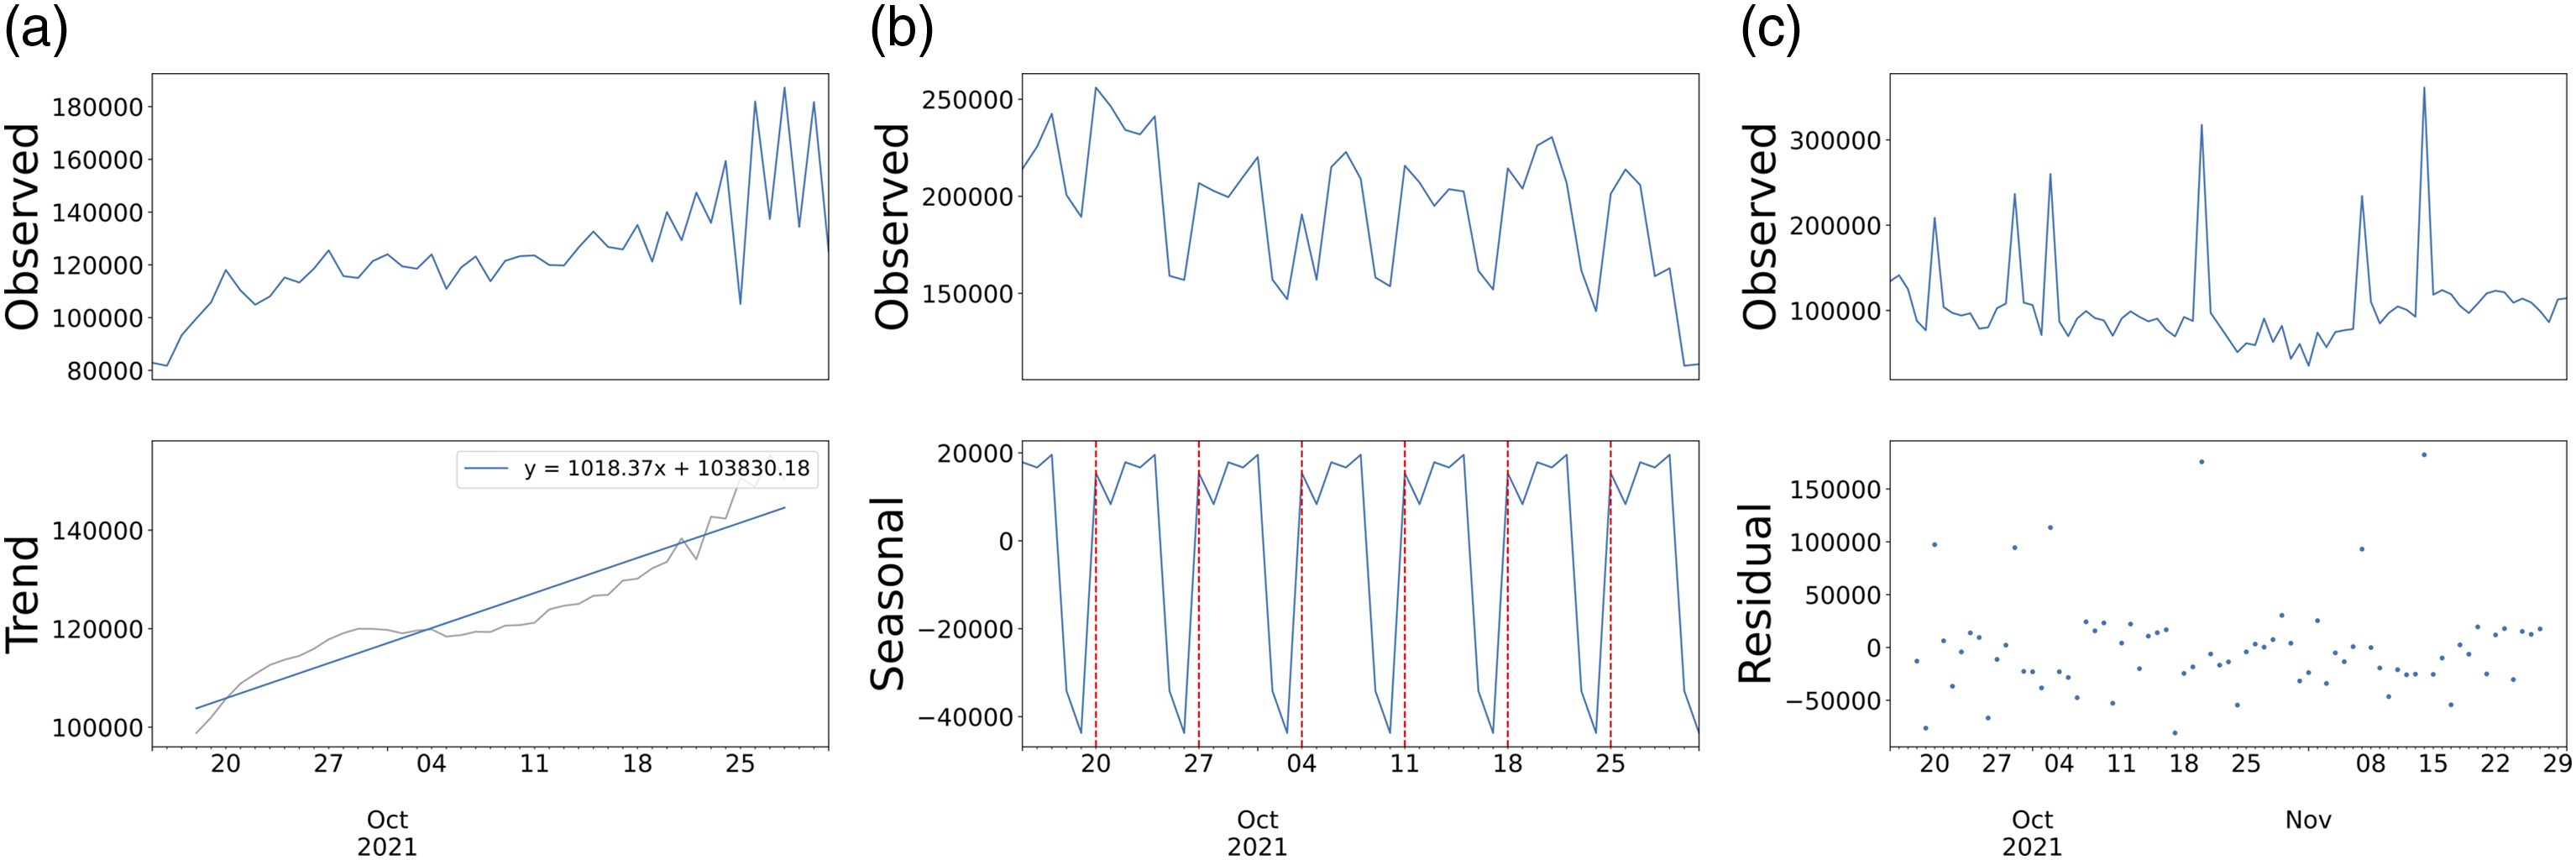

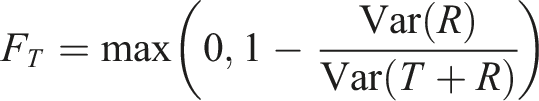
Seasonal strength can be calculated in a similar way,
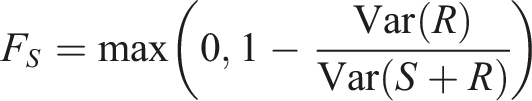
The fraction of the variance of the residuals R relative to the total variance of the detrended time series S + R. For strongly seasonal data, the variance of the detrended series should be significantly larger than the variance of the residual component. Seasonal strength measures the degree to which the data points in the time series exhibit a consistent pattern over time. The higher the F S value, the stronger the seasonal pattern in the data. This metric can be used to identify patterns of population density that are associated with seasonality, such as higher density during specific time intervals within a day/week/month/year. This information can be used to inform decisions related to urban planning, such as managing resources and urban services to accommodate the changing population density. Figure 2(b) shows a location in Lisbon (Lumiar) that presents a strong weekday/weekend seasonality.
Finally, the residual strength measures the degree to which the data points in the series are not explained by trend and seasonal factors,
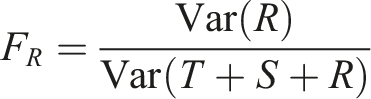
Given the introduced metrics, we can analyze and compare the strength of each component at different locations and time periods, providing a systematic and actionable approach to understanding patterns of human density in the city. By sorting locations (e.g., raster cells, neighborhoods, and parishes) by the aforementioned statistics, we can prioritize notable emerging trends, seasonal variations, and irregular density changes, which in turn can guide urban planning decisions, such as those pertaining to public resource allocation and city services management.
Computational complexity
From a computational standpoint, the proposed method is efficient since the underlying time series decomposition and subsequent scoring are accomplished in linear time and memory. In addition, the scoring can be straightforwardly parallelized per location and time period. Final sorting is subquadratic in time yet can be replaced by a linear time selection of indices above parameterizable actionability thresholds. This allows for quick and efficient processing of massive amounts of mobile phone data, making it a suitable method for analyzing patterns of human density in the city on a large scale.
Case study: Lisbon city
This section presents the results of experimentally assessing the role of the proposed methodology in guiding the analysis of spatiotemporal urban dynamics, using as a case study mobile phone network data from Lisbon, Portugal. In particular, the following research questions are tackled:
• •
A summary of the major findings and implications to the city of Lisbon is provided in the Case Study Insights section in Supplementary Material.
Dataset
To explore the target research questions, we select big urban data with the density of individuals in Lisbon city, Portugal. Data are provided by one of the largest mobile phone operators in Portugal (Vodafone) and processed according to a three-phase methodology: (1) fine-grained spatial grid applied over Lisbon to create location cells with unique identifiers for spatial indexing purposes; (2) triangulation technique based on the cell towers applied to estimate the number of Vodafone terminals in each location cell; and (3) extrapolation method considering the market shares of each operator used to estimate the total number of people in each cell.
The dataset consists of hourly time series data from September 15 to November 30 of 2021 (∼20,500 h) with the estimated number of terminals within each of Lisbon’s 3743 location cells. Some location cells, located at the north of the city, only contain data until October 31.
The dataset also includes the number of terminals entering or leaving the cell in each timestamp. Due to privacy concerns, only the total number of terminals is made available, thus making the inference of end-to-end user trajectories impossible.
Before proceeding with the target spatiotemporal time series data analysis, essential preprocessing steps were performed, including the treatment of missing values using a seasonally decomposed missing value imputation method (Cleveland et al., 1990) and the aggregation of data at various time and spatial resolutions, including hourly, daily, weekly, and monthly time resolutions and cell, traffic analysis zone (TAZ), and township space resolutions. The city was divided into 103 TAZs and 24 townships for this purpose (Figure 1).
Subsequent analyses focus on TAZ and Township spatial resolutions as they provide higher usability for describing urban dynamics. However, it is essential to note that some cells in the dataset only contain observations until October 31, which means that certain TAZ and Township aggregations were only evaluated until that timepoint. This was carried out to avoid biased results due to missing data. In addition to the aforementioned considerations, there are potential biases and limitations within the dataset. These include sampling bias due to data collection by Vodafone, which represents only a subset (28.6%) of the mobile network users in Portugal 1 . Another limitation arises from the limited timeframe of the data, which might not be sufficient to accurately capture seasonal variations and long-term trends. Lastly, it is important to note that during the aggregation process, each cell is considered to correspond only to the TAZ or township with the highest intersection area. This approach was adopted to ensure that the data is assigned to the most relevant spatial unit when overlapping occurs. However, it is essential to recognize that this method introduces a potential bias, as it may overlook the contributions of other intersecting TAZs or townships, leading to a partial representation of the data in the aggregated spatial resolutions.
Experimental setting
Seasonal decomposition (Seabold and Perktold, 2010), a method for decomposing a time series into its components assuming an additive model, was selected (refer to Background section for details of the method). To help answer the research questions, we developed a web application that implements the proposed methodology, available at https://github.com/MiguelGarcaoSilva/cml_synthetic_demo.
Throughout this section, we use F T , F S , and F R to refer to the metrics introduced in the Methodology section for estimating the strength of the trend, seasonal, and residual components, respectively. Additionally, we use Slope, R2, and Score unified to denote the slope, the coefficient of determination, and the unified score to better frame the strength of the estimated trends.
Limits of predictability (RQ1)
We conducted an analysis of the residual component of the time series decomposition in order to identify locations in the city where the predictability of population density is most challenging. Due to the large-scale nature of the data, a visual analysis of the time series for the daily average number of terminals in each TAZ and Township in Lisbon is not practicable. Thus, we performed time series decomposition to each time series on both TAZ and Township resolutions. Then, using the proposed methods, we used the residual component to identify locations in the city that tend to have significant deviations not explained by trend and seasonal factors.
Traffic analysis zones
In accordance with Table S3, the Traffic Analysis Zones where human density is harder to predict are Location of the TAZs and Townships with the highest and lowest F
R
scores, together with a zoom-in on the residual component of selected regions under the additive mobile phone time series decomposition. (a) TAZ resolution. Focus on São Domingos de Benfica (Estrada Luz | Oeste) and Penha de França (São João), (b) Township resolution. Focus on Olivais and Beato.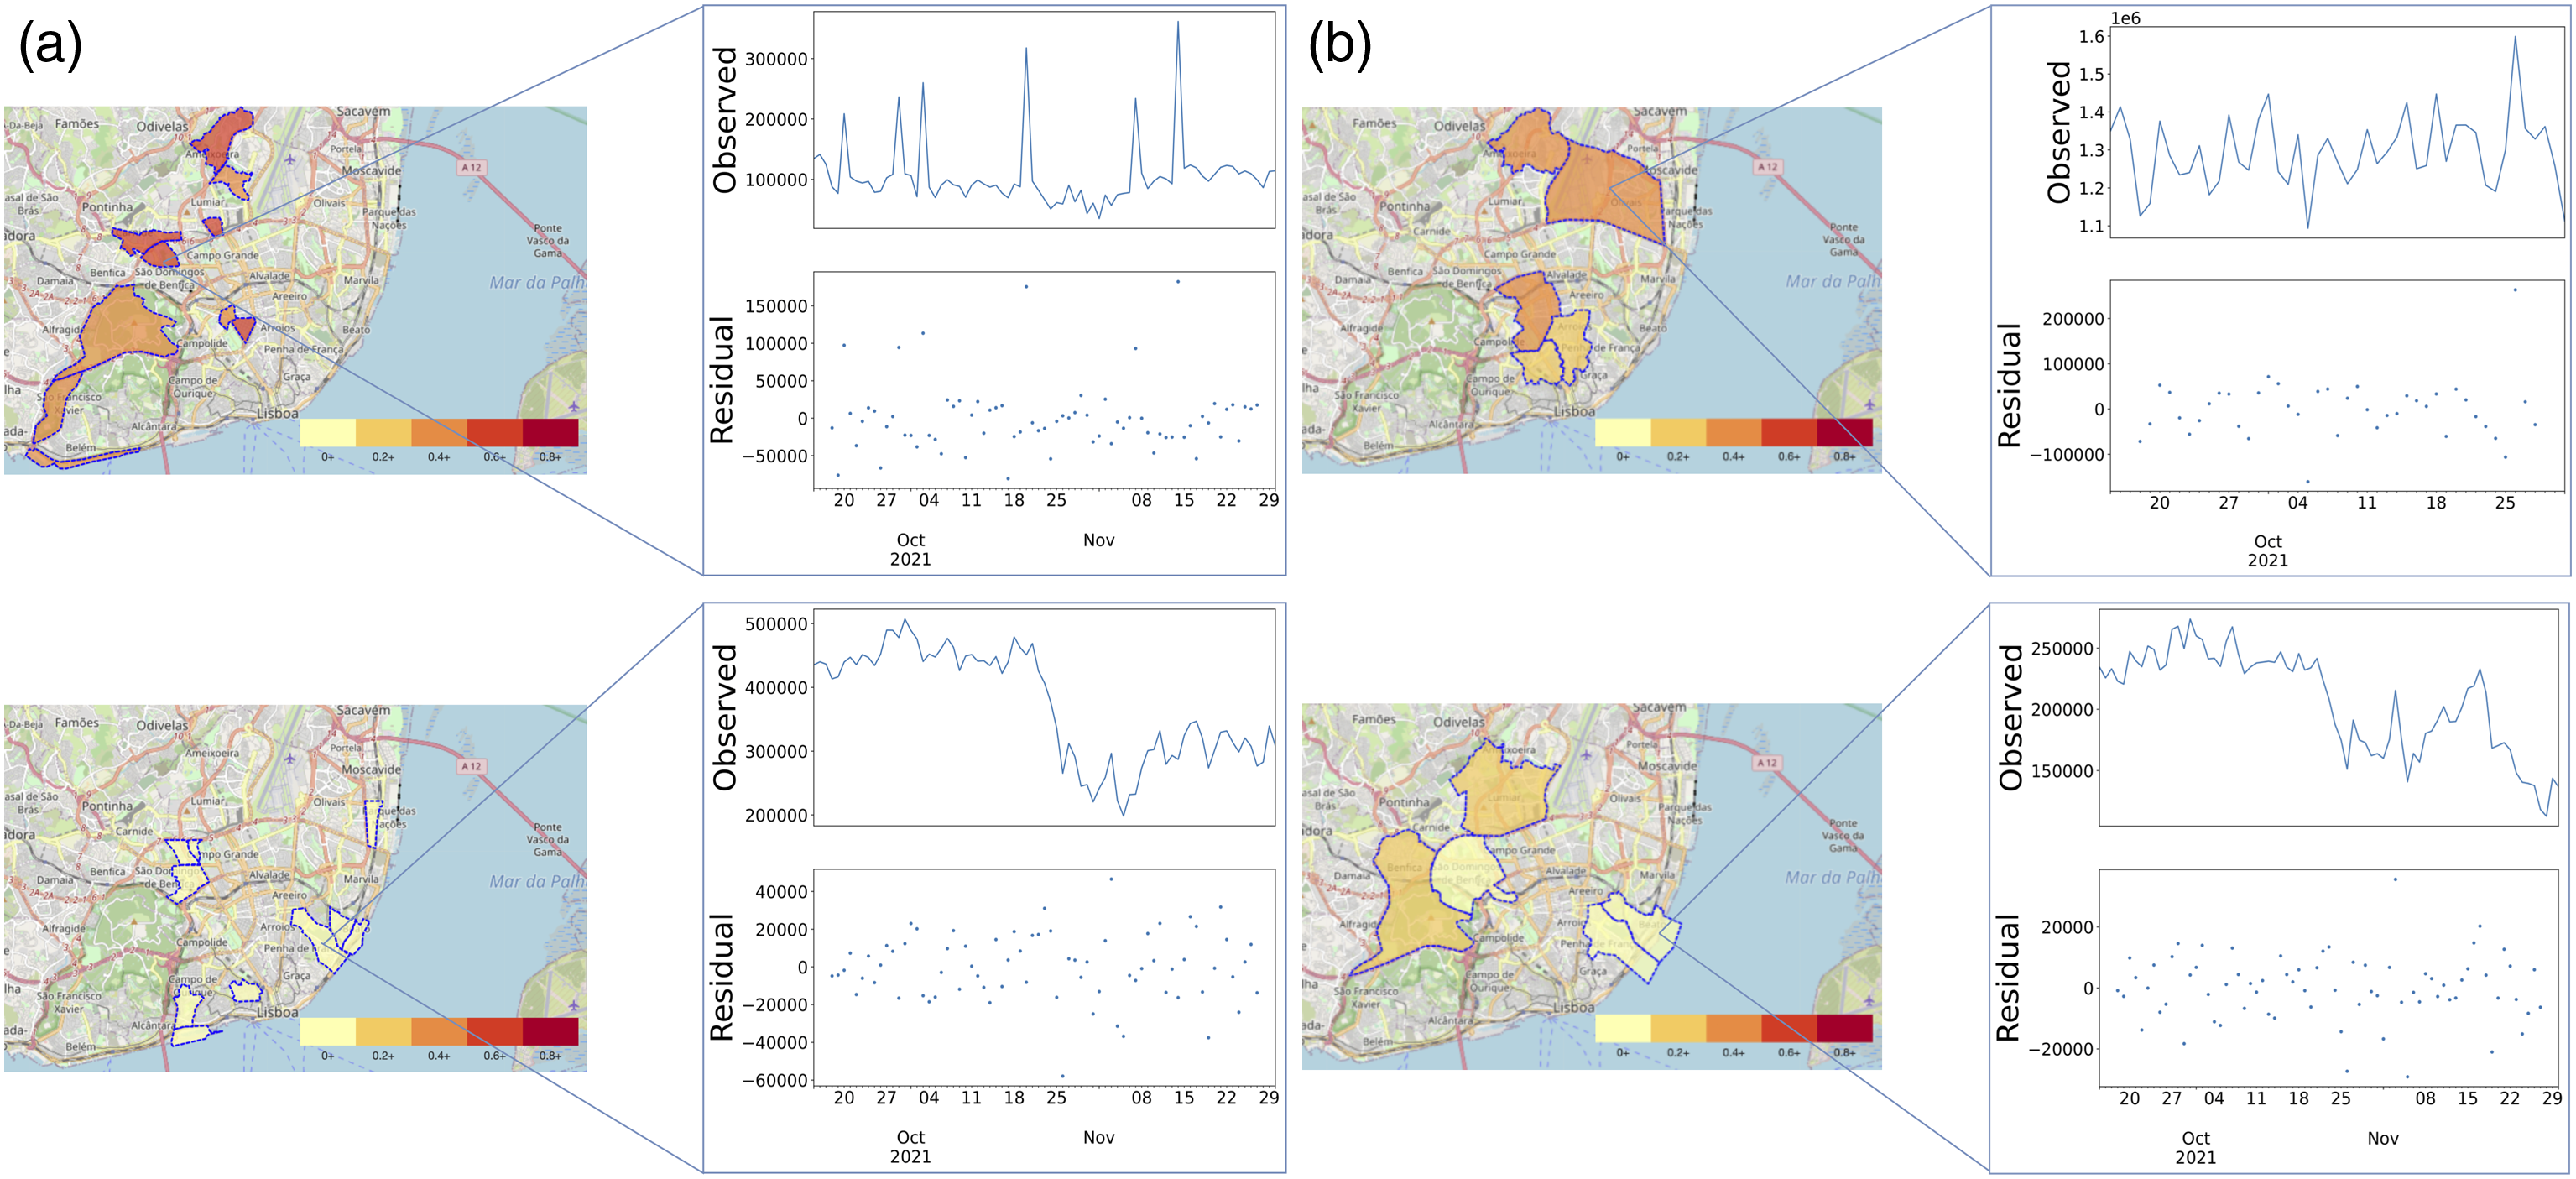
By visually examining the decomposition of the daily time series for
Townships
Table S4, presents the results obtained after performing the decompositions for the time series with township resolutions.
Emerging trends (RQ2)
To identify emerging trends in the spatial distribution of citizens throughout the city along a given time period, we integratively analyzed the trend strength, rate of change (ROC), and determination coefficient (R2) to assess both the intensity and stability of emerging trends.
Traffic analysis zones
Table S5 shows that TAZs Location of the TAZs and Townships with the highest unified scores for upward and downward trends, and the observed data, trend and residual component under the additive mobile phone time series decomposition. (a) TAZ resolution. Focus on Santa Maria Maior (Baixa) and Estrela (Ribeirinha | Belém). (b) Township resolution. Focus on Misericórdia and Beato.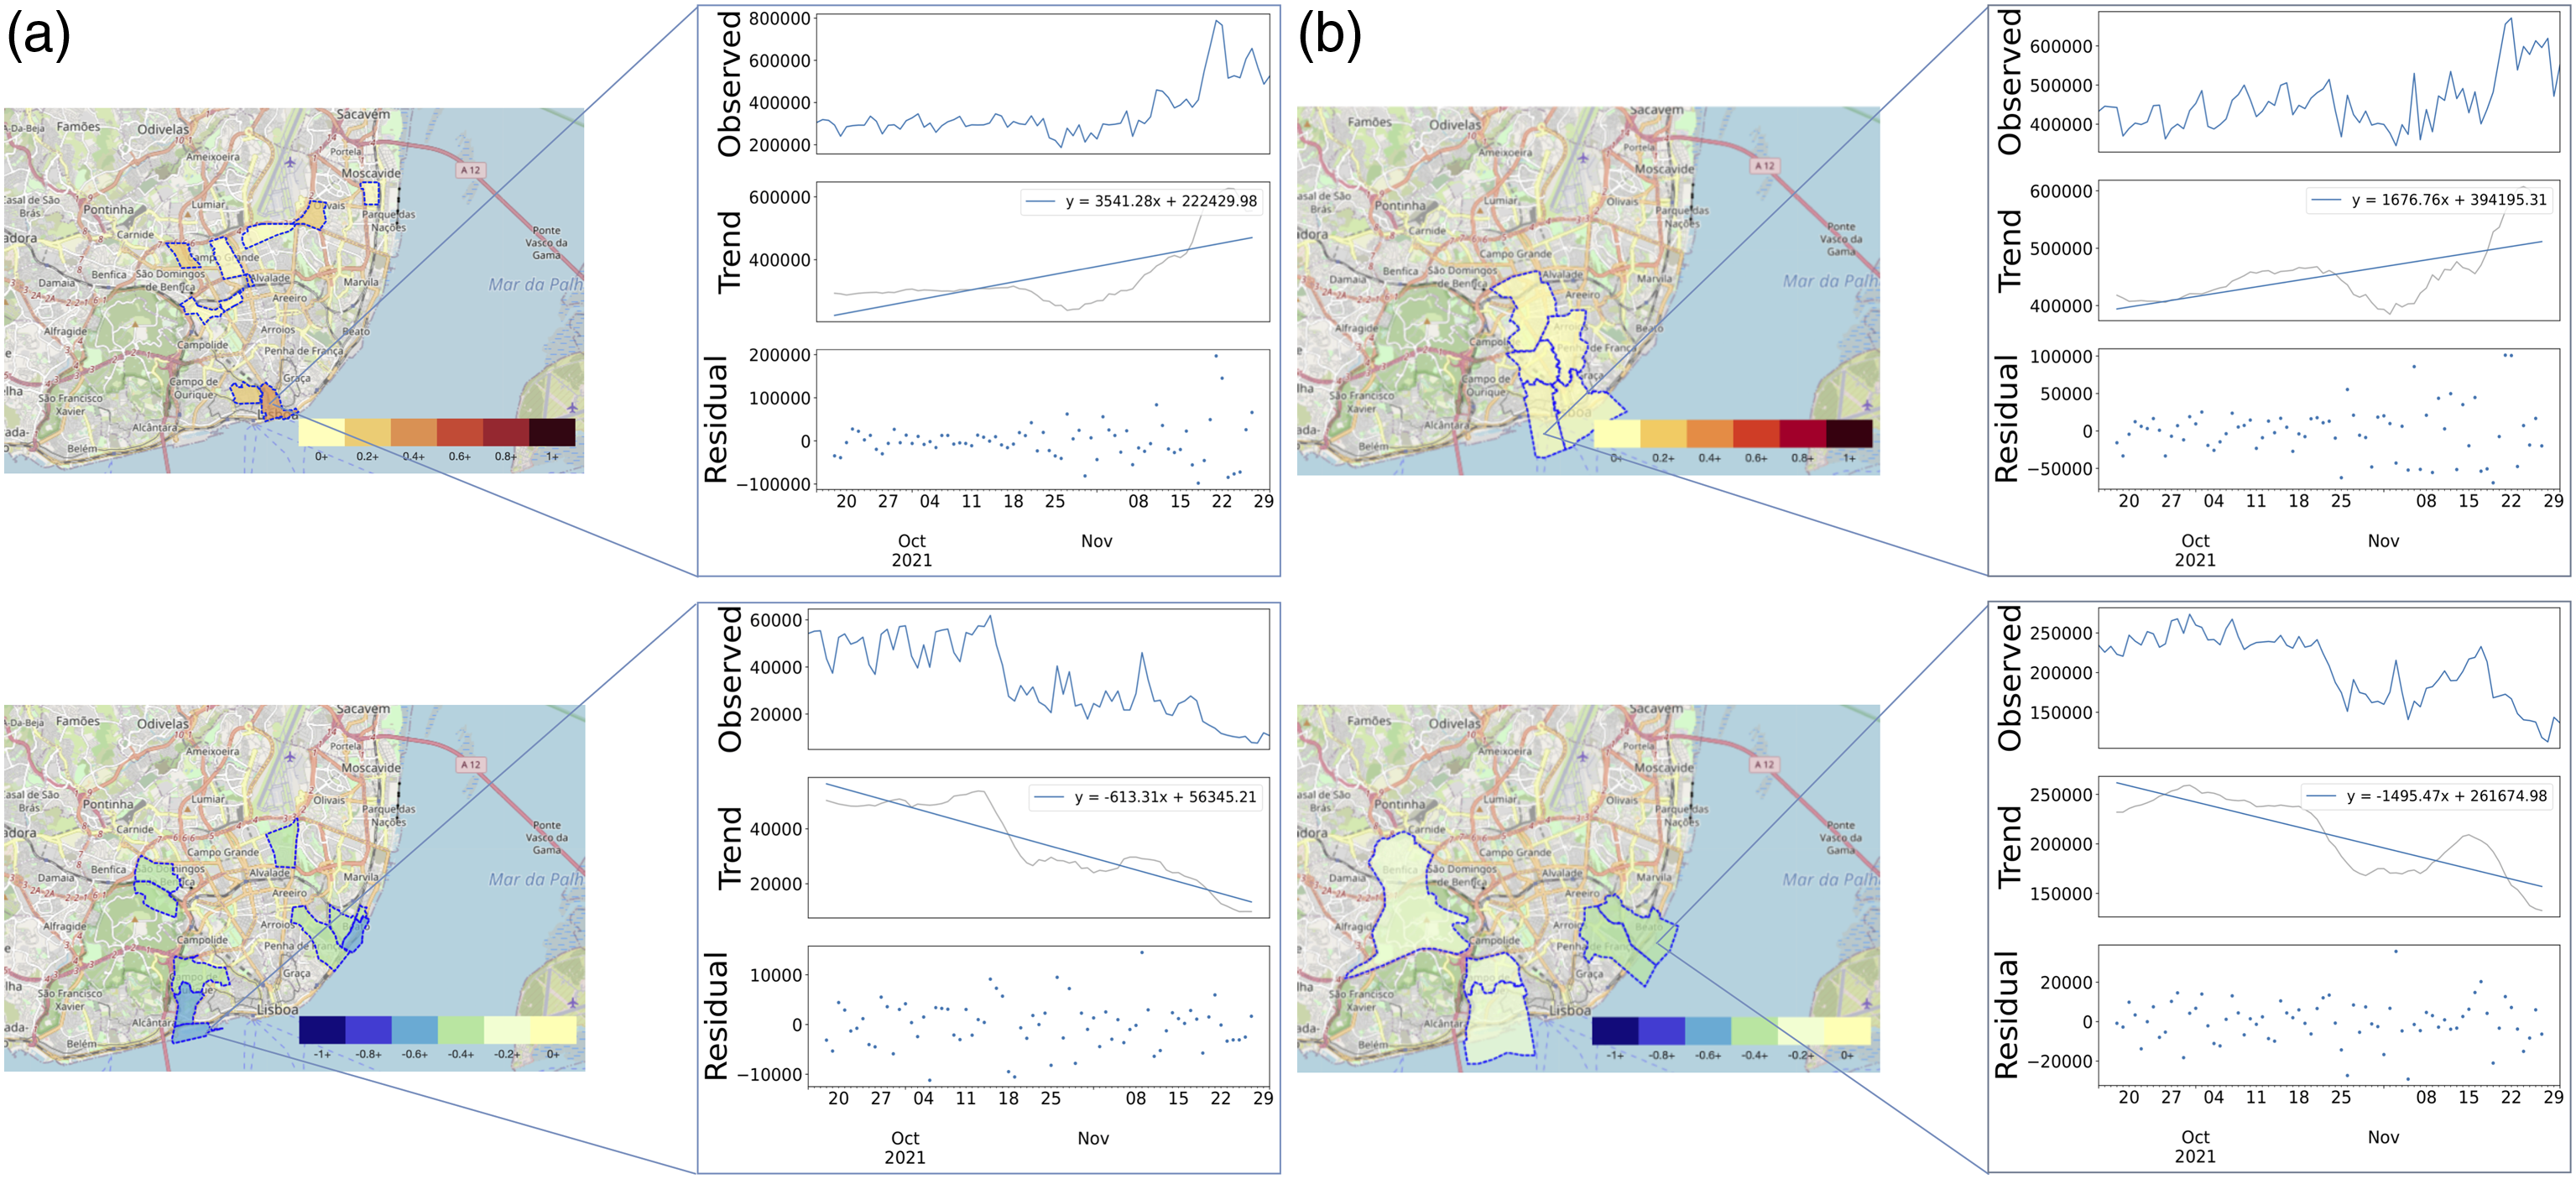
We focused the analysis on
Townships
Using the same principles for the Township resolution data, townships
We examined the individual time series for the townships of
Seasonality patterns (RQ3)
The analysis of seasonal patterns at different time granularities can be used to explain predictable variations in population density. We primarily focused on a 7 day period, paying closer attention to weekly patterns of population density. Daily and yearly patterns are of complementary importance under the proposed framework.
Traffic analysis zones
Table S11 shows that the TAZs with the strongest weekly seasonal patterns are
Figure 5(a) shows that the top five TAZs with the strongest weekly seasonal patterns are located near the main access points to the city. For example, Location of the TAZs and Townships with the highest and lowest F
S
scores, together with a zoom-in on the seasonal-residual components of selected regions under the additive mobile phone time series decomposition. (a) TAZ resolution. Focus on Parque das Nações (Estação Oriente) and Carnide (Avenidas Novas). (b) Township resolution. Focus on Campolide and Santa Maria Maior.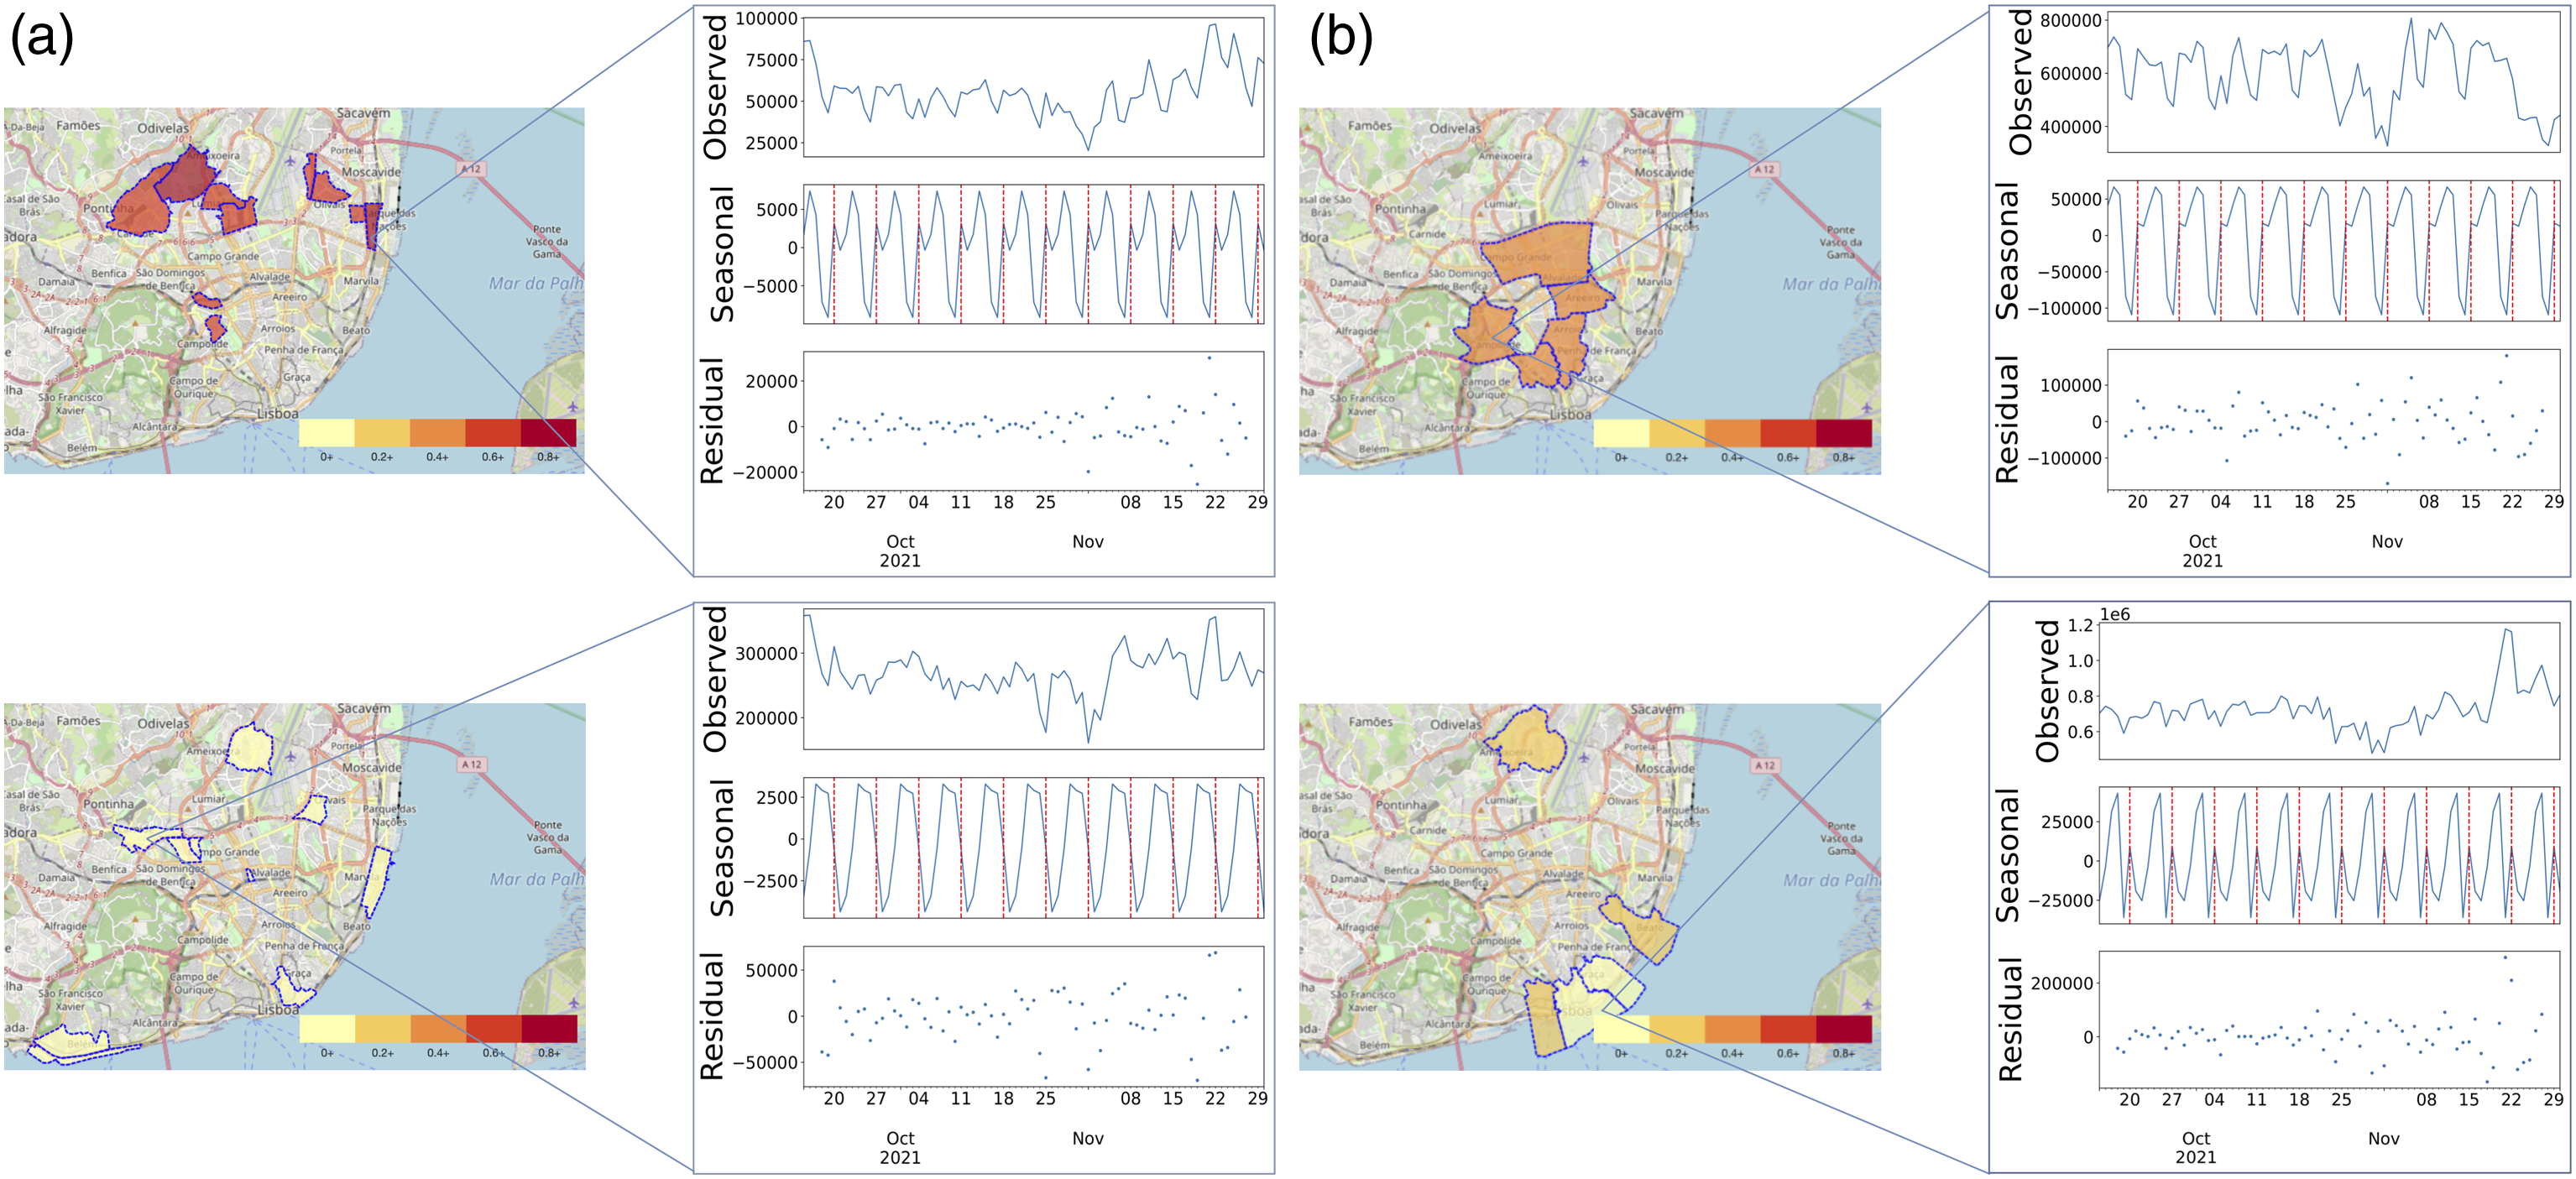
Townships
Regarding township resolution, Table S12 shows that
Focusing on the
Conclusions
This study introduces a novel methodology for acquiring actionable knowledge from population density data for urban planning decisions. The approach offers scalability, real-time processing capabilities, usability, and prioritization of information. By utilizing predefined multi-scale spatiotemporal (ST) footprints that can be easily parameterized, our approach allows for a deeper understanding of population density dynamics in the urban context. Time series decomposition, followed by the extraction and ranking of actionable statistics, is proposed to uncover factors influencing predictability, emerging trends, and seasonal variations under a linear time computational complexity. Furthermore, an open-access tool deploying the proposed methodology is made available.
A comprehensive spatiotemporal analysis of a real-world mobile phone network case study in Lisbon, Portugal, is undertaken for the first time, validating the practical applicability of the proposed approach for modeling urban population density dynamics. In particular, we identified regions of notable interest, including locations with harder predictability of citizen density due to unexpected deviations in population density caused by public events, locations with weak seasonal patterns near healthcare and sports poles, and locations with a growing population in the vicinity of touristic areas and office hubs. Furthermore, experimental results from mobile phone data acquired for 3743 cells confirmed the scalability of the proposed approach and further emphasized the tangible benefits of extracting actionable insights from massive mobile phone data.
As a direction for future work, it would be valuable to explore the incorporation of data sources providing situational context, such as weather conditions, transportation networks, emergency records, and social events (Cerqueira et al., 2021). Integrating such data sources could allow the extraction of context-aware patterns that could lead to more accurate and comprehensive urban planning strategies.
Supplemental Material
Supplemental Material - Actionable descriptors of spatiotemporal urban dynamics from large-scale mobile data: A case study in Lisbon city
Supplemental Material for Actionable descriptors of spatiotemporal urban dynamics from large-scale mobile data: A case study in Lisbon city by Miguel G Silva, Sara C Madeira and Rui Henriques in Environment and Planning B: Urban Analytics and City Science
Footnotes
Acknowledgments
The authors thank Câmara Municipal de Lisboa and the Vodafone network operator for the data provision and support.
Declaration of conflicting interests
The author(s) declared no potential conflicts of interest with respect to the research, authorship, and/or publication of this article.
Funding
The author(s) disclosed receipt of the following financial support for the research, authorship, and/or publication of this article: This work was supported by Fundação para a Ciência e Tecnologia (FCT) under the grant UIBD/153086/2022 to Miguel G. Silva, INESC-ID Pluriannual (UIDB/50021/2020), and LASIGE Strategic Project (UIDB/00408/2020 and UIDP/00408/2020).
Data availability statement
Supplemental Material
Supplemental material for this article is available online.
Note
References
Supplementary Material
Please find the following supplemental material available below.
For Open Access articles published under a Creative Commons License, all supplemental material carries the same license as the article it is associated with.
For non-Open Access articles published, all supplemental material carries a non-exclusive license, and permission requests for re-use of supplemental material or any part of supplemental material shall be sent directly to the copyright owner as specified in the copyright notice associated with the article.