
Abstract
Globally, dramatic changes in park visitation have accompanied the COVID-19 pandemic. In general, cities have experienced an overall increase in park visitation after strict lockdowns imposed in the pandemic’s first wave have been removed. However, previous research conducted in Hungary has demonstrated that park visitation varied across parks with different sizes and locations in the city. We hypothesized that the degree of the park’s integration into the urban fabric significantly affected changes in visitation. To test this hypothesis, we conducted a space syntax analysis. Findings show that community parks with an area of 10.01–50.00 hectares and a mean spatial integration of 83.37 experienced the highest increase in the number of visitors (based on mobile devices’ GNSS data). Surprisingly, large metropolitan parks providing highly complex ecosystem services lost many visitors during the pandemic, which might be due to their low spatial integration.
Many studies have demonstrated that urban parks experienced an overall increase in visitation during the COVID-19 pandemic, except for the first few months when many were shut down (Rice and Pan, 2021; Venter et al., 2021). In previous research conducted in Hungary, we used a dataset of 28 million GNSS location data points from approximately 666,000 distinct mobile devices collected between June 1, 2019, and May 31, 2021, in 1884 parks in the country, to discover how park visitation changed in the inter-wave period of 2020, compared to the pre-pandemic period of 2019, and in Waves 2–3 of 2021, compared to Wave 1 of 2020 (Csomós et al., 2023). We demonstrated that park visitation slightly increased in the pandemic summer and fall of 2020, compared to the same period of the previous year, whereas it significantly decreased in Waves 2–3, compared to Wave 1.
Furthermore, we also found that park visitation varied across different park categories (see the full dataset in Csomós et al., 2023). For example, in Budapest, Hungary’s capital, both the number of devices and location data points generated by those devices dropped significantly in large metropolitan parks in each subsequent period (devices: −40.00% and −63.27%; GNSS location data points: −24.49% and −61.76%). In contrast, community parks experienced the highest increase in the number of devices and location data points in the inter-wave period of 2020, compared to the pre-pandemic period of 2019, while the number of devices and location data points hardly declined in Waves 2–3, compared to Wave 1 (devices: +19.48% and −5.56%; GNSS location data points: +65.38 and −5.98%).
We hypothesized that two factors significantly impacted why community parks performed very well during the COVID-19 pandemic: 1) Pocket parks, block parks, and neighborhood parks are relatively small, hindering people from maintaining social distancing; 2) metropolitan parks with massive sizes often lie in either relatively peripheral or isolated geographical positions in the city; therefore, they have a low spatial integration into the urban fabric (which is an important factor when public transportation is shut down and parks can only be reached on foot).
In this study, we wanted to test the second part of the hypothesis by conducting a space syntax analysis (Rashid, 2019). First, we derived data on urban green spaces from the Urban Atlas 2018 provided by Copernicus Land Monitoring Service. Mobile device location data were purchased from UberMedia Inc. The road network data came from the Open Street Map database and was edited and analyzed in QGIS using the Space Syntax Toolkit plug-in. After cleaning the data, a graph analysis was conducted with a 2000-meter radius to determine the integration value of road segments. To determine the mean spatial integration of the parks, we converted the line data into points in ArcGIS. Following this, we used the Natural Neighbor method to interpolate the data to all points of the space, which resulted in a 10-meter resolution raster. Finally, we calculated the mean spatial integration value (with no unit of measurement) for the area of the parks with the Zonal Statistics function.
Results show that metropolitan parks have a mean spatial integration of 72.37, while this value for community parks is 83.37 (Figure 1). It must be noted that other park categories have even higher mean spatial integrations (e.g., this value is 126.60 for pocket parks), but their small sizes and relatively limited ecosystem services seem to be shortcomings during pandemic periods. Overall, results support our hypothesis that community parks with 10.01–50.00 hectares are better integrated into the urban fabric than metropolitan parks. Spatial integration of urban parks in Budapest.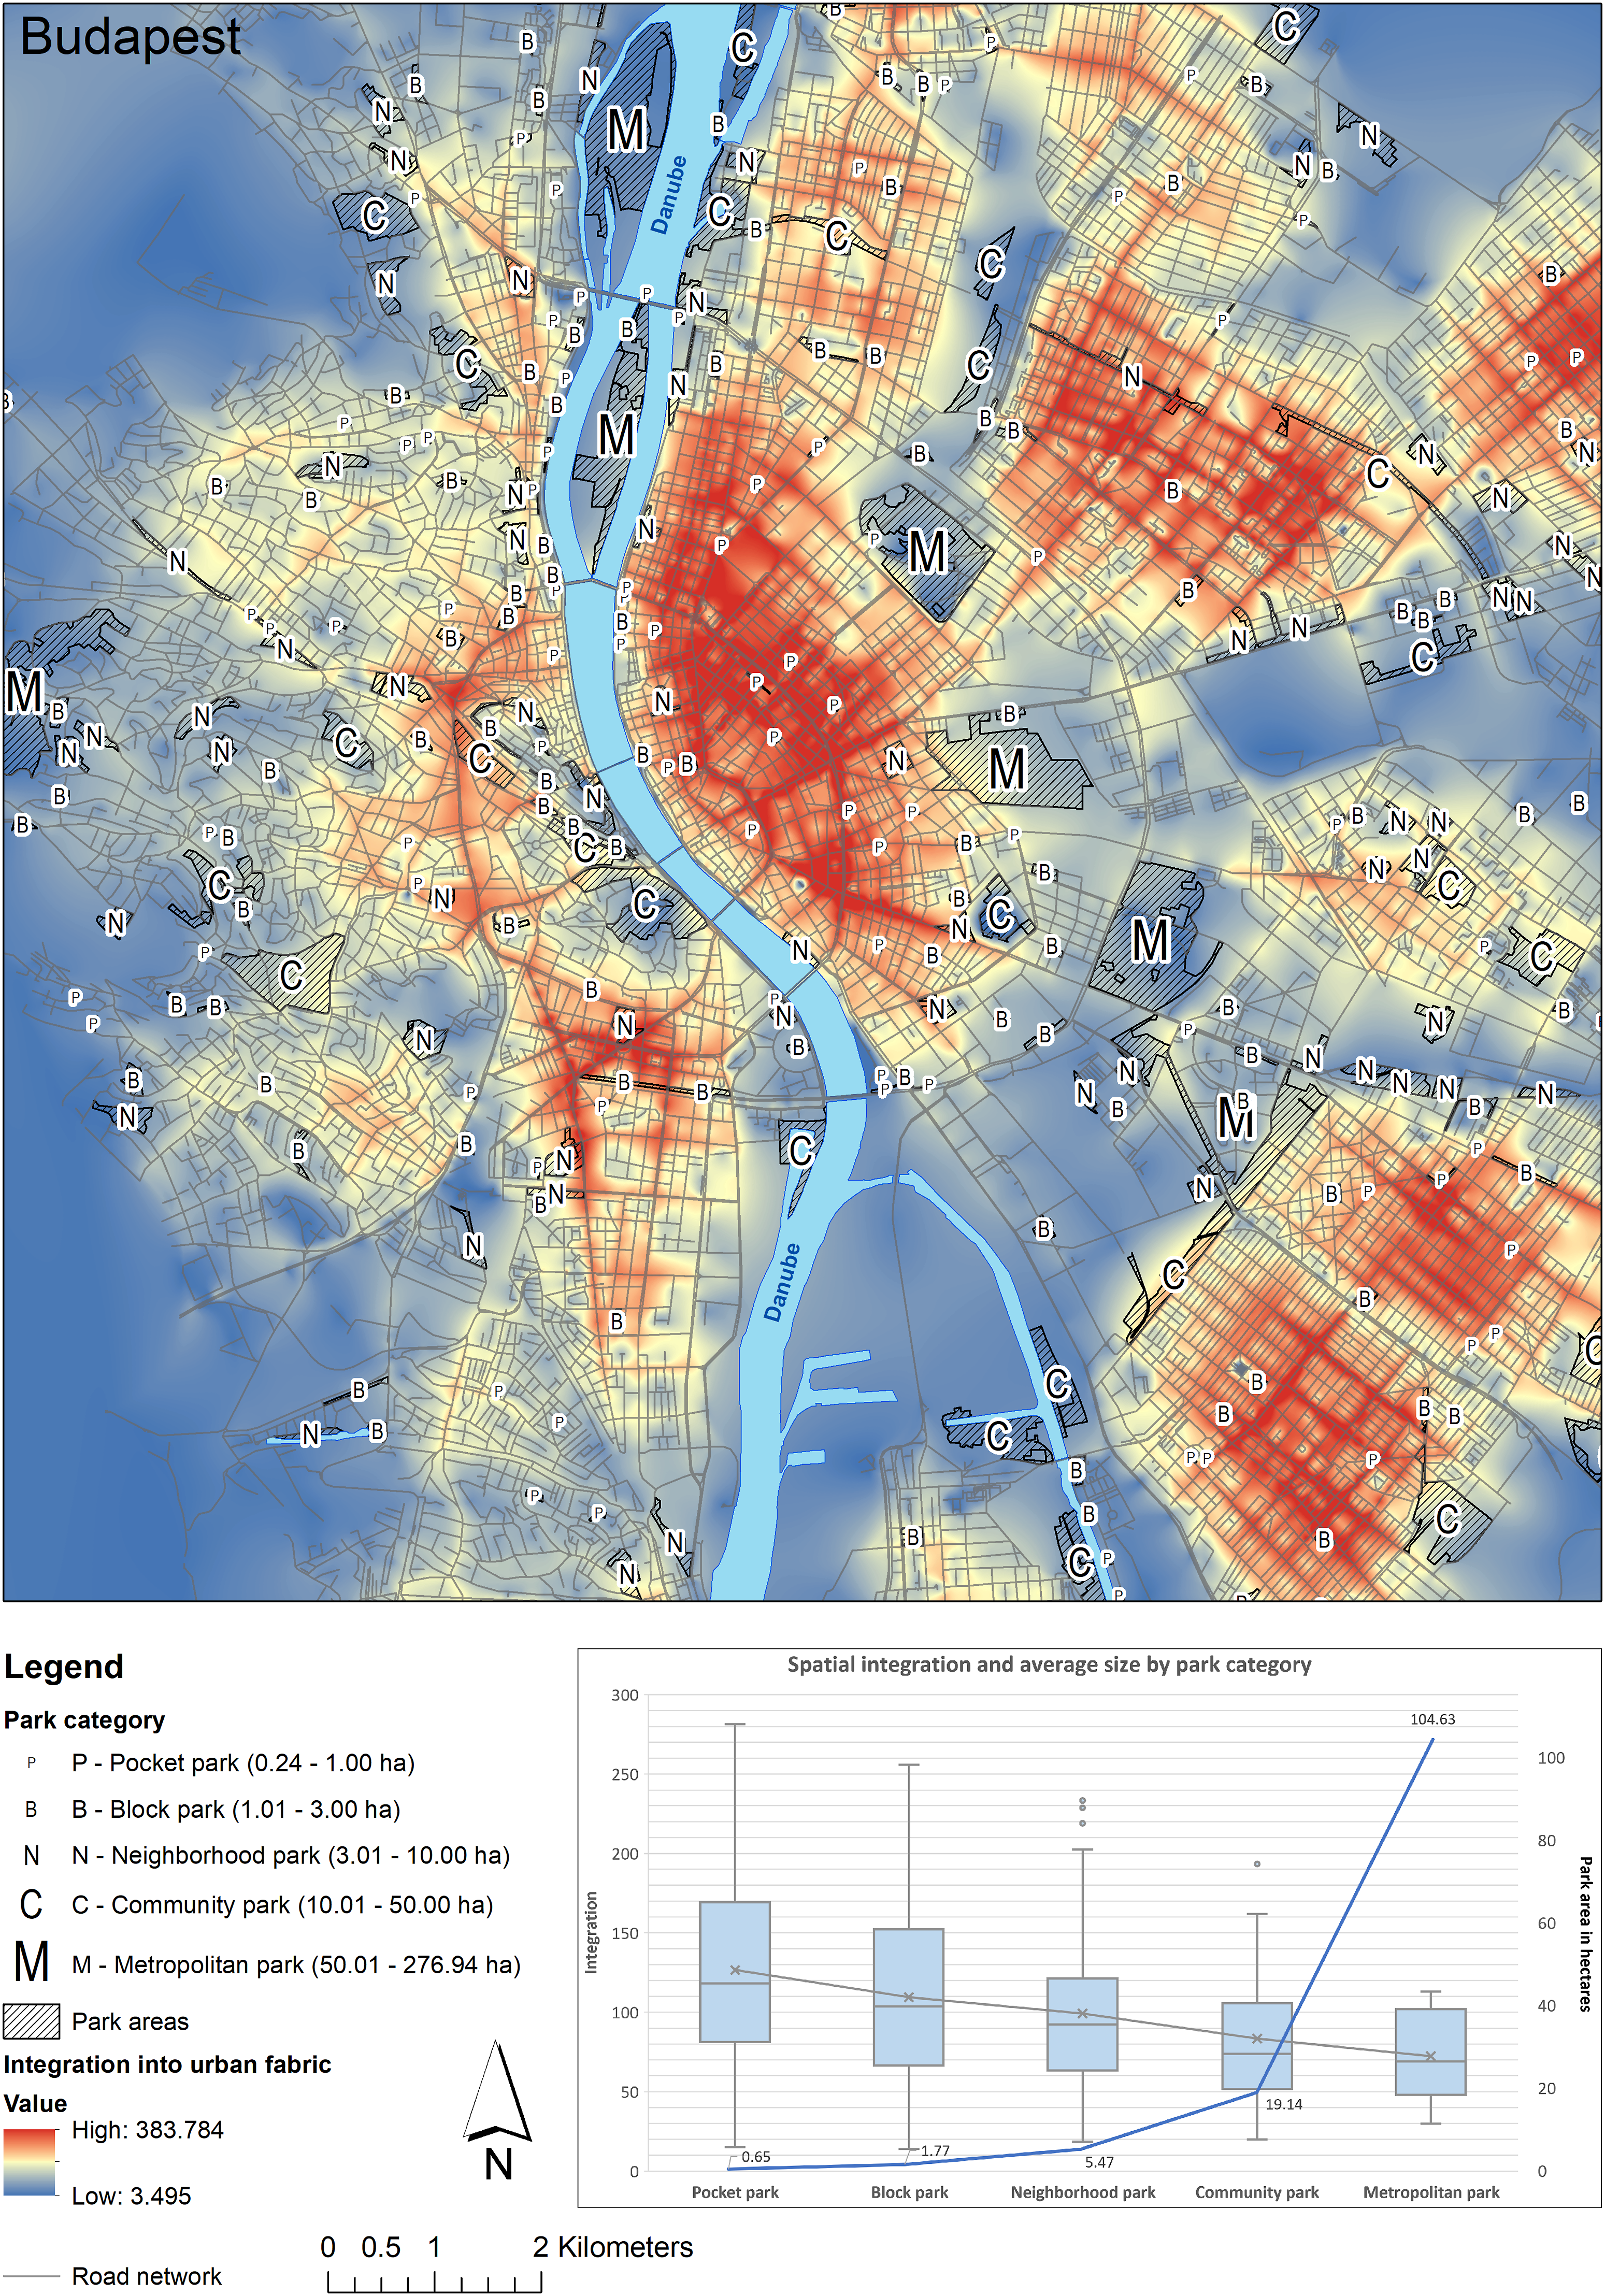
In conclusion, urban parks showing higher spatial integration and having relatively large sizes work effectively in pandemic periods, when such factors as spatial proximity and social distancing impact people’s decisions about which urban park should be visited.
Footnotes
Declaration of conflicting interests
The author(s) declared no potential conflicts of interest with respect to the research, authorship, and/or publication of this article.
Funding
The author(s) disclosed receipt of the following financial support for the research, authorship, and/or publication of this article: The research was supported by Hungarian Scientific Research Fund [grant number: K142121].