
Abstract
It is estimated that over half a million people visited one network of ‘warm rooms’ during the winter of 2022 in the UK, a figure that may rise to 2.5 million people if other networks are considered. As well as offering a means to try to limit exposure to cold temperatures and reduce household energy costs, these winter warm hubs also address wider concerns such as social isolation, loneliness and mental well-being as the cost-of-living bites. This graphic demonstrates how geospatial approaches can be used to explore access via public transport and walking to a network of warm spaces in the capital city of Cardiff, Wales. By accounting for site opening times in relation to existing bus timetables for those for whom walking may not be an option, we illustrate how such information can be included in three commonly applied access measures (floating catchment area, cumulative opportunity and shortest distance) to highlight potential spatio-temporal gaps in provision across the city.
Main text
Substantial rises in the price of domestic energy have focused attention on the extent of fuel poverty and deprivation amongst those households most likely to be impacted by the cost-of-living crisis. Such pressures have led organisations such as charities, voluntary and religious groups, local authorities, and some in the private sector, to make available so-called warm spaces (‘hubs’, ‘rooms’ or ‘banks’) that provide opportunities for people to reduce their energy bills (Butler, 2023). In December 2022, the Welsh Government made £1 million available to local authorities to fund warm hubs for vulnerable households and enhance existing provision during the winter of 2022/2023 (Government, 2022). Such spaces can include facilities owned or operated by local and community councils such as libraries and community centres, cafés, pubs, church and village halls, or friendship and other community facilities run by volunteers. However, austerity driven cuts in service provision have often led to the closures of libraries and community centres with implications for spatial patterns of access to such hubs. Gaps in alternative forms of provision, possibly related to the extent of third sector activities in a locality, may also have implications for those accessing such sites. As well as variable spatial arrangements, there may be restrictions in opening times during the week, and/or limited hours of opening at weekends that further impact on levels of provision.
There is currently no definitive nationwide dataset of warm places; however, organisations such as local authorities, voluntary groups and other governing bodies often provide lists of such facilities (in a variety of formats) that can be used to examine local patterns of provision. Some of these lists also include the times of openings on different days of the week and the types of services available (e.g. English language courses, availability of wi-fi, consumer advice and support, etc.). During the winter of 2022/2023, an attempt was made to collate these different registers into a UK-wide data set of warm spaces by researchers at Open Innovations that involved scraping information from these sources. As many of these hubs continue to be available as community spaces for people to access during the summer months, this database is continually being updated to provide a search tool for those interested in examining the geographical availability of such spaces (Open Innovations, 2023). An extract of this data for Wales supplied in GeoJSON format, and supplemented by local information that was not included in the original repositories (such as gaps in opening times where available), was used to examine potential inequalities of provision based on small area estimates of accessibility by different modes of transport. Cardiff was selected to illustrate the potential of these geographical techniques because here site opening hours were available for all but two hubs (which, to facilitate completion of the analysis were manually edited to record times of 8a.m.–5p.m.).
In order to incorporate the effects of public transport availability in assessing access to these hubs, the study draws on bus timetables supplied as TransXchange files by Travelline and converted to GTFS format using the UK2GTFS tool (Morgan, 2021). OpenStreetMap was used to build a network graph using a combination of roads, footpaths and public transport data. An R script was written to calculate travel times (using r5r) to all warm spaces at 15-min intervals throughout the day, resulting in a total of 574 OD matrices. Python scripts were then used to calculate for each time slot an enhanced two-step floating catchment area (E2SFCA), cumulative opportunity and shortest distance access measure for all 2021 Output Area (OA) centroids (population-weighted centres of geographic areas with an approximate mean population of 300 persons) downloaded from the UK Geoportal site. In computing the E2SFCA measure, the total OA population count was used to estimate potential demand on warm hub sites, although this could easily be replaced by a count of a particular age cohort if preferred. The floating catchment size was set to 30 min total travel time, with an additional constraint of no more than 10 min of walking time.
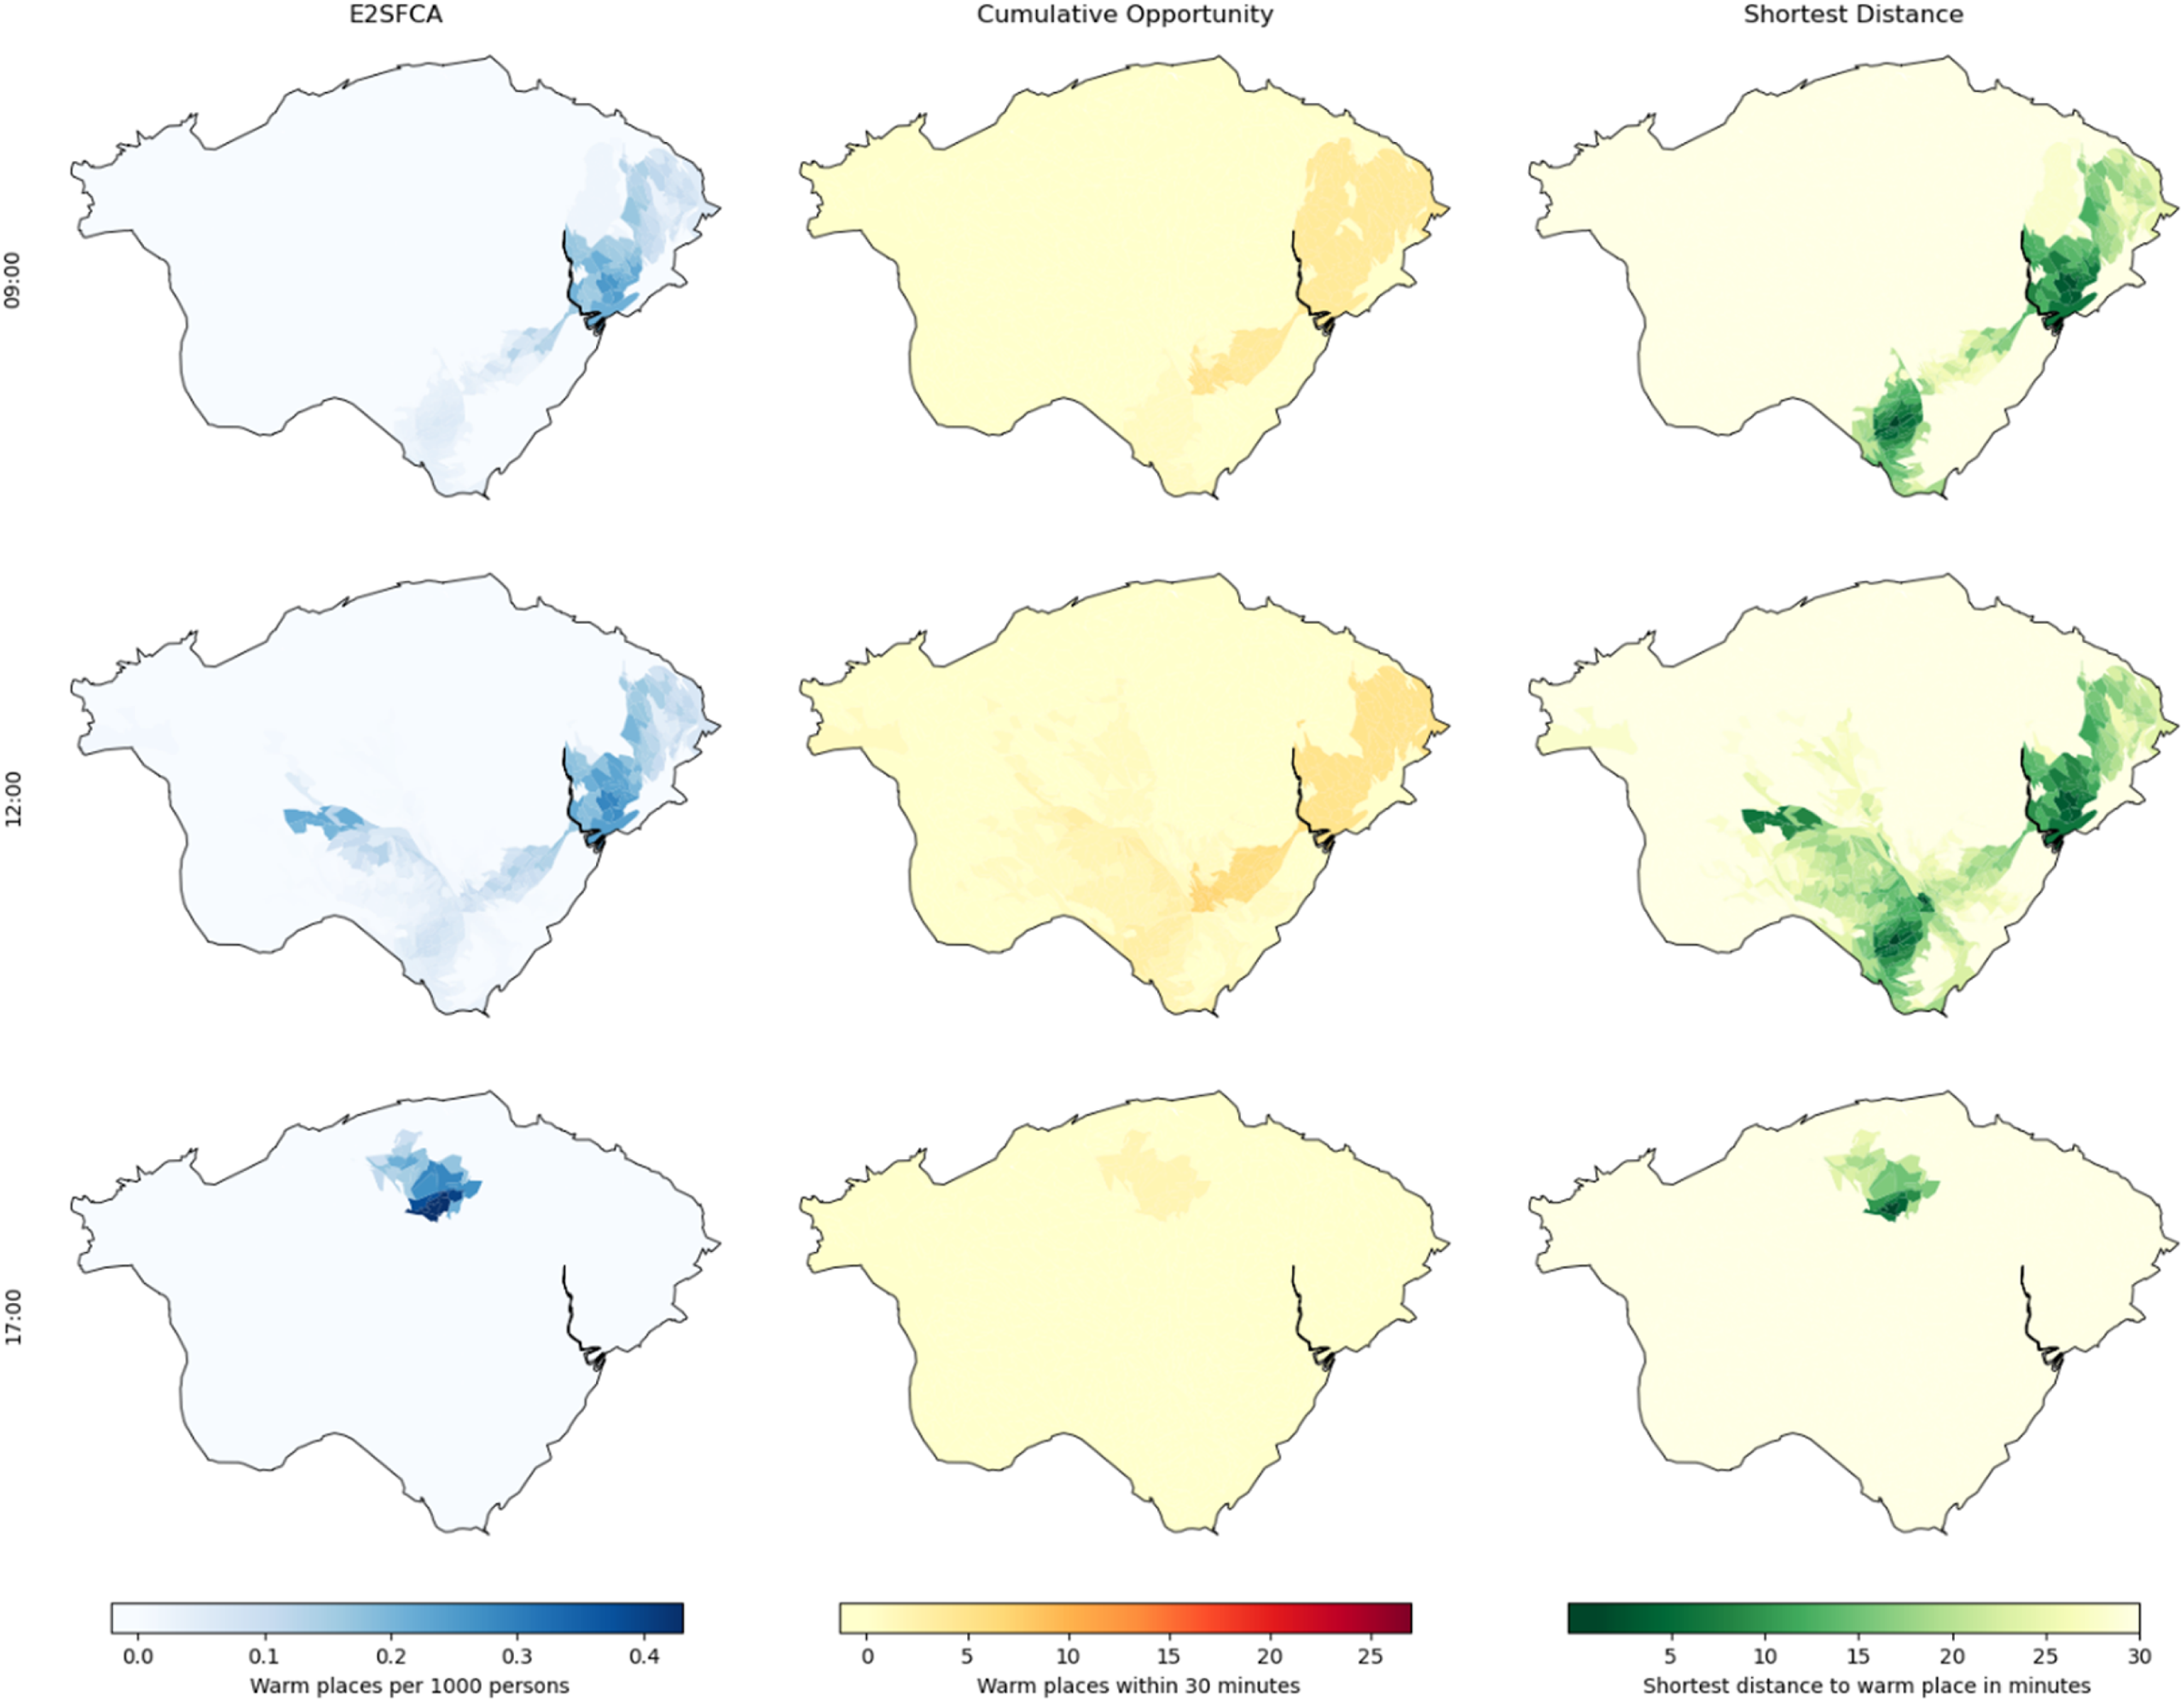
A python script was used to generate population-weighted base maps of Cardiff (Output Area population cartograms) informed by the 2021 census population cohort over 65 years of age – an age group that has been shown to be major users of such hubs (Warm Welcome, 2023). To illustrate how this approach can be used to explore patterns of temporal availability of warm hubs in relation to bus travel options, two sets of images for three time slots (09.00, 12.00 and 17.00) on a ‘typical’ weekday (Wednesday) and at the weekend (Sunday) are presented here.
The patterns for a ‘typical’ weekday (Figure 1) show that during the day at least, there is better access in the south and central areas of the city and, when demand is factored in, the east of the city. Fewer spaces are available later in the day. On a Sunday, the east and south of the city are comparatively well served (Figure 2). From 5p.m. however, there is marked decline in access across the city. All three measures illustrate variations in access to warm spaces across the city at different times of the day in response to interactions between hub opening times and bus transport timetables. Improving access to warm spaces on Sundays, in particular, could have wider public health benefits given the opportunity to meet and socialise for potentially vulnerable groups within such venues. At the time of writing (July 2023), funding has not been committed for supporting these spaces for the upcoming winter months. These maps have the potential to inform any such programmes, aiding in the identification of current gaps in geographical and temporal coverage and helping to plan the provision of demand responsive transport for those individuals who may be house bound. Variations in access to warm spaces on a weekday (Wednesday) – comparison of enhanced two-step floating catchment area, cumulative opportunity and shortest distance measures. Variations in access to warm spaces on the weekend (Sunday) – comparison of enhanced two-step floating catchment area, cumulative opportunity and shortest distance measures.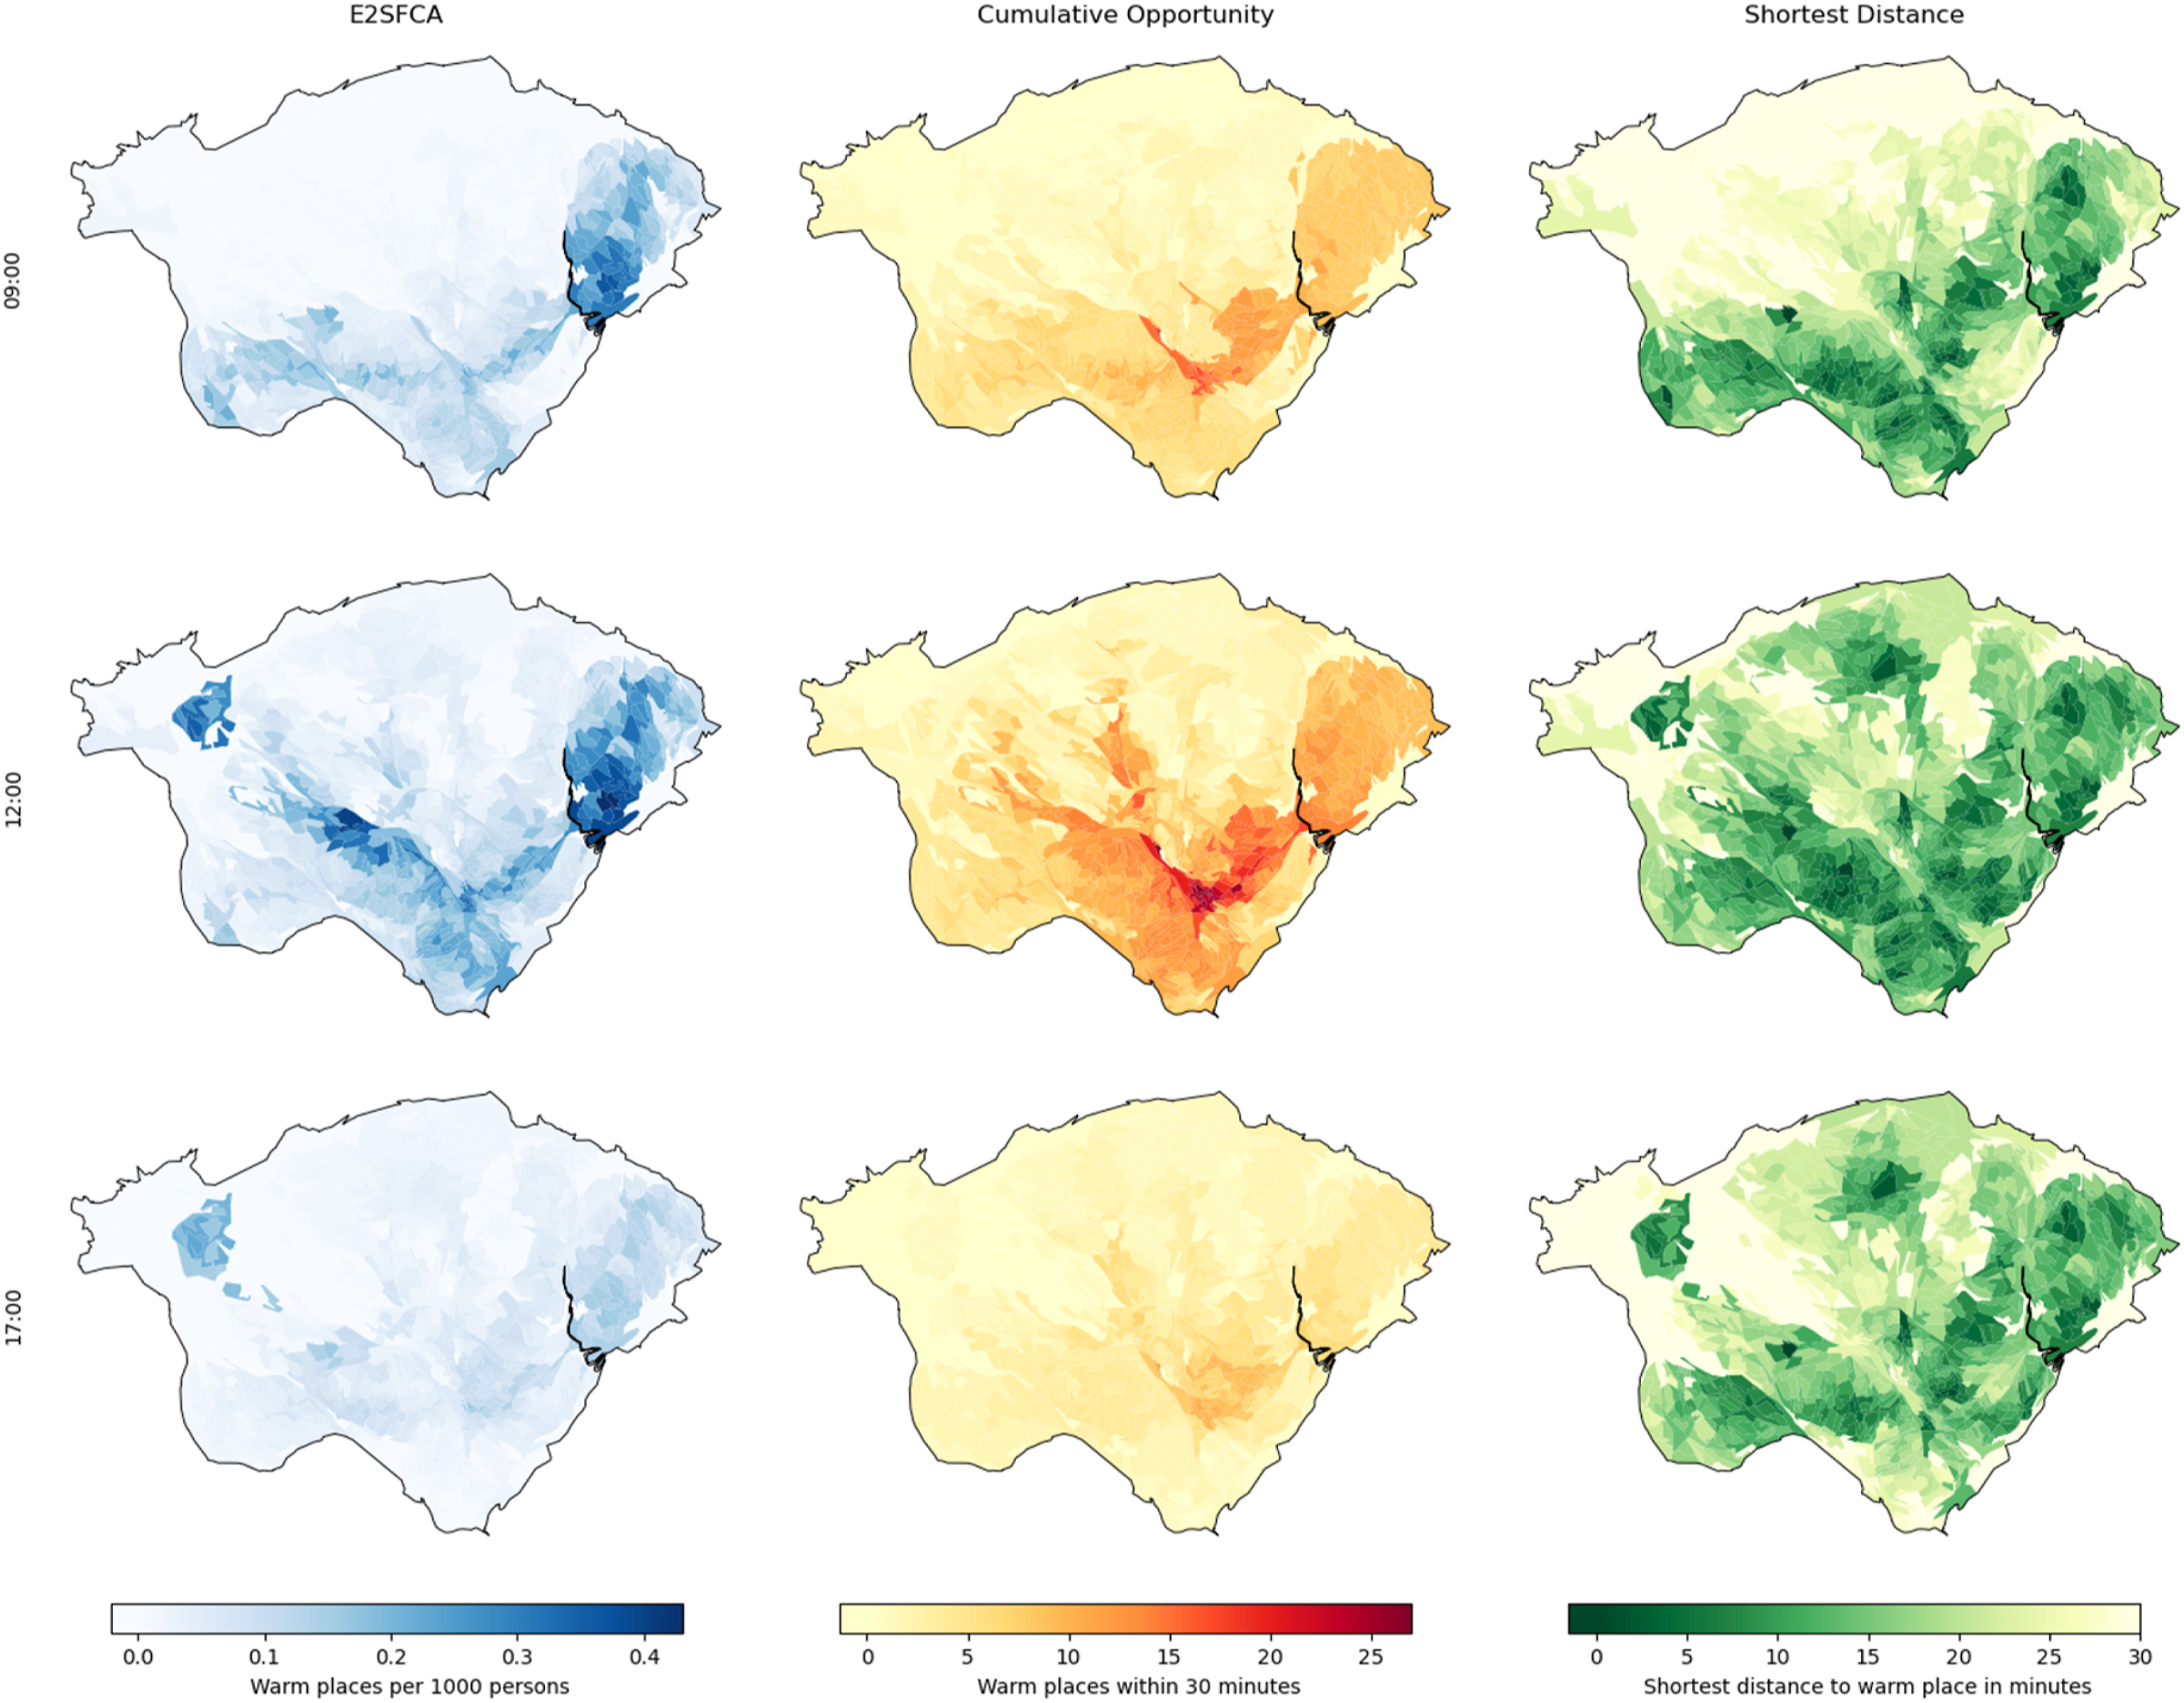
Software
The PyCharms and RStudio Integrated Development Environment applications were used for the development of control scripts employed in this study. The R5 routing engine and an associated R package – R5R (https://github.com/ipeaGIT/r5r) – were adopted to calculate journey times for use in the accessibility models.
Sources of Data
Warm place location data was accessed from https://warm.open-innovations.org/data/places.geojson
Traveline Data was accessed from https://www.travelinedata.org.uk/
Output area location data was accessed from https://geoportal.statistics.gov.uk/
Census population data was accessed from https://www.nomisweb.co.uk/sources/census_2021_bulk
Footnotes
Acknowledgements
The study uses a database of warm spaces created by Stuart Lowe (Open Innovations) for 2022-2023. Any views and opinions expressed in this article are solely those of the authors and do not necessarily reflect those of these individuals and organisations.
Declaration of conflicting interests
The author(s) declared no potential conflicts of interest with respect to the research, authorship, and/or publication of this article.
Funding
The author(s) disclosed receipt of the following financial support for the research, authorship, and/or publication of this article: This paper is based on research supported by the Wales Institute of Social and Economic Research and Data (WISERD). Funded by the Economic and Social Research Council (ESRC), WISERD is a collaborative venture between the Universities of Aberystwyth, Bangor, Cardiff, South Wales, and Swansea (Grant Number: ES/S012435/1).