
Abstract
The influence of neighbourhood characteristics on housing prices has gained increasing attention from scholars in recent decades. However, studies on the three-dimensional nature of urban space, and particularly the vertical dimension, have remained limited. This study investigates previously unexplored variables that can capture the vertical and horizontal dimensions of land-use configuration. In addition, this study proposes a spatially filtered multi-level approach to modelling variations in property values which can capture both spatial and multi-level effects. The research findings reveal a price premium for housing located in immediate neighbourhoods with more open mid-rise buildings and low plants. The results also demonstrate the varying effects of determinants of house pricing in spatially heterogeneous zones.
Keywords
Introduction
The hedonic method for evaluating housing prices is based on the understanding that the value of an individual property is the outcome of its intrinsic characteristics and the attributes of the context in which the property is situated (Bartholomew and Ewing, 2011). Unlike structural attributes, the effects of locational and environmental variables in hedonic housing price modes have been insufficiently explored (Xiao et al., 2016). Over recent decades, numerous studies have examined the contributions that different locational and environmental factors make to variations in property value, such as accessibility to different services (e.g. Wittowsky et al., 2020), land-use mixture (e.g. Song and Knaap, 2004), and street layout (e.g. Shen and Karimi, 2017). Unsurprisingly, the findings have been mixed and complicated given different conceptualisations, measures, and the ground-level conditions of localities. Interrelated external factors that operate at various spatial scales generate further complexity (Orford, 2002; Xiao et al., 2016).
Urban land-use composition involves built environment characteristics (e.g. the configuration, shape, size, and density of different features of land use), which are essential for urban planning and design (Middel et al., 2019). Notwithstanding varying understandings and definitions, land-use composition is relevant to two and three dimensions of space and spatial forms (Wentz et al., 2018). Despite many studies on the effects of diverse land-use composition factors, scant attention has been given to three-dimensional urban space, despite its being an inherent feature of the urban built environment (Koziatek and Dragićević, 2019). Development density, building density, and population density are considered relevant indicators for certain characteristics of the vertical dimensions of urban spaces (e.g. Orford, 2002; Song and Knaap, 2003). However, such work has not considered vertical dimensions in terms of either conceptualisation or measurement. For example, Orford (2002) calculated housing density using a point-in-polygon analysis which was unable to capture the height of the entire neighbourhood, the footprints of buildings, or the spatial relationships between buildings.
The urban environment is not only about buildings. Other factors concerning a city’s ecological and environmental well-being can be included, such as vegetation coverage, density, and height (Jim and Chen, 2003). The physical form of the environment, such as land cover, materials, and the geometry of the buildings, can produce either adverse or positive impacts on local climate, hydrology, biodiversity, air quality, the urban heat island effect, public health, and issues pertaining to quality of life (Ching et al., 2018). These impacts are further reflected in the housing market, and this study addresses these research gaps by utilising indicators of land-use composition that represent both the vertical and horizontal dimensions of urban spaces. Specifically, urban density is conceptualised into two morphological dimensions: horizontal (i.e. compact and open) and vertical (i.e. high- and low-rise). The World Urban Database and Access Portal Tools project characterises urban settlements into different types of neighbourhoods based on the local climate zone (LCZ) scheme, which considers building and vegetation features such as height, the packing of different spatial elements, surface cover, and the thermal admittance of materials (Stewart and Oke, 2012). The LCZ system offers a valuable framework for urban form classification, and LCZ maps have been generated in different types of cities worldwide such as Hong Kong, Olomouc in the Czech Republic, Bilbao in Spain, and Nagpur in India (Bechtel et al., 2019). While LCZ maps have been widely used in urban climate research, existing real estate research has rarely looked into these different forms, how they are linked to neighbourhood environments, and how horizontal and vertical land-use configurations are related to property value.
Long-established studies have estimated various determinants of property value via the hedonic price modelling approach. Such investigations have tended to treat property prices/rents as the dependent variables, and structural, locational, and environmental attributes as the explanatory variables (Chiaradia et al., 2013). Currently, most studies address all explanatory variables at the same level. However, the mechanism of property market dynamics operates across various spatial scales (Goodman and Thibodeau, 1998). Specifically, houses are nested into neighbourhoods and different areas within urban housing markets (Dong et al., 2015). It follows that contextual neighbourhood attributes can denote the specific aspects of the location of a property and also operate at multiple scales; this requires a multi-level approach (Chiaradia et al., 2013). The multi-level approach can relax the assumption of a unitary housing market and is capable of delineating sub-markets of housing by accounting for the hierarchical data structure and modelling price variability that exists at different spatial levels (Glaesener and Caruso, 2015). Further, spatial autocorrelation exists in local housing markets; without considering spatial information, the specification of the traditional hedonic model is always problematic (Orford, 2000). Recently, the spatial filtering approach has been applied under a few different contexts to understand particular housing markets. Its strengths in overcoming multicollinearity and improving prediction accuracy over other main spatial models have been confirmed via empirical studies (e.g. Helbich and Griffith, 2016; McCord et al., 2020). It is also considered to be a valuable method for real estate research (Helbich and Griffith, 2016). While there have been an increasing number of studies attempting to use either multi-level models or spatial regression models to circumvent the potential error bias contained within traditional hedonic models, existing research on housing markets has rarely applied both methods simultaneously to capture both spatial dependence and multi-level effects. While a few studies have applied spatial autoregressive models (SAR) into multi-level modelling settings (Dong and Harris, 2015; Dong et al., 2015), the integration of the spatial filtering method into a multi-level framework to understand housing price variability remains rare in real estate and planning research. Regression parameter estimates obtained via the eigenvector spatially filtered approach are unbiased, and this is particularly true for simultaneous SAR (Thayn, 2017). It could directly identify spatial relationships via loadings of eigenvectors, which could inform land development and planning (Wang et al., 2013). This study adopts a spatially filtered multi-level (SFML) modelling approach that can incorporate the spatial filtering method into a multi-level setting. The different characteristics of land-use composition in immediate and broader neighbourhoods are quantified into variables at two levels.
This study uses the Beijing metropolitan area to explore the relationship between urban land-use configuration and housing prices. Urbanisation has reshaped the landscape of Beijing, whilst housing development in Beijing has been transformed from homogeneous residences of work units into a heterogeneous pattern of residences in vertical and horizontal dimensions across different localities (Wang, 2016). High-density style developments after the opening-up reforms and frequent land use changes are considered more relevant to the vertical dimension of property development. This indicates a need to inform debates in relevant contexts.
Neighbourhood characteristics and property value
The most commonly discussed aspects of housing prices include proximity to urban green or open spaces (Bartholomew and Ewing, 2011), accessibility to educational services (Chin and Foong, 2006) and retail stores (Jang and Kang, 2015), and distance to central business districts (Koramaz and Dokmeci, 2012). A seemingly self-evident notion is that better access to goods and services can positively influence property values. This issue, however, is more complex because various spatial elements can influence housing values and lead to positive or negative effects (Chiaradia et al., 2013). Since people decide where to live based on many trade-offs, such as access to jobs, services, and amenities (Giuliano et al., 2010), the relationship between accessibility to labour markets and housing prices has been examined (e.g. Osland and Thorsen, 2008). Other studies have explored the relationships between accessibility to transport services and property values (e.g. Li et al., 2019; Munoz-Raskin, 2010). Some studies have demonstrated that bus accessibility does not significantly increase property prices (e.g. D’Elia et al., 2020; Wen et al., 2018); others found positive (e.g. Wang et al., 2015) or negative influences (e.g. Xiao et al., 2019). Several specific attributes of transport networks (e.g. noise, pollution, and visual impacts) and/or the socio-economic profile of a given neighbourhood can also result in negative externalities, potentially overwhelming positive ones (Munoz-Raskin, 2010). Varying ground-level conditions across localities, as well as data and measuring methods, have resulted in differences in the estimated results of accessibility (D’Elia et al., 2020; Wang et al., 2021).
The impact of mixed land use on property values and affordable housing stems from various factors, including types of land use and demand for housing in neighbourhoods with mixed land use (Aurand, 2010). To begin with, Van Cao and Cory (1982) argued that the random mixing of land uses did not necessarily lead to the increased values of surrounding residential properties. Song and Knaap (2004) demonstrated that residential property values in Washington County, Oregon, were boosted by mixing only certain land uses – such as public parks and neighbourhood commercial uses – with single-family residential houses. The results indicate that incompatible land uses being constantly associated with discounted prices is explicit (Kang, 2019). Industrial land use, for example, has been found to exert adverse effects on residential settings (Park et al., 2016).
Urban spatial configuration variables such as connectivity and street layout have also been examined. Several studies have quantified connectivity by considering the density of interactions, street segments, blocks, lengths of different types of streets, and road densities (e.g. Song and Knaap, 2003). However, consistent use of indicators is lacking due to the variety of localities examined and the resultant divergence in data availability. More recent studies have used graph theory rather than piecemeal approaches. The indicators of spatial syntaxes, such as interaction/closeness and choice/betweenness, have been applied to explore the relationship between street layout and housing prices (Kang, 2019; Shen and Karimi, 2017).
Despite extensive research on the contributions of different neighbourhood characteristics, such as location, land use, and spatial configuration and pattern, to variations in housing prices, the horizontal or vertical dimensions of neighbourhood space have been neglected, particularly the vertical dimension of space. Despite the prevalence of taller and denser building in cities, the term ‘vertical urbanisation’ has only recently gained popularity (Nethercote, 2018), and is increasingly viewed as a form of middle-class displacement (Lauermann, 2022). While the notion of vertical urbanisation necessitates the development of pertinent knowledge to expand our existent understanding of urban morphology (Ren et al., 2017), very few empirical works have examined three-dimensional neighbourhood space and ascertained its impact upon property prices. One reason for this may be the apparent lack of high-quality three-dimensional urban information. Nevertheless, a few studies have discussed the impact of the vertical dimension of property characteristics on property values; these works provide insights into the issue.
Helbich et al. (2013) used data derived from three-dimensional airborne laser scanning to model the solar radiation premium of flat prices, while Kara et al. (2020) discussed using three-dimensional information to better estimate and explain property unit values. More recently, Huang et al. (2022) explored the factors contributing to vertical urban development in Brisbane, Australia. There is a dearth of empirical work exploring such relationships in the context of China. A survey conducted by Ying et al. (2022) revealed that Chinese house buyers highly valued the three-dimensional factors of neighbourhoods, but it seems that local authorities and real estate developers have not yet emphasised these elements. Detailed analysis on how horizontal and vertical land-use configuration in immediate and broader neighbourhoods is related to property value remains scarce; this study addresses this research gap.
Methodological framework
The present study evaluates the influence of different variables, particularly the three-dimensional characteristics of land-use configuration in the immediate and broader neighbourhoods, on housing prices in the Beijing metropolitan area. It also compares the various effects of different variables on housing prices across spatial zones which present diverse urbanisation processes.
Case study and different spatial zones
This study utilises the Beijing metropolitan area as its case study. Over the past four decades, Beijing has urbanised rapidly, generating a booming housing market (e.g. Chiaradia et al., 2013; Shen and Karimi, 2017). The built-up area expanded from 310 to 1401 km2 between 1981 and 2015, increasing its population by 12.5 million (Zheng et al., 2019). Beijing exhibits more spatial variations of land use because of the substantial changes that have occurred within this short period of time. It follows that this locality can provide a lens through which the influence of land-use configurations on housing prices can be investigated.
Based on empirical studies (e.g. Zhao, 2014) and analysis of planning documents (e.g. Beijing Master Planning), Beijing can be divided into several spatial zones that present different development/urbanisation phases: the old city centre, main urban areas, inner suburban areas, outer suburban areas, and ecological conservation areas. Most ecological conservation areas have not been urbanised, and thus, they are excluded from this study. The remaining spatial zones represent the urban expansion process as well as heterogeneous land-use patterns. Following Zhao (2014), we analyse the varying effects of different variables on housing prices across spatial zones. Fig S1 illustrates the geographical area of each abovementioned zone in Beijing.
Data and variables
Data on residential housing prices during 2015 (the dependent variable) were obtained from Lianjia, the largest real estate broker based in China. It provides relatively thorough information, exhibits better reliability, and possess a larger geographical coverage compared to other agents. Lianjia possesses a market share of ∼70% of the housing market in Beijing (Wu et al., 2018) and has been used as a source of data related to housing in studies on the ongoing movement of open (urban) data initiatives (e.g. Li et al., 2019). The final sample included, after data screening, 86,031 housing transactions. Fig S1 demonstrates the spatial distribution of these samples.
For the empirical analysis, four sets of independent variables were used: structural and locational variables as well as those embodying land-use configuration in the immediate and broader neighbourhoods (Table S1). Data used to represent and quantify these variables were aggregated from multiple sources, including housing transaction data in 2015 from Lianjia, 1 point of interest data from the Gaode Map for 2015, and land-use form data from the World Urban Database for 2015.
Three-dimensional land-use configuration variables
The focus of this study is the impact of the land-use configurations of immediate and broader neighbourhoods on property prices. The immediate neighbourhood refers to areas within a range of 1 km; the broader neighbourhood refers to the broader street/township in which a property is located. For land-use configuration in the immediate neighbourhood, 11 variables are included: compact high-rise, compact mid-rise, compact low-rise, open high-rise, open mid-rise, open low-rise, low plants, scattered trees, bush/scrub, bare rock/paved, and bare soil/sand (Stewart and Oke, 2012). These forms can reflect the horizontal and vertical dimensions of land use. Particularly, each type exerts distinct characteristics with regard to the horizontal density of construction (compact/open), the vertical height of the building (low-rise/mid-rise/high-rise), surface cover (impervious/pervious), and surface structure (height and spacing of buildings/trees) (Lehnert et al., 2021). For clarity, Figure 1 illustrates the differences amongst high-rise, mid-rise, and low-rise, as well as those between compact and open. The compact form involves tightly packed buildings and few or no trees, while the open form features openly arranged buildings and abundant vegetation. High-rise, mid-rise, and low-rise denote ≥10 stories, 3–9 stories, and 1–3 stories, respectively. Scattered trees, low plants, bush/scrub, bare rock/paved, and bare soil/sand refer to different types of vegetation cover at both horizontal and vertical dimensions. The study further calculated the proportions of different land-use forms in the broader neighbourhood as street-level variables. Illustrations of different land-use configurations at the neighbourhood level.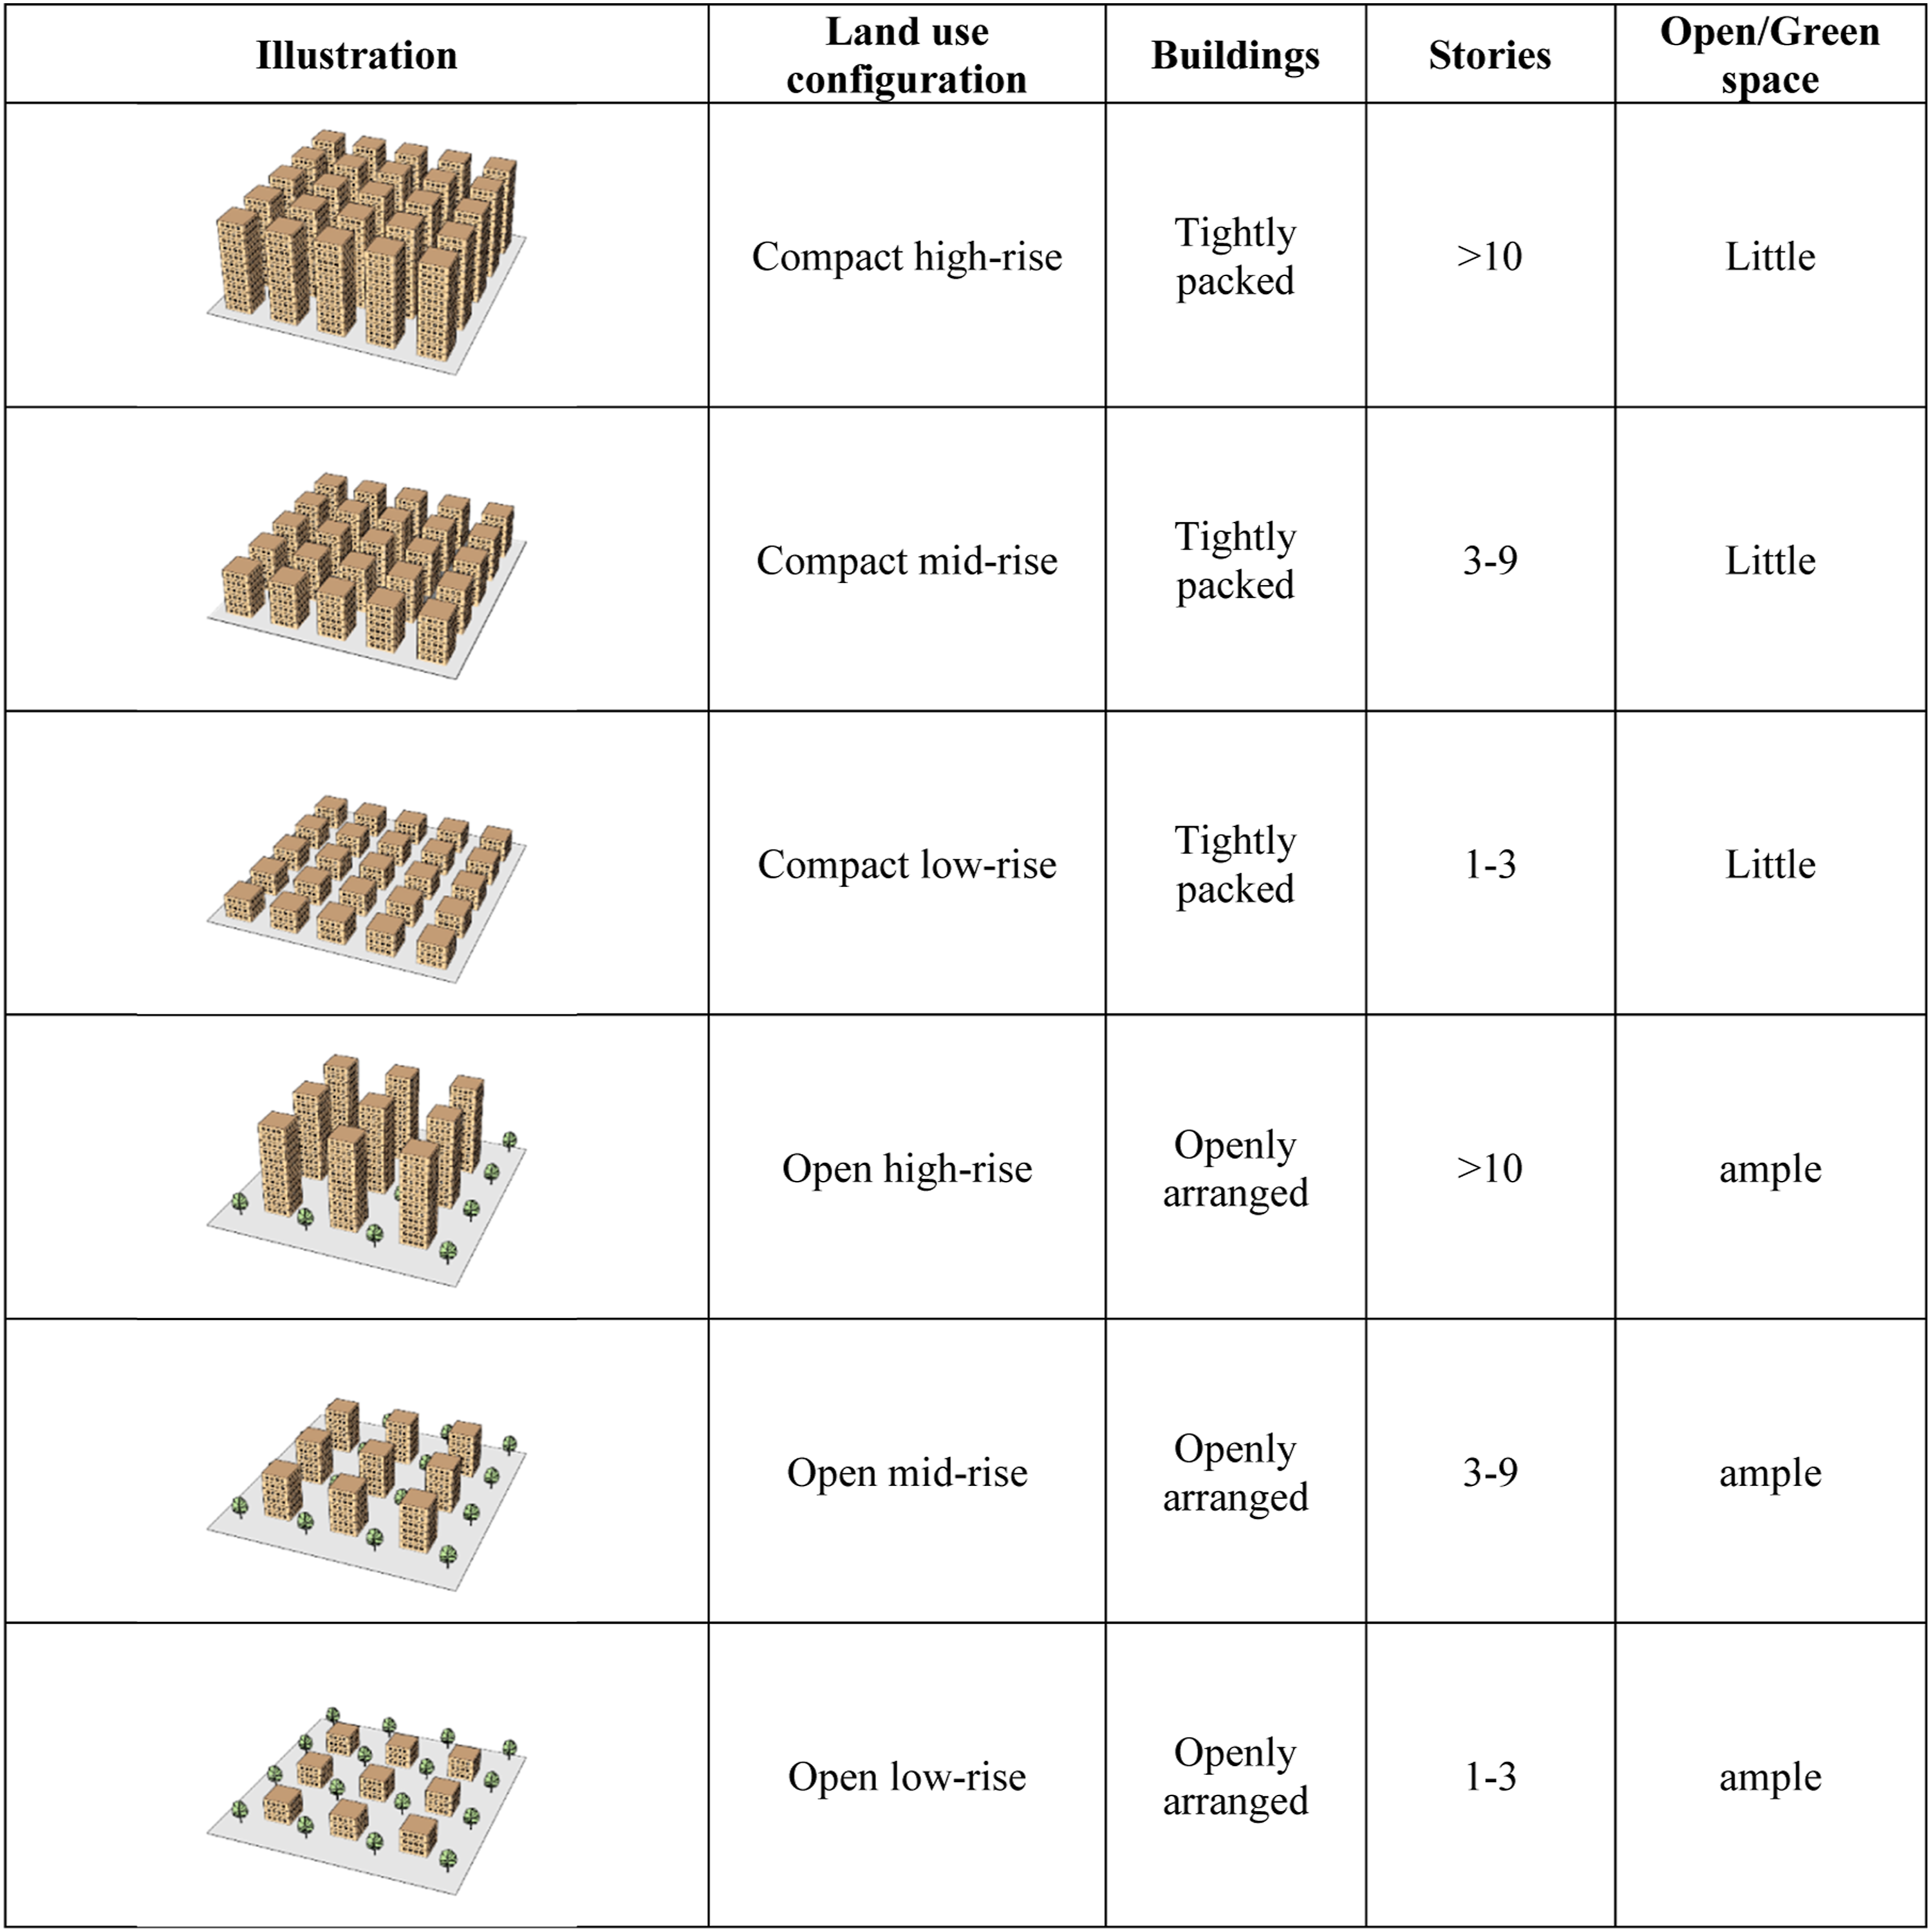
Other control variables
The structural property-level variables, such as the number of bedrooms, floor level, orientation, and housing age, were obtained from Lianjia. Two approaches were adopted for measuring accessibility. The 20-minute neighbourhood has been increasingly adopted as a sustainable urban development strategy (Gower and Grodach, 2022), though there have been variated definitions and measures. Access thresholds vary across different facility types with some over 1 km and some less than 1 km in distance (Thornton et al., 2022). We adopted the number of facilities within 1 km of a property, following empirical studies on Chinese cities (e.g. Wen et al., 2018; Xiao et al., 2019). Robust checks were also conducted to examine correlations between accessibility variables that use different buffer distances (800 m and 1200 m). High coefficients between different variables (over 0.9) evidence the reliability of the current measures. In addition, the minimum distance from a property to the closest facility/service was adopted as an alternative approach for measuring accessibility in this study (Apparicio and Seguin, 2006). Seven locational variables were included as measures of accessibility to different facilities/services (Table S1).
Metro station density and functional mix were also included to reflect the characteristics of the broader neighbourhoods. Function mix entropy was calculated for seven types of facilities at the street level: cultural, educational, healthcare, sports and recreation, grocery, financial, and shopping facilities. Given their different scales, all independent variables were standardised.
The development of the SFML model
This study adopted a spatially filtered multi-level (SFML) modelling approach to estimate housing price variations. It first identified whether spatial dependency exists for housing price variations. Then the spatial filtering technique was applied into the multi-level modelling framework to consider both property-level residual spatial dependence and broader neighbourhood spatially independent group effects.
Random effects eigenvector spatial filtering (RE-ESF) model
An eigenvector spatial filtering technique could be used to address spatial autocorrelation problems in ordinary single-level linear regression by extracting eigenvectors from a spatial weight matrix that links geographic objects together in space and including those eigenvectors as control variables in the model’s specification (Chun and Griffith, 2013). In a standard single-level regression model applied to spatial datasets, the eigenvector spatial filtering process could produce a spatial signal to explain spatial autocorrelation in the residuals and ensure the independence of the error term (Park and Kim, 2014). An eigenvector spatial filtering (ESF) model is specified as

Spatially filtered multi-level model
Housing markets work across different spatial scales with individual properties nested into an immediate neighbourhood, and then within a broader neighbourhood (street). Data to quantify variables at the property level and immediate neighbourhood level work at the same modelling level. Furthermore, there were only one or two transaction records in some immediate neighbourhoods. Given the data structure and sample sizes of different immediate neighbourhoods, a two-level modelling approach (property and broader neighbourhood) was adopted with the random effects term included. The multi-level model was then corrected by including the spatial signal produced by the eigenvector spatial filtering technique into the random effects term. Specifically, the SFML modelling was constructed based on equation (1) as follows:

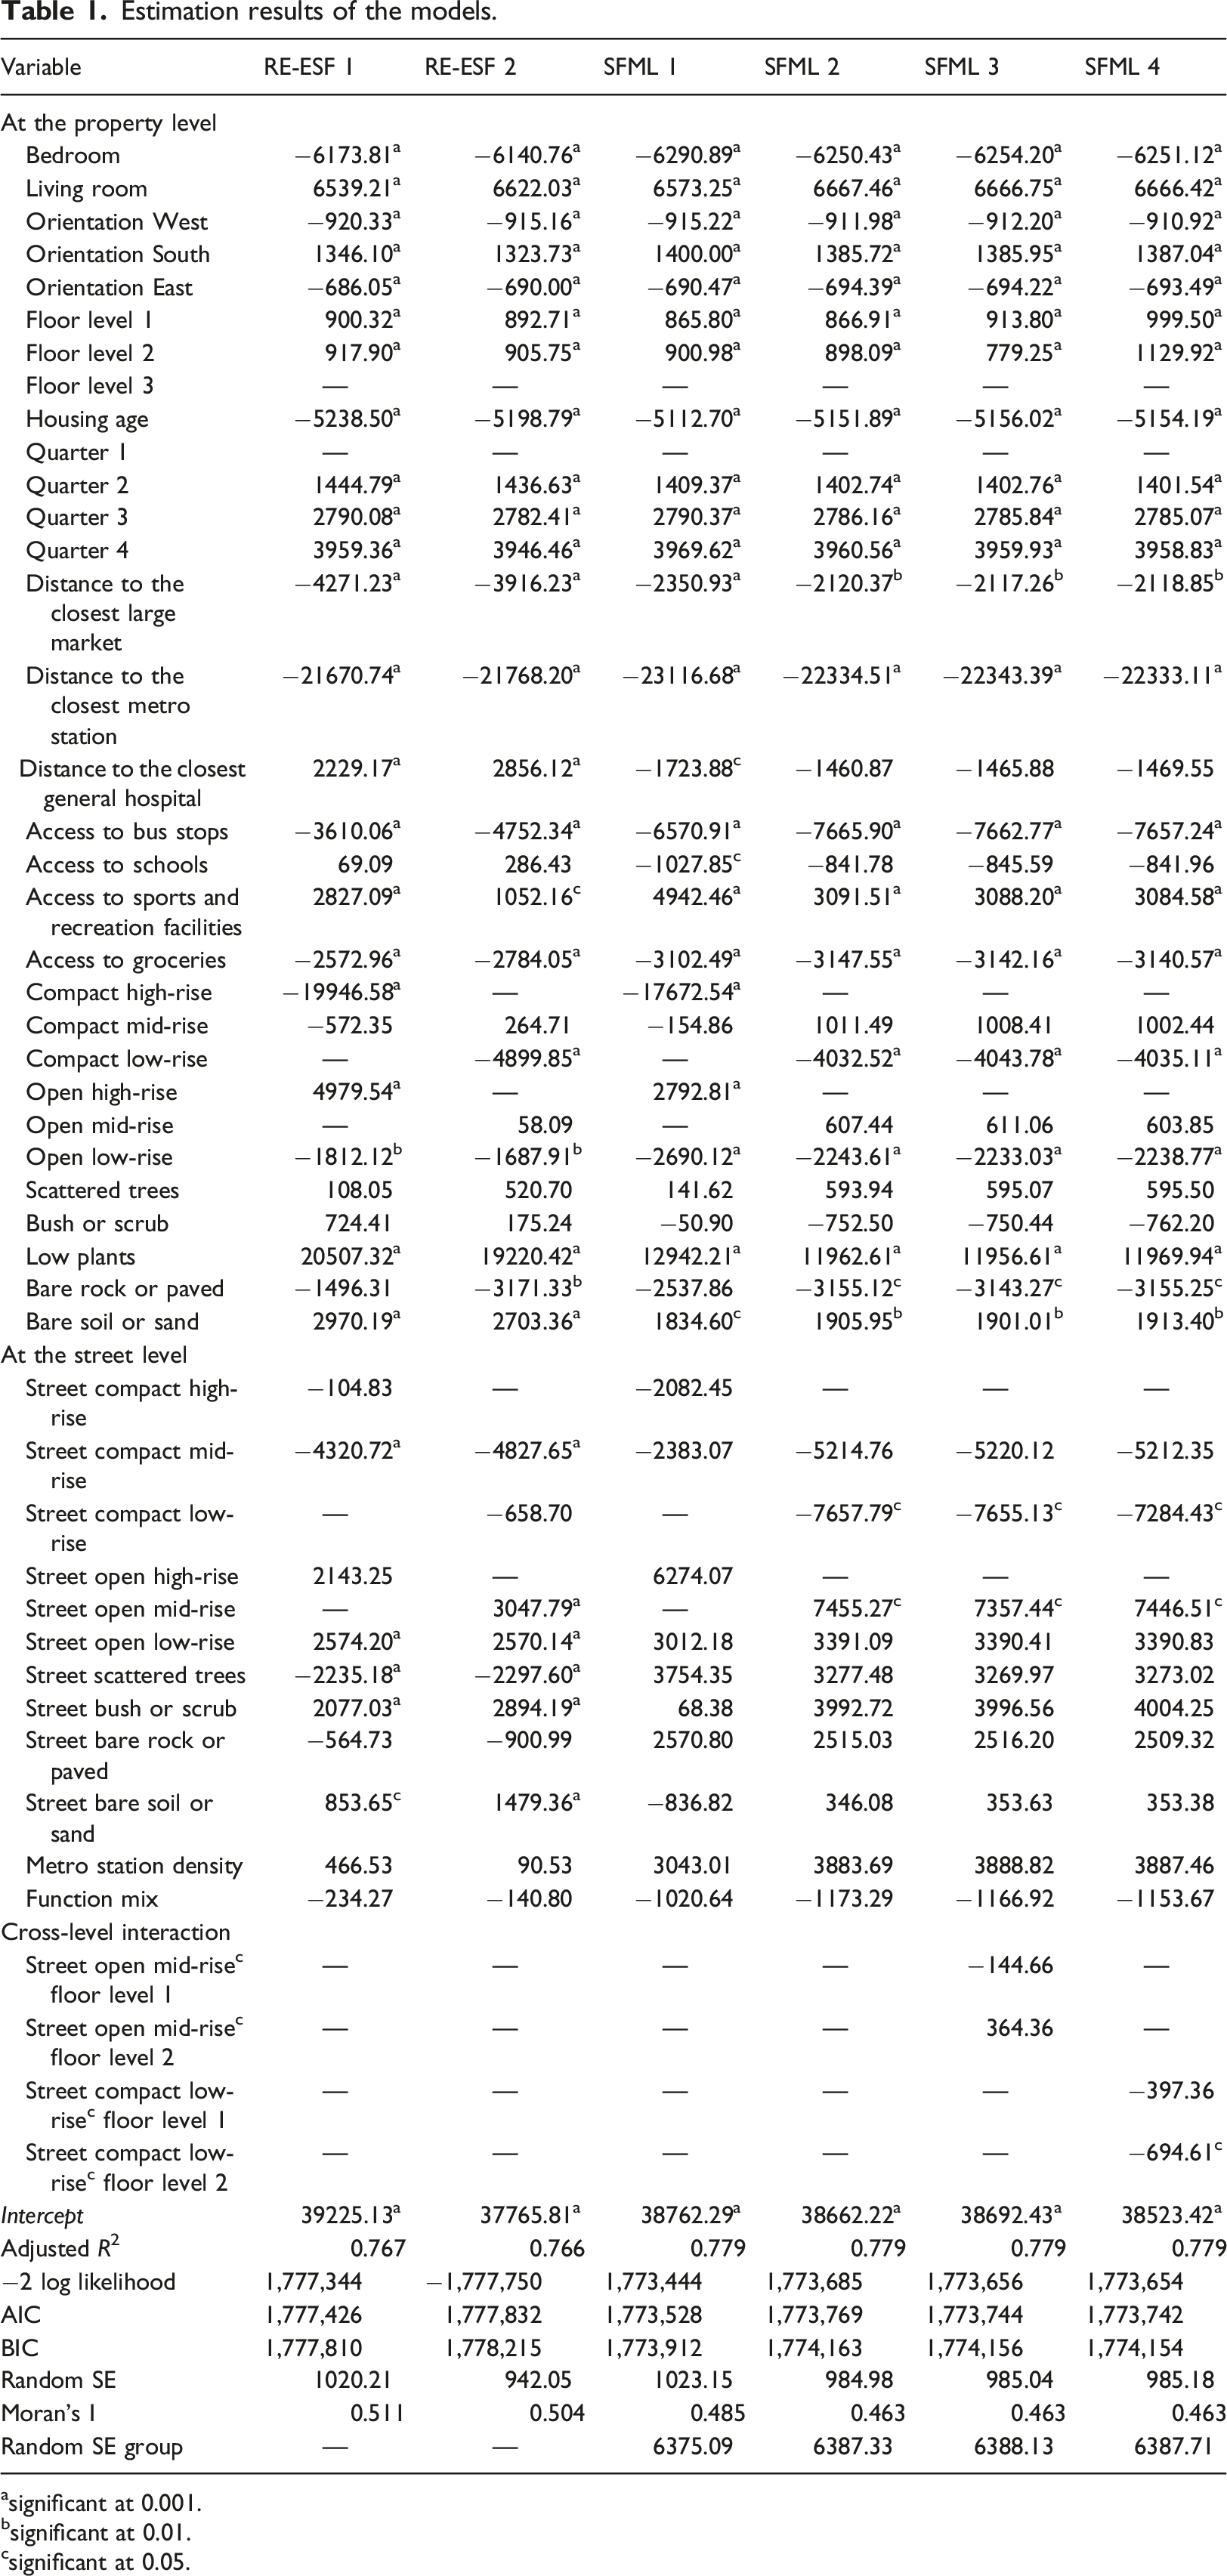
Estimation results of the models.
asignificant at 0.001.
bsignificant at 0.01.
csignificant at 0.05.
Development of SFML models for different zones
Having run the entire study area model, the whole dataset was separated into four groups to further illustrate the varying effects of the independent variables across spatial zones. Hence, the SFML models were built based on the samples from the following zones: the old urban centre, the main urban zone, the inner suburban zone, and the outer suburban zone (see Fig S1 for the extent of each zone).
Results and discussion
Model fitting results
Table 1 presents the estimation results of the RE-ESF and SFML models. RE-ESF model 1 and SFML model 1 excluded compact low-rise, open mid-rise, street compact low-rise, and street open mid-rise as independent variables. Conversely, RE-ESF model 2 and SFML model 2 excluded compact high-rise, open high-rise, street compact high-rise, and street open high-rise as explanatory variables to avoid potential multicollinearity. SFML model 3 and SFML model 4 included cross-level interaction effects based on SFML model 2 to capture the interaction effects between two significant land-use composition variables at the street level (Street open mid-rise and Street compact low-rise) and the floor level variables at the property level.
SF models 1 and 2 suggest explicit spatial autocorrelation effects with Moran’s I values of 0.511 and 0.504, respectively. The reduced log-likelihood, AIC, and BIC values of the SFML models further illustrate that the SFML models displayed better modelling performance, especially the SFML model 4. The residual spatial components of SFML models 1 and 2 predicted by the eigenvector spatial filtering process were mapped in Fig S2, which shows spatial dependency effects across the study area. https://journals.sagepub.com/doi/suppl/10.1177/23998083231180213
Impacts of the land-use configuration variables
In SFML model 1, compact high-rise form, open high-rise form, open low-rise form, low plants, and bare soil or sand in the immediate neighbourhood displayed significant effects. Specifically, the variable low plants exhibited a positive effect with the highest coefficient (12942.21); open high-rise and bare soil/sand also exhibited positive effects (though with much smaller coefficients of 2792.81 and 1834.60, respectively); compact high-rise and open low-rise had negative coefficients with the former having a much larger effect (−17672.54). In SFML model 2, low plants and bare soil/sand produced significantly positive coefficients at 11962.61 and 1905.95, respectively. This indicates the premium enjoyed by low plant land cover in the immediate neighbourhood. At the broader neighbourhood scale, street open mid-rise exerted a positive coefficient of 7455.27 in SFML model 2; and street compact low-rise was associated with a negative coefficient of −7657.79 in SFML model 2, which suggests that there is a premium attached to open mid-rise form in the wider neighbourhood environment. If the broader neighbourhood environment is associated with more compact low-rise land-use patterns, then properties within the area tend to have lower prices when other factors are controlled.
These results suggest a premium from open high-rise and low plants forms in the immediate neighbourhood and from the open mid-rise form in the broader neighbourhood in the Beijing metropolitan area. These findings reinforce the previously noted economic benefits of urban green space as documented by many existent empirical studies (see, amongst others, Kim et al., 2018). With regard to the horizontal dimension, the open and compact low-rise forms were more related to lower property values than the open mid-rise and open high-rise forms in the immediate and broader neighbourhoods, and especially the compact low-rise form in the immediate and broader neighbourhoods. As open form is associated with green vegetation that can provide amenity value and environmental quality (Mei et al., 2018), it is not surprising that premium effects were found in variables relating to open forms in the immediate and broader neighbourhoods. From a vertical perspective, low-rise forms were not favoured in the immediate and broader neighbourhoods. A possible reason for this is better accessibility to facilities associated with high-rise and mid-rise forms. Low plants which featured landscapes of grass or herbaceous plants can also offer a high premium when it comes to property values, consistent with the findings from a study on Los Angeles (Saphores and Li, 2012).
To understand more nuanced cross-level interaction effects, street open mid-rise and street compact low-rise as two significant street level land-use composition variables were further examined by interacting them with floor level variables at the property level. As suggested by SFML models 3 and 4, street open mid-rise consistently showed a positive effect while cross-level interactions between street open mid-rise and floor levels did not show any significant effect. However, the interactions between street compact low-rise and the middle floor level exhibited a negative coefficient at −694.61 in the SFML model 4, which suggests that middle-level properties within the compact low-rise form environment tend to have lower prices.
Impact of the property- and street-level control variables
The total number of bedrooms was negatively related to housing prices per unit, consistent with previous studies on Shanghai, China, and Salt Lake City, United States (Li et al., 2019). This finding indicates that extra bedrooms do not provide a premium when other factors are deemed to be similar. Conversely, this case exhibited a living room premium. Per SFML models, a southerly orientation was positively related to housing prices per unit, whereas west and east orientations exerted negative coefficients, which may be related to the higher level of sunshine penetration enjoyed as a consequence of south-facing orientations as well as aspects of fengshui in China (Li and Wang, 2004). Moreover, the southerly orientation enables better air circulation. Middle floor levels produced a higher positive coefficient than low floor levels when the high floor level was treated as the baseline, which suggests that there is a nonlinear relationship between floor level and property value. Housing age was negatively related to housing prices per unit, similar to several existent studies of China (Xiao et al., 2019). Quarter 4 led to a positive and was also the highest coefficient among the three dummy variables of transaction periods, indicating that property prices per unit increased over time.
For locational variables at the property level, the larger the distance to the closest metro station, the lower the housing price per unit was, consistent with previous studies (e.g. Li et al., 2019). Distance to the closest large-scale market produced significantly negative coefficients in SFML models; access to groceries showed negative effects. It follows that proximity to the nearest large-scale market could make a difference to housing prices instead of the number of nearby supermarkets and convenient stores. Distance to the closest general hospital had no significant effects. The positive coefficient of access to sports and recreation facilities confirms the premium effects of sports and recreation facilities. The coefficients of accessibility to bus stops were negative; thus, bus stops near a given property might exert a negative effect (e.g. noise and pollution). The non-significant effects of accessibility to schools and distance to the closest general hospital illustrate the complex effects of educational facilities and a general hospital on property values. The influence of educational facilities on property values is a result of the combined effects of the quality of a given school and other attributes of educational facilities (e.g. Chin and Foong, 2006). People’s use of hospitals is dependent upon patients’ personal health issues. The density of metro stations and the functional mix in the broader neighbourhood did not display significant effects.
Variations across spatial zones
The old urban centre
This study obtained more nuanced results after controlling for spatial zones (Table S2). In the old urban centre, the number of bedrooms presented negative effects, whereas the presence of a living room pointed to a positive effect, similar to the results from all samples. A western orientation exerted negative effects in models 1a and 1b, whereas a southerly orientation exhibited significantly positive effects. Interestingly, housing age exerted positive effects, which was a result that differed from that of the entire dataset. This finding may be because buildings in more central areas were developed earlier (if not redeveloped), such as self-contained work unit housing and courtyard houses with historical values.
The nearest metro station and the presence of a large-scale market added a premium to housing prices in the old urban centre while distance to the closest general hospital had positive coefficients. Access to bus stops exerted a premium on property values in the old urban centre. However, access to schools, sports and recreation facilities, and groceries exerted negative effects. Furthermore, the density of metro stations in the broader neighbourhood exerted negative effects. These effects reflect the unique characteristics of the old urban centre. This area was established the earliest; although it features better transport and public facilities, it also possesses a higher population and development density. When urban development is more established, the negative externalities of different facilities may outweigh the positive ones. As a result, this area presented a different perspective than the other spatial zones.
Bush/scrub and bare rock/paved areas in the immediate neighbourhood exerted positive impacts, whereas low plants led to a negative coefficient, which was not the case in the entire study area. In model 1a, the compact mid-rise form had a higher coefficient compared to both the compact high-rise form and the open high-rise form, confirming the existence of a premium from the mid-rise form in the old urban centre.
The main urban zone
The majority of variables at the property level presented a similar pattern of effects as those shown in SFML models 1 and 2, with a few exceptions (see models 2a and 2b). The variable access to schools created positive effects in the main urban zone, different from the overall pattern. Furthermore, the distance to the closest large-scale market showed an insignificant effect in 2b whilst access to groceries had negative coefficients.
For different land-use forms, the open mid-rise form in the immediate neighbourhood exerted a positive effect with the highest coefficient in model 2b. Conversely, compact and open low-rise forms had negative effects, suggesting that mid-rise forms enjoyed a premium. Low plants in the immediate neighbourhood displayed the highest positive effect on property prices among different vegetation types; scattered trees, bare rock/paved, and bare soil/sand exerted negative effects. None of the land-use configuration variables had significant influences at the street level. This result may be related to the homogenous land-use forms in the broader neighbourhoods which are shared by properties in the main urban zone.
The inner suburban zone
Most structural variables in the inner suburban zone exhibited similar patterns of influence to those in SFML models 1 and 2. Some locational variables exerted different effects to those in the main urban zone, such as distance to the closest general hospital (negative in 3a and not significant in model 3b), distance to the closest large market (positive in models 3a and 3b), and access to groceries (positive in 3c and not significant in 3b).
In this zone, two high-rise forms, open and compact, were favourable in the immediate neighbourhood, with the open form possessing a much higher coefficient (see model 3a). Model 3b suggests that open mid-rise was favoured while open low-rise led to a negative coefficient. Unlike the main urban zone, scattered trees exerted positive effects. At the street level, bare rock and paved were positively associated with property values.
The outer suburban zone
Unlike the other zones, the presence of a living room did not result in the creation of a premium on housing prices in the outer suburban zone. Low floor levels also led to higher prices compared with middle floor levels. Most variables at the property level displayed effects on housing prices similar to those in SFML models 1 and 2, though distance to the closest metro station showed an insignificant effect in model 4a. Metro station density in the broader neighbourhood level showed positive coefficients which may be related to the premium brought by infrastructure, especially in areas with lower public facilities. Function mix, however, exerted negative coefficients, suggesting that people preferred areas with less functional mixes when selecting properties far away from the urban core.
For land-use forms in the immediate neighbourhood, the open high-rise and compact low-rise forms were important for higher property values. Similarly, low plants in the immediate neighbourhood delivered the highest positive effect among the different types of vegetation cover. At the street level, the open mid-rise form exhibited a positive effect in model 4b while street open low-rise form was associated with a negative coefficient.
Various effects across different zones
First, the varying effects of housing age were observed across spatial zones, and this is likely to be related to the different types of residential properties that were developed across and between phases. In the old urban centre, many historical buildings (e.g. traditional courtyards) have always been associated with very high property values due to their cultural and historical values and the nature of their scarcity. Most residential buildings in the suburban zones have been developed in the preceding three decades. That their relatively recent age produced negative effects is unsurprising. Second, accessibility to bus stops displayed varying influences across spatial zones. This may be related to varying positive and negative externalities brought by transport facilities across zones. Third, the non-significant effects of the density of metro stations in the two suburban zones and the negative coefficient in the old urban centre suggest that distance to the closest metro station is more important when it comes to explaining the variations in housing prices than the density of metro stations in the broader neighbourhood. Fourth, among different vegetation types, the low plants form delivered a premium in the main urban zone, and the inner and outer suburban zones, but did not do so in the old urban centre, whilst the scattered tree form was more favoured in the suburban zones rather than the two urban zones. Lastly, from a horizontal dimension, open forms in the immediate neighbourhood were considered a premium across zones. Mid-rise forms in the immediate neighbourhood, from a vertical dimension, exerted positive effects in most areas. Nevertheless, no universal answer exists in terms of what effects vertical and horizontal combinations of buildings and vegetation in the immediate neighbourhood and the wider street could bring. It follows that a localised approach when it comes to conducting additional empirical studies is required.
Conclusion
Moving beyond existing studies which have examine housing prices and their traditional determinants (e.g. structural and locational), this study contributes to research on the effects of new indicators of land-use configuration that can capture the three-dimensional characteristics of land use on variations in property value. Using an SFML modelling approach, the study captured spatial and multi-level effects to overcome previous methodological problems. The comparisons made between different models suggest that the SFML modelling is more effective than single-level spatial filtering models in housing market research. The differentiated effects from structural and locational factors further reinforce the importance of applying a multi-level spatial perspective in real estate research. Additionally, this study examined cross-level interaction effects between property level horizontal floor levels and key three-dimensional land-use composition variables at the broader neighbourhood level. The results suggest that people tended to pay more for neighbourhoods with openly arranged buildings, mid-rise forms, and low plants covers, indicating residents’ preferences when it comes to the quality and nature of their living environment. While middle floor levels were favoured in most cases, environments with compact low-rise building were consistently found to exert negative externalities.
By investigating the effects of land-use configuration variables through an SFML modelling approach, this study contributes to a growing body of research that grounds the dynamics of housing markets in the three-dimensional nature of urban space. Three main research directions are relevant for future studies: (1) investigating other potential interaction effects among variables at multiple levels; (2) conducting further ground-level studies of the three-dimensional built environments to enrich theoretical debates pertaining to vertical urbanisation; and (3) developing other relevant indicators to further detail the forms of urban land use with greater nuances.
Supplemental Material
Supplemental Material - Three-dimensional land-use configuration and property prices: A spatially filtered multi-level modelling perspective
Supplemental Material for Three-dimensional land-use configuration and property prices: A spatially filtered multi-level modelling perspective by Wei Zheng and Mingshu Wang in Environment and Planning B: Urban Analytics and City Science
Footnotes
Acknowledgements
We would like to thank Dr Chao Ren from the University of Hong Kong and her team for their provision of relevant datasets and advice on data analysis. We would like to thank Ms Xinyi Yuan from the University of Glasgow for her assistance in cartography and figure design.
Declaration of conflicting interests
The author(s) declared no potential conflicts of interest with respect to the research, authorship, and/or publication of this article.
Funding
The material in this research is based on research funded by the Leverhulme Early Career Fellowship (Grant No. ECF-2019-536) on ‘Can spatial decentralisation achieve sustainable urbanisation?’; University of Glasgow Reinvigorating Research Funding (Grant No. 201644-20).
Data Availability Statement
The data that support the findings of this study are available in the public domain, which includes Lianjia (https://bj.lianjia.com/), Gaode (https://gaode.com/), and World Urban Database (WUDAPT, ![]() ).
).
Supplemental Material
Supplemental material for this article is available online.
Note
References
Supplementary Material
Please find the following supplemental material available below.
For Open Access articles published under a Creative Commons License, all supplemental material carries the same license as the article it is associated with.
For non-Open Access articles published, all supplemental material carries a non-exclusive license, and permission requests for re-use of supplemental material or any part of supplemental material shall be sent directly to the copyright owner as specified in the copyright notice associated with the article.