
Abstract
To improve pedestrians’ wellbeing and walkability in urban environments, designs must address a range of factors. To enhance such designs, spatial assessments of urban attributes are important, as they may contribute to our understanding of the impact of the urban setting on peoples’ perceptions when traversing these areas. This research proposes a novel hybrid tool for conducting mesoscale analyses that enables the capturing of parameters that influence pedestrians’ visual perceptions, and in turn, generates opportunities for examining specific urban attributes. Such analysis is based on empirical, data-driven methodologies, bridging the gap between microscale and macroscale evaluations. A comparative analysis of three walkable New York City case studies is conducted to demonstrate the hybrid analysis tool, that is comprised of three models: dynamic visibility analysis for predicting perceived density (DVA-D); dynamic visibility analysis for predicting potential interactions with the defining street facades (DVA-I); and dynamic enclosure street section analysis (DESSA). Combined, these models simulate the pedestrians’ perceptions of the urban scape. While all three environments are similarly ranked in Walk Score®, they inherently differ in their perceived density, potential interactions, and enclosure. The hybrid assessment highlights the physical urban attributes of each case study with regards to pedestrians’ visual perception. The readability and visibility of this analysis results may provide architects, urban planners, and stakeholders with a valuable tool for urban decision-making.
Introduction
When addressing urban fabrics, spatial assessments could reveal their attributes and impact on peoples’ perceptions, behaviors, and wellbeing. Yet urban designs often lack uniform tools for defining, quantifying, and measuring them (Yin, 2014). Researchers have attempted to describe the complexity of urban structures, developing empirical analytical models for measuring a wide range of urban structure data (Batty, 2013).
Through comparative analysis of three New York City (NYC) case studies, this research presents hybrid mesoscale simulation models for measuring urban physical attributes associated with high walkability levels. These three analytical models simulate pedestrians’ visual perceptions of their surrounding urban landscape while walking: (1) dynamic visibility analysis for predicting perceived density (DVA-D); (2) dynamic visibility analysis for predicting potential interactions with the defining street facades (DVA-I); and (3) dynamic enclosure street section analysis (DESSA).
Walkability in urban settings
The term walkability is frequently addressed by urban planners and researchers, with walkable environments presenting a positive impact on people’s physical activity and health, reduced energy consumption, added economic value, and increased social connections (Forsyth, 2015; Lee and Talen, 2014; Lo, 2009; Speck, 2012). However, this elusive concept of walkability is also related to numerous physical and social qualities (Dovey and Pafka, 2020; Forsyth, 2015; Lo, 2009; Southworth, 2005). The advantages of walkable cities have been demonstrated in numerous studies (Forsyth, 2015; Wang and Yang, 2019), yet as walkable environments are influenced by their urban fabric, walkability can be interpreted in different ways.
To evaluate walkability, studies attempt to objectively measure subjective qualities of the urban street environment (Ewing and Clemente, 2013; Ewing and Handy, 2009). Five main urban design qualities were found: human scale, enclosure, imageability, transparency, and complexity. The most significant features in the pedestrian experience include the number of buildings with identifiers, proportions of first floor façades with windows, the number of pieces of public art, and long lines of sight (Ewing and Handy, 2009). When addressing pedestrian traffic volumes, some of the main streetscape features include proportion of windows on street, proportion of active street facades (Ewing et al., 2016).
Walkability assessment tools
Walkability assessments vary in type (qualitative/quantitative) and scale (micro/macro). Microscale methodologies focus on qualities that affect pedestrians’ direct experience, such as streetscape features (vegetation, public activity) and sidewalk conditions (Millstein et al., 2013). Microscale walkability indexes are conducted by surveyors, who traverse street segments, providing data that are not available on large-scale GIS databases. The Irvine-Minnesota-Index (IMI), for example, includes 162 items relating to various environmental features, covering 20 topics that measure characteristics such as streets, buildings, and amenities (Boarnet et al., 2006). The Microscale Audit of Pedestrian Perception Streetscapes (MAPS) (Millstein et al., 2013) examines 160 items microscale attributes relating to physical activity patterns, which were found to be independent of macro-level walkability (Cain et al., 2014).
Such audits can be used by non-professionals with relative ease, especially in areas where Geographic Information System (GIS) data is lacking (Brownson et al., 2009); yet they are resource consuming, as auditors must undergo training and then spend time on the street segment during the audit (Lee and Talen, 2014).
Alternatively, macroscale methodologies enable researchers to assess the characteristics of an entire area (such as overall street patterns), based on large-scale automated data (such as road networks) (Lee and Talen, 2014). Space-syntax tools (Hillier, 2007; Hillier and Hanson, 1984), for example, enable spatial formation analysis. When comparing space syntax analyses with traversing through different neighborhoods, Baran et al. (2008) found positive associations between the two. Yet while some macroscale space syntax approaches are applicable, they may be inadequate at the walkable scale, possibly due to microscale features such as trees and sidewalks, that cannot be accounted for in this method (Pafka et al., 2020). Walk Score® also enables analysis based on distance to the destination, block dimensions, and intersection densities, with data acquired through Google, Open Street Map, United States Census, etc. While this tool measures characteristics of the built environment in relation to the walking as a mode of transport, studies on Walk Score® indicate mixed findings, possibly due to different definitions of walkability (Hall and Ram, 2018). When studying inequity in neighborhood walkability in similar Walk Score® streetscapes, Bereitschaft (2017) discovered differences that could only be revealed in qualitative microscale evaluations.
Microscale and macroscale analyses have advantages and disadvantages. The former assesses features that directly impact the pedestrian experience, which is vital since the built environment (an “organized complexity” (Jacobs, 1961)) contains numerous attributes and contexts. The latter, however, delivers extensive overviews of specific qualities related to walkability, especially connectivity and access to amenities. Due to difficulties in effectively measuring microscale attributes, research studies may prefer macroscale GIS data (Boarnet et al., 2011). A recent literature review found that streetscape-related attributes comprised less than 5% of the measured design attributes, following difficulties in acquiring data and objective assessment methods (Fonseca et al., 2022). However, analyzing specific attributes may pose constraints by simplifying the urban-scape (Brownson et al., 2009; Dovey and Pafka, 2020). To overcome this gap, this paper presents a hybrid mesoscale analysis for reinforcing pedestrians’ visual perceptions as a possible option for decreasing the gap between the macroscale and microscale, based on 3D urban models.
3D virtual urban models for assessing pedestrian experiences
3D analytical tools can be used for creating simulations for assessing urban settings or supporting related decision-making (Biljecki et al., 2015). Some researchers refer to such models as an urban digital twin (Batty, 2018)—a concept and tool that were developed for generating revolutionary data-driven 3D city modeling (Yossef Ravid and Aharon-Gutman, 2022). 3D models could be used to evaluate urban design features that are related to visual perceptions of space (Fisher-Gewirtzman, 2012). Yin (2017) combined simple 3D extrusion models using GIS and 2D-GIS measurements, to objectively measure urban features (e.g., long sight lines and sky proportions); combined 2D variables and 3D visibility analyses were highly correlated with observed pedestrian counts and walk scores. Kaya and Mutlu (2017) used a 3D model to assess spatial enclosures of urban spaces, while Xu (2022) developed protocols using 3D environments to facilitate simulations of pedestrians’ dynamic visual experiences. Indeed, 3D digital twins offer an intermediate platform for conducting urban analysis, while varying levels of detail (according to data availability), scales (micro or macro coherence), and desired output (Biljecki et al., 2015).
This study presents hybrid measurements of three analytical models which utilize a 3D digital twin model. They measure quantifiable visibility parameters of the urban environment, including perceived density, potential pedestrian-streetscape frontage interactions, and enclosure, that all play a meaningful role in pedestrians’ wellbeing and walkability.
Measuring perceived density
As the same physical density of a setting can be perceived and evaluated differently, by different people and in different circumstances, “perceived density” is extremely important (Churchman, 1999). Moreover, constant density can be maintained while varying spaces between buildings, built typologies, and other spatial configurations (Fisher-Gewirtzman et al., 2003). The visual perception of a space is a main factor in defining spatial experience and cognition of architectural or urban space (Koltsova et al., 2013), and the same objective density of alternative spatial configurations can be perceived differently (Fisher-Gewirtzman et al., 2003; Fisher-Gewirtzman, 2018a). The Spatial Openness Index (SOI) was one of the first attempts to quantify perceived density (Fisher-Gewirtzman and Wagner, 2003), measuring the volume of a visible space from different viewpoints. An updated model enables the measuring of the accumulated length of lines of sight from each viewpoint, also associated with perceived density, whereby the higher the value, the higher the perceived openness and the lower the perceived density (Fisher-Gewirtzman, 2018a, 2018b; Mor et al., 2021). In addition to measuring perceived density, the paper proposes a novel measurement, based on the same methodology—“potential interaction.”
Potential interaction
The term “potential interaction” refers to possible interactions between pedestrians and their urban surroundings, such as transparent commercial facades rather than empty facades that are void of activity (Ewing and Handy, 2009; Gehl, 2010; Gehl et al., 2006; Mehta, 2009). With potential interactions, it is assumed that the closer the pedestrian is to positive “transparent” urban elements, the higher the potential for interactions between them. In this paper, potential interaction is defined by measuring lines of sight from every defined viewpoint, whereby the shorter the lines of sight towards “transparent” facades, the higher the potential for interaction. The Dynamic Visibility Analysis (DVA) enables simulations of the perceived density of a pedestrian along an urban route (Fisher-Gewirtzman and Bruchim, 2018) and their potential interaction. Additional information on the DVA is provided in the Methodology Chapter and the supplementary material.
Enclosure
The term enclosure refers to urban settings where vertical elements visually define streets and public spaces (Ewing and Handy, 2009; Jacobs, 1993). The enclosure is affected by building heights along both sides of the street (Lindal and Hartig, 2013), whereby the higher the vertical defining surface, the higher the sense of enclosure (Stamps, 2005). However, this increase is not linear, as differences in sense of enclosure between two and four-story buildings can be greater than differences between four and six-story buildings. Moreover, this may correlate with the three vertical thresholds (Gehl, 2010) of buildings, based on their potential interaction with their surroundings and streetscape: (1) floors 1–2 (0–6.5 m) are the most important; (2) floors 3–5 (6.5–13.5 m) are still near enough to the street to stimulate interactions with other pedestrians; and (3) floors six and upwards (≥13.5 m), where no such interaction is feasible. This sense of enclosure can be measured by the enclosure rate, that is, the ratio between the building’s height and street width. Studies indicated that a 1:2–3:2 ratio is considered comfortable (Alexander et al., 1977; Jacobs, 1993), compared to a 1:6 ratio, where pedestrians tend to lose their sense of enclosure (Duany and Plater-Zyberk, 2014). Additionally, higher levels of enclosure might detract from the pedestrian’s experience, by blocking sunlight, for example (Park et al., 2019). A sense of enclosure is also affected by pedestrians’ visual perceptions (Kaya and Mutlu, 2017), as long lines of sight may undermine the sense of enclosure (Ewing and Handy, 2009). Additional factors regarding enclosure and visibility include the pedestrians’ perceived interaction with the street and ground floor from their viewpoint (Mehta, 2009; Rapoport, 1977).
Accordingly, this study proposes a hybrid analysis tool for measuring visibility and enclosure rates as visually perceived by the pedestrian. Specifically, this tool measures the following geometrical features that are essential to pedestrian’s experiences: (1) proportions of street walls (enclosure); (2) proportions of active street frontages for potential human interaction; and (3) accumulated lines of sight from each indicated viewpoint (perceived density).
Methodology
The aim of this study was to explore the proposed hybrid analyses as a comprehensive visibility analysis tool, that enables the simulation and assessment of pedestrians’ visibility perceptions in urban settings. The study also strives to perform comparative analyses between three NYC case studies that have similar Walk Score® evaluations, to demonstrate this hybrid analysis tool. To do so, the analysis is conducted through a virtual twin model (Figure 1). Hybrid analysis methodology.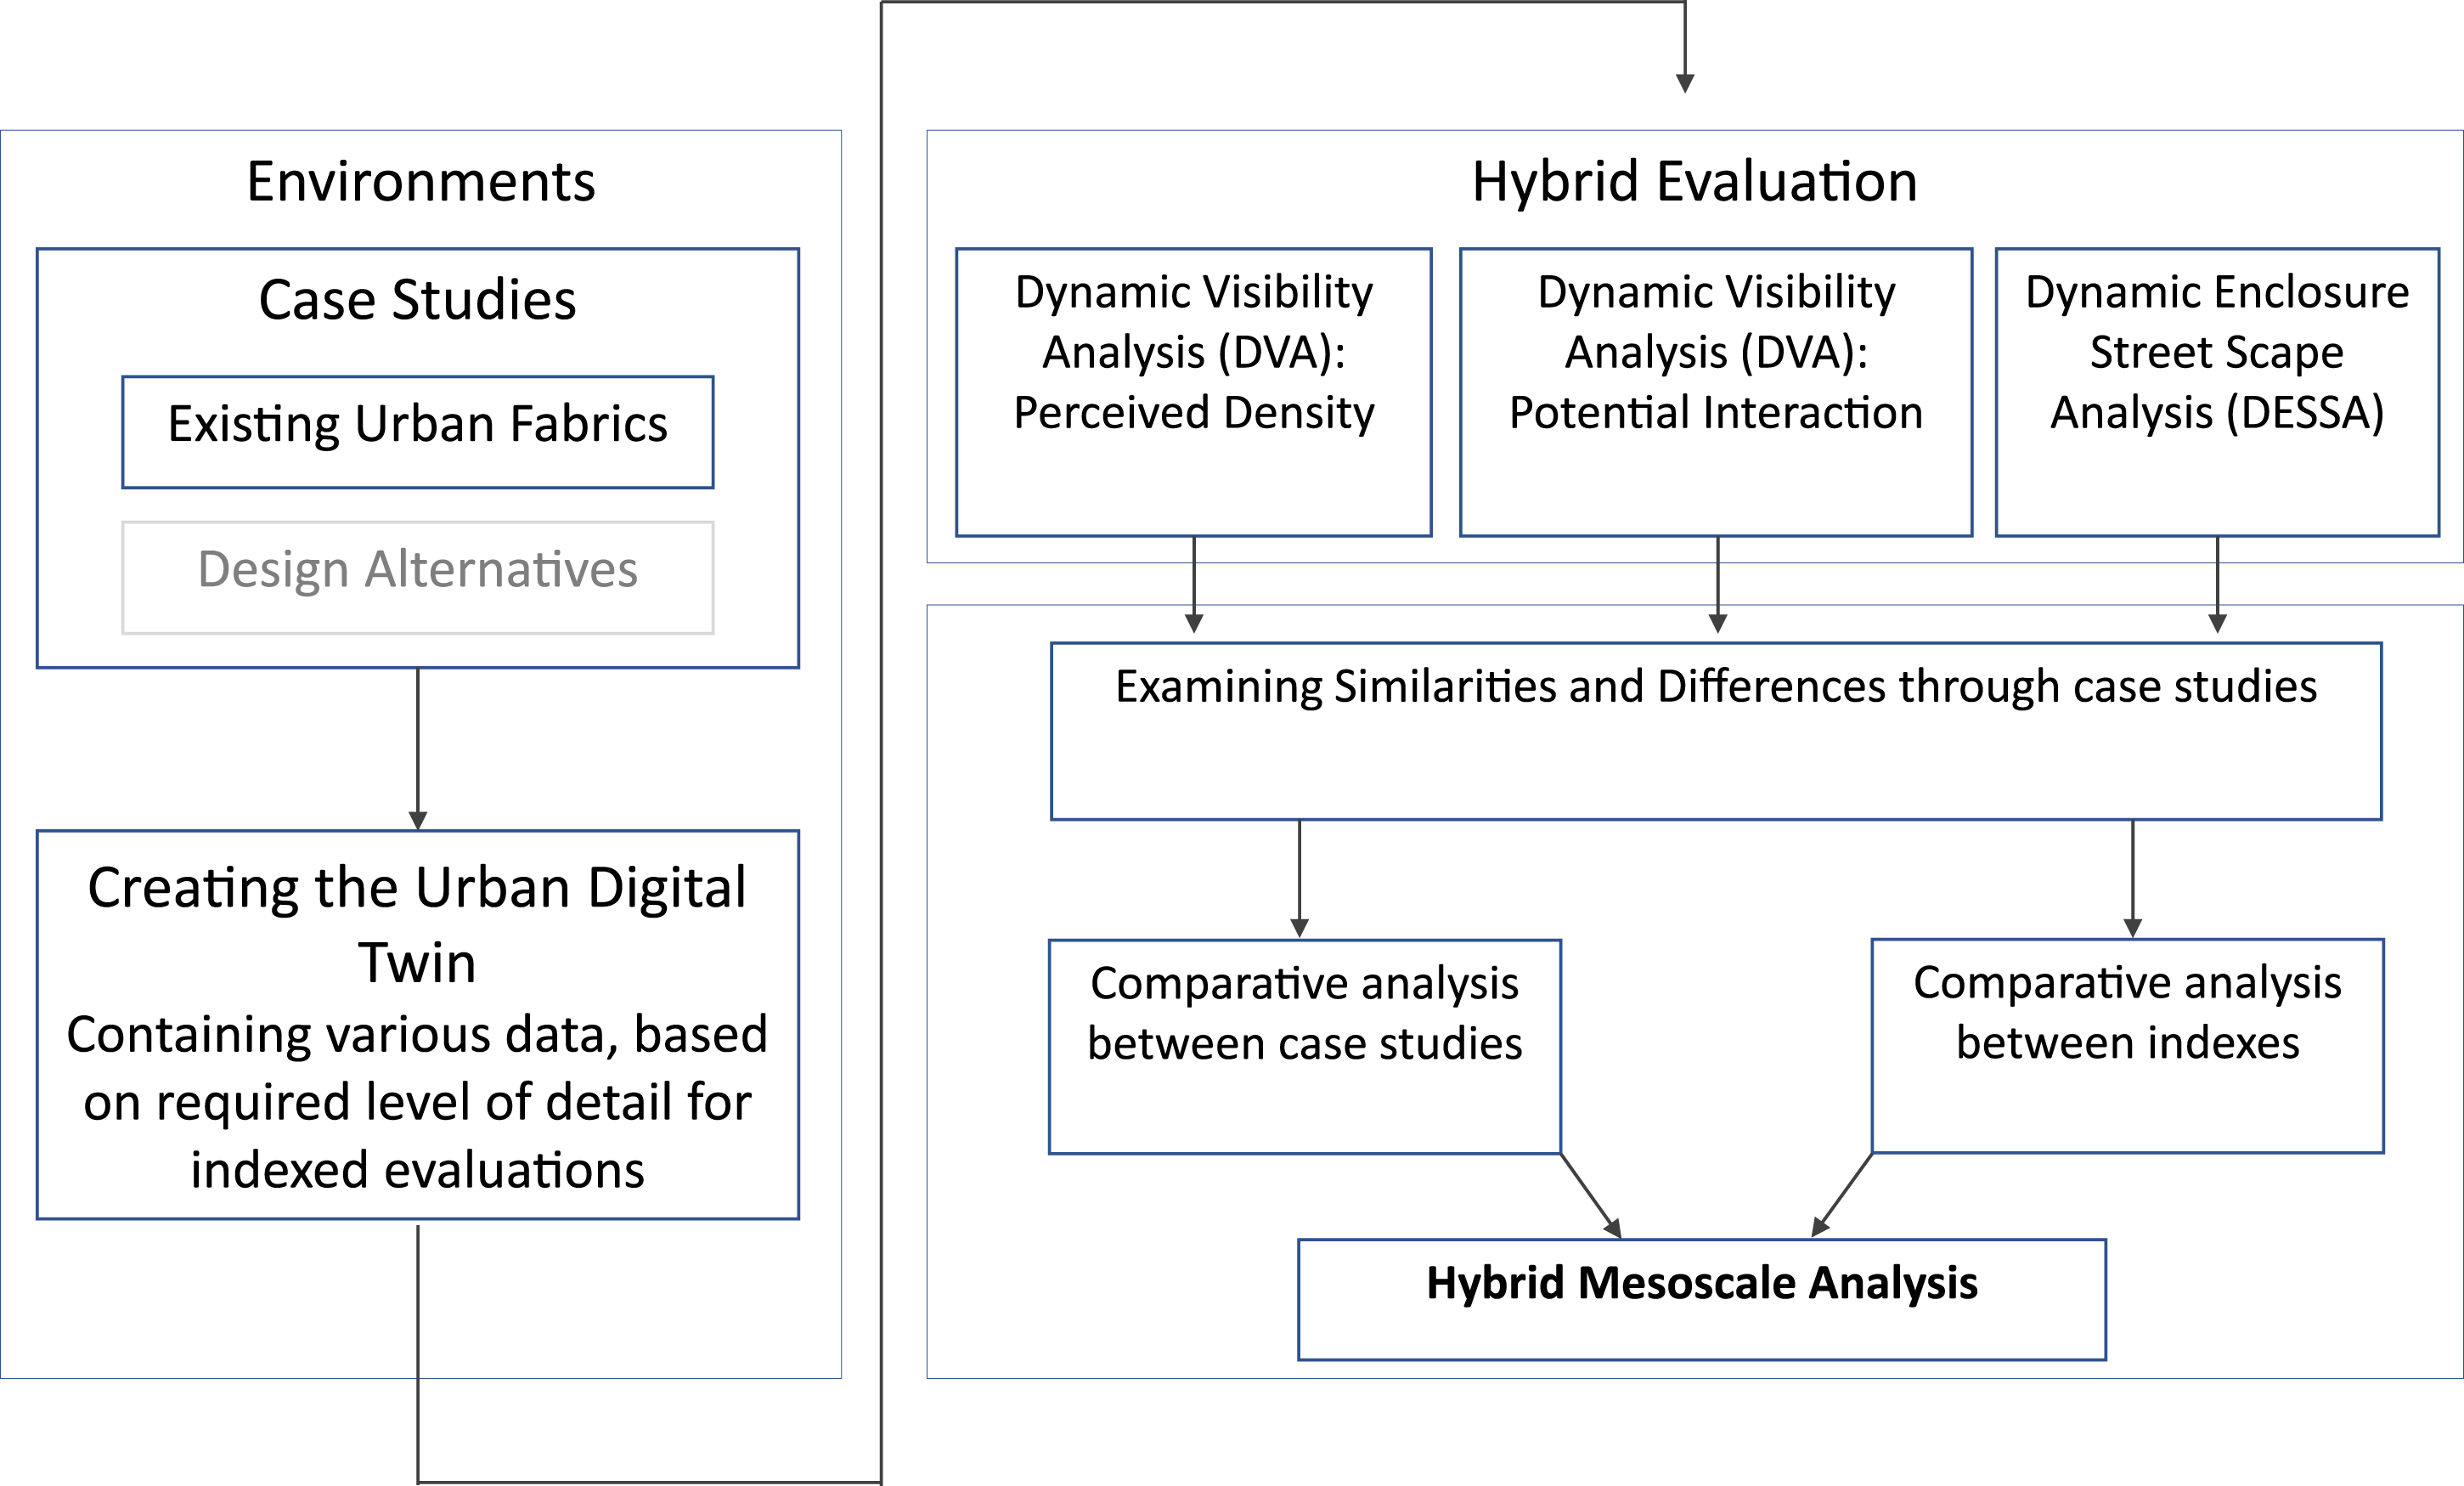
The analytical models: DVA and DESSA
In this research, the DVA model simulates and predicts pedestrians’ visual perceptions while traversing along urban paths. This visibility analysis simulation is based on the accumulated lines of sight, from predefined viewpoints along a designated route in the urban digital twin (Figure S1, Supplementary Material). The spatial elements of the digital twin are differentiated by surface types, representing different elements of the environment, built morphology, and streetscape (e.g., sky, trees and parks, roads, and buildings), and their uses (e.g., commercial, residential, or offices) (Figure S2, Supplementary Material). The model was assessed through a VR experiment (Fisher-Gewirtzman, 2018b).
In the DVA-D model (indicating perceived density), the length of every line of sight (i.e., the distance between the pedestrian’s eye and the target element), is added to an accumulated score, whereby the higher the value, the further the visual elements are from the viewpoint, and the higher the perceived openness, the lower the perceived density (Fisher-Gewirtzman 2018a, 2018b). In this study, we expand on the existing DVA model by measuring potential interactions with streetscape facades along the pedestrian path. This model also addresses vertical thresholds (Gehl 2010), whereby the first threshold is most important to street activity, while the last one is the upper limit for interactions with the street. In the DVA-I model (indicating potential interaction), the inverse square root of the length of every line of sight is added to an accumulated score, whereby the higher the value, the closer the visual elements, and the higher the potential for interactions between them and the pedestrian at the given viewpoint.
These DVA measurements could provide insights into visual perceptions of urban morphology, in terms of both visual openness (perceived density) and the potential interaction—as derived from the pedestrian’s distance to the buildings.
The DESSA model is a novel analytical tool that generates a series of street sections in sequential order along the pedestrian path, thereby examining spatial relationships between the vertical definitions of buildings and the street (i.e., the enclosure ratio). For each section, the DESSA measures the height of left edge of street = H(L), height of right edge = H(R), and total distance between built vertical street edge = D. The gathered data is then used to calculate the enclosure ratio of each vertical definition (Figures S3, S4, Supplementary Material). Both models (DVA and DESSA) operate synchronously in a 3D urban digital twin and were developed using Grasshopper and Rhinoceros 3D software.
Relations between analyses and comparisons between the case studies
To demonstrate the hybrid analyses, three case studies were chosen in NYC (Figure 2). The main reason for selecting NYC for the case studies was access to readily available public urban data (twin model, buildings, uses, trees, roads, and sidewalks) which generated a detailed twin model suitable for DVA-D, DVA-I, and DESSA analyses. The case studies are located in different areas of the city. They were chosen due to differences in built morphology, types of uses and vegetation while maintaining similar street widths of approximately 30 m, in addition to achieving similar excellent scores (“Walkers’ Paradise”) in Walkscore®: 100, 97, and 95, respectively. One of our goals was to examine how mesoscale analysis would detect differences in pedestrian experience between streets with similar Walkscore results. Three Case Study Environments. Image captures from Google Street View (www.google.com/maps).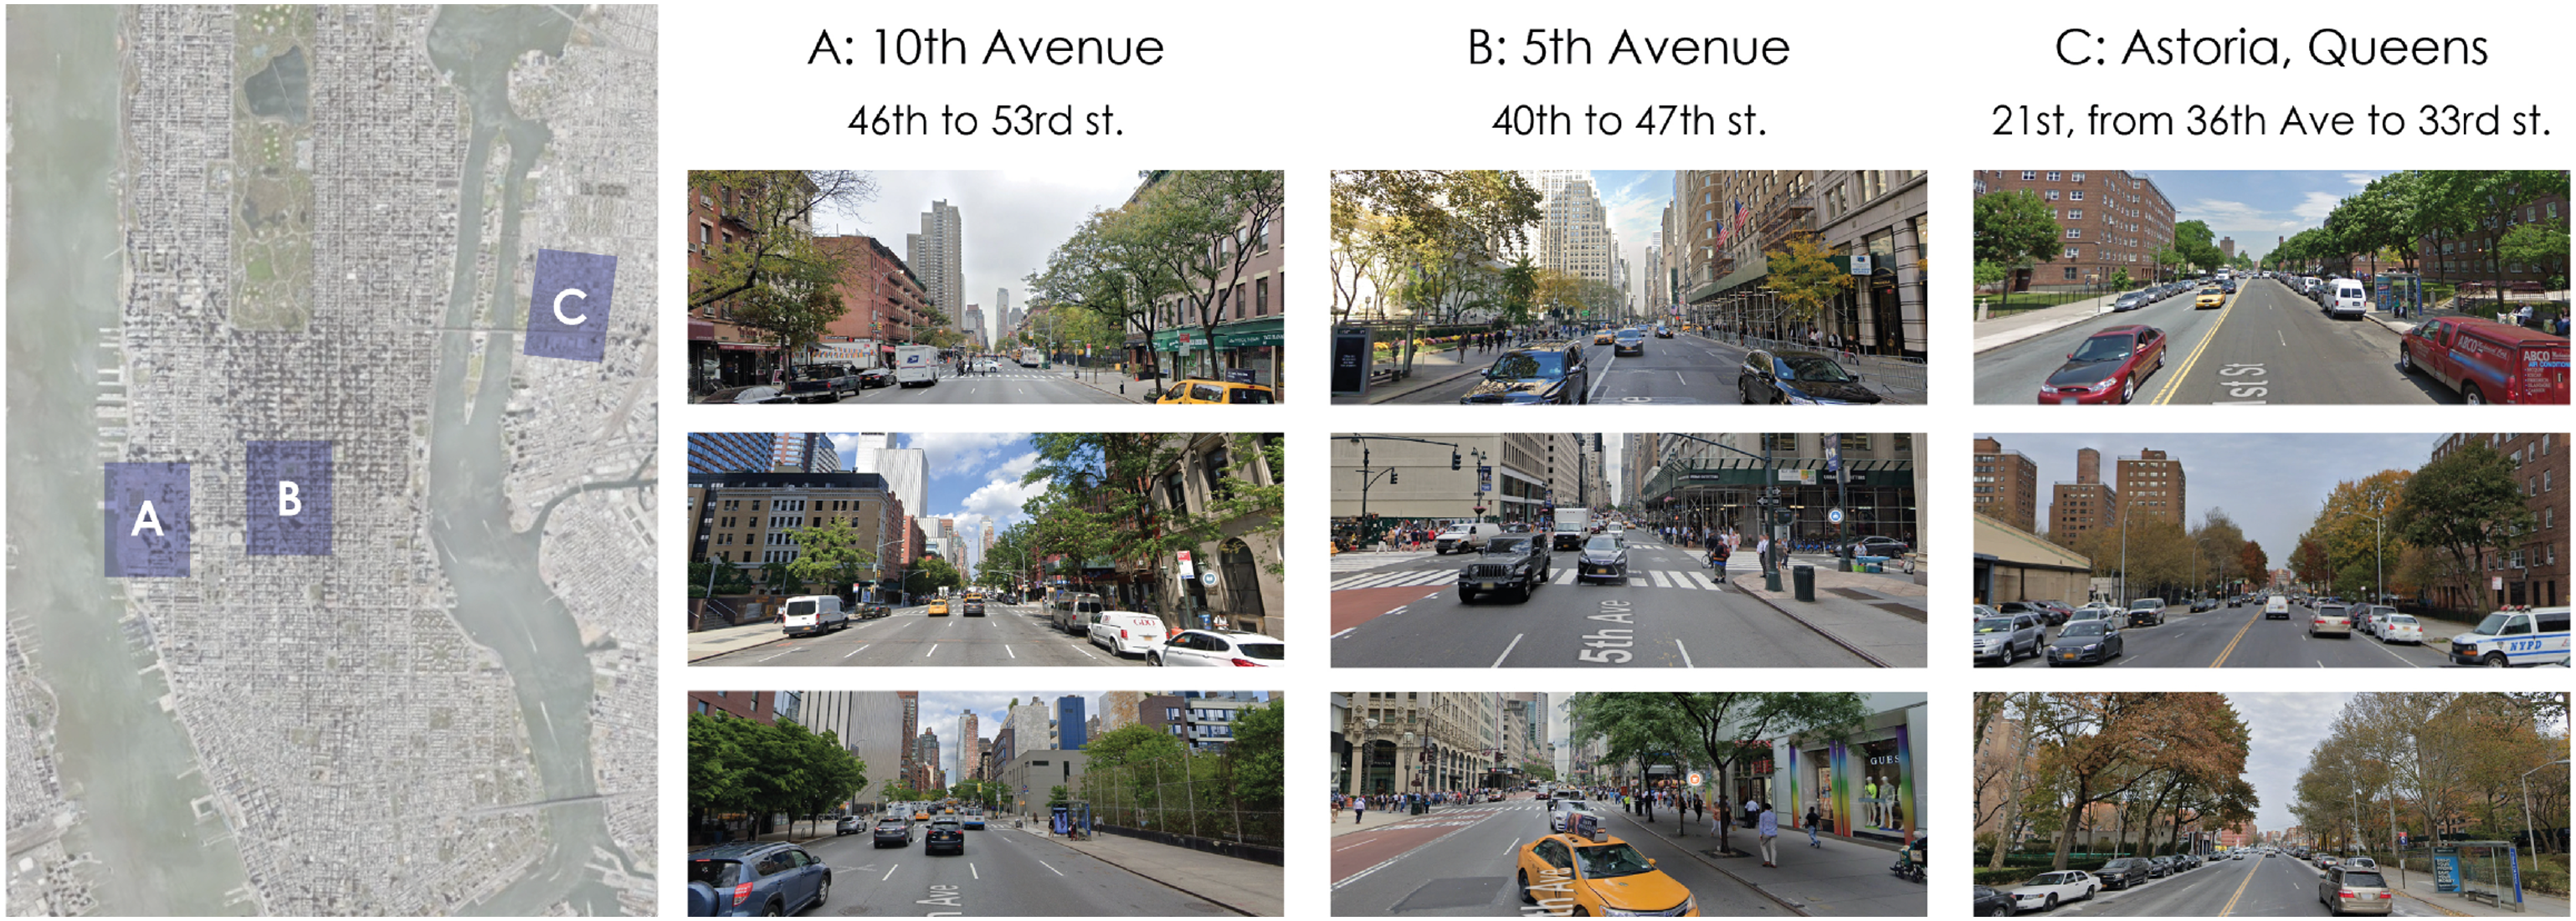
Environment A: 10th Avenue, Manhattan, between 46th and 53rd Street. This mixed-use avenue has commercial facades; most buildings are five-story residential buildings, with some sporadic high-rise buildings.
Environment B: fifth Avenue, Manhattan, between 40th and 47th Street. This main avenue has a high volume of commercial activity, with mainly high-rise building.
Environment C: 21st Street, Astoria, Queens, between 36th Avenue and 33rd Street. This streetscape is characterized by 9-15-story apartment buildings (without active ground floors) that are distanced from the street, which are abundant with trees.
These environments differ in their total built area. Environment B’s total built area is 380% of Environment C’s, and 320% of Environment A’s. 1
For each case study, a 3D digital twin model was created based on open-source data, containing data about sidewalks, roads, trees, parks, and buildings, differentiated by uses, and split into Gehl’s (2010) three vertical thresholds of interaction (0–6.5 m, 6.5–13.5 m, and ≥13.5 m). Additional information on the Digital twin can be found in the attached supplementary materials. Each model was tested at 100 points: every 5m along a 500m route, ensuring that each individual building was covered.
Results
The DVA-D model
This model addresses buildings, streetscape, sky, and vegetation. Previous findings indicate that the higher the score, the lower the perceived density (Fisher-Gewirtzman 2018a, 2018b), as seen in Figure 3 (and Table S1, Supplementary Material). The highest scores using this model were seen for Environment C (170% of the scores of environments A and B, which were identical). The high results for Environment C stem mainly from its extensive sky exposure; as Environment C scored maximum visual openness, it should be perceived as least dense. The highest visibility score in the building category was seen for Environment B, which was approximately twice that of Environment C, and 150% of Environment A. DVA-D results (perceived density).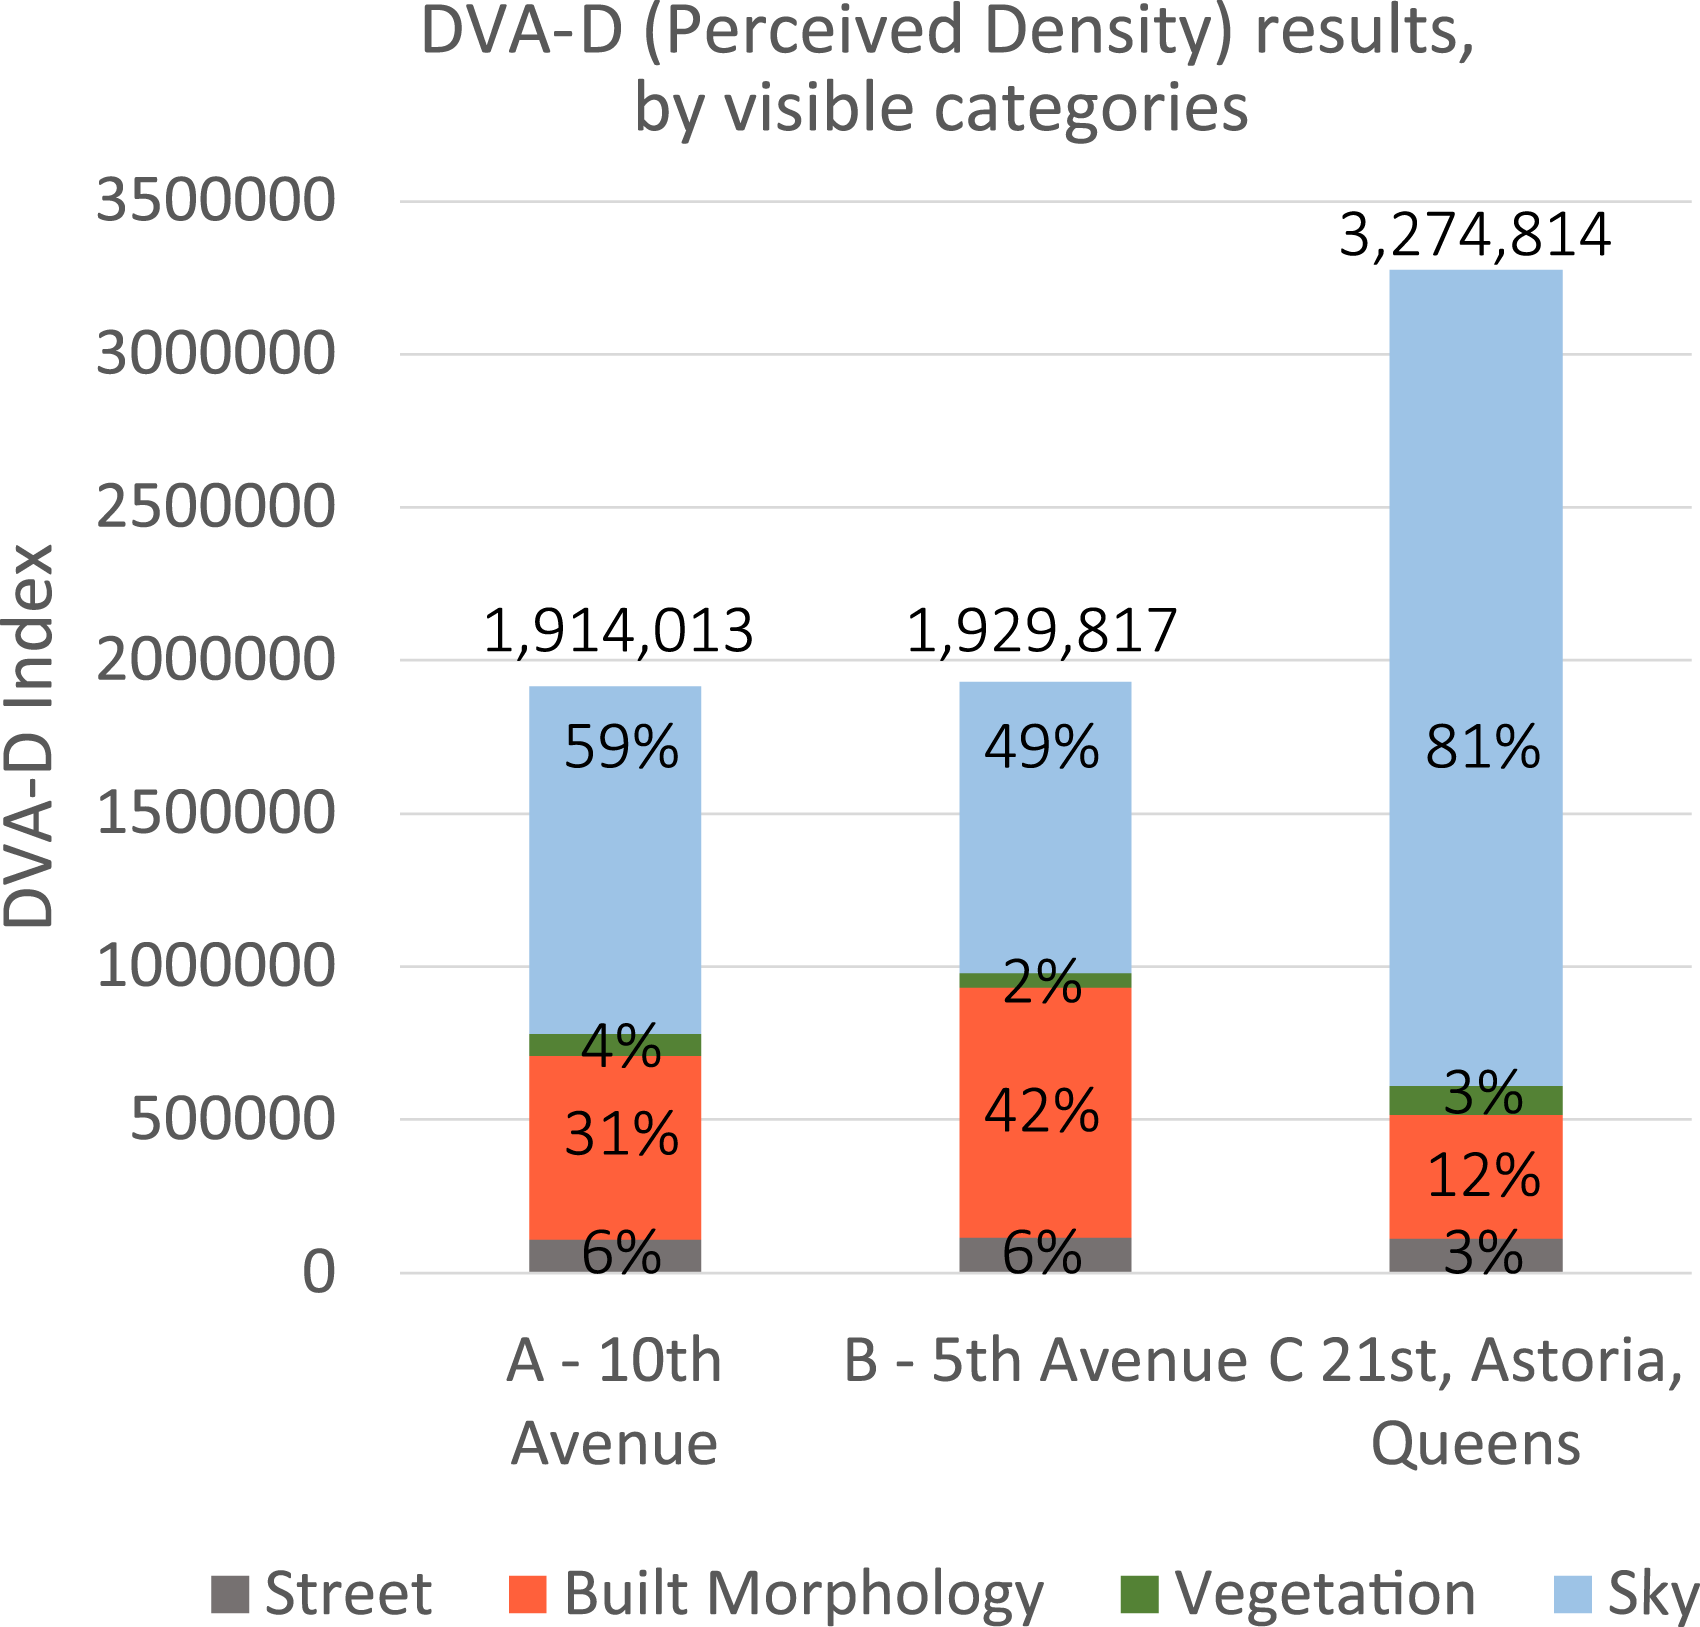
Considering the differences in the built volumes, Environment A holds the highest score for visual openness, indicating lower perceived density of its built morphology. In other words, the ratio of the DVA-D results (built morphology) and the built volume along each environment is highest for Environment A, and lowest for Environment B. Moreover, Environment B has least visibility of vegetation, while Environment C had the highest, as it was the greenest environment, with trees around buildings and along the street.
DVA-I results
This model is based on the different uses of the built environment categories and Gehl’s (2010) vertical thresholds. Figure 4 (and Table S2, Supplementary Material) visualize the results for the thresholds (0–6.5 m, 6.5–13.5 m). The higher the score for each category, the closer the target objects are to the pedestrian, and the higher the potential interaction. Environment A scored the highest, yet was closely followed by Environment B (91% compared to Environment A). Environment C scored the lowest. The commercial activity in the first threshold (0–6.5 m), which has the highest impact on walkability, was almost identical in Environments A and B. However, the total retail area in Environment B was 750% compared to Environment A. The difference between the routes stemmed from their different types of retail, with Environment A being comprised mainly of small shops, while Environment B was comprised mainly of large department stores. DVA-I results, (potential interaction).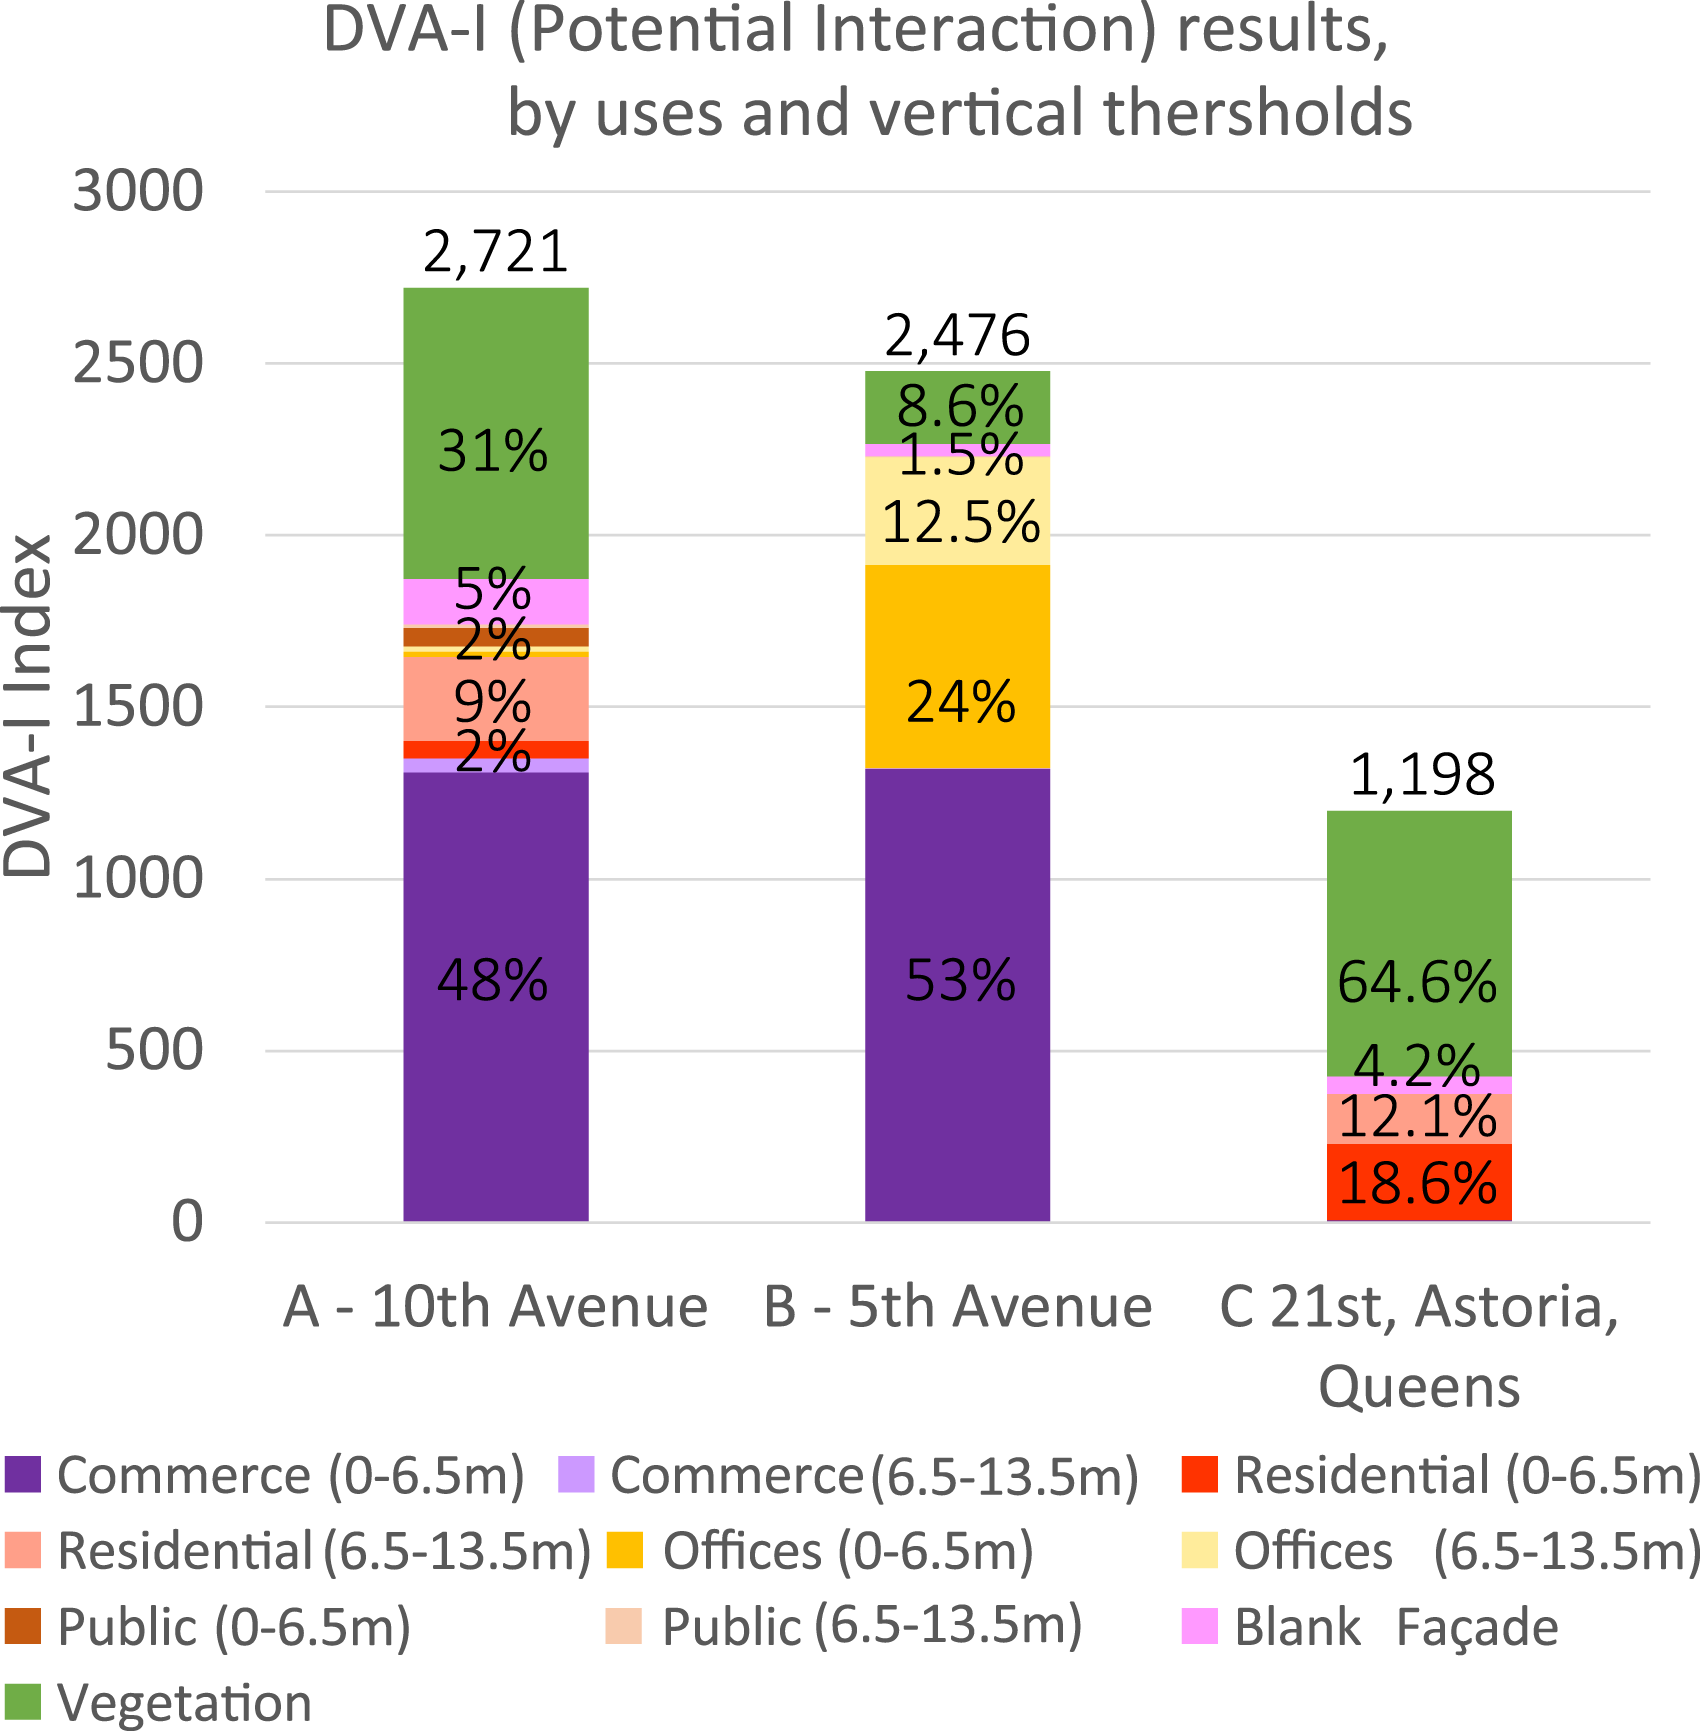
The remainder of the interaction results in Environment A stemmed mainly from trees and parks (31%), residential buildings (6.5–13.5 m) above street shop fronts (9%), and blank facades (5%) such as fences and windowless facades. In Environment B, the potential interaction with non-commercial facades was mainly generated by office lobbies (0–6.5 m) (24%) and offices (6.5–13.5 m) (12.6%), followed by vegetation (8.6%) and some blank facades (1.5%). The interaction results for Environment C stemmed mainly from vegetation (64%), followed by residential buildings (28.7%)—due to the abundance of trees along the street and within the lots, and larger distances between sidewalks and buildings. In terms of overall potential interactions with the street, Environment A offered the highest potential, yet in terms of built environment alone (excluding vegetation), Environment B ranked higher.
DESSA results
DESSA results.
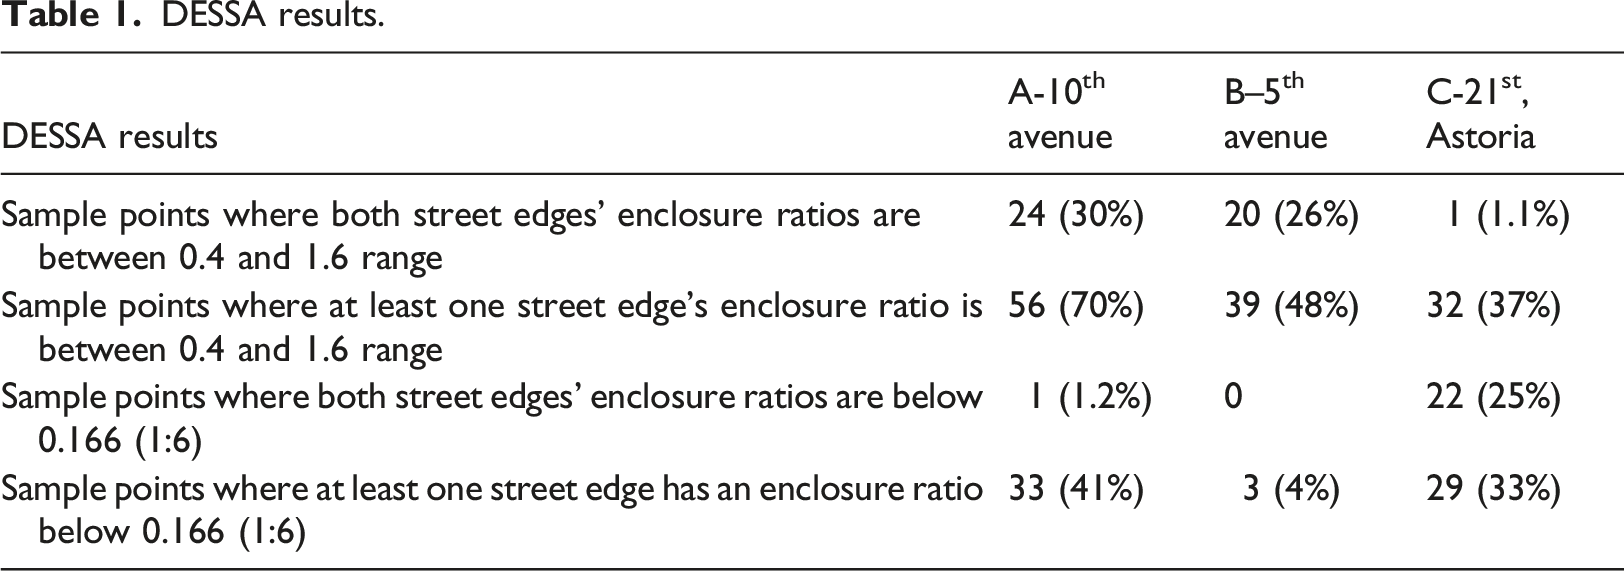
Finally, an enclosure ratio lower than 1:6 was only seen in one-quarter of Environment C’s route, indicating that this built environment may fail to provide a sense of enclosure. Interestingly, in Environment A, the enclosure ratio of a single built edge was lower than 1:6 in 41% of the sample points along the route, due to empty lots and small parks. However, in 94% of the sampled points, the opposite street edge held an enclosure ratio larger than 1:6, with 58% of these ratios being between 1:2 and 3:2. This suggests that varied enclosure situations should be represented in a less rigid framework.
Hybrid comparative analysis results
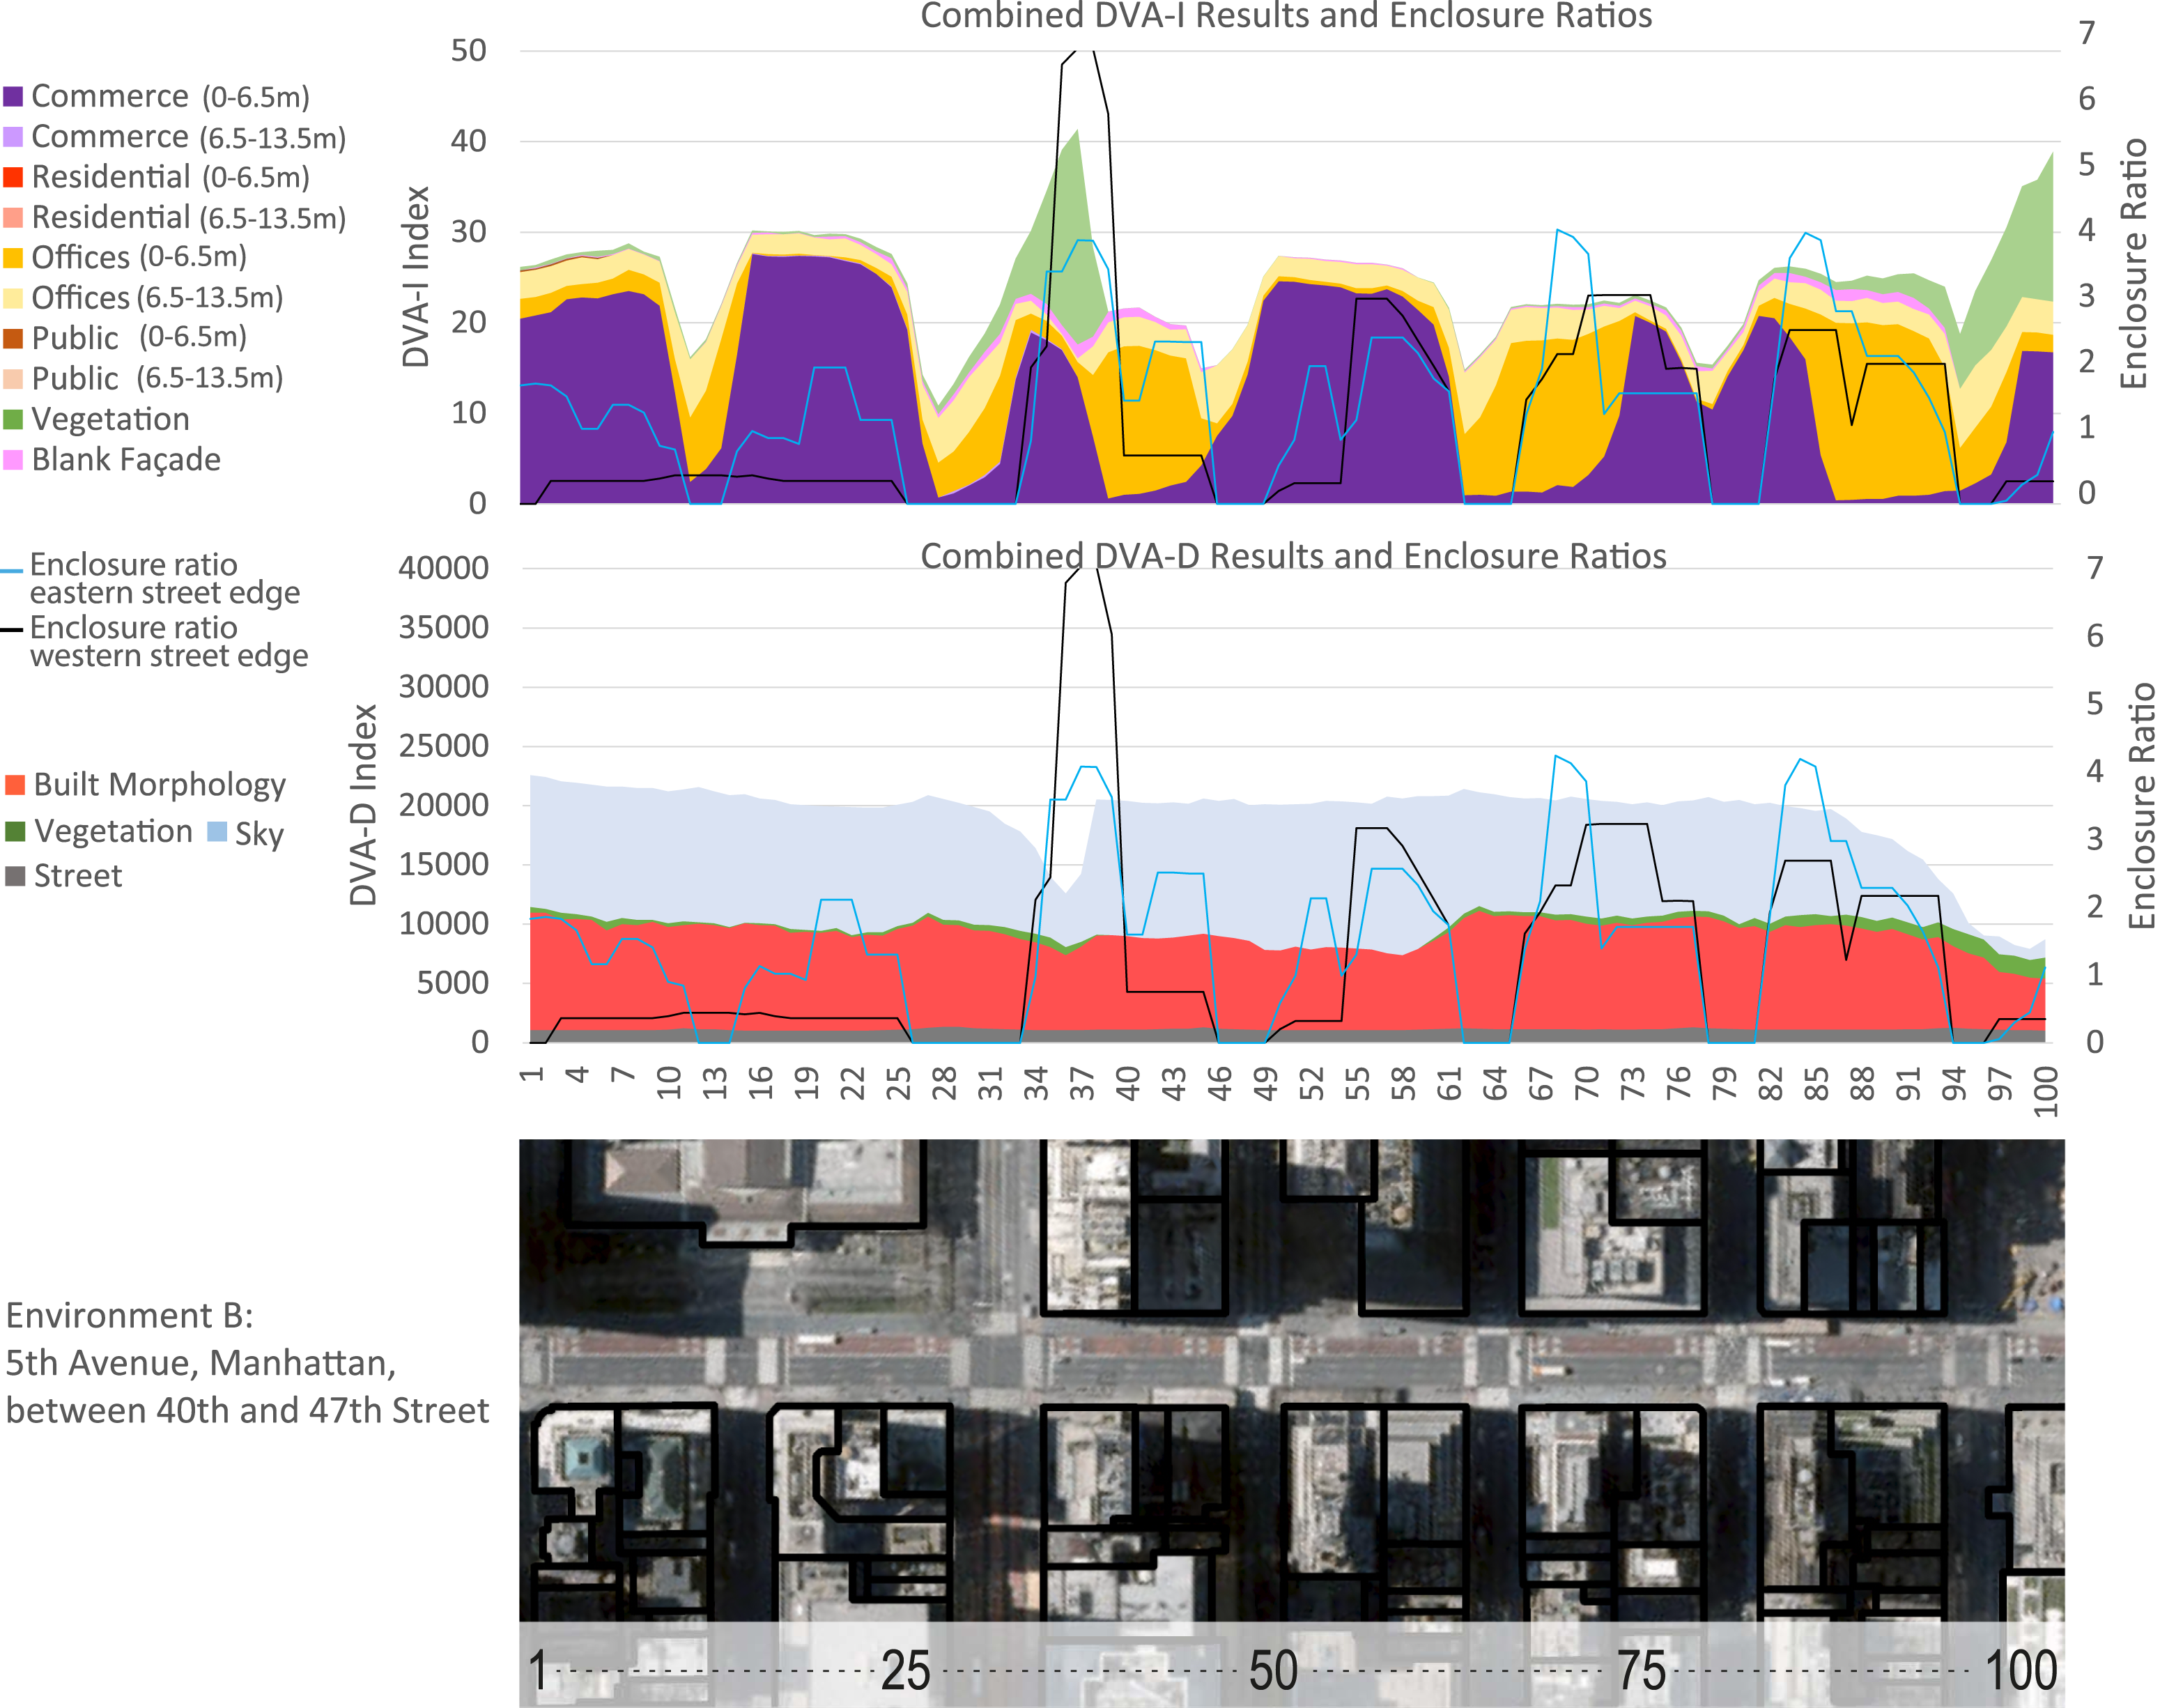
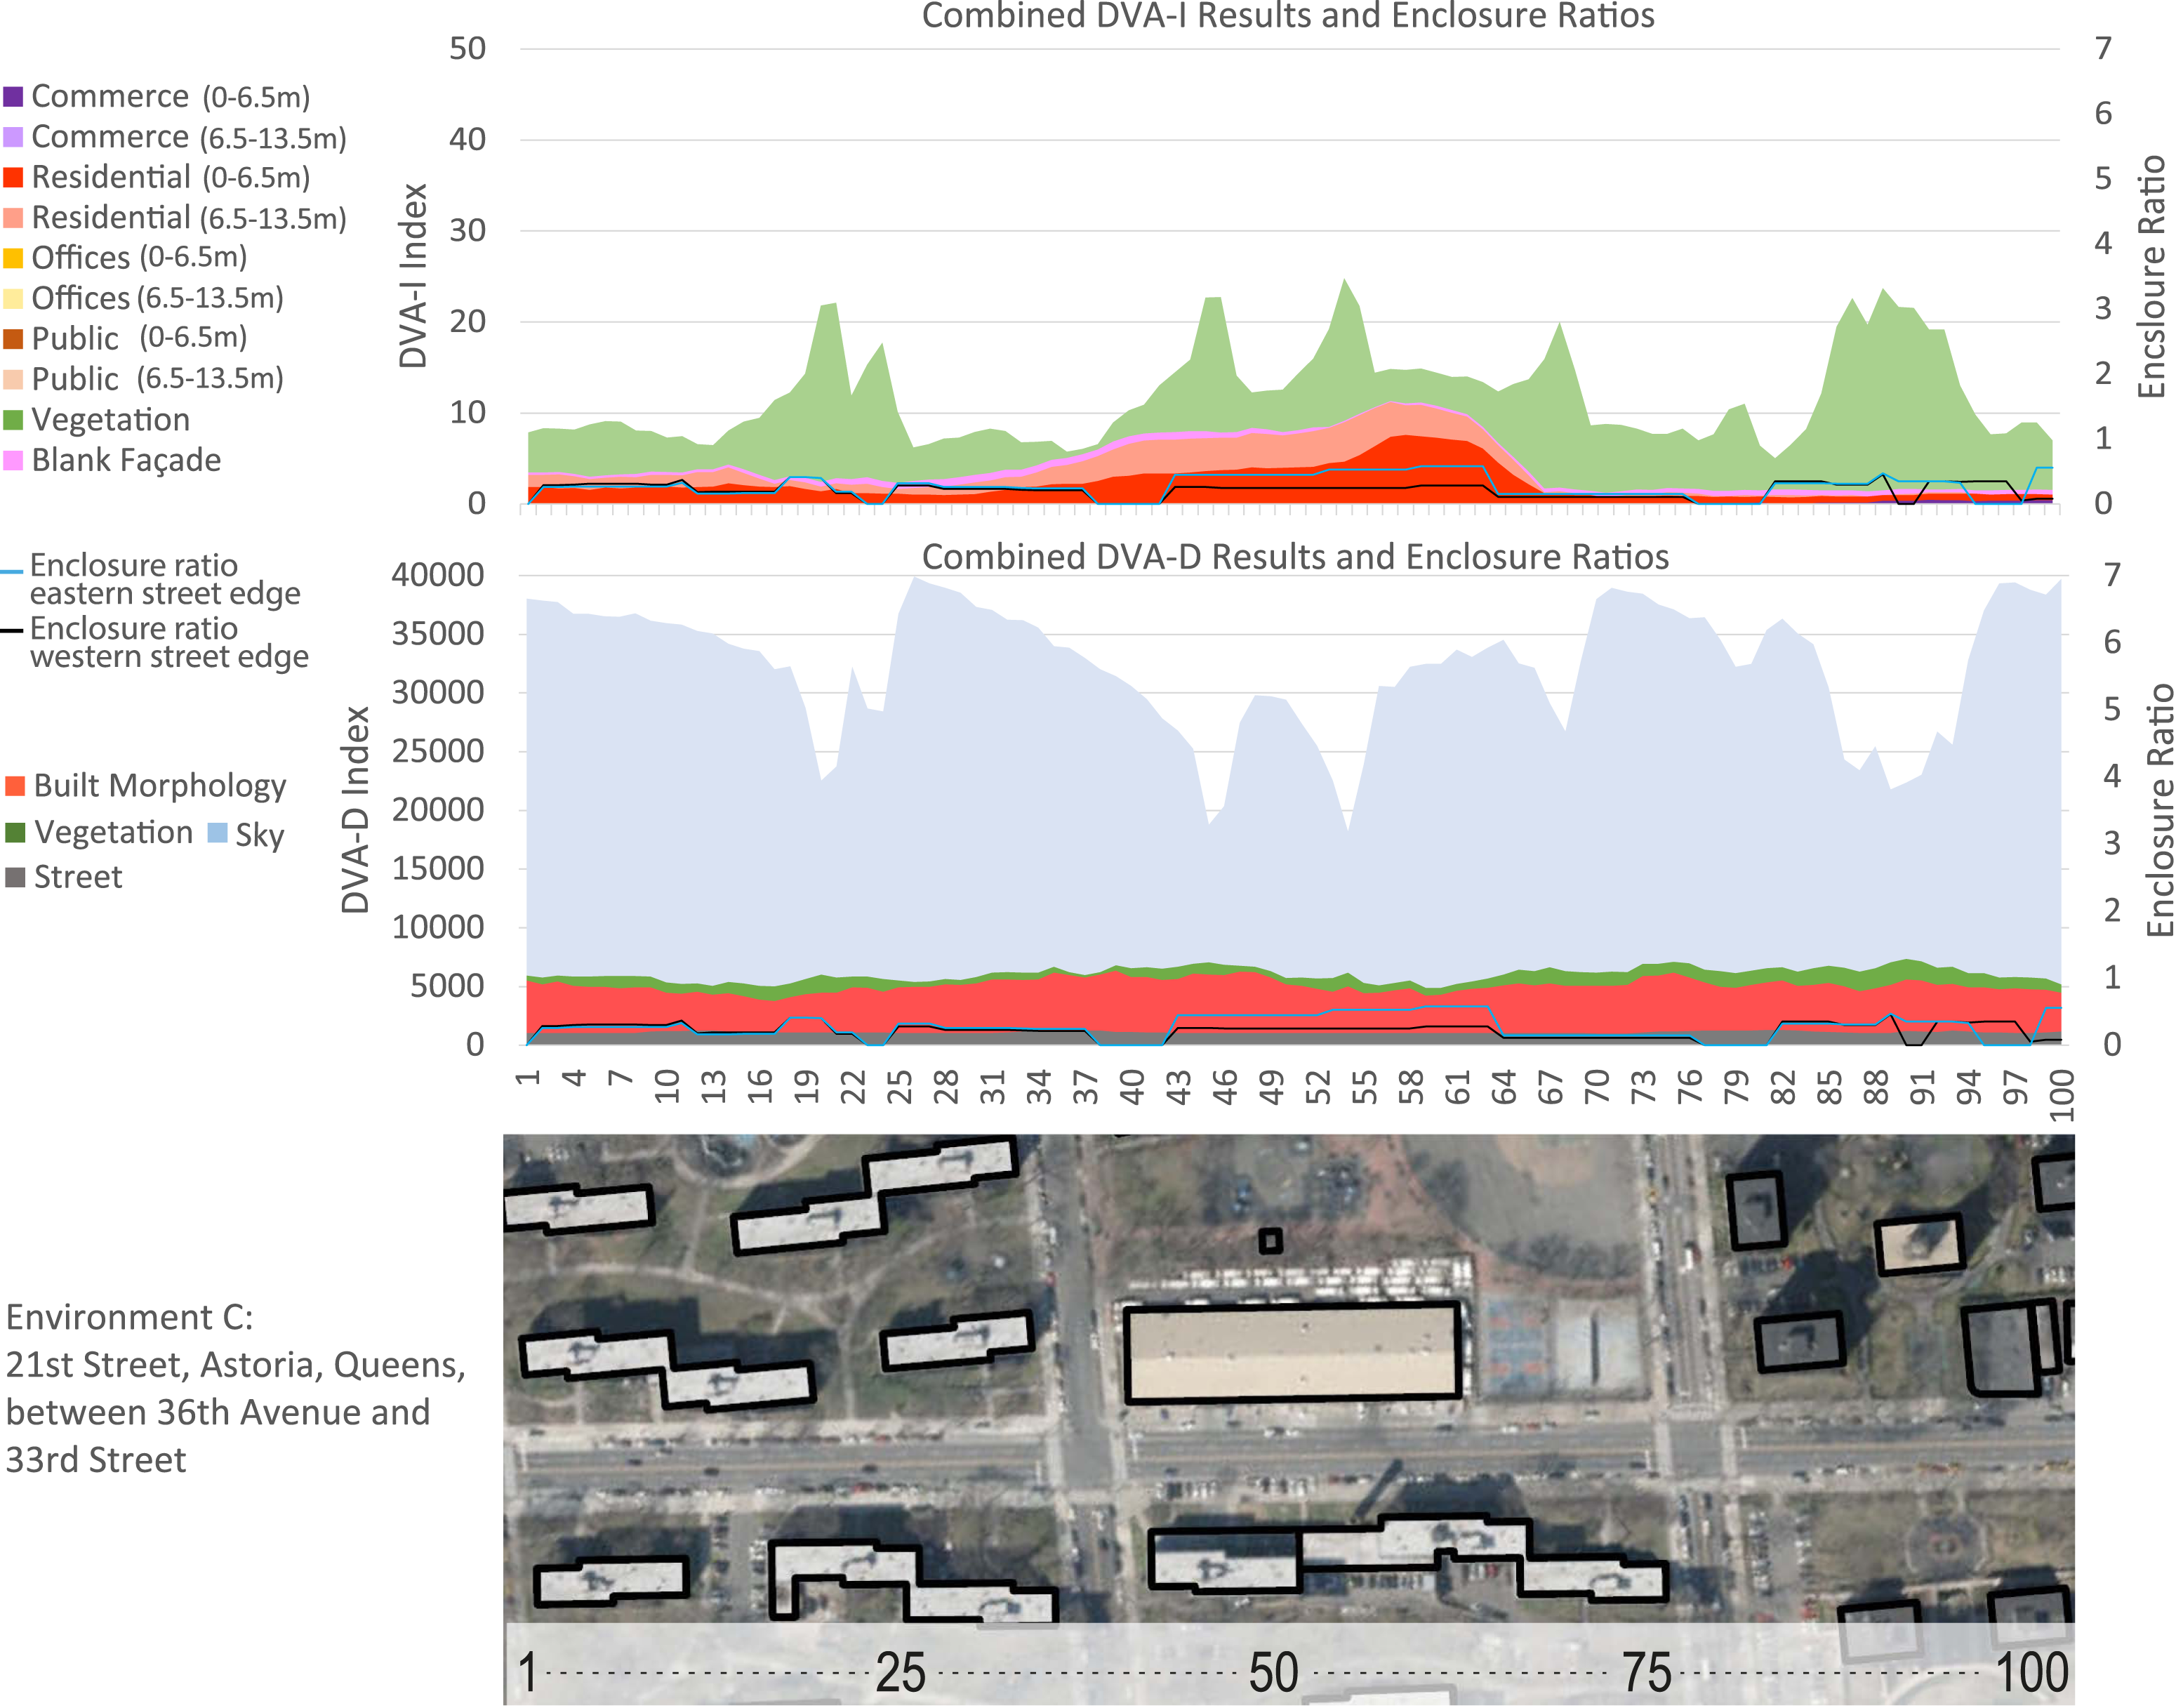
Hybrid comparative analyses of the three case studies may offer insights into relationships between enclosure, potential interactions, and perceive density. Not surprisingly, areas with higher enclosure ratios scored less on the visual openness index (DVA-D) in all Environments, as seen in sample points 49–55 in Environment A (Figure 5), and in sample points 33–38 in Environment B (Figure 6). These findings are in line with previous studies, whereby long lines of sight may hinder the sense of enclosure (Ewing and Handy, 2009). The DVA-I results were lower for street intersections in Environments A and B, due to continuous built morphology which encloses streets (Figures 6 and 7). Finally, in Environment C, the lack of enclosure along the street (caused by the distance between the building and the sidewalks) was responsible for the low interaction results (Figure 7). Results of the three analyses: combined DVA-D results and enclosure ratios and combined DVA-I results and enclosure ratios, Environment A. Results of the three analyses: combined DVA-D results and enclosure ratios and combined DVA-I results and enclosure ratios, Environment B. Results of the three analyses: combined DVA-D results and enclosure ratios and combined DVA-I results and enclosure ratios, Environment C.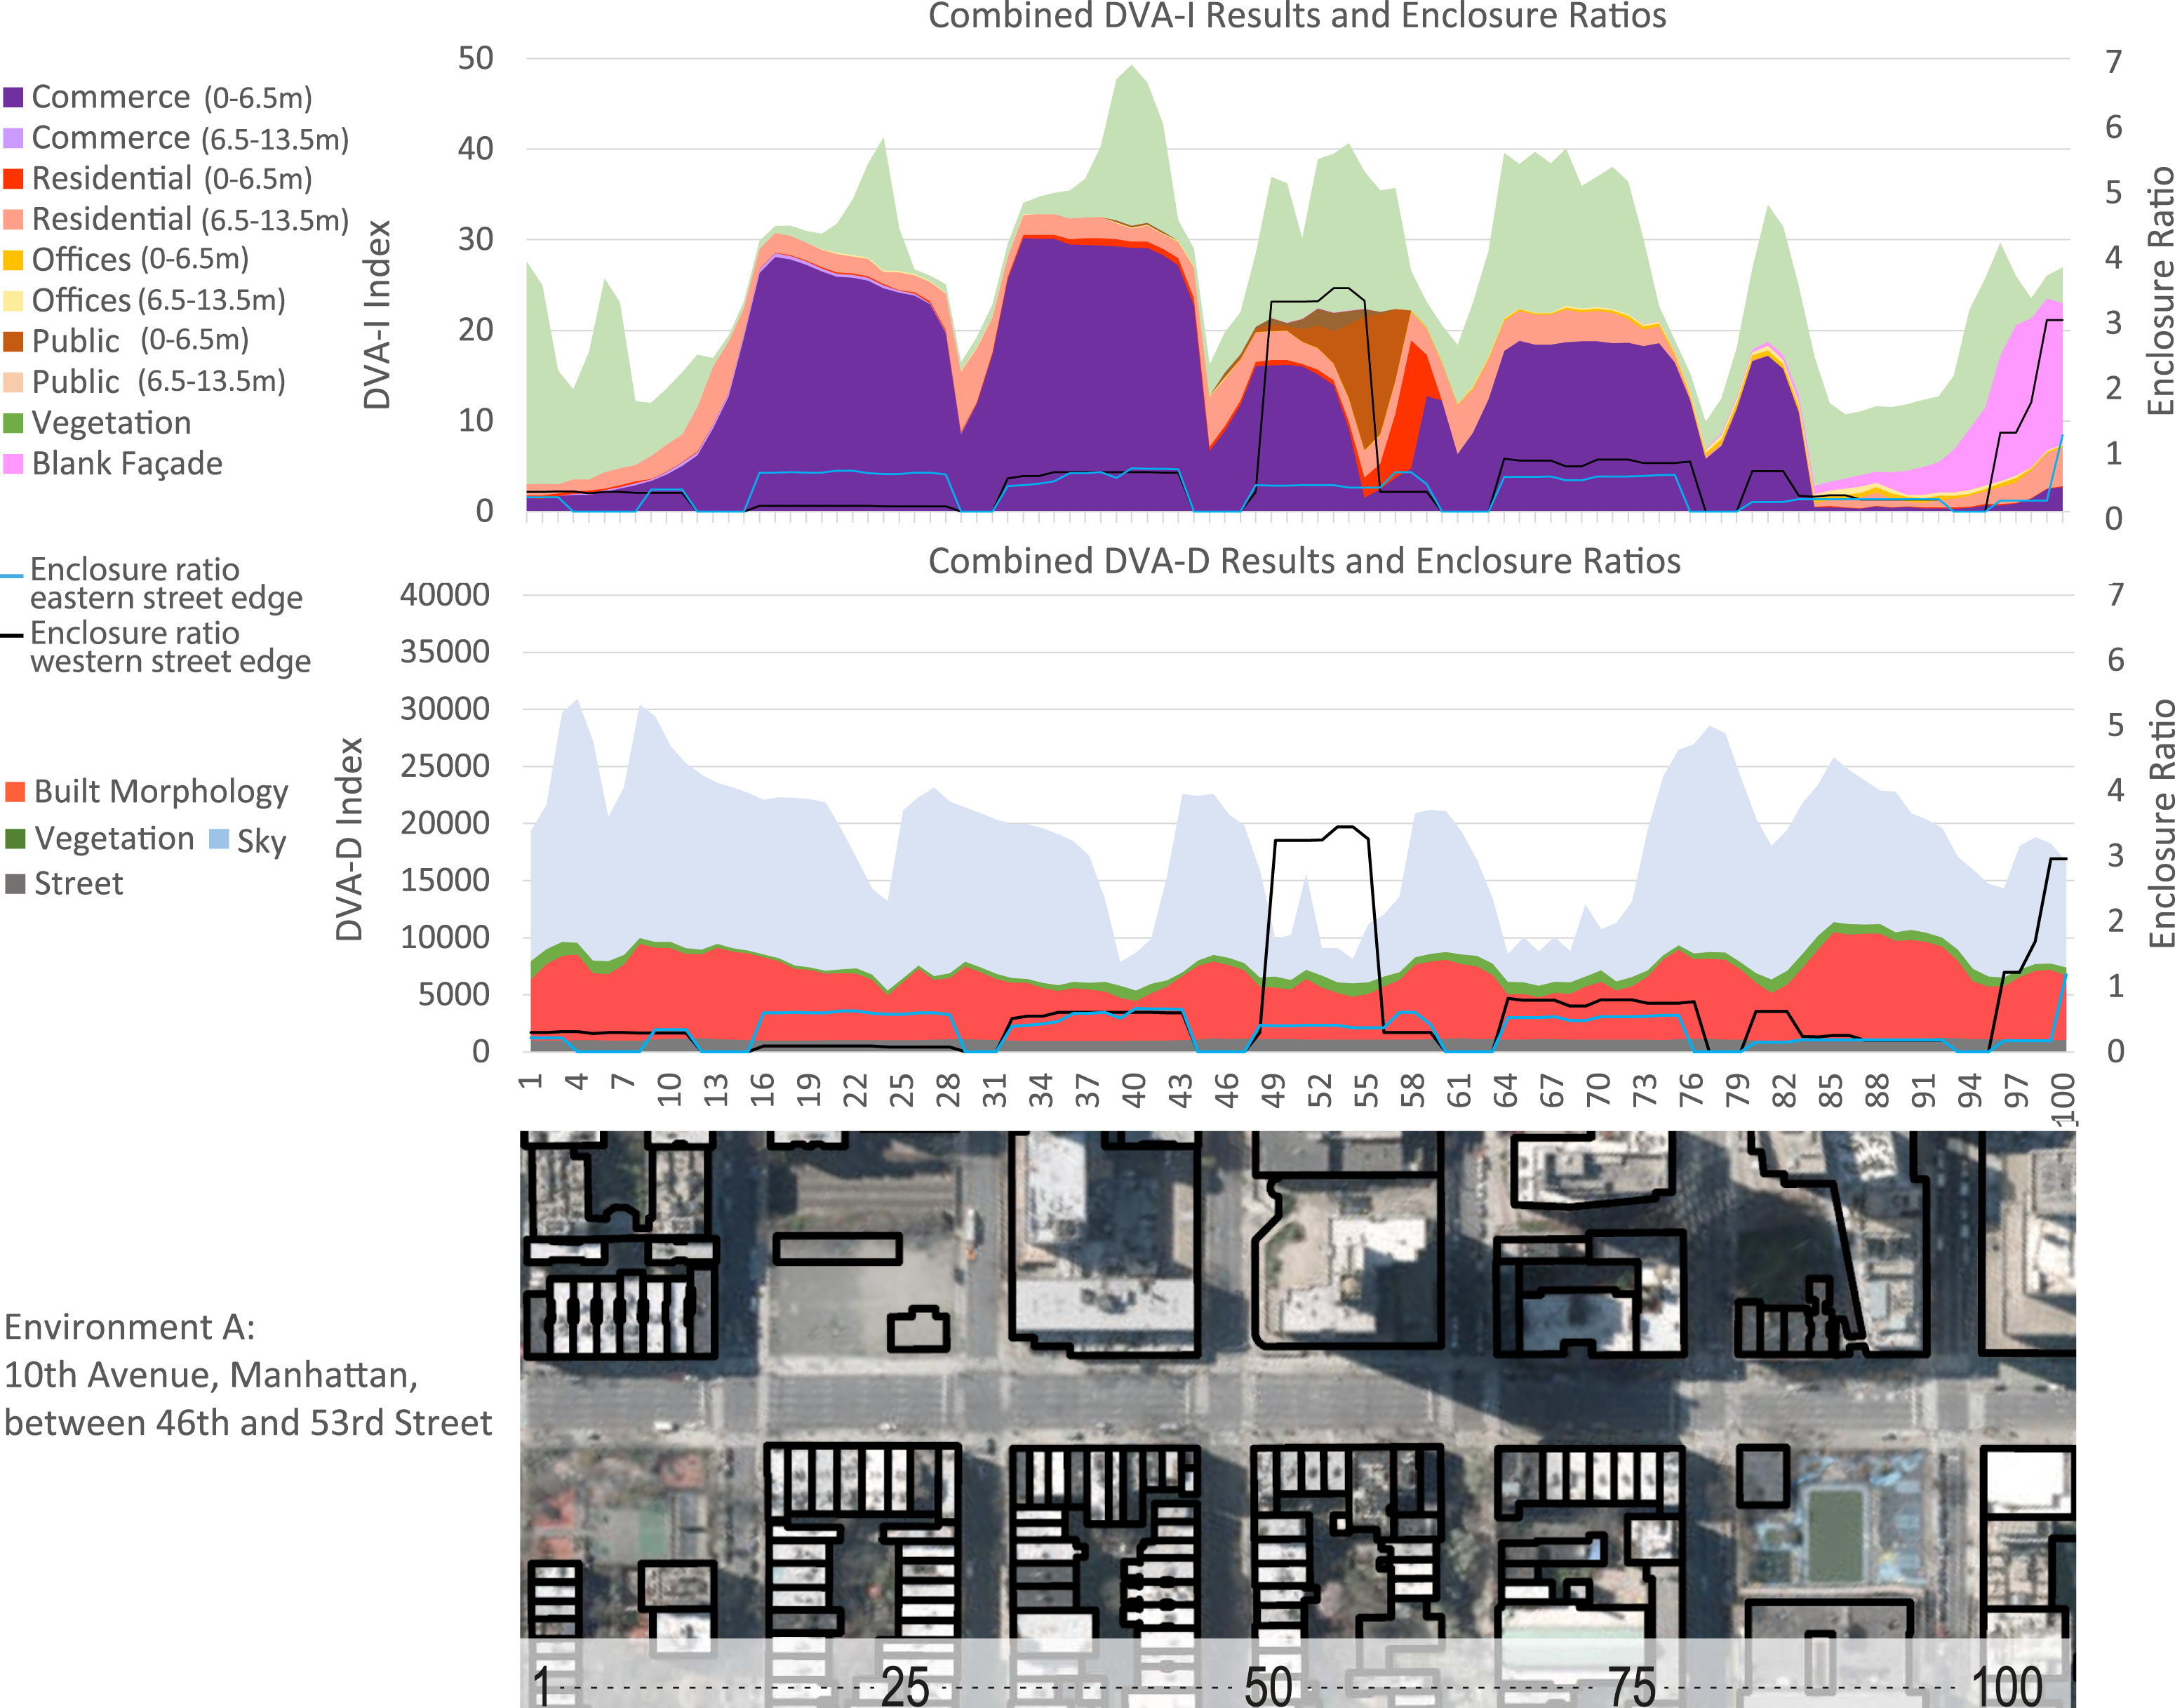
A comparison between the accumulated DVA-I results and sky exposure results (measured by the DVA-D), indicates a strong negative correlation (
Summary of results
While all three environments are ranked similarly in Walk Score®, they inherently differ in their perceived density, potential interactions, and enclosure—in relation to visual attributes such as the built environment. The DVA-D analysis shows that Environment A, which is perceived as the least dense, has the highest overall interaction score and the most comfortable enclosure ratios along the tested route. This case study could therefore be described as most supportive of a walkable environment, comprised of comfortable enclosure ratios and active commercial facades (Ewing and Handy, 2009). Higher DVA-D results are in line with the longer lines of sight, which may undermine the sense of enclosure along the street. The enclosure values of Environment A mostly remain within the comfortable range, thus indicating that a “sense of place” may still exist, despite long lines of sight.
Environment C indicates lower potential for pedestrian wellbeing compared to Environments A and B, based on the lack of enclosure measured in the DESSA, and high sky exposure, lack of visual active elements at the street level, and distance between the buildings to the sidewalk, as measured in the DVA-I. The results of the hybrid comparative analysis are as expected, as Environments A and B are located along commercial avenues with built attributes that are associated with a walkable urban street, such as access to amenities, ground floors shops, and buildings which define the street edges. These differences in the urban morphology of environment may not be accounted for in the Walk Score®, as it does not account for physical urban features of the built environment—indicating the limitations of macroscale walkability indexes in their attempt to capture microscale attributes that could alter the pedestrian experience (Bereitschaft, 2017).
Discussion
This research proposes a triple/hybrid mesoscale analysis for capturing parameters that could impact the visual perceptions of pedestrian when traversing in urban settings. While it is not as detailed as a microscale analyses (Boarnet et al., 2011; Fonseca et al., 2022), it is more detailed than macroscale analyses (Lee and Talen, 2014; Pafka et al., 2020), and can reinforce human visual perceptions. Combined, the three analysis models (DVA-D, DVA-I, and DESSA) offer a hybrid tool for simulating more comprehensive and dynamic experiences of the pedestrian in 3D urban environments: The DVA-D indicates the pedestrians’ perceived density; the DVA-I indicates the pedestrians’ potential interaction with the nearby urban facades along the path; and the DESSA adds evaluations of enclosure rates along the pedestrians’ path. Combined, these models enable quantitative exploration of spatial relationships between the street, its defining edges, and its potential visible spaces—all of which are key factors in pedestrians’ visual perceptions of the streetscape that they are traversing.
Based on the three evaluated case studies, a high rate of visible sky was found in lower enclosure rates environments and vice versa. These findings are in line with previous studies whereby walkable streets were found to have higher enclosure rates and lower sky visibility factor (Yin, 2017). Higher sky exposure has also been associated with lower perceived density and with a higher sense of wellbeing and comfort in high-density environments (Fisher-Gewirtzman, 2018b). Additional research is required to assess these findings in additional environments. Further development of the models is also necessary, as is a comparative study between the results of the models and input from pedestrian counts, to provide additional insights into associations between pedestrians’ activities and the impact of urban physical attributes on their perceptions (Lai and Kontokosta, 2018). The hybrid analysis can support decision-makers while examining trade-offs between conflicting objectives and attributes in urban settings, as part of a multi-objective optimization (Lima et al., 2022).
Finally, the 3D analytical models are currently being developed as open sourced in Rhinoceros and Grasshopper software platforms. The platforms are commonly used by architects, urban design practitioners, and researchers. Consequently, the models could be incorporated into the design process by users, potentially contributing to informed design decisions based on evaluation of urban qualities relating to walkability, that is, lines of sight, visual active frontages, and urban sense of enclosure (Ewing and Handy, 2009; Gehl, 2010; Gehl et al., 2006; Jacobs, 1993). The readability and descriptive visualization of the analysis results may also prove useful to practitioners in the process of urban decision-making (Figure S8).
Limitations
The level of detail presented in the virtual twin does not include every streetscape element visible to pedestrians in reality (which could be measured in microscale audits). The level of detail of the digital twin model depends on the availability of relevant data. As a result, evaluations of environments in cities that provide access to rich open data sets would be easier. However, as open data sets become more extensive, more detailed twin models could be created. Accordingly, the DVA-D and DESSA models are easier to use, as they require basic 3D models that only contain 3D buildings, roads, and vegetation. The DVA-I model, however, requires less readily accessible data, such as uses, facade types, and streetscape elements. Alternatively, users can model specific design proposals and examine them using the proposed methodology.
This paper provides a demonstration of the proposed hybrid methodology that is applicable in various environments. In this study, however, all three case studies are of streets in one city. Future research can focus on diverse urban, suburban, and rural morphologies. Furthermore, this study focused on pedestrians’ visual perception. The model does not account for other senses that affect human perception (hearing, smell etc.).
Finally, the DESSA version applied in this study does not support vegetation as a vertical definition, yet will be added in future developments of the model.
Supplemental Material
Supplemental Material - Hybrid quantitative mesoscale analyses for simulating pedestrians’ visual perceptions: Comparison of three New York City streets
Supplemental Material for Hybrid quantitative mesoscale analyses for simulating pedestrians’ visual perceptions: Comparison of three New York City streets by Roei Yosifof and Dafna Fisher-Gewirtzman in Environment and Planning B: Urban Analytics and City Science
Footnotes
Declaration of conflicting interests
The author(s) declared no potential conflicts of interest with respect to the research, authorship, and/or publication of this article.
Funding
The author(s) received no financial support for the research, authorship, and/or publication of this article.
Supplemental Material
Supplemental material for this article is available online.
Note
References
Supplementary Material
Please find the following supplemental material available below.
For Open Access articles published under a Creative Commons License, all supplemental material carries the same license as the article it is associated with.
For non-Open Access articles published, all supplemental material carries a non-exclusive license, and permission requests for re-use of supplemental material or any part of supplemental material shall be sent directly to the copyright owner as specified in the copyright notice associated with the article.