
Abstract
Urban heat islands (UHIs) are one of the major global issues that need to be addressed because of the negative effects that higher temperatures can cause to people and the environment, such as health issues and higher energy consumption. Within the literature on climate justice, specifically heat inequity, there are very few studies about Global South urban areas. Our study examines the spatial relationships between heat risk, urban form composition, and vulnerable social groups in Belo Horizonte Metropolitan Region (BHMR), in Brazil. We evaluated the spatial pattern of heat risk and concluded that the study area was experiencing UHIs in 2015. We estimated spatial regressions and found that the non-White population, low-income residents, and the elderly population were statistically significantly associated with heat risk. This case study indicates that even though Global South urban areas have the opposite spatial distribution of social groups (i.e., high-income residents living in the center and low-income living in the periphery) when compared to the Global North, areas where vulnerable social groups reside are experiencing similar inequities concerning the UHI effects in both South and North. Our case study exemplifies that climate justice is not taking place in BHMR, and specifically, heat inequity is being experienced by vulnerable social groups.
Introduction
Urban heat islands (UHIs), a phenomenon where an urban area has higher temperatures than its surrounding rural area (Chandler, 1961; Oke, 1973), are considered one of the major issues that need to be addressed due to the heat risk that they generate at night (Rizwan et al., 2008). As climate continues to change, extreme heat events are expected to become more common and longer lasting (Dialesandro et al., 2021), and as a result, UHIs are expected to expand in urban areas if mitigation strategies are not implemented. Knowing that global warming is a reality and the current global urbanization rate is projected to be 68% by 2050 (UN DESA, 2018), it is crucial to examine how heat risk, as a spatial phenomenon, is affecting different urban areas across the globe. This examination should be based on the climate justice subfield of environmental justice, which is concerned with the inequitable distribution of the effects of global climate change (Mitchell and Chakraborty, 2014). Climate justice focuses on “fostering a ‘just transition’ to a post-carbon economy and providing assistance to vulnerable communities” (Schlosberg and Collins, 2014: 366).
Urban heat islands contribute to serious problems related to heat risk, impacting cities and the quality of life of their residents. During summertime, there is an increase in electrical cooling loads, as residents opt for air-conditioning to mitigate heat damage, consequently increasing electricity usage and energy costs for urban residents (Sailor et al., 2019). Indeed, UHIs can contribute to raising cooling energy consumption by a median of 19.0% (Li et al., 2019). In addition, UHIs increase the intensity and period of high temperatures, making urban residents vulnerable to respiratory and cardiovascular-related complications. Research on public health shows that high temperatures are linked to mortality and hospital admission rates in urban areas (Lai and Cheng, 2010; Michelozzi et al., 2009; Paravantis et al., 2017). Finally, there is a link between UHIs and worsening air quality (ozone) (Wilby, 2008). For example, a case study in Taiwan indicates that higher intensity of UHIs is related to air quality deterioration, increasing hospital respiratory admissions (Lai and Cheng, 2010).
Not surprisingly, there are several studies focusing on UHIs in the literature. Some of these studies use the climate justice lens and others the environmental justice lens to examine heat risk, composition of urban forms, and vulnerable social groups. We name this approach when focusing on heat risk from the climate justice framework, heat inequity, also named ‘thermal inequity’ by Mitchell and Chakraborty (2015). Heat equity, being the opposite of inequity, means that if a risk exists, it should not be predominantly in areas where vulnerable social groups live but be randomly distributed across an urban area. To illustrate heat inequity, in major U.S. cities, people of color and low-income residents are more exposed to UHIs than other residents (Hsu et al., 2021). Moreover, also within the U.S. context, Wilson (2020) argues that it could be possible to link the current unequal distribution of UHIs with past planning practices because the long-lasting effect of historical discrimination on racial minorities has reduced the proportion of green space in redlined areas.
Even though the literature on heat inequity has several case studies, a considerable gap has been observed in terms of conducting spatial comparative analyses of the socio-economic characteristics of residents in relation to the UHIs’ locations in order to allow generalization (Mitchell and Chakraborty, 2015). Moreover, we noticed that the number of case studies is much higher in locations in the Global North, than the Global South. This may be caused by lack of data availability and/or low commitment of local governments to collect census and other forms of natural data in urban areas from the Global South. Additionally, cities in the Global North are characterized by high level of wealth, speedy technological advancement, and political stability when compared to cities in the Global South, which are characterized by a high proportion of poverty, persistent unemployment, and political instability. From a planning perspective, this dichotomy needs to be addressed using the lens of climate justice because there is a higher need for improving urban areas for the latter that are being left behind, highlighting the importance for this study.
Within this context, this study aims to explore the associations between heat risk, composition of urban form, and socially vulnerable groups in the Belo Horizonte Metropolitan Region (BHMR), Brazil. This study poses two research questions: (1) If urban heat risk exists, what is the spatial pattern of urban heat risk in the study area in 2015? (2) How is the spatial pattern of urban heat risk related to locations of socio-economically vulnerable residents in the study area?
We define vulnerable social groups as children, the elderly, people who are non-White, and those who live in poverty. To accomplish this objective, we build an urban heat risk index and conduct spatial regression analysis to understand the relationships between variables. Landsat 8 OLI/TIRS satellite imagery is included in the index’s calculation. Landsat images are extensively used in the literature to produce Land Surface Temperature (LST) as a proxy to measure UHIs.
It is important to highlight that high-density in situ temperature and humidity sensors or Moderate Resolution Imaging Spectroradiometer (MODIS) nighttime LST might be better approaches to estimate heat stress experienced by residents at nighttime. However, given our roughly 460 square km study area (i.e., BHMR conurbation) and Landsat 8-derived LST resolution of 100 m (30 m; Landsat 8 TIR bands are captured at 100 m and resampled to 30 m), we would need huge in situ sensor networks to provide a similar spatial level of detail as the Landsat product. And the MODIS measurements are a lower resolution (1 km) than Landsat, precluding neighborhood-level analysis. Additionally, elevated daytime temperatures are a compounding risk factor, especially in developing countries among daytime industrial workers and outdoor laborers (Moda et al., 2019; Wong et al., 2017). Thus, given these considerations and the criticality of estimating heat risk in the Global South, we opted to use the Landsat LST-based index.
Our study contributes to the literature on climate justice, specifically focusing on heat inequity, in the Global South context. More case studies, such as the one presented here, are needed to reflect more geographical realities from the Global South. Our study shows new evidence that the elderly, people of color, and low-income residents are more likely to be exposed to heat risk, consistent with Global North studies conducted by Dialesandro et al. (2021), Hsu et al. (2021), and Huang et al. (2011).
Literature review
How are UHIs generated? Urban forms lead to the generation of UHIs, perpetuating high temperatures in cities and producing heat risk through elevated nighttime temperatures. High concentrations of the built environment, such as buildings and road pavements, increase the absorbance and retention of radiated heat during the daytime. The heat is radiated into the ambient atmosphere during the daytime as well as after sunset (Rizwan et al., 2008). Although urban green infrastructure (e.g., parks, greenways, and open green spaces) can decrease heat absorbance and retention, the dominant presence of built environments maintains high temperatures in urban fabrics. Accordingly, understanding the composition of urban forms can help planners and policymakers interested in designing UHI mitigation strategies.
Climate justice, at the city scale, (specifically focusing on UHIs), should be based on an inclusionary approach so that plans, policies, and programs related to UHI mitigation use the lens of equity to avoid the unequal distribution of benefits (Haddad et al., 2022). For instance, proximity to green spaces should be available for all, not only for the ones who live in rich neighborhoods, indicating a need to expand green spaces for vulnerable communities so their residents could benefit from lower temperatures. Within the literature on UHIs, a few case studies also considered the climate justice framework (Dialesandro et al., 2021; Mitchell et al., 2021; Mitchell and Chakraborty, 2014, 2015; Sarricolea et al., 2022; Voelkel et al., 2018). Four of them had study areas located in the U.S., and two of them had a study area located in the Global South (i.e., India and Chile). All of them found that heat inequalities were present in urban areas, and demonstrated that vulnerable social groups were more likely to suffer from the effects of UHIs. Our study contributes to the climate justice framework with a specific focus on heat inequity using a case study from an unstudied metropolitan region in the Global South.
Summary of studies about heat risk and their vulnerable social group variables.
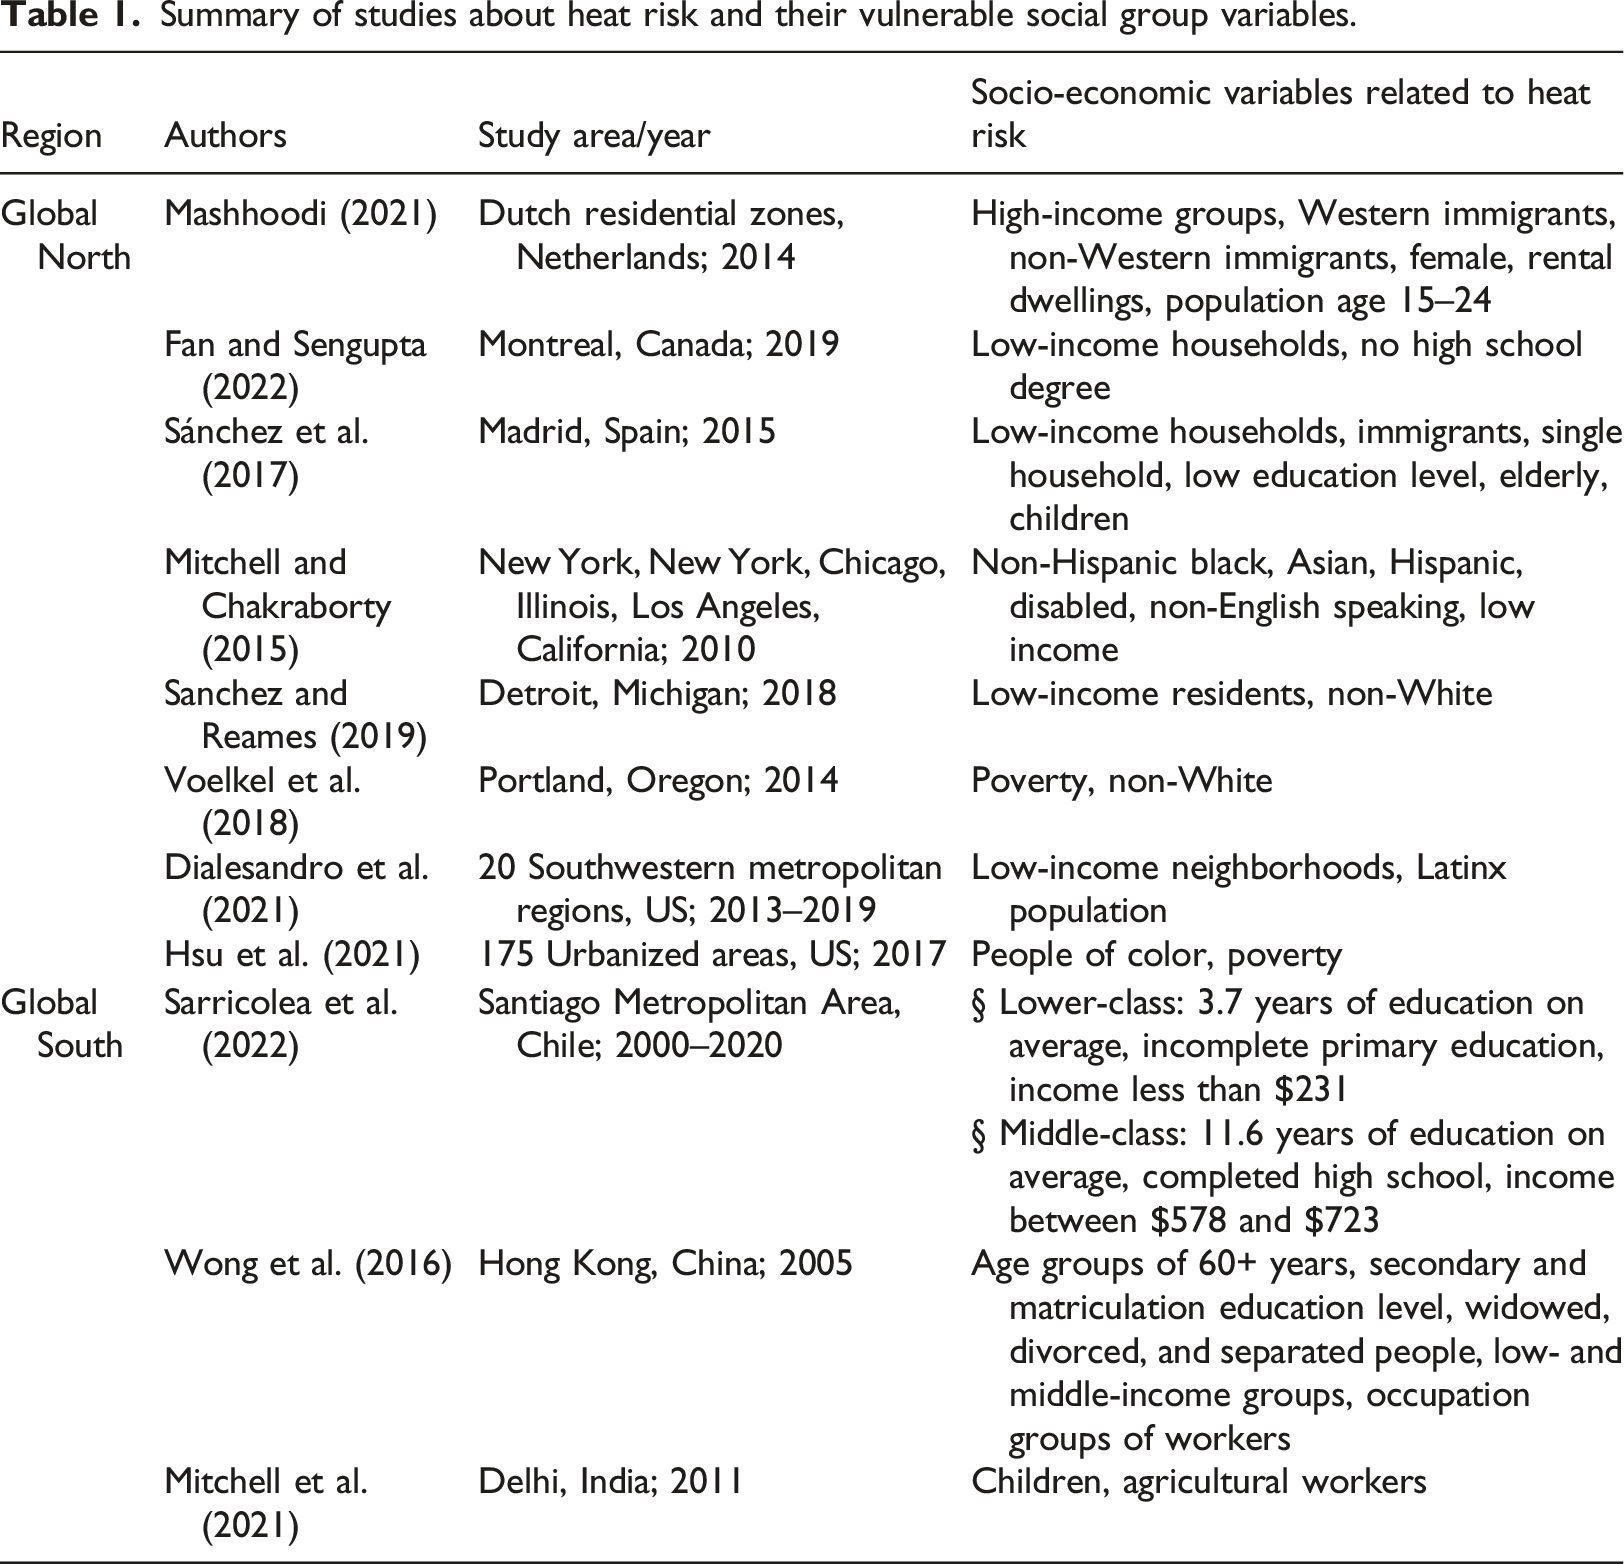
Concerning the dependent variable, we followed Mitchell and Chakraborty (2015) that used the urban heat risk index. They used remote-sensing techniques and spatial regression analysis to compare heat equity in New York, Chicago, and Los Angeles, U.S. As their dependent variable, they proposed a quantitative index for urban heat risk. We also opted to use this index as the dependent variable for our regression models. The index incorporates the characteristics of urban forms by combining NDBI (a variable responsive to the built environment) and NDVI (a variable responsive to natural vegetation and green infrastructure) with LST. This imagery is all collected at about 10:15 in the local morning, which depending on the area/season, may only be a few hours removed from sunrise. Even though Landsat LST has been extensively used in the literature as a proxy to measure UHIs, the use of in situ temperature and humidity sensors would be a more accurate approach to measure heat stress. To illustrate, Fan and Sengupta (2022) used 19 in situ sensors with a solar radiation shield to measure temperature in their case study about Montreal, Canada. However, due to budget constraints, we opted to use the LST based index.
With regards to methods, there are several studies focusing on heat inequity in the Global North. In the European context, Sánchez et al. (2017) carried out a socio-spatial analysis to examine the locations of vulnerable social groups and the spatial distribution of high nighttime temperatures in Madrid, Spain. Their analysis found an overlap between high temperatures and vulnerable populations in the southern region of the city. Additionally, Sanchez and Reames (2019) collected LST and NDVI from satellite imagery and carried out a socio-spatial analysis in Detroit, Michigan. Their study showed that low-income residents are underrepresented in the municipal strategic framework for urban green spaces. Lastly, a recent study by Hsu et al. (2021) conducted a comparative analysis examining how pervasive heat inequity is in multiple U.S. urbanized regions. The authors concluded that people of color and populations in poverty are at greater heat stress than other groups.
Heat inequity has also been studied in the Global South countries. In the Santiago Metropolitan Area, Chile, Sarricolea et al. (2022) used a polynomial regression model to examine the relationships between land price variables, socio-economic status, and intensity of UHIs. Their study showed that social groups with lower and middle socio-economic status were at higher heat risk. Another heat equity study was conducted in Hong Kong, China, by Wong et al. (2016). The authors derived LST from satellite imagery and carried out a logistic regression analysis to examine the relationships between UHIs and socio-demographic variables. Additionally, Mitchell et al. (2021) examined heat inequity in India using multivariable models based on generalized estimating equations. They statistically demonstrated the positive associations between children, agricultural workers, and the summer UHI intensity. Finally, Lapola et al. (2019) conducted a comparative analysis in six Brazilian metropolitan areas and found varying results that very high heat stress risk was located in the poorly developed zones in Natal and Manaus, whereas São Paulo, Vitória, Curitiba, and Porto Alegre had high heat stress in their rich neighborhoods.
In summary, based on the literature review, we opted to use age cohort, poverty, and race-related variables to capture vulnerable social groups of BHMR. Knowing that many cities from the Global South face data availability issues (Haddad et al., 2021), we could not include other variables that may be relevant, such as working in the informal sector, education level, and occupation, due to lack of data.
Materials and methods
Study area
BHMR consists of 34 municipalities, and it is the third largest metropolitan region in Brazil (Instituto Brasileiro de Geografia e Estatística—IBGE) (see Figure 1). BHMR is in Minas Gerais State, and it ranges 125.3 km from east to west, and 157.5 km from south to north, with an area of 9,468 square km. Its population was around 5.7 million in 2015 (UN DESA, 2022). The municipality of Belo Horizonte is the core of the region, and its population was estimated to be 2.5 million in 2021, accounting for almost 45% of BHMR’s total population. The municipality was responsible for more than 40% of BHMR’s GDP in 2013. The Köppen climate classification for the region is tropical savanna climate (Aw), with a warm and humid summer, and a mild and dry winter. The summer season is from December to February, and the hottest month is January. We chose BHMR as the study area because, first, there is a need to expand the Brazilian cities literature beyond Rio de Janeiro and São Paulo (Garmany, 2011). Second, BHMR has a typical spatial distribution of social groups of the Global South cities, having the richest residents living in the center and the poorest living in the periphery (de Mendonça et al., 2019), a type of distribution opposite of the Global North. Knowing that the distribution of social groups generally leads to the composition of urban forms, which in turn leads to the formation of UHIs, BHMR becomes an appropriate and insightful case study. Map of BHMR and conurbation.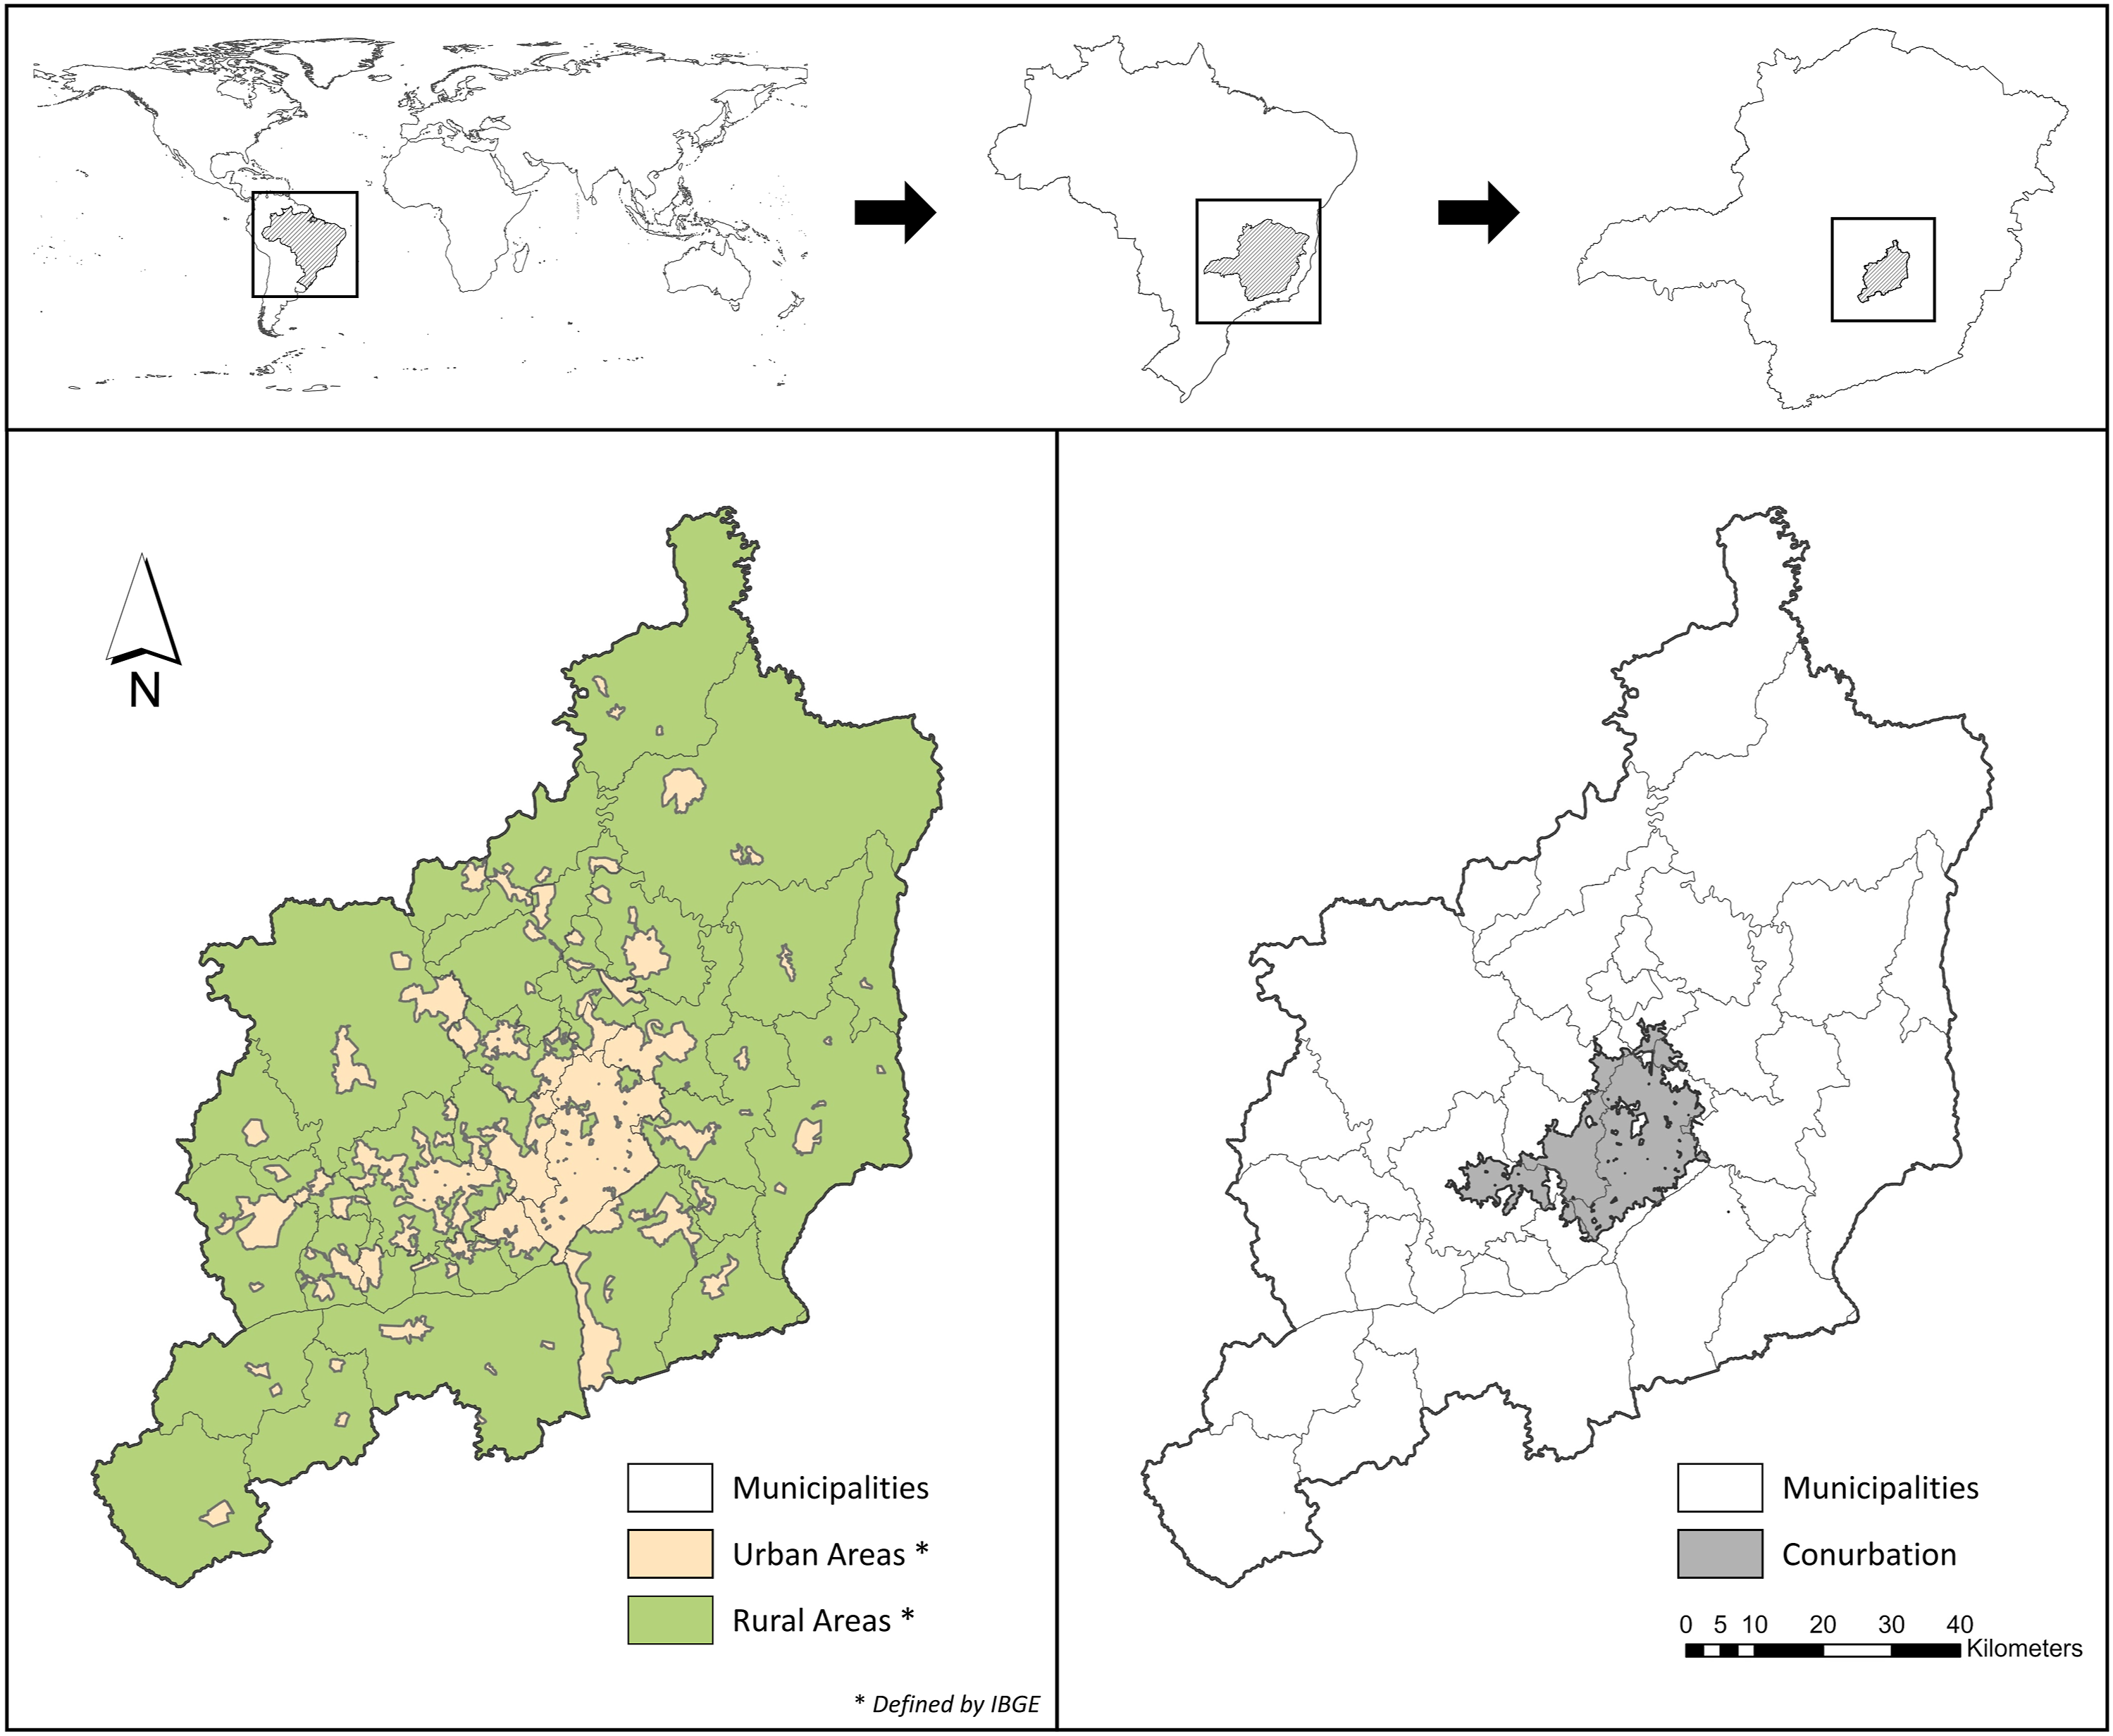
We defined our study area as the contiguous urban area within BHMR as displayed in Figure 1. This contiguous urban area is the result of conurbation, which is the phenomenon when cities and towns merge because of development while retaining their separate identities. BHMR conurbation plays a pivotal role in the state economy because of the concentration of three major sectors named services, public administration, and industry, corresponding to 40, 25, and 20%, respectively, of the total formal employment in 2015 (Monte-Mór et al., 2018).
To explore the heat risk of the BHMR conurbation, we set the spatial unit of analysis to the census tracts provided by the IBGE. We used the 2015 land cover and 2010 census tract data of BHMR. We visually inspected the census tracts to understand which ones coincided with the contiguously urbanized areas of 2015. The census tracts that did not coincide with the 2015 BHMR conurbation were removed. We also removed 51 census tracts with missing demographic information in the conurbation. Consequently, there were 5,649 census tracts in BHMR conurbation, out of the total of 7,775 in BHMR.
Methods and data
To answer the two research questions, we performed remote-sensing techniques, Exploratory Spatial Data Analysis (ESDA) and Confirmatory Spatial Data Analysis (CSDA). First, we estimated the LST, NDBI, and NDVI using the Landsat 8 OLI/TIRS satellite imagery acquired on 3 January 2015, from USGS EarthExplorer (https://earthexplorer.usgs.gov/). Although 2010 Landsat 7 ETM + satellite imagery is available on USGS EarthExplorer, we did not use the imagery due to its Scan Line Corrector Failure issue. We selected 2015 because the year was closer to 2010 than any other year that included a clear scene of the conurbation after the launch of Landsat 8 OLI/TIRS in 2013. Also, we picked January 3 because it was the only date in 2015 that exhibited a clear scene with a lower than 20% cloud cover above the study area. Since January is a summer season in Brazil, we expected that the date could maximize the spatial pattern of heat risk in the study area.
Even though MODIS would allow us to measure night LST, we decided to use Landsat because it has 100 times the resolution of MODIS, (100 m vs 1 km) thus enabling greater investigations into spatial detail than MODIS. With MODIS we would only have about 20 pixels x 20 pixels across Belo Horizonte instead of the 200 × 200 Landsat provides (USGS downsamples the Landsat TIRS data to 30 m). Thus, we would not be able to resolve most of the census tract that we did in our study if we used MODIS data. The use of land observation data would also preclude investigating census tract level effects due to the small amount of temperature and humidity sites that are available.
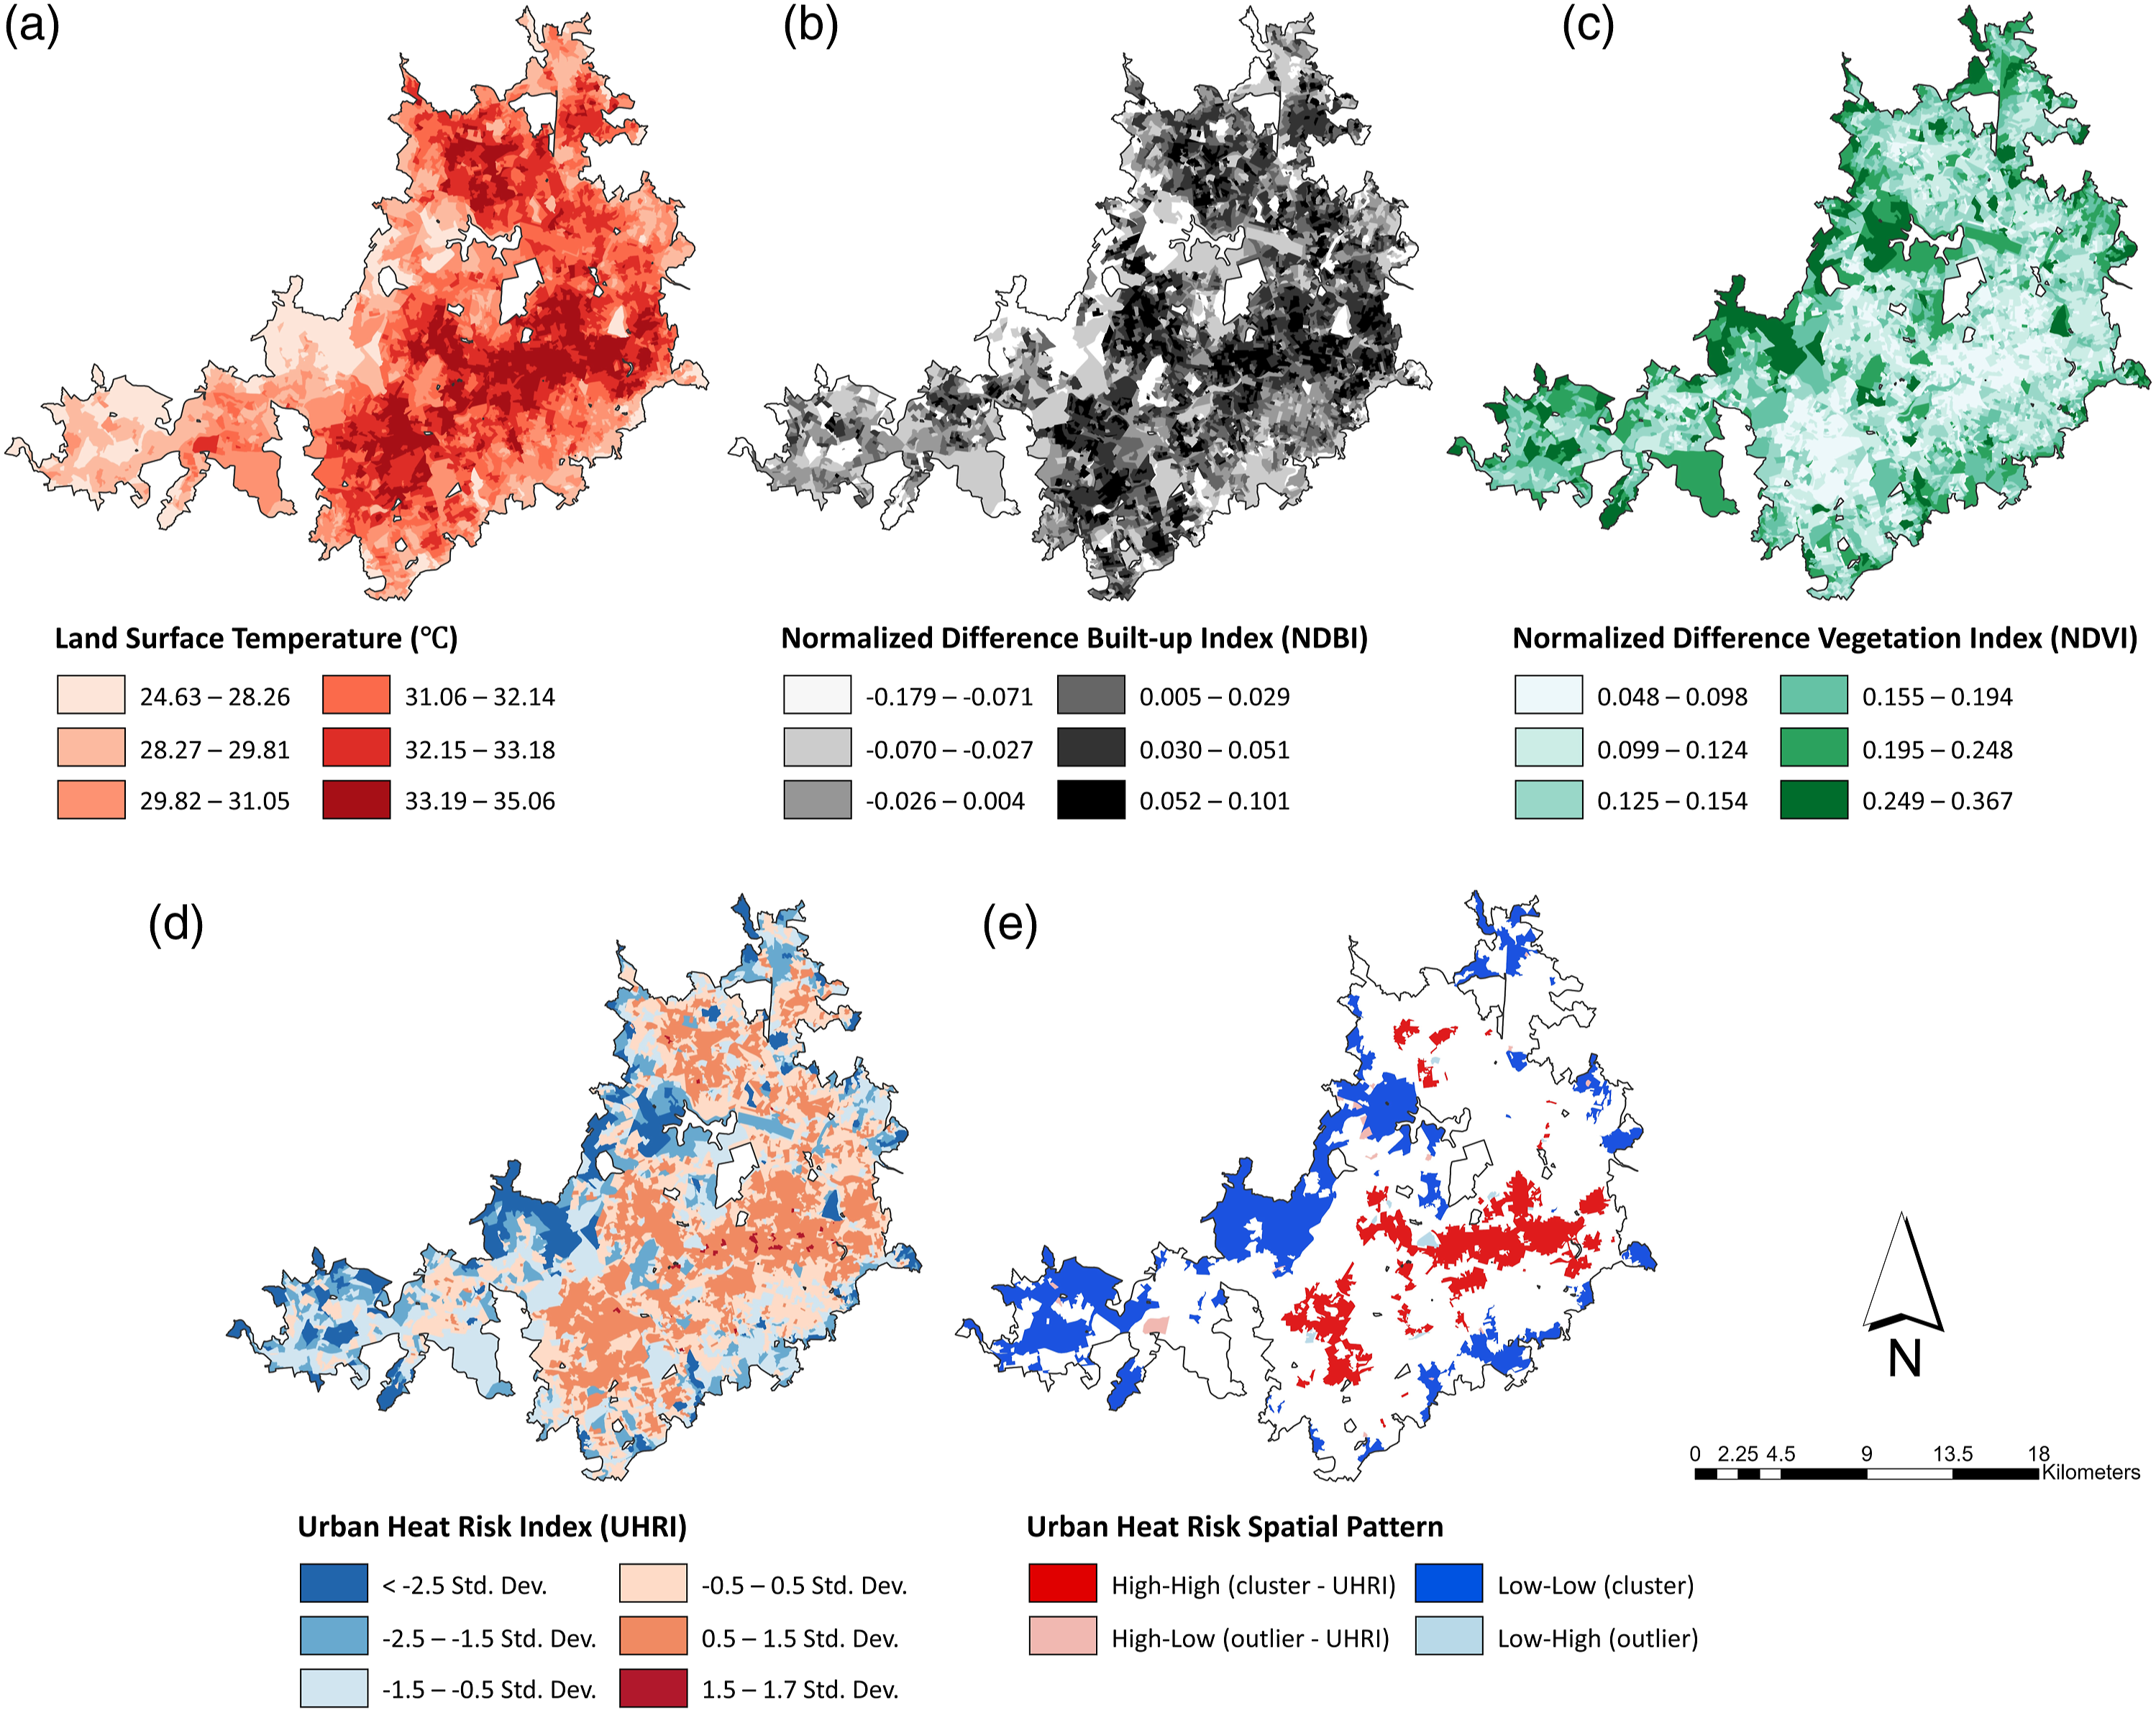
Next, we generated the urban heat risk index (UHRI) following Mitchell and Chakraborty (2015), combining land surface temperature with two characteristics responsive to the urban form. All three variables were standardized by applying z-score to assure that the three different units of measurement were comparable, using the ArcGIS Pro 2.8 software Spatial pattern of (a) land surface temperature (LST), (b) normalized difference built-up index (NDBI), (c) normalized difference vegetation index (NDVI), (d) urban heat risk index (UHRI), and (e) urban heat risk LISA pattern.
To explore the spatial pattern of the UHRI, we performed ESDA using GeoDa 1.18 software (Anselin and Rey, 2014). ESDA techniques were also applied in Wong et al. (2016) to identify the spatial pattern of UHI. We used contiguity-based spatial weights (queen) and k-nearest neighbors (k = 6) to test for spatial autocorrelation at the global level (i.e., Moran’s I test) and at the local level (i.e., Local Indicators of Spatial Association—LISA). The global Moran’s I statistically examines the clustering patterns, assessing whether the variable under examination is randomly distributed or not. The null hypothesis for the global Moran’s I test is that UHRI values are randomly distributed in the BHMR conurbation (spatial randomness). The alternative hypotheses are that the UHRI values are not randomly distributed in the BHMR conurbation, depicting a positive or negative spatial autocorrelation. We considered that the Moran’s I test has failed to reject the null hypothesis if a p-value is greater than 0.01. If the null hypothesis is rejected, it is determined whether the spatial pattern of the UHRI has a positive or negative clustering spatial pattern.
Next, LISA was performed to decompose the result of Moran’s I and visualize the specific type of spatial patterns in each observation (Anselin, 1995). The spatial patterns are categorized into four types. Two types are considered clusters, when one observation is surrounded by neighbors with similar values: HH (high-high) and LL (low-low). Two types are considered spatial outliers when two observations with each dissimilar value are neighbors: LH (low-high) and HL (high-low). To understand the existence or not of UHIs in BHMR conurbation, we considered the hotspots from the LISA results as follows: HH and HL (p < 0.01) represent high heat risk and the existence UHIs, and LL and LH (p < 0.01) represent low heat risk, indicating that there are no UHIs in the study area.
For the CSDA steps, we needed socio-economic variables that were gathered from the 2010 decennial census from the IBGE. Since the IBGE postponed the 2020 census survey due to the 2020 COVID-19 pandemic outbreak, the latest data available at the time of the analysis were the 2010 decennial census data. To represent the vulnerable social groups, we used the following variables (see Figure 3): percentage of children aged 5 and under (% Children), percentage of those aged 65 and over (% Elderly), nominal average monthly income per capita (Average Income), and the combination of the population who reported being black with the population who reported being mixed races and then calculated the percentage of black and mixed races population (% non-White). This combination makes sense for the BHMR case because Brazilians do not define race in terms of one’s ancestry (Chen et al., 2018). Instead, the race is more closely tied to skin tone and not tied to facial features (Chen et al., 2018). Additionally, as described by Chiavegatto Filho et al. (2014), the 2010 census showed that the country was divided between 47.7% Whites, 7.6% Blacks, and 43.1% mixed races, thus summarizing to 50.7% of non-Whites, with the remainder being Asians and Indigenous (1.5% total population). We also added a control variable to capture population density (Density) dividing the total population of a tract by its area in km2. Spatial distribution of (a) the percentage of those aged 5 and under (% Children), (b) the percentage of those aged 65 and over (% Elderly), (c) the level of nominal average monthly income per capita (Average Income), (d) the percentage of black and mixed races population (% non-White), and (e) population density (Density).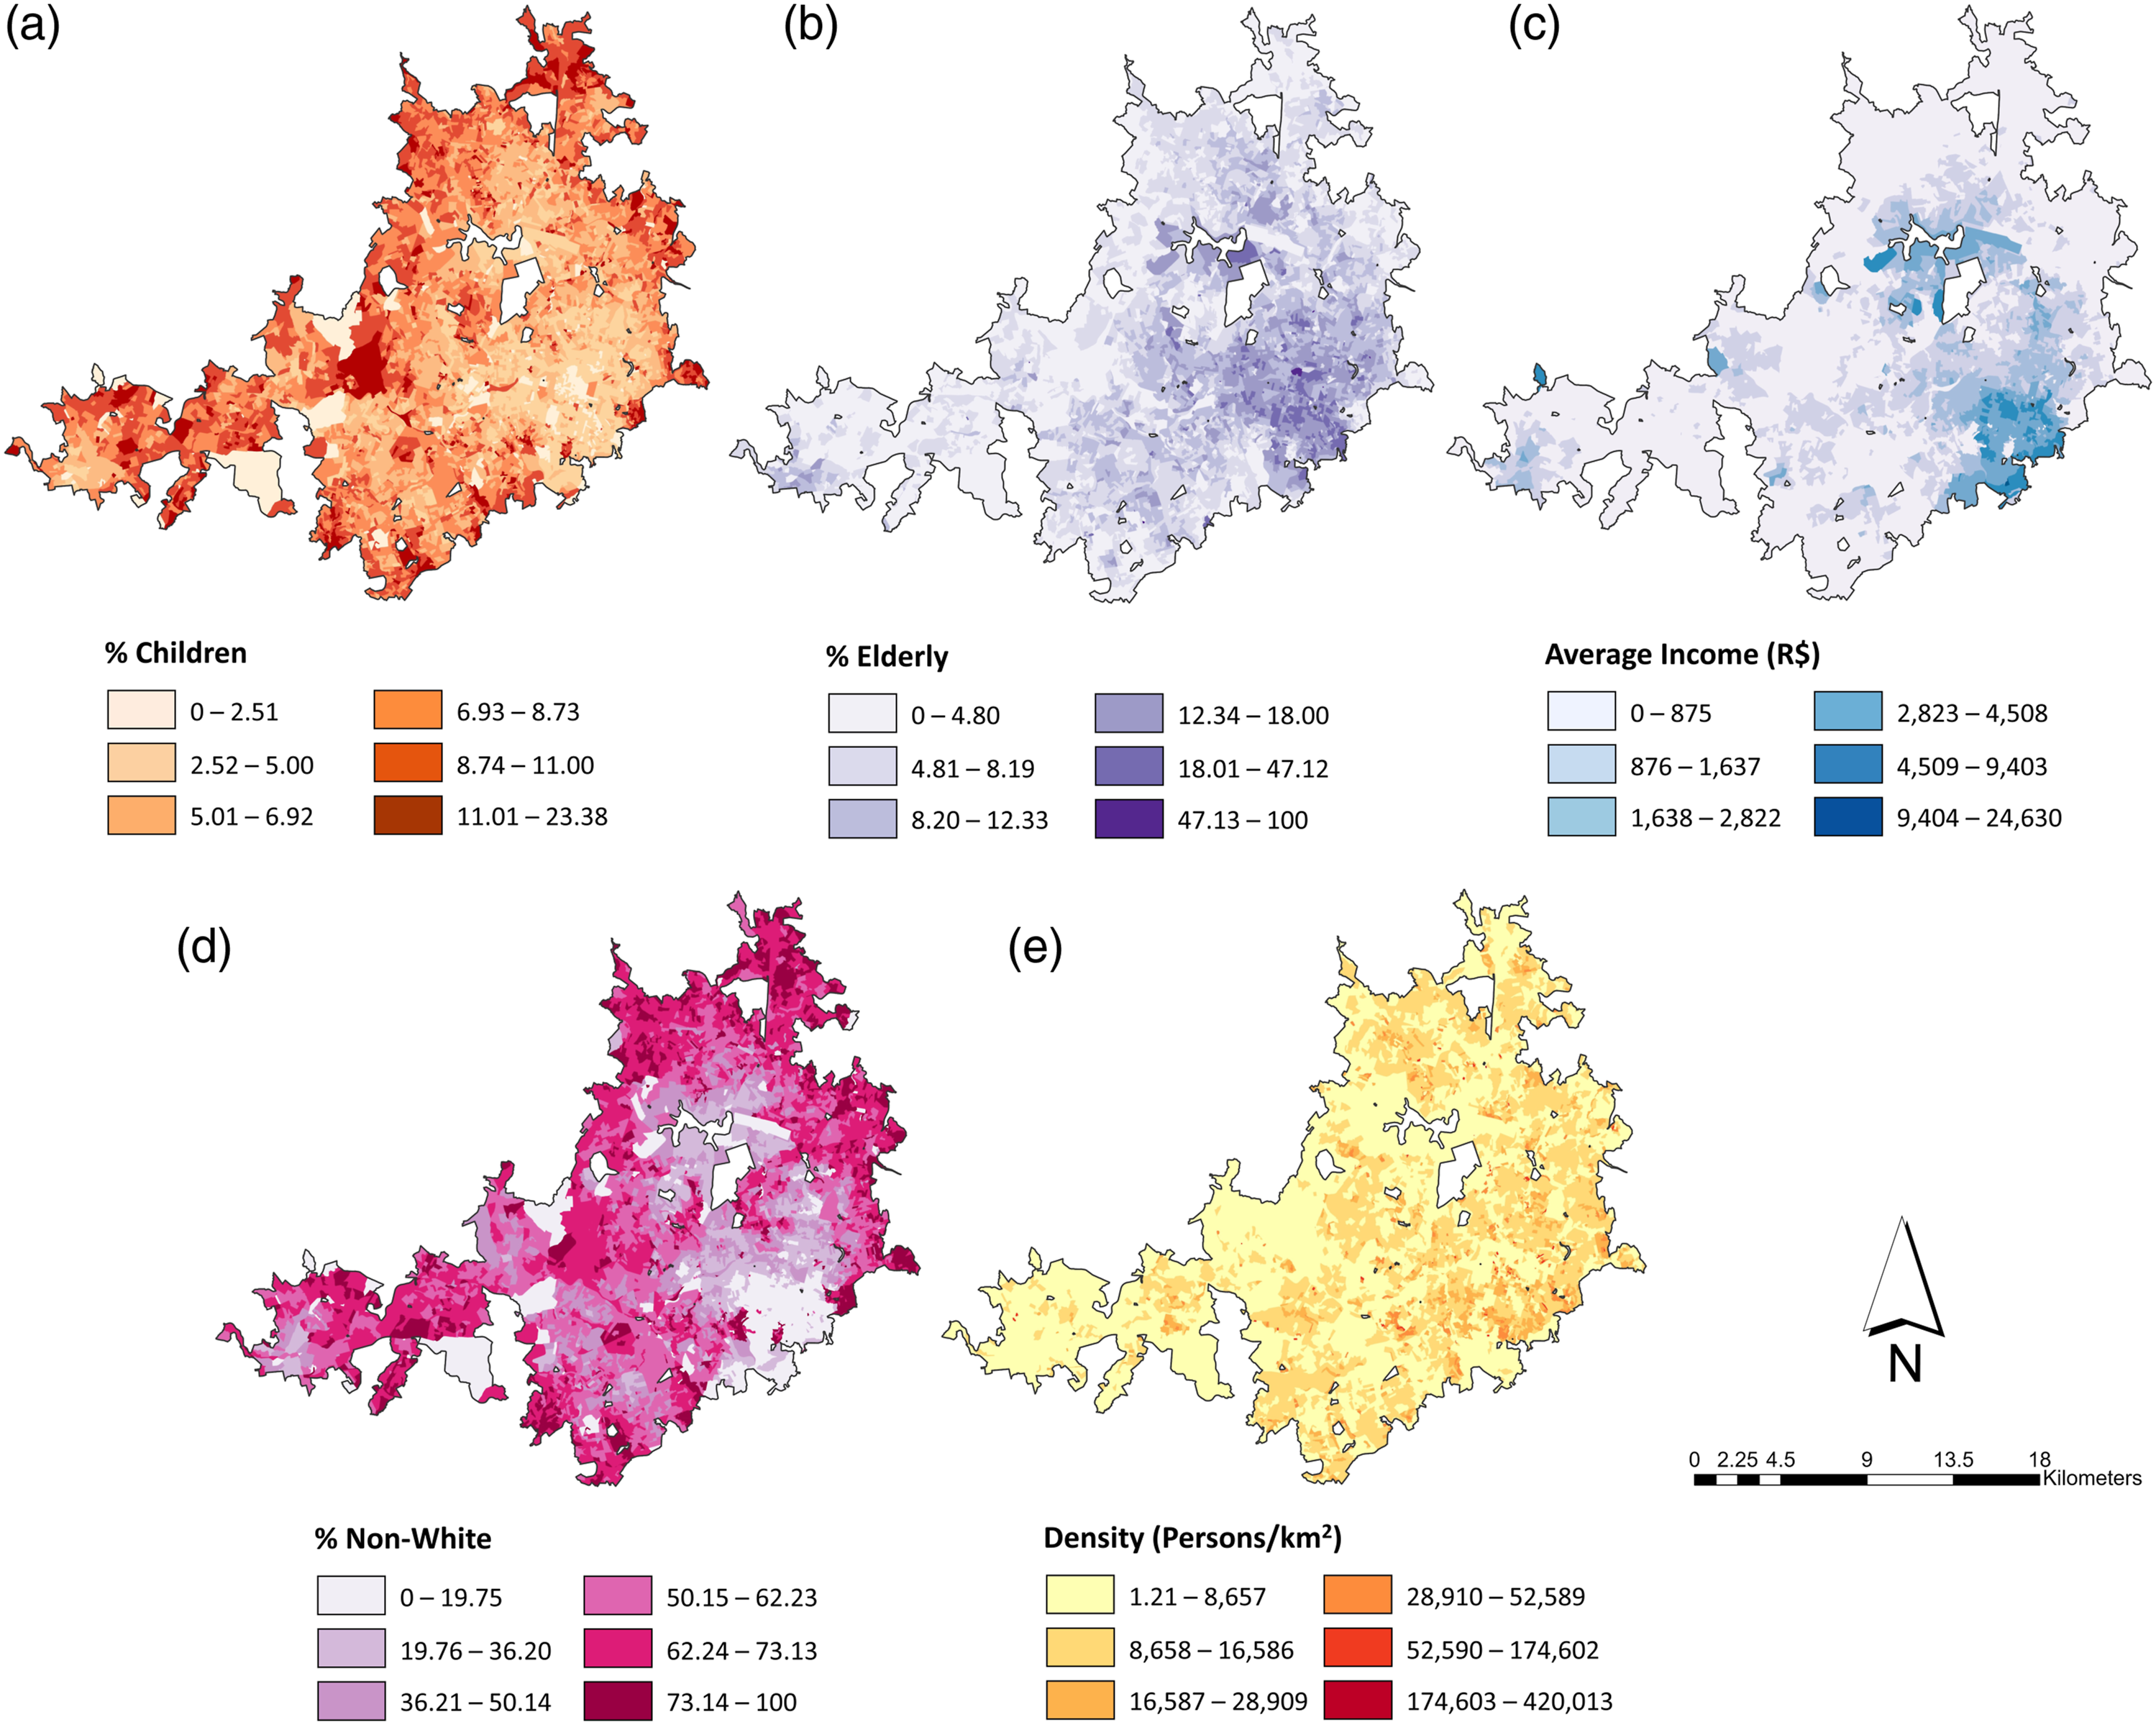
The spatial patterns of the independent variables are displayed in Figure 3. The proportion of children is higher near the periphery, while the relatively lower proportion is located around the southeast region (see Figure 3(a)). In contrast, the proportion of the elderly is higher around Lake Pampulha and the southeast region (see Figure 3(b)). Average Income exhibits a similar spatial pattern to the elderly in that high values are concentrated around the Lake and the southeast region (see Figure 3(c)), which is located in the periphery of BHMR, and it is adjacent to the Serra do Curral, a mountain range in which urban development cannot occur. High proportions of non-Whites are located near the periphery, whereas low proportions are clustered in the southeast (see Figure 3(d)). Lastly, the majority of the population density is lower than 28,909 Persons/km2 as observed in the legend of Figure 3(e). High population density is scattered across the conurbation, but it is slightly concentrated around the southeast region (see Figure 3(e)).
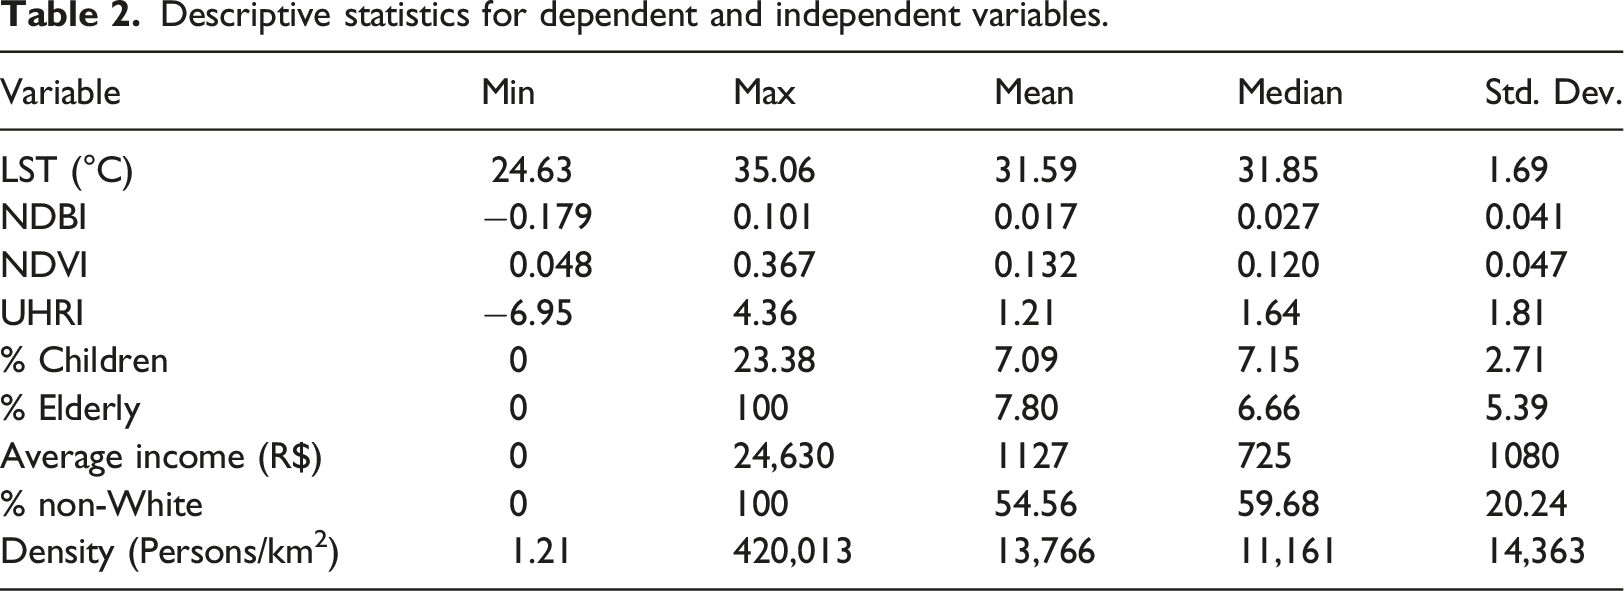
Descriptive statistics for dependent and independent variables.
Correlation matrix for variables included in the study.
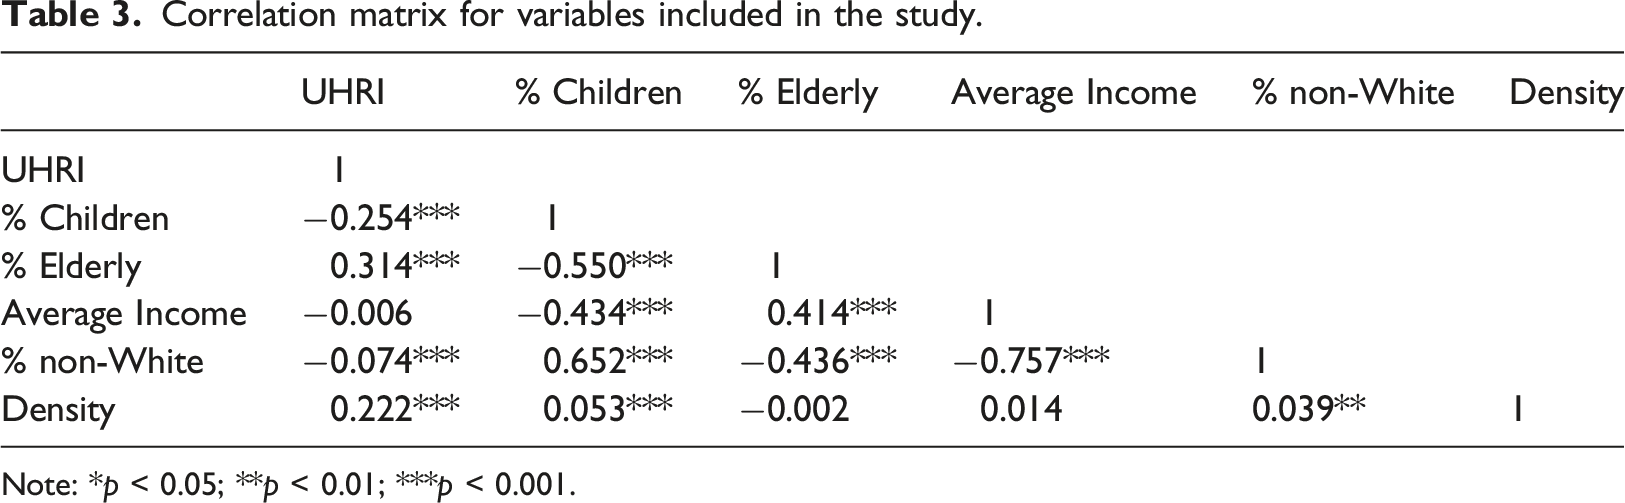
Note: *p < 0.05; **p < 0.01; ***p < 0.001.
To understand the relationships between UHRI, and the socio-economic and control variables, we performed CSDA using GeoDa 1.18 software (Anselin and Rey, 2014). We started with the ordinary least squares (OLS) estimation. If spatial autocorrelation is detected, the OLS may lead to biased statistical inference in regression analysis. To address this issue, Anselin (2003) proposed spatial regression analysis to control for spatial autocorrelation, by adding a new spatially autocorrelated term in a regression specification. If a spatially lagged dependent variable is included as a new independent variable, this form of a spatial regression model is defined as a spatial lag model (SLM) (Anselin and Rey, 2014). On the other hand, if a spatially autocorrelated error term is included in a regression model, this spatial regression model is defined as a spatial error model (SEM) (Anselin and Rey, 2014).
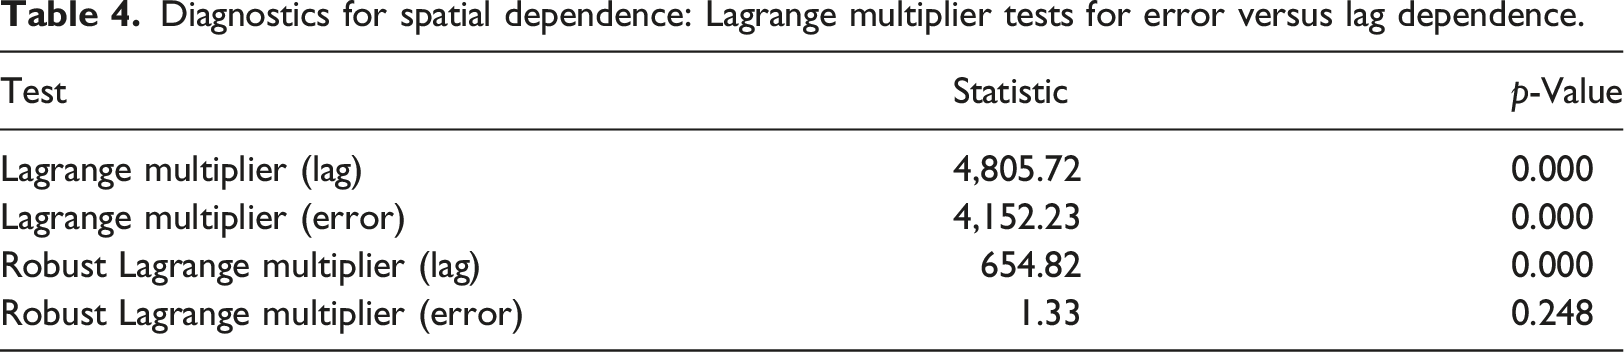
If spatial autocorrelation is detected, to opt for the appropriate spatial regression model, the Lagrange Multiplier (LM) test on the OLS residuals is used to diagnose spatial dependence. We followed the diagnostic process proposed by Anselin and Rey (2014) as follows: If the LM statistic for either lag or error dependence is highly significant (p < 0.01), then the appropriate spatial regression model is the one the LM statistic refers. If the LM statistics for both lag and error dependence are highly significant (p < 0.01), the model referenced by the significant Robust LM statistic is used. If the Robust LM statistics for both lag and error dependence are significant (p < 0.01), we select the model referenced by the larger Robust LM statistic of the two.
Results and discussion
To answer the first research question, we employed ESDA techniques. The Moran’s Index was significant and positive for both matrices (0.630, queen; 0.566, 6-nearest), indicating that our results are robust. The null hypothesis of spatial randomness was rejected at a p-value 0.000 using 999 permutations, indicating that the 2015 UHRI values were not randomly distributed in the BHMR conurbation, and a positive spatial autocorrelation existed. Therefore, the 2015 UHRI clustering pattern demonstrated that BHMR was experiencing UHIs in that high heat risk values were located close to high values, and low heat risk values were located close to low values.
Next, the local spatial patterns of heat risk were visualized as an LISA map, including clusters (in red and blue colors) and spatial outliers (in light blue and pink colors), shown in Figure 2(e). The LISA analysis was conducted using the queen matrix at 1% significance using 999 permutations. The HH clusters and the HL spatial outliers represented the areas within BHMR conurbation that were experiencing UHIs in 2015. On the other hand, the LL clusters and LH spatial outliers represented the areas that were not experiencing UHIs. These areas were in different parts of the study area: UHIs census tracts were more concentrated in the core, and non-UHIs census tracts were more dispersed along the periphery of the region. That is an interesting result because, as described above, the distribution of social groups in BHMR is characterized by low-income residents in the periphery and high-income in the center, except for the southeast region. The LISA results may be explained by the fact that BHMR center has many high-rise buildings and is densely populated. The peripheral areas do not have high-rise buildings, and the UHRI may be capturing high temperatures because of the NDBI.
Diagnostics for spatial dependence: Lagrange multiplier tests for error versus lag dependence.
Regression results for OLS and SLM for urban heat risk index.
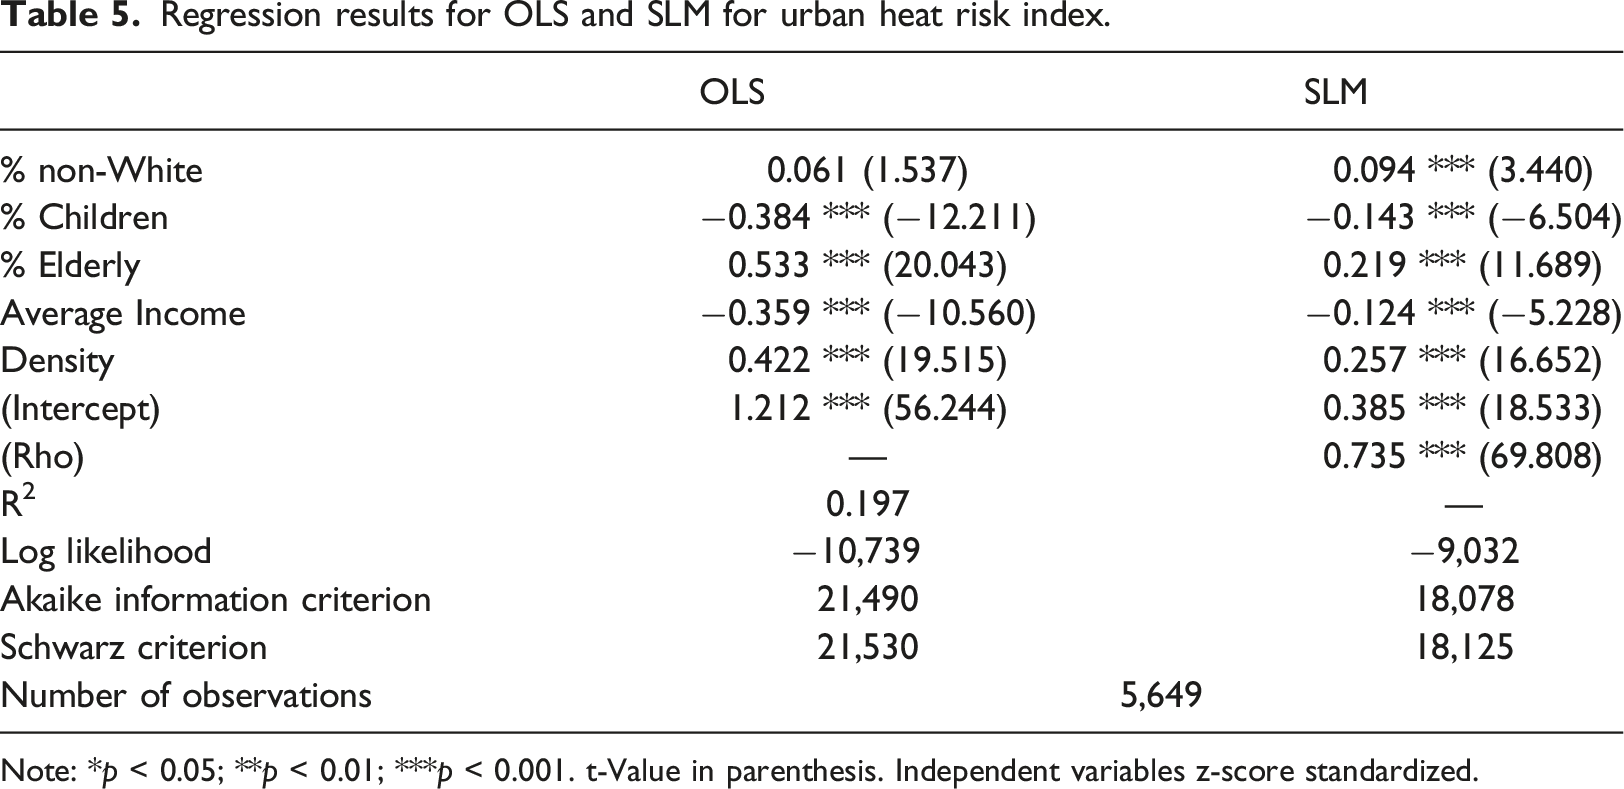
Note: *p < 0.05; **p < 0.01; ***p < 0.001. t-Value in parenthesis. Independent variables z-score standardized.
The non-White estimated coefficient is not statistically significant for urban heat risk in the OLS, whereas it is significant at the 0.001 level and positively associated with urban heat risk in the SLM, indicating that the higher the percentage of non-White populations in the census tract, the higher the heat risk index. The regression coefficient means that one unit increase in non-White contributes to a 0.094 unit increase in urban heat risk, for the SLM estimations. This result makes sense because Blacks and mixed races account for the majority of the extremely poor populations in Brazil (IBGE, 2019), demonstrating social vulnerability. Specifically, favelas, that is, Brazilian shantytowns, are occupied by various races, but non-White consists of 68.4% of the total racial composition (Werneck and Leal, 2011). Our study is thus consistent with the case studies of Chicago, Illinois, and Los Angeles, California (Mitchell and Chakraborty, 2015), and Richmond, Virginia (Saverino et al., 2021). Even though Brazilian cities did not suffer from redlining processes like in the US, a similar pattern of racial segregation can be observed in most urban areas across the country. And the residents of these non-White areas may be suffering from UHI effects as well.
In both models, the Average Income (our proxy for poverty) estimated coefficient is statistically significant and negatively related to urban heat risk, indicating that the lower the level of income in the census tract, the higher the heat index. One unit increase in average income is associated with a 0.124 unit decrease in urban heat risk, for the SLM estimations. Indeed, favelas and other low-income neighborhoods in Brazil do not have large areas of green infrastructure in their territory when compared to richer neighborhoods (Arantes et al., 2021). In addition, a systematic literature review on access to urban green spaces (UGS) by Rigolon et al. (2018) reveals that “Global South cities experience similar inequities in UGS quantity and quality as Global North cities, but that the former also face inequities in UGS proximity” (Rigolon et al., 2018: page 1). This suggests that even though North and South regions have opposite spatial distribution of social groups, the inequity experienced by the residents is similar in both.
The two vulnerable age cohorts (children and elderly) estimated coefficients linked to urban heat risk in both the OLS and SLM at statistically significant levels. The proportion of elderly is positively related to the urban heat risk index, and one unit increase in its proportion results in a 0.219 unit increase in urban heat risk, for the SLM estimations. In Brazil, the 2015 elderly profile was characterized by being non-White (48.7%), having an education averaging 6.1 years, and an income equaling less than one minimum salary wage (51.1%) (Travassos et al., 2020). In sum, the elderly population included in our regression models is vulnerable and is being affected by the heat index. Our study is consistent with some of the Global North literature on social vulnerability (for Charleston, South Carolina, see Tate et al., 2010; for Loures, Portugal, see Guillard-Gonçalves and Zêzere, 2018).
The coefficient estimate for proportion of children is negatively associated with the dependent variable at the 0.001 level, but its magnitude decreases more than half in the SLM. One unit increase in its proportion leads to a 0.143 unit decrease in urban heat risk in the SLM estimations. This result is counterintuitive because the presence of children is a commonly used variable to capture high social vulnerability. Knowing that in Brazil, lower income women have higher fertility rates (Marteleto et al., 2017) one would expect that greater number of children would be associated with high heat risk. This result is partially consistent with the research of Mitchell and Chakraborty (2015) demonstrating that those aged 5 and under are negatively related to heat risk in the US metropolitan areas (New York metropolitan areas and Los Angeles metropolitan areas).
Population density has an estimated coefficient that is significant in both models, and it is positively associated with the dependent variable, indicating that the higher the population density, the higher the heat index was. Knowing that in the BH municipality during 2010, “high-income dwellers [were living] in densely populated areas in high-rise buildings, and most low-income dwellers [were living] in single-family homes” (Haddad, 2020: page 6), this result is counterintuitive from the social vulnerability perspective. This may be explained by the large number of side facades from high-rise buildings that absorb heat, despite the green infrastructure that exists in higher income neighborhoods. It is important to highlight that in Brazil, even though wealthier neighborhoods have larger extents of green infrastructure than lower income ones, still the amount of green infrastructure in cities from the Global South is much smaller than urban areas of the Global North.
We must acknowledge that our findings are based on the use of the Landsat LST that has well known limitations of being collected at about 10:15 local time, a sub-optimal time of day for heat risk evaluation. However, given this difficulty, we still determined that certain vulnerable groups, including non-White, the elderly, and the low-income, were at higher urban heat risk in the BHMR in 2015. Therefore, we partially accepted our research hypothesis: High urban heat risk is concentrated in areas with high proportions of non-White, the elderly, and low-income, while high urban heat risk is not concentrated in areas with a high proportion of children.
Conclusion
In this case study from the Global South, we examined the spatial pattern of UHIs in the BHMR conurbation and the spatial relationships between urban heat risk, urban form composition, and vulnerable social groups using data from 2010 to 2015. We used a remote-sensing technique to estimate land surface temperatures and urban form composition indices for built-up (NDBI) and vegetation (NDVI), obtaining the urban heat risk index. For the first posed question—What is the spatial pattern of urban heat risk in the study area in 2015?—our results showed that the region was experiencing UHIs, which were unequally distributed across the study area, having high heat risk concentrated in the urban core, as shown by ESDA techniques. For the second question—How is the spatial pattern of urban heat risk linked to the socio-economic characteristics of residents in the study area? —our regression models demonstrated that some vulnerable social groups were at greater heat risk than others. This demonstrates that heat inequity was taking place in the region. High urban heat risk was more concentrated in areas where residents were non-White, elderly, and low-income.
We concluded that the hypothesis—high urban heat risk is more likely to be concentrated in areas where residents have vulnerable socio-economic characteristics—was indeed happening for three out of four variables used to capture vulnerable social groups. Our case study exemplifies that climate justice is not taking place in BHMR, and specifically, heat inequity is being experienced by vulnerable social groups. The metropolitan region does not have an active regional governance approach to plan for UHIs mitigation but a few signs about planning for climate change are starting to be considered by a few municipalities that compose BHMR. For example, BH municipality launched its Climate Action Plan (CAP) in December of 2022 (Prefeitura Municipal De Belo Horizonte, 2022). The plan does mention climate justice and refers very briefly to heat, but without defining specific goals, objectives, and actions for implemetation. Still, this is movement in the right direction.
Within the climate justice framework, one recent study sheds some light on how to move forward with climate mitigation and adaptation strategies that could also bring equity and justice to the processes. Anguelovski and Corbera (2023) discuss the importance of nature-based solutions (NBSs), which are central strategies to mitigate UHIs. They present an alternative to NBS so that “projects build nature-inspired justice that prioritizes the needs, identities, and livelihoods of the most ecologically and socially vulnerable residents” (page 1). Among other principles, they suggest that justice-oriented NBS projects should clearly assess the mitigation and adaptation benefits that can be achieved as well as clearly assessing the climate risks and impacts that can be avoided or addressed (Anguelovski and Corbera, 2023). They exemplify this principle with the Quito CAP because some of the projects meet both ecological and social goals by reducing risks of landslides and erosion through reforesting and protecting indigenous lands. Global cities not only need to develop their CAPs based on climate justice framework but also find ways to implement justice-oriented programs and projects. Anguelovski and Corbera (2023) work truly contributes to the latter.
Our findings imply that heat inequity is a major obstacle to “make cities and human settlements inclusive, safe, resilient, and sustainable” (United Nations Department of Economic and Social Affairs, 2006). Therefore, we recommend that urban heat management strategies, including NBS, should be implemented in the neighborhoods where vulnerable social groups reside and in areas where there is high population density. Firstly, it is necessary to prevent the construction of high-density buildings and increase green infrastructure, which has an important role in urban heat mitigation (Saaroni et al., 2018). The production of green infrastructure should be based on community engagement from start to end to assure a bottom-up approach which can lead to more sustainable solutions and higher ownership from residents (Campbell-Arvai and Lindquist, 2021). Secondly, conventional roofs should be replaced with cool roofs in high-density urban areas. Treating new surface materials or coatings, cool roofs can save 15–35.7% of energy and reduce roof surface temperatures by 1.4–4.7°C compared to conventional roofs (Rawat and Singh, 2022). Thirdly, cool pavements should be treated in urban areas to alleviate heat risk by road pavements. Cool roofs and cool pavements may be supplementary strategies to reduce urban heat risk by reflecting more solar radiation and absorbing less heat energy. Lastly, it should be encouraged to construct public cool shelters or adapt existing buildings for that type of use. Although air-conditioning is a typical heat risk mitigation strategy in the Global North, most people in the Global South do not use it, and for vulnerable populations access to air-conditioning is even more challenging because they can rarely afford it.
To deeply understand urban heat inequity, it is important to conduct more studies across the globe to allow comparison under different urban forms. This will provide insights to planners and policymakers that work with improving the quality of life of all urban residents. In addition, further research should focus on a longitudinal study, analyzing the difference between past and present vulnerable socio-economic status in relation to UHIs. Future qualitative research should also be conducted to understand how cities from the Global South are including climate justice in their CAPs and how they are implementing justice-related strategies focusing on UHIs. As planners continue to advocate for heat equity, it becomes very important to prioritize inclusionary approach. The recommendations such as the ones described above should become reality in urban areas from both North and South. Otherwise, the concept of climate resilient communities will only exist in the literature.
Footnotes
Acknowledgments
The authors are grateful to the editor and anonymous reviewers for providing constructive feedback on the manuscript. The authors would like to thank Dr. Ana Clara Mourão Moura for providing some of the spatial data used in the analysis.
Declaration of conflicting interests
The author(s) declared no potential conflicts of interest with respect to the research, authorship, and/or publication of this article.
Funding
The author(s) received no financial support for the research, authorship, and/or publication of this article.