
Abstract
The skyline is a comprehensive display of the morphological characteristics and cultural features of a city, and its quantitative evaluation is remarkable for perceiving the city and assisting in its planning. However, previous studies focused on the overall profile or tall buildings, lacking a perspective that considers the composition of skyline objects. This paper proposes a new quantitative method to evaluate the skyline based on the object-based analysis method and the constitution theory. Firstly, the skyline objects, that is, buildings, vegetation and mountains are extracted by using the object-based image analysis method. Secondly, the buildings are further classified into four classes according to their relative height. Then, two quantitative indicators, namely, richness of the object category variety and complexity of the object category spatial distribution, are proposed by considering the constitution theory. Finally, this method is applied to typical urban skylines in Shanghai, Hong Kong, New York and Vancouver. Results show that the new indicators can effectively represent the differences of city skylines when their profile indicators are relatively similar. The method can quantitatively evaluate the composition and spatial distribution of skyline objects. This paper is expected to provide a new perspective on the study of skyline aesthetics.
Introduction
The Oxford English Dictionary defines skyline as the outline or the silhouette of buildings or other objects seen against the sky. An urban skyline is a unique city fingerprint. The mentalities, diversity and cultures in a city can often be perceived from its skyline. A city has an infinite number of different skylines, depending on the viewpoint and the viewing direction (Guney et al., 2012). Some skylines might be conceived as representing a city’s spatial, social and cultural characteristics; all of them abstract the city (Gassner, 2009). Research has shown that the form of the urban skyline is an extremely important component of the city aesthetic attributes (Heath et al., 2000b). It has emerged as salient in human perception of the environment (Nasar, 1994), and it has relevance to environmental design (Lozano, 1974). An aesthetically pleasing skyline can make residents feel good whilst deepening their sense of identity and recognition of the city. Therefore, the extraction and evaluation of skyline are important for cognition and planning of the city.
After recognizing the influence of skyline aesthetic attributes on cityscape, scholars began to seek quantitative aesthetic evaluation methods. These methods include fractal geometry, entropy and other theories to calculate the numerical characteristics of the skyline (Bostanci and Ocakçi, 2009; Chalup et al., 2009; Ostwald et al., 2015). These methods allow measurability; hence, they carry important potentials for the evaluation of urban aesthetics (Guney et al., 2012). For example, fractals, aesthetics and nature have been intimately connected ever since Mandelbrot (Mandelbrot and Mandelbrot, 1982) declared that ‘there is a fractal face to the geometry of nature’ (Stamps, 2002). The fractal dimension has also become an evaluation indicator of the skyline aesthetic attribute. Bill Lim dealt with the development of a quantified model for the investigation of skyline preferences (Lim and Heath, 1994). Tom Health presented the concept and quantification formula of complexity and states: ‘Complexity is widely regarded as a variable influencing people’s response to settings and artifacts’ (Heath et al., 2000a). As a scene’s complexity increases, the scene elicits higher levels of attention and exploration (Iii et al., 2005). Most of the current studies evaluate the skyline from the perspective of tall buildings (Heath et al., 2000b; Karimimoshaver and Winkemann, 2018; Short, 2004), and some consider the overall skyline profile. People’s perception of the urban skyline does not only focus on tall buildings, even though tall buildings make up a large part of it. Similarly, people are concerned with not only the skyline profile but also the composition and distribution of natural and artificial objects along the skyline. Artificial (including cultural and socioeconomic aspects) and natural (including mountains and waterbodies) contexts should exist coherently and in harmony with one another. Therefore, when evaluating the skyline, all the objects presented in the skyline should be considered.
Skyline extraction is the foundation for skyline evaluation. The previous methods can be divided into two ways. One is to use edge detection operators combined with other optimization algorithms to identify skyline profile (Ayadi et al., 2016; Lie et al., 2005; Zafarifar et al., 2008). In addition, with the development of machine learning techniques, machine learning algorithms such as convolutional neural networks (Frajberg et al., 2017) and support vector machines (Ahmad et al., 2015) have been applied in the detection of skyline outlines, which has become another way for skyline extraction. Current methods are at the pixel level, aiming to find the pixel grey threshold values between sky and nonsky regions. The pixels on the skyline have an aggregated distribution pattern. The object-based image analysis methods are well developed (Blaschke, 2010; Hossain and Chen, 2019; Chen et al., 2018), which provides a new means for skyline profile and its component extraction.
The objectives of this paper are to (1) extract skyline objects, such as buildings, vegetation and mountains, by using the object-based image analysis method; (2) quantitatively evaluate the skyline by a new perspective of object composition and (3) discuss the advantages of this new evaluation method by comparing with other methods.
Method
The method consists of three steps: object-based skyline extraction, skyline remodelling and calculation of quantitative skyline evaluation indicators. Its flow chart is shown in Figure 1. Object-based skyline extraction is the foundation, which divides the skyline into a number of objects according to categories, that is, buildings, vegetation and mountain. This step obtains the initial skyline. The skyline remodelling part is implemented using an algorithm. The algorithm takes the initial skyline as input, and its main function is to classify buildings into different classes and calculate object property statistics. The final step is the calculation of quantitative indicators. This step is based on statistical information from the previous step and then calculates the results for richness of object category variety and complexity of object category spatial distribution. Flow diagram of evaluation method.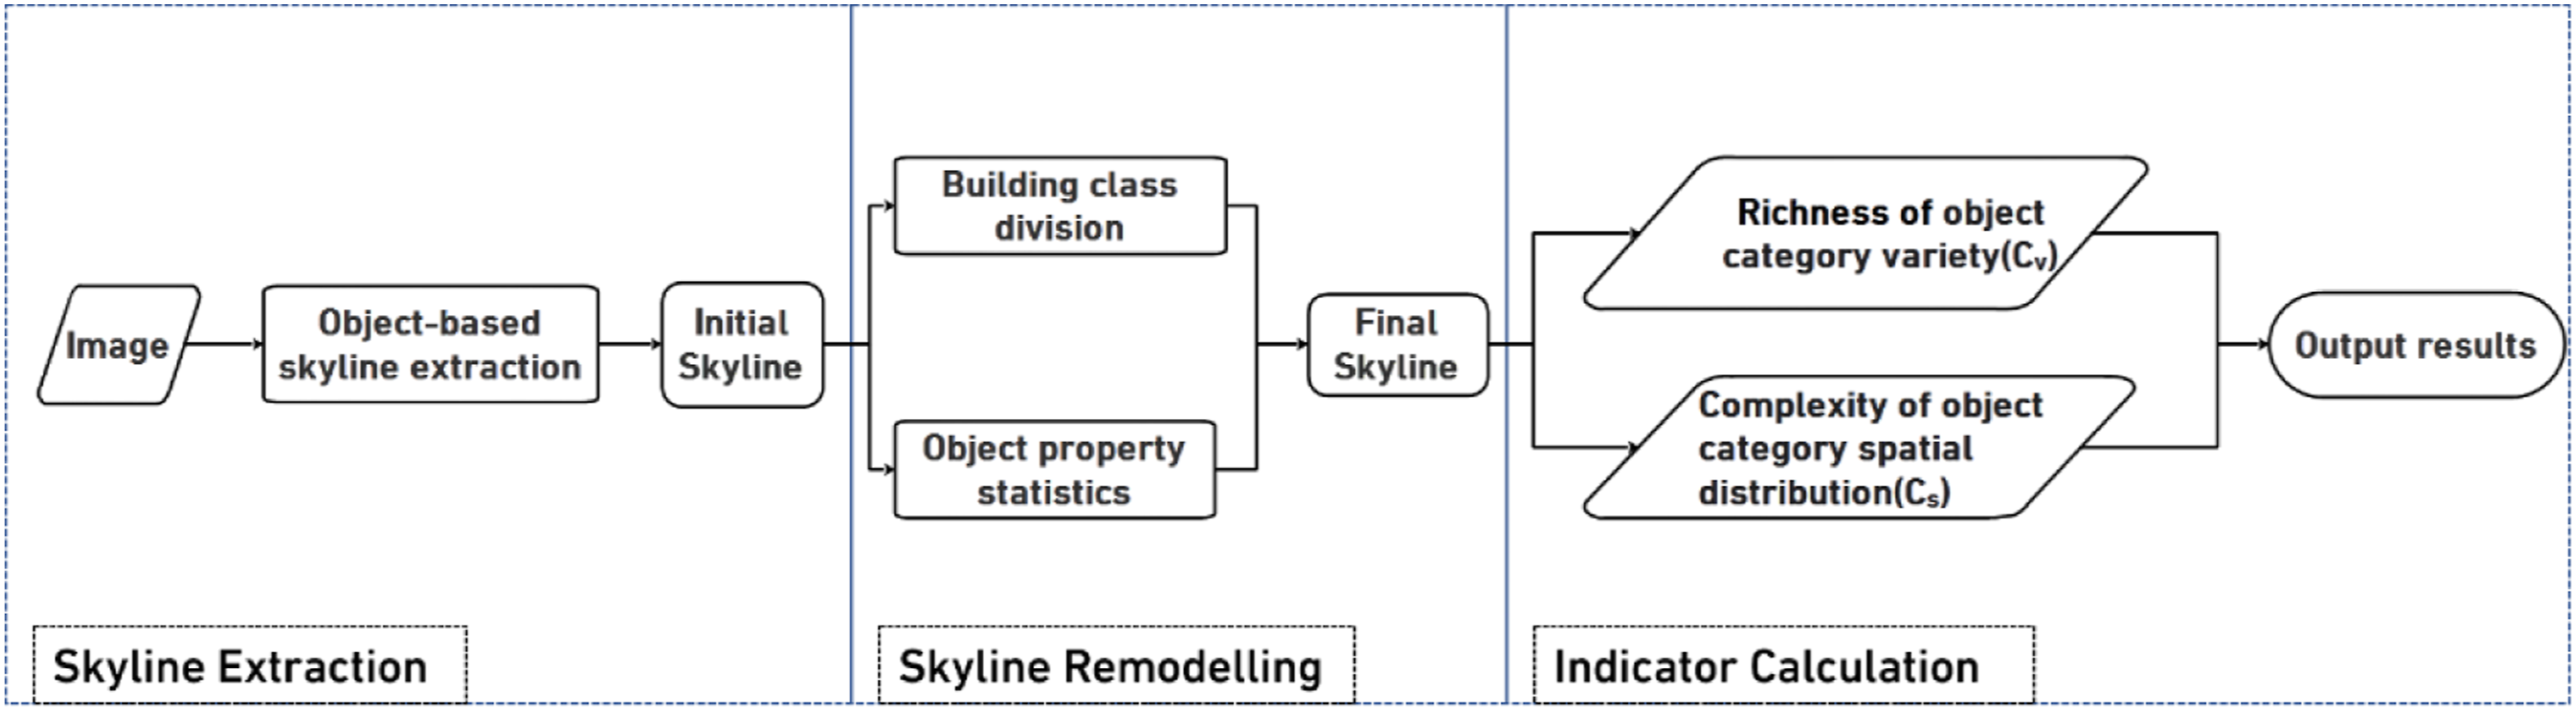
Object-based skyline extraction
Images can show the cityscape as observed from a particular viewpoint and direction. The first step of skyline evaluation is to identify the skyline from the image. The basic idea of previous skyline extractions is to find the pixel grey threshold value between the sky region and the nonsky region, which results in a continuous single line without considering its semantic difference in its different locations. Pixels on the skyline have a spatially aggregated distribution pattern. Pixels of the same feature are distributed continuously in the skyline, that is, skylines are often composed of several spatially contiguous objects, and the pixels inside the objects are relatively homogeneous. Therefore, skyline extraction can be implemented with an object-based idea. From this idea, the skyline extraction can be seen as a classification. The first step is the classification of sky and nonsky, and the second step is the classification of different objects in the skyline. Previous studies also showed that the object-based classifier is a substantially better approach than the classical per pixel classifiers (Myint et al., 2011). Therefore, the object-based classifier with its advantages of reducing the fragmentation of the classification results and facilitating the evaluation of the richness and distribution characteristics of the skyline objects is employed.
The object-based method involves two steps: segmentation and classification. The main task of segmentation is to partition the whole image into a series of closed objects (Wang et al., 2004). The segmentation strategy used in this paper is the multiscale segmentation algorithm (Figure 2). The algorithm is a bottom–up region merging technique. The smallest seed contains one pixel. The seed then grows within the image scene based on spectral similarity and the contrast of a seed with neighbouring candidates (Dingle Robertson and King, 2011). This process stops when the smallest growth exceeds the threshold defined by the scale parameter (Laliberte et al., 2004). A larger-scale parameter results in larger image objects (Benz et al., 2004). This algorithm contains three parameters, scale, colour (spectral information) and shape (smoothness and compactness), where colour and shape parameters can be weighted from 0 to 1. Scale is a unitless parameter related to the image resolution (Laliberte et al., 2004). Scale parameters are generally determined by the user through continuous experimentation based on image size and resolution. The colour and shape parameters represent the homogeneity criteria of the object, and the sum of the weights of the two parameters is 1. The smoothness and compactness in shape parameter can also be weighted from 0 to 1. A higher smoothness emphasis would be used to define objects observed to have greater variability between blocks. The compactness weight enables separating objects that have quite different shapes but not necessarily a great deal of colour contrast (Flanders et al., 2003). In this paper, the optimal parameter set of parameters is not unique because the image size and spectral information of each urban skyline are different. In many of the current studies (Im et al., 2008), the optimal parameter set is obtained by continuous experimental improvement. In this paper, the final scale parameters determined by informed trial and error are 40 for Shanghai, 20 for Hong Kong, 20 for Vancouver and 40 for New York. The weights of the colour and shape parameters are set to 0.9 and 0.1, respectively, for all four cities, emphasizing the importance of block colour over shape. In the shape parameter, smoothness and compactness are set to 0.5. The optimal parameter set is validated by the ability to distinguish the features above and below the skyline accurately. Flow diagram of multiresolution segmentation (Adapted from eCognition User Guide).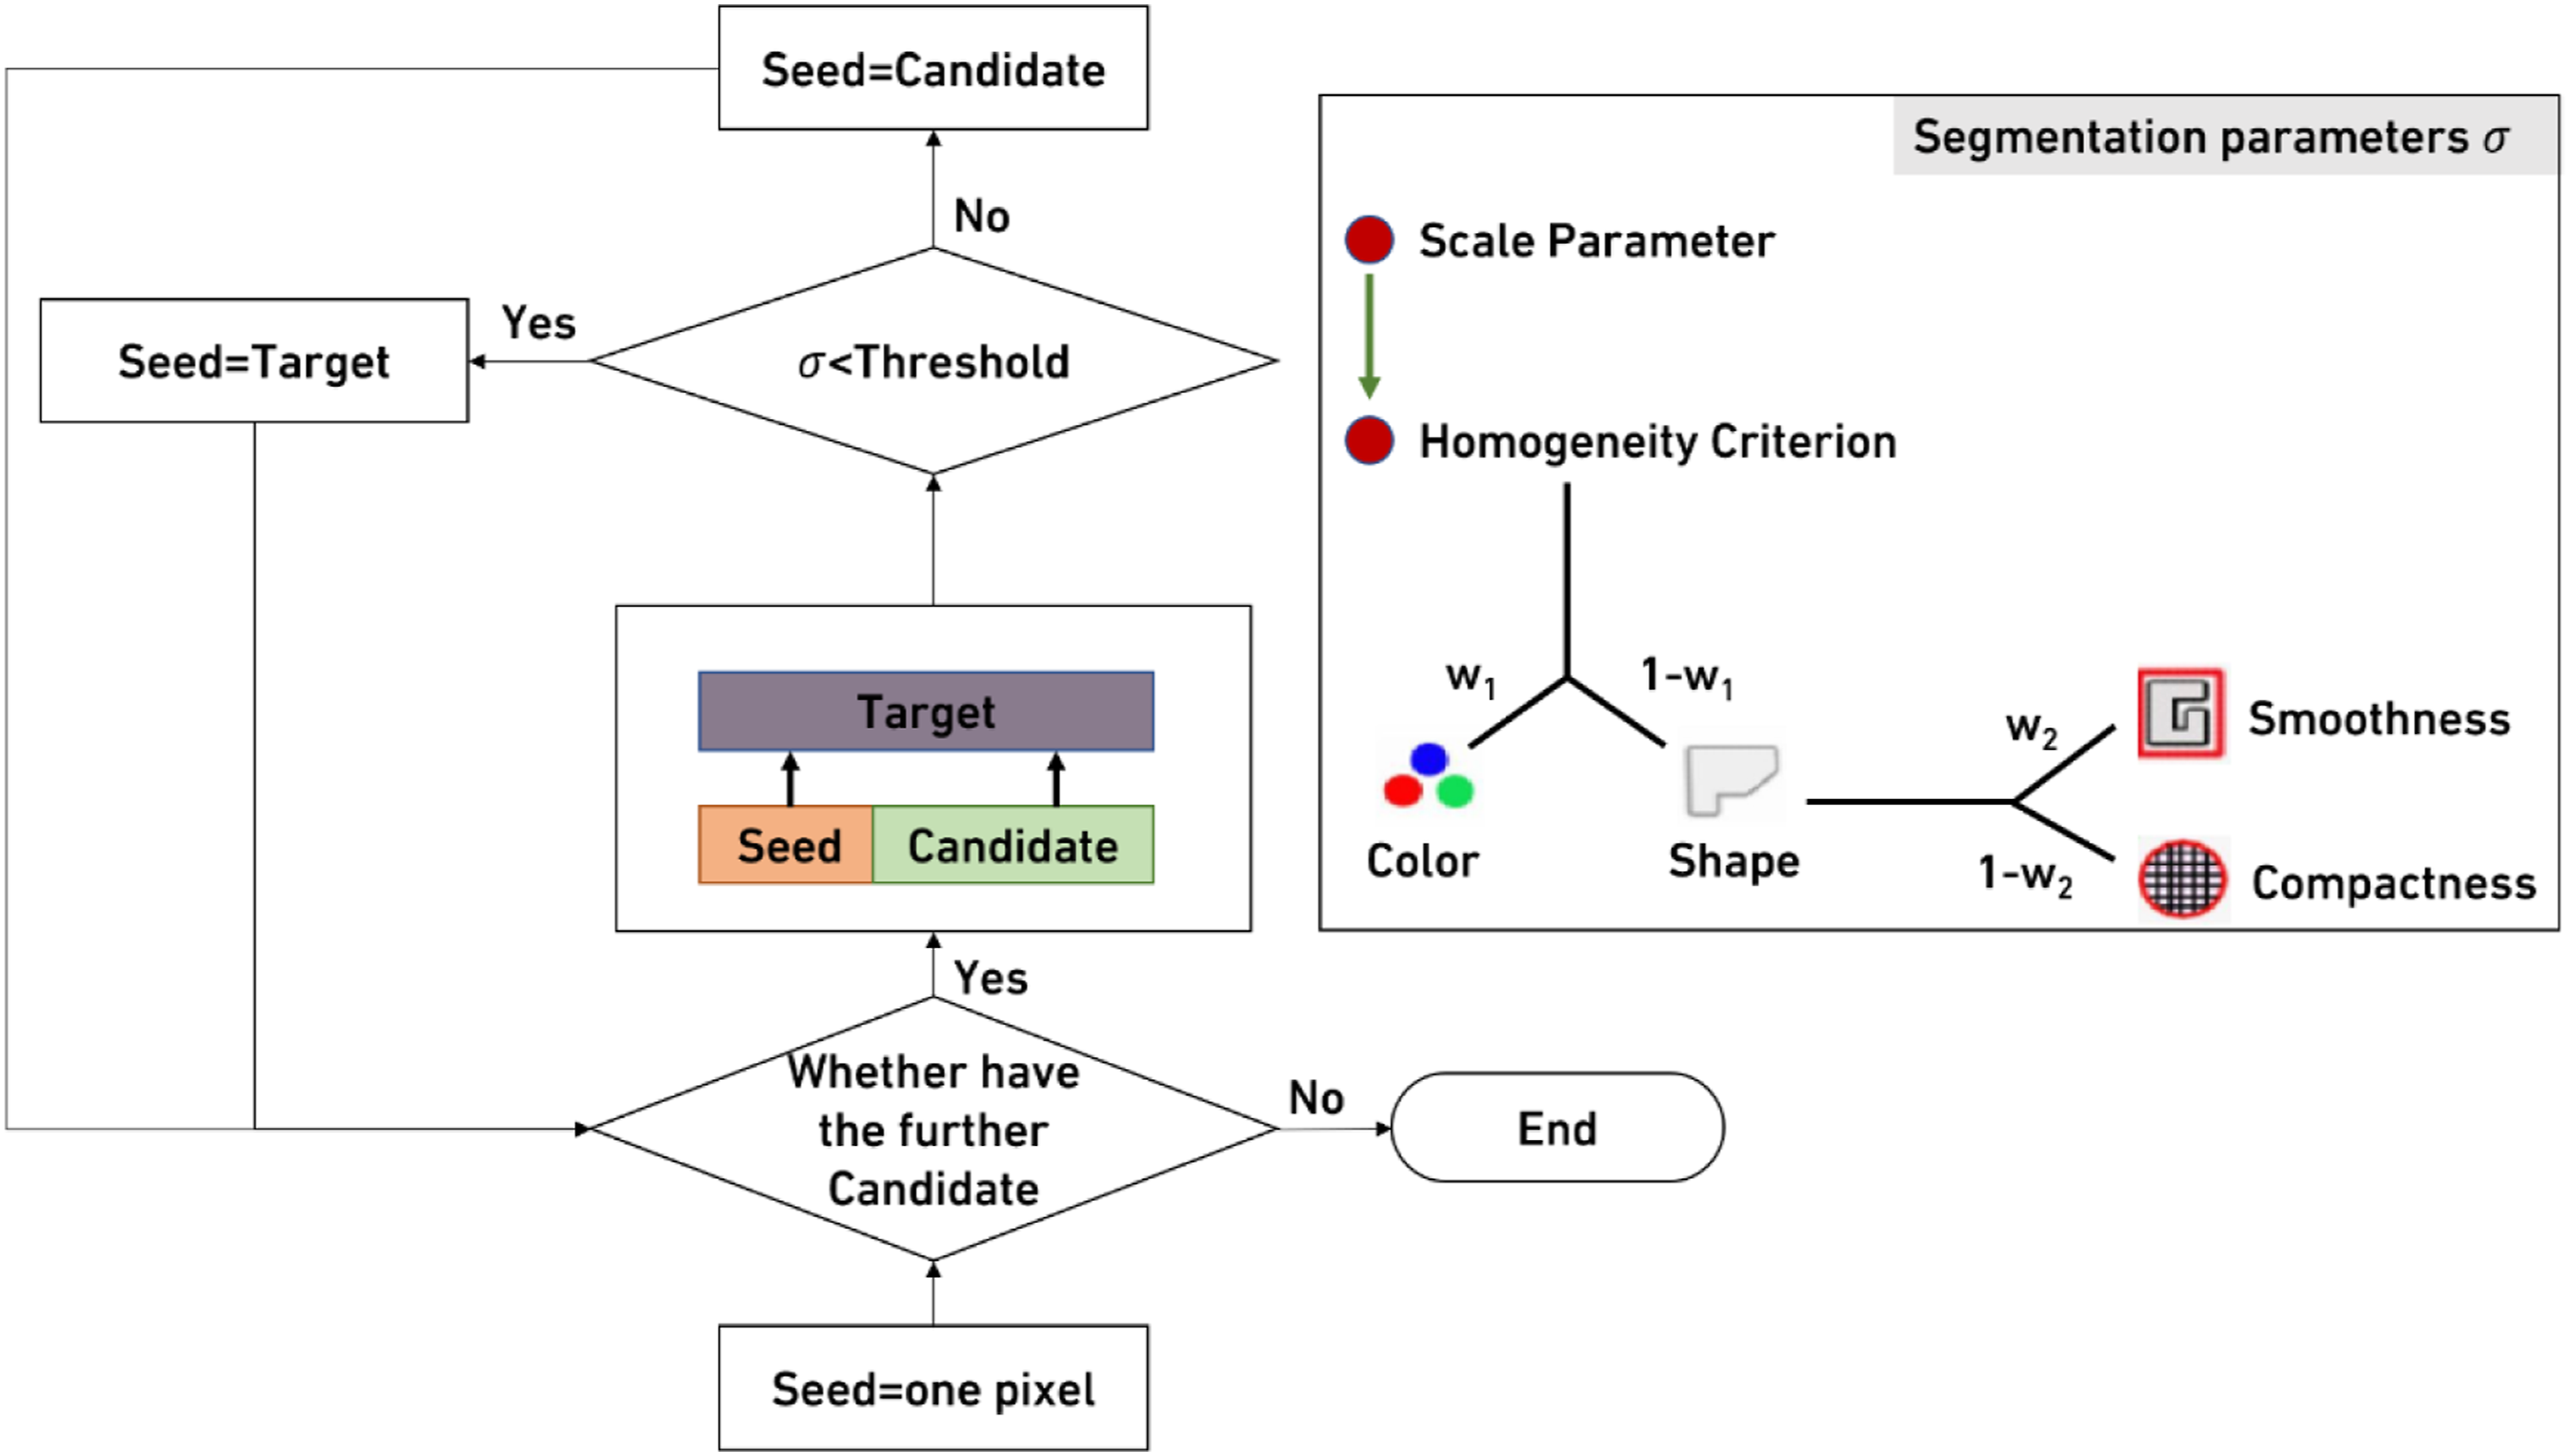
The task of classification is to determine the category of these objects. The classification methods can be summarized in two types: rule-based classification and sample-based supervised classification. Rule-based classification is a deductive approach from the statistical characteristics of input data. The commonly used algorithms are threshold classification and affiliation classification. The supervised sample-based classification depends on the samples selected by the user and usually obtains a relatively satisfactory result. Commonly used algorithms are nearest neighbour (NN), random forest and SVM. In this paper, the NN algorithm is used to implement classification (Cover and Hart, 1967), which is a method to distinguish objects based on the nearest neighbouring training samples in the feature space. The basic idea of the algorithm is that for each segmented object, its nearest neighbouring sample object is found according to the feature space, and then the category of that object is set to the category of the sample object. Therefore, two steps need to be completed before performing NN classification: defining the feature space and selecting the samples. The feature space can contain spectral, geometric, texture and other feature parameters. The feature space for this experiment is defined as the mean value of RGB and luminance information inside an object. The next step is the selection of the samples. Firstly, the categories such as building, mountain and vegetation are determined according to the image of each city. Then, representative samples are identified for each category. Generally, a necessary category edit is done to correct the misclassed objects. The above experimental operations are realized by using eCognition software, which integrates software environment for multiresolution segmentation and object-oriented fuzzy-rule classification (Blaschke et al., 2000).
After obtaining the classification results, redundant lines are removed using ArcGIS software. The output obtained in this step is the initial skyline, which distinguishes between different object categories (e.g., buildings, vegetation and mountains). However, the initial skyline cannot reflect the differences of buildings, so the skyline needs to be remodelled.
Skyline remodelling
Urban architecture is an important component of urban skyline. The difference in distance between viewpoints and buildings and the difference in the actual height of the buildings provide an undulating pattern to the profile of urban buildings. Previous studies showed that tall buildings have a remarkable effect on urban infrastructure and environmental quality (Heath et al., 2000b). Generally, tall buildings have a stronger visual effect and iconicity. However, from the perspective of skyline integrity and composition, other buildings also have corresponding aesthetic value. The undulating and staggered building outline make the skyline more aesthetic. Therefore, buildings are classified considering the height information displayed on the skyline.
The main role of skyline remodelling is to classify the buildings into different types. Besides, the information such as individual building length and height will be extracted for indicator calculations. The algorithm consists of four steps. Its flow chart is shown in Figure 3. (1) Extract all building points Flow diagram of skyline remodelling.
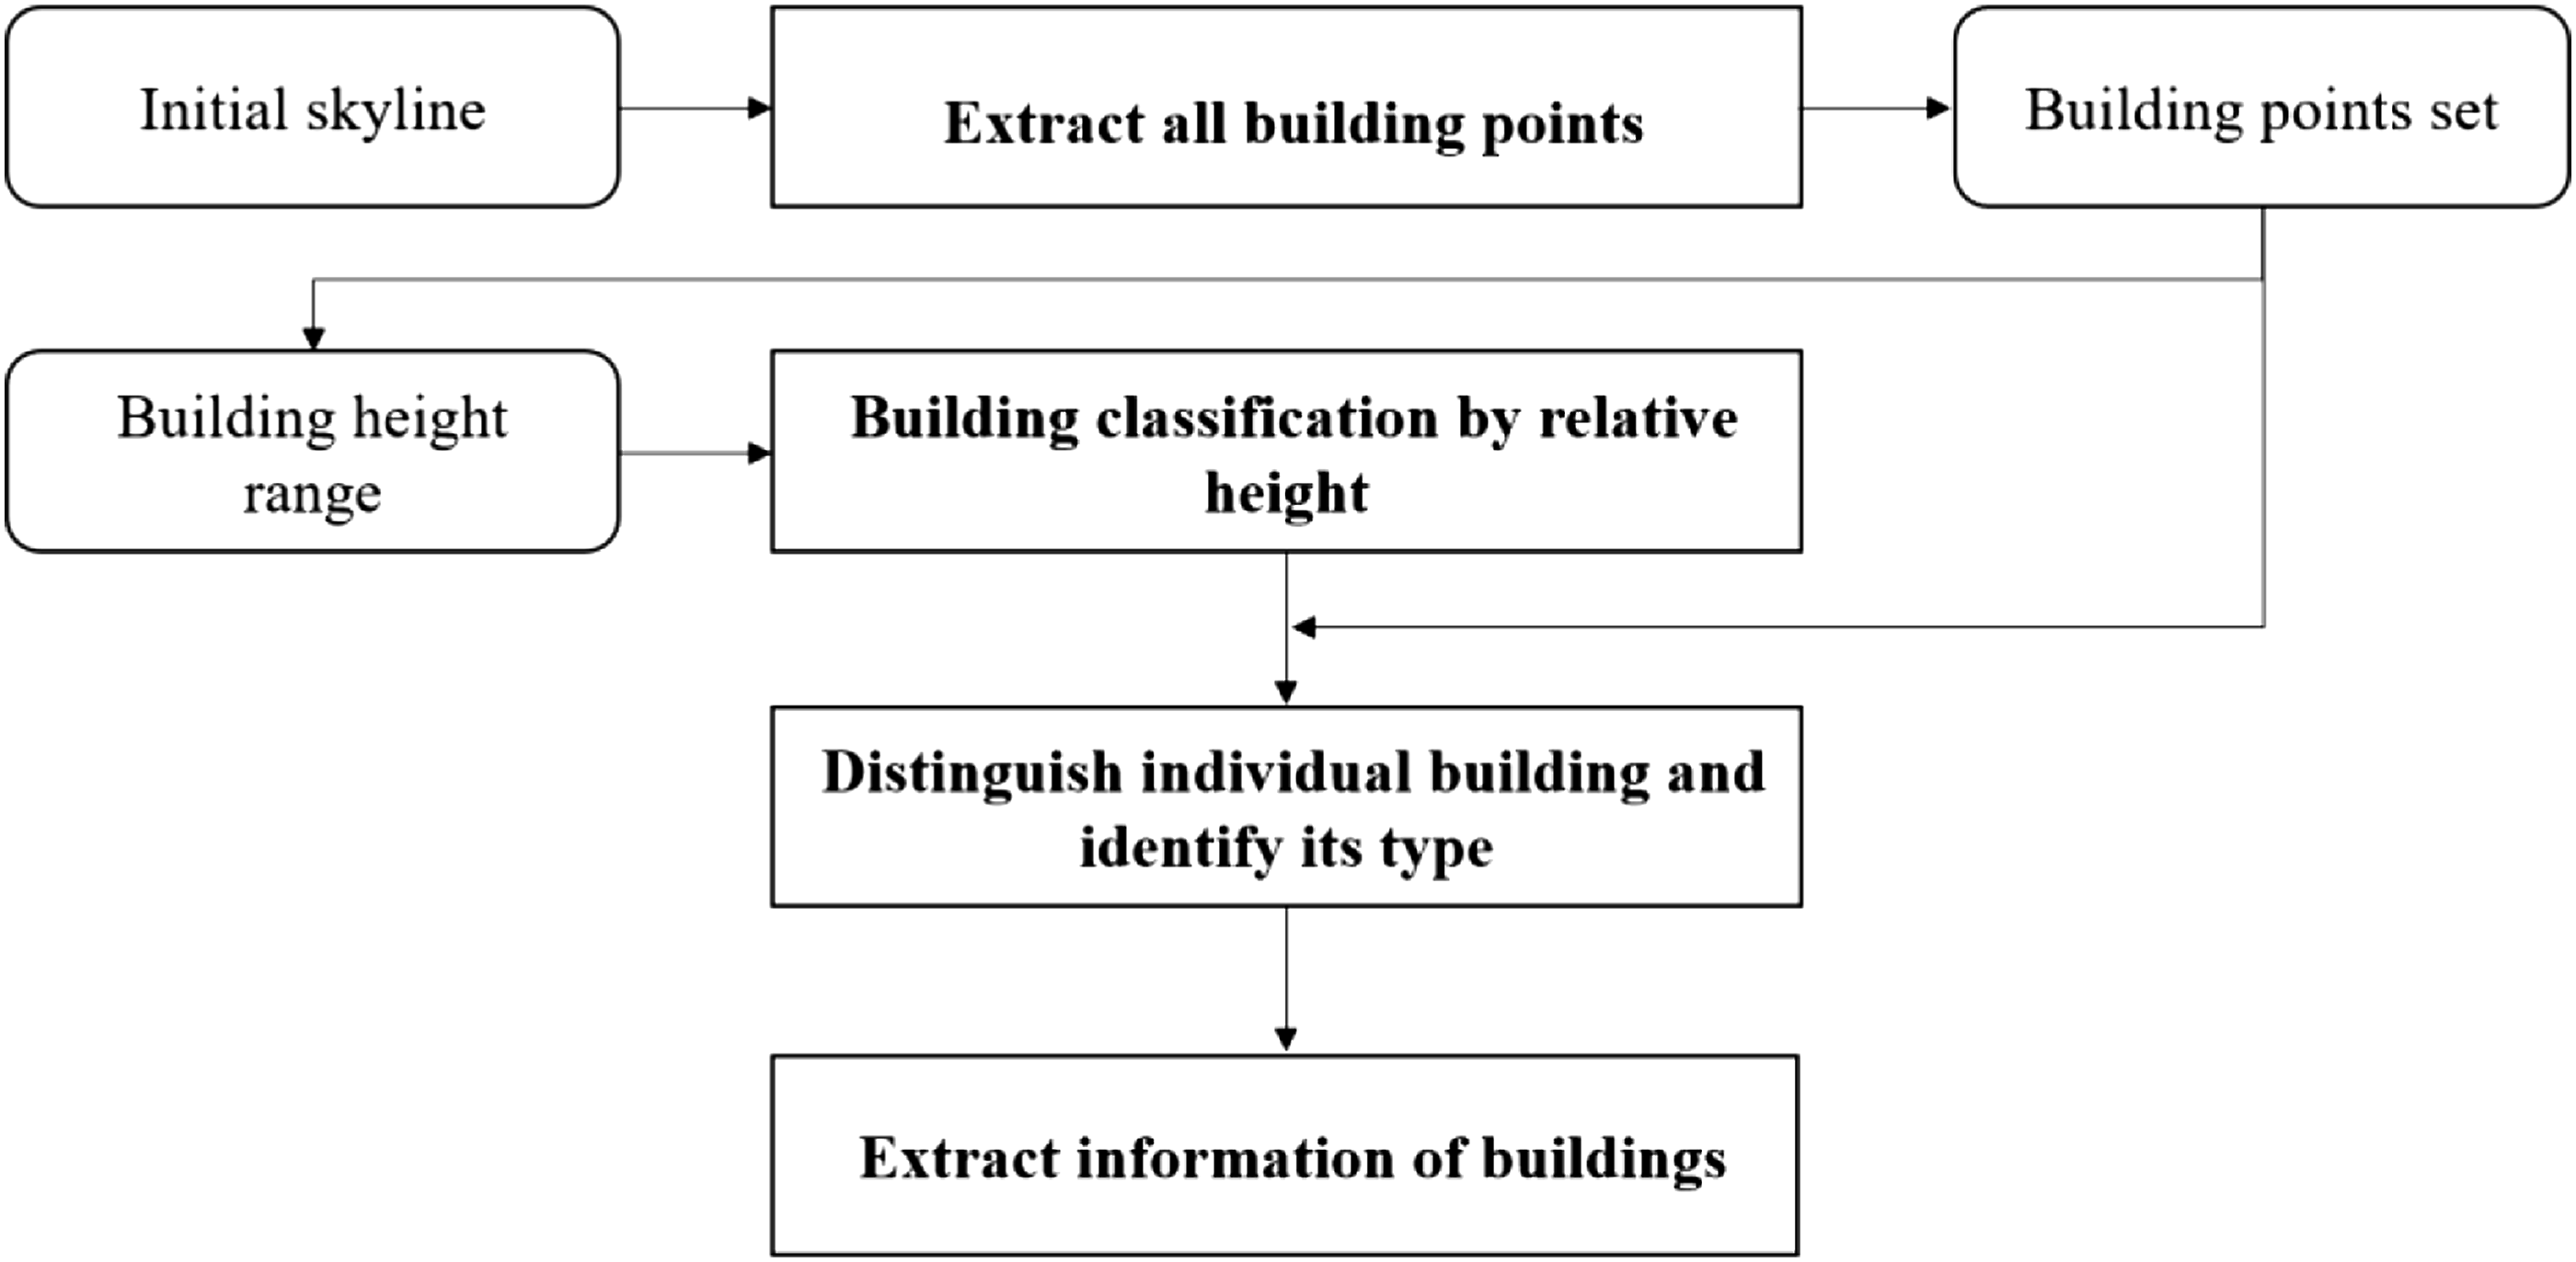
The initial skyline distinguishes between different object categories (e.g., buildings, vegetation and mountains). In this step, a point set is constructed to store the information of all vertices on the initial skyline, including category, height and position. During this process, all points with category of buildings are extracted. (2) Building classification by relative height
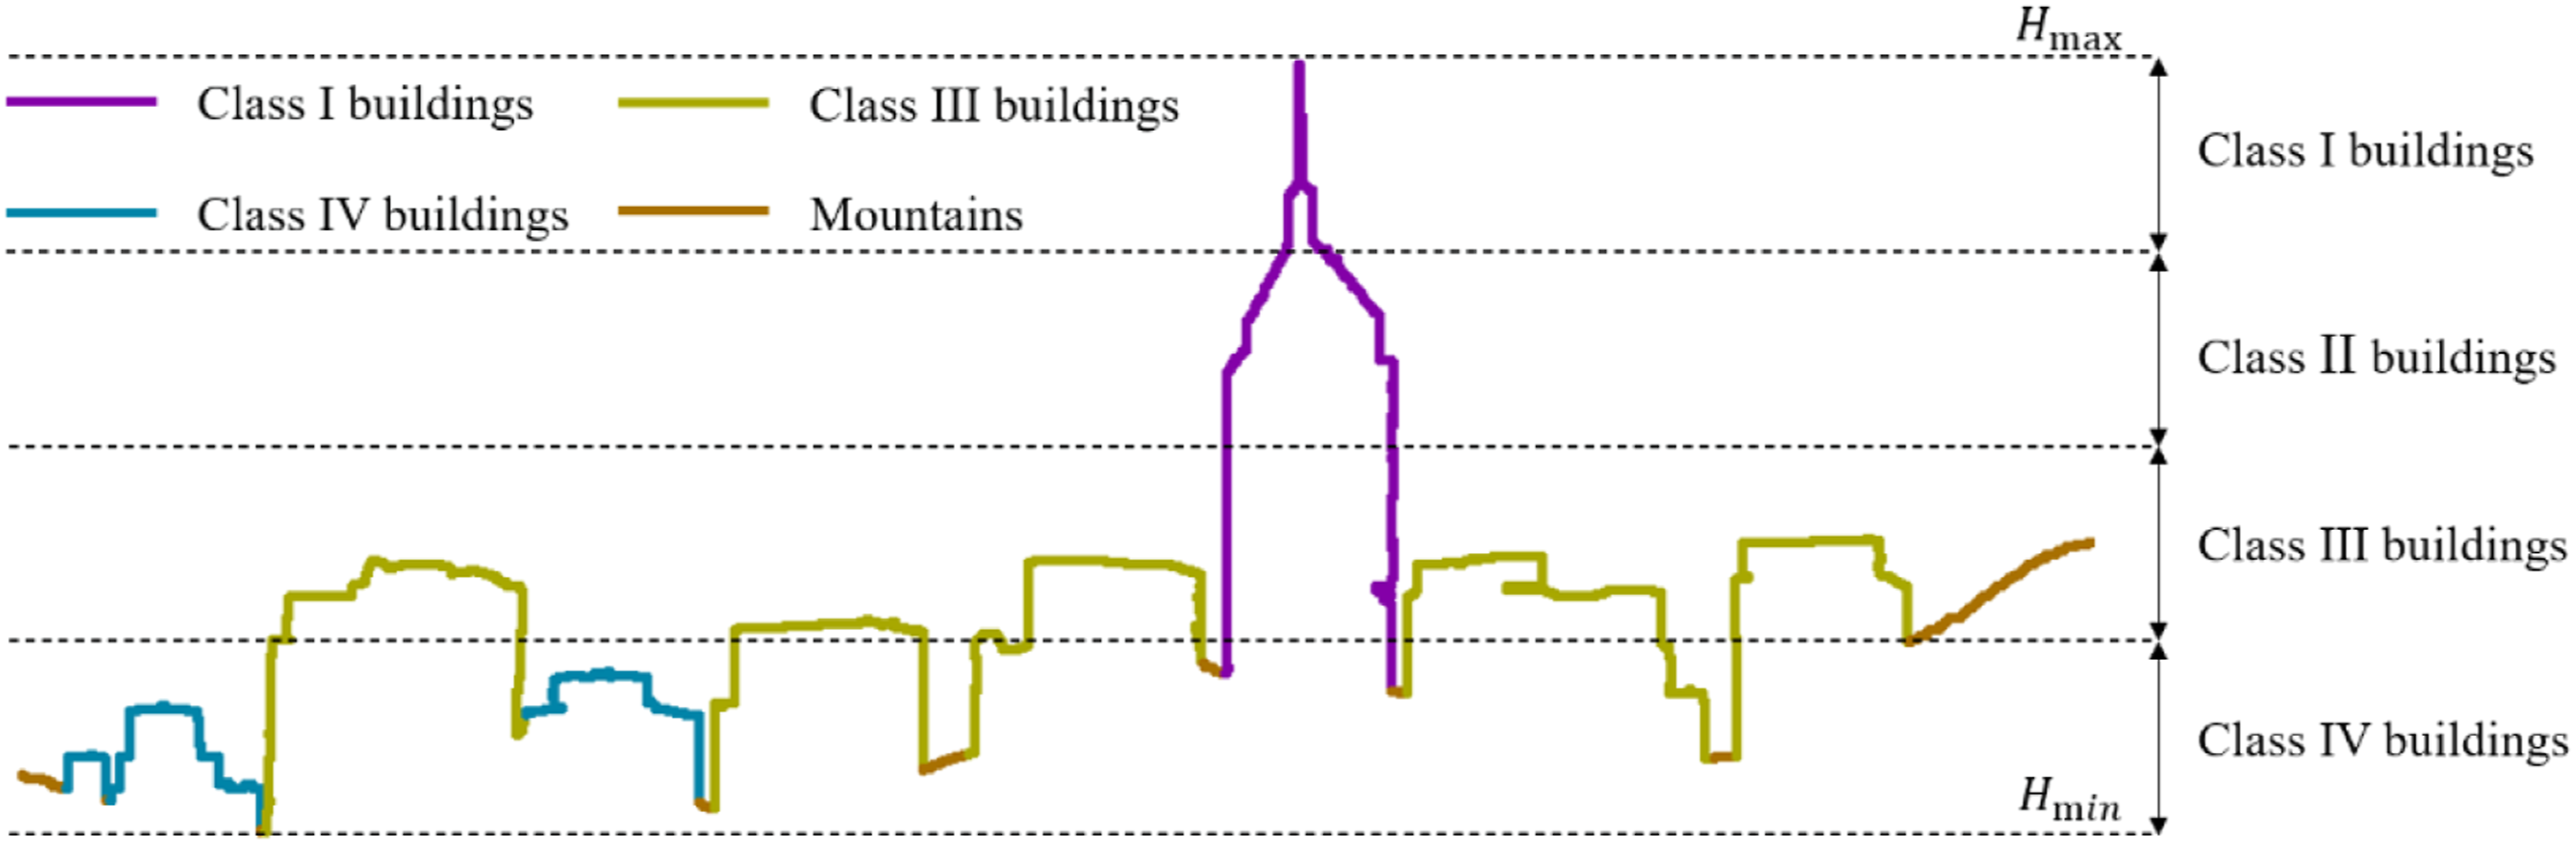
This paper addresses the aesthetics or complexity of the skyline as observed from a defined viewpoint and direction. The building usually deforms to certain degree by the impact view projection, and its height is difficult to obtain without the necessary information such as the location and altitude of viewpoint, and the distance from viewpoint to buildings. The relative height presented by the buildings on the skyline is more applicable to quantitative evaluation from the perspective of visual landscape. Therefore, a classification threshold is delineated for the relative height difference of the building, as shown in Figure 4. The highest and lowest points of the building section are firstly identified to obtain the building height range. The height range is equally divided into four classes from the highest point to the lowest point, corresponding to the four classes of the buildings. The building heights in this paper differ from the reality building height. It is only from a visual point of view, and they are named as Class I buildings, Class II buildings, Class III buildings and Class IV buildings. (3) Distinguish individual building and identify its type Building classification diagram.
The type of each individual building has to be determined after obtaining the height range of each building type. The strategy we use is as follows: traverse the building points set, compare the height of the ith point and the i + 1th point, if Hi + 1 > Hi, tag Hi + 1 as the highest point of the individual building, until Hi + 1 < Hi, stop updating the highest point height. Continue traversing the remaining points until the next time Hi + 1 > Hi, which means the end of the individual building, record this point as the starting point of the next building and repeat the above process. Here, a threshold of five is set to remove the influence of small bumps on the building. In other words, if an individual building has a height less than 5, it will be merged with the previous one. (4) Extract information of building
Finally, the algorithm merges the adjacent building that belongs to the same type, and calculates the statistics relating to the skyline, such as the total length of the skyline, the length of each object and the number of classes. This information will be used for indicator calculations.
Quantitative indicators for skyline evaluation
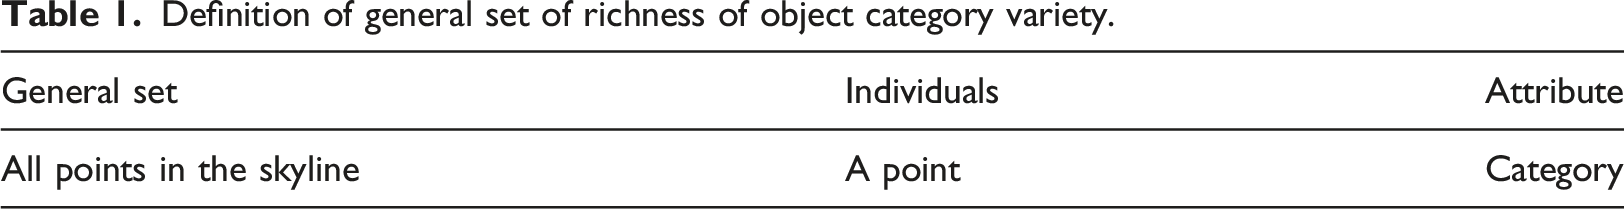
After distinguishing different object categories and classifying the buildings with dissimilar heights further, the constitution theory can be used for the evaluation of the skyline. The constitution theory provides a universal concept, model, principle and method for describing objective things in terms of their ‘composition’ (Zhang, 2003). Three concepts are included in this theory: general set, distribution function and complexity.
The general set is a quantitative model that describes the variability of an attribute within the set and the quantitative characteristics of the individuals corresponding to that attribute. The general set has the concepts of total, individual and flag. The total is composed of individuals, and the individuals are homogeneous, that is, from a certain attribute, the individuals must be identical and have relative indivisibility. For example, a point in a line can be considered an individual, and the line is a total. If points in this line have a different category attribute, then the ‘category’ attribute can be used as a flag to describe the difference of individuals.
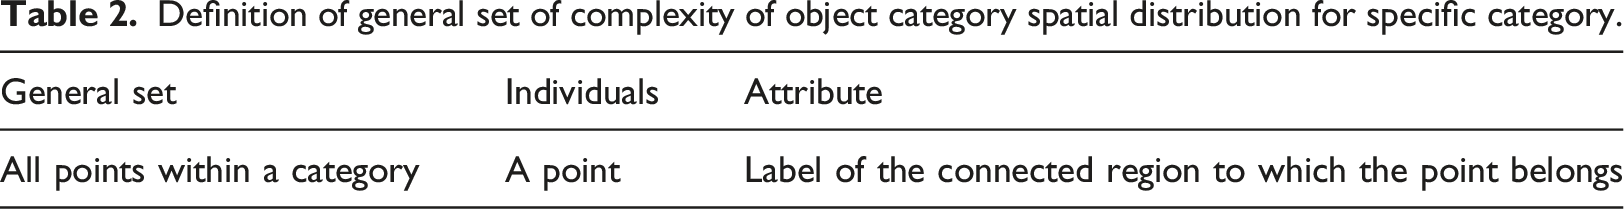
Owing to the most evident and intuitive characteristics of the skyline is the richness of the category that makes up the skyline. This paper proposes an indicator, namely, the richness of the object category variety (Cv), which not only reflects the richness of the number of categories but also relates to the proportion of each category in the skyline. However, for the same category, the spatial aggregation and dispersion of all segments produce different visual effects, thus affecting the aesthetics of the skyline. A more dispersed distribution pattern also provides a more complex visual perception. The indicator reflecting this characteristic is named the complexity of the object category spatial distribution of ith category (Ci). The Ci integration results for all categories in the skyline are named the complexity of the object category spatial distribution (Cs).
Definition of general set of richness of object category variety.
Definition of general set of complexity of object category spatial distribution for specific category.
Every general set is necessarily accompanied by a distribution function. The distribution function can reflect the number of individuals (n) corresponding to each flag value (a). Given a general set and a distribution function, complexity is computed as follows (Zhang, 2003)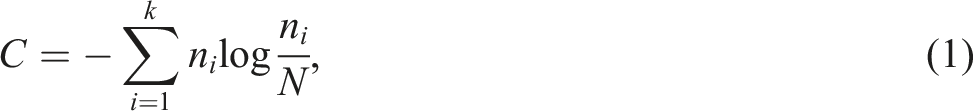
The above is a general formula for computing the complexity. Based on the general sets defined in Tables 1 and 2, the formulas for Cv and Ci are defined as equations (2) and (3), respectively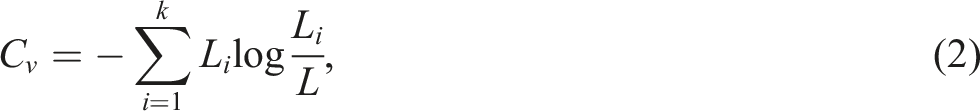
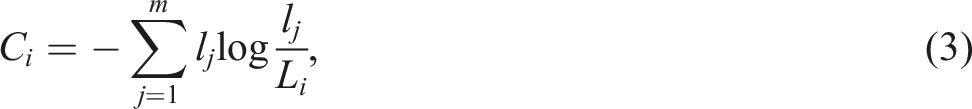
The Ci of each category needs to be integrated to determine the whole complexity of the object category spatial distribution (Cs) because a skyline generally contains several categories. Based on the research experience of Bing Zhou et al. (Zhou et al., 2015), the weights of each category are defined as their length proportion. Cs is calculated as equation (4)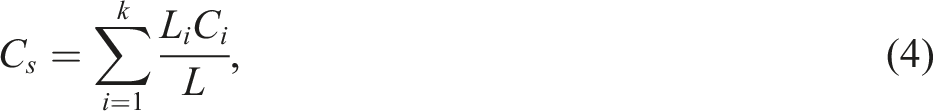
Result
Study areas and data
To evaluate the performance of the proposed method comprehensively, the areas where skylines should include various objects and object combinations are studied. Therefore, Shanghai, Hong Kong, New York and Vancouver are selected as the study areas according their typical and aesthetic characteristics (Figure 5). Shanghai, one of the most developed cities in the world, has a unique urban skyline landscape consisting of various buildings with different styles. The most representative urban landscape in Shanghai is in Lujiazui area, where the Oriental Pearl Tower and other famous buildings are. The Victoria Harbour in Hong Kong is also regarded as a famous urban landscape. The mountains can be observed through the gaps between neighbouring buildings. A characteristic skyline exists in this area that consists of a combination of natural and artificial objects. The Statue of Liberty in New York can be viewed as a representative symbol of sociocultural and human landscape. Thus, the New York skyline has sociocultural attributes. The False Creek in Vancouver is selected as the fourth study area due to its distinct natural landscapes. This area has less buildings than other cities, and two main natural objects, mountain and vegetation, can be observed in its skyline. Study areas: (a) Shanghai Lujiazui, (b) Hong Kong Victoria Harbour area, (c) New York Liberty Island an (d). Vancouver False Creek Coast.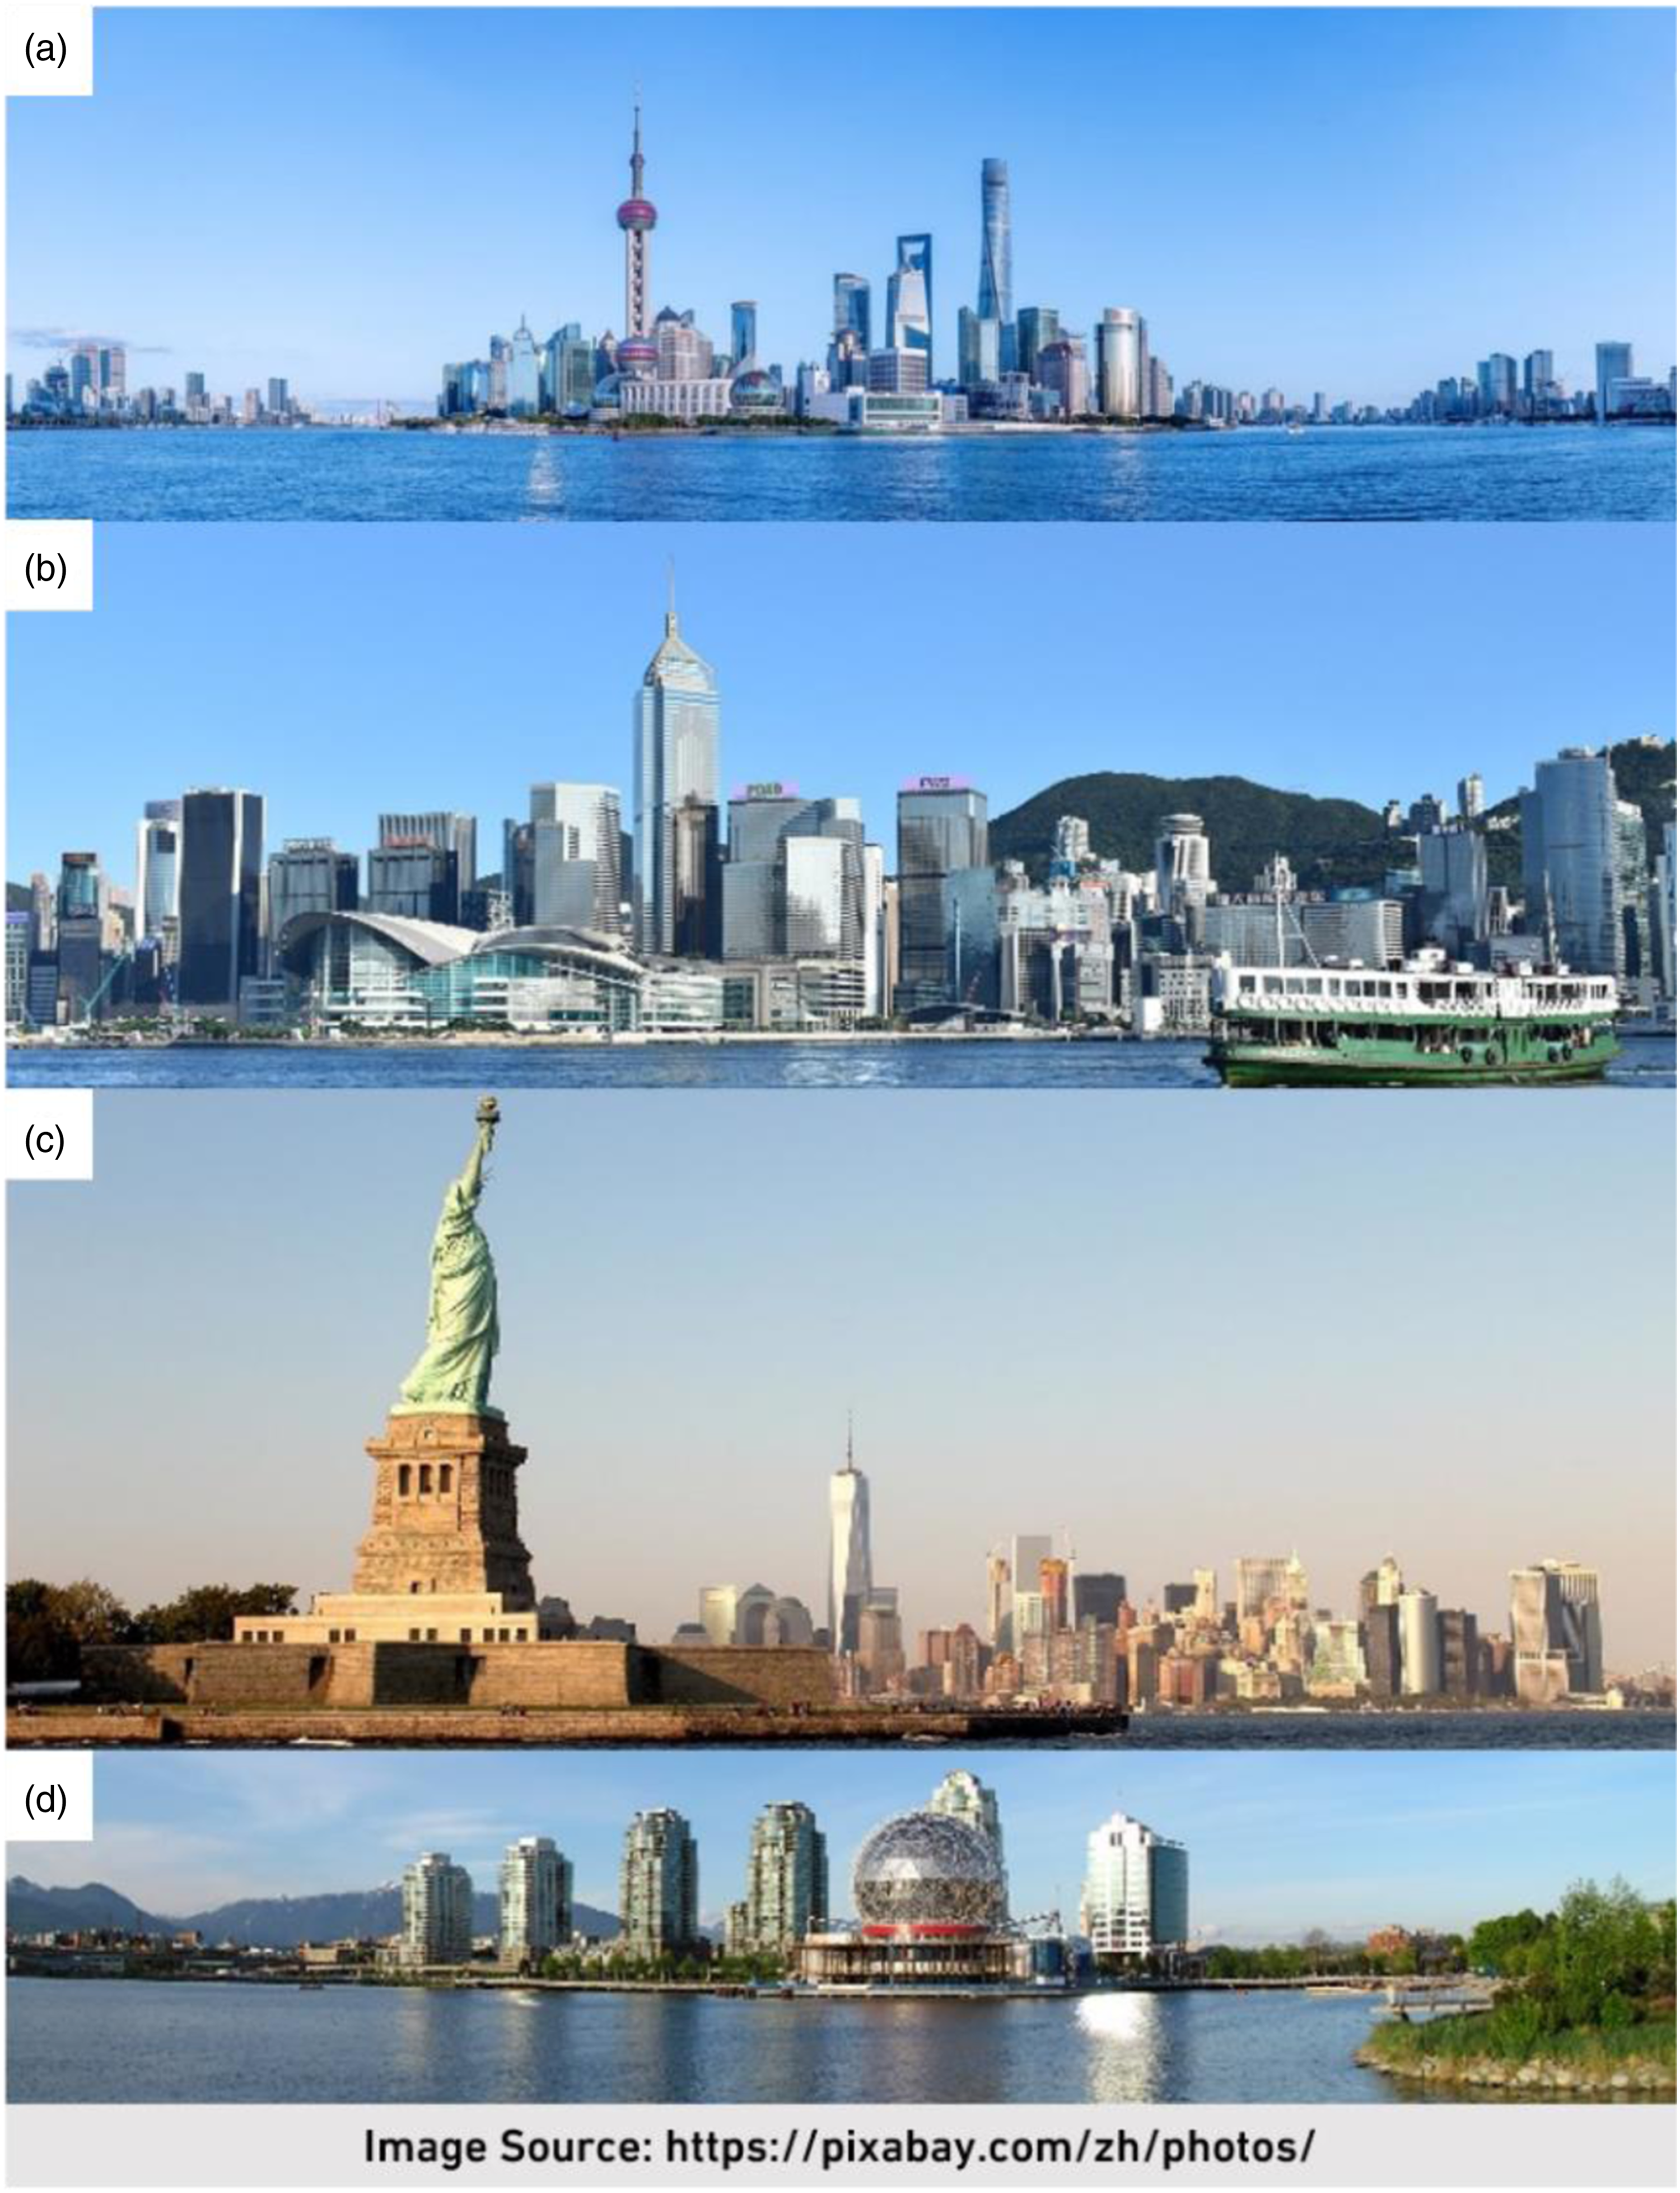
Compositional characteristics of different skylines
Object composition of skylines is one of the most substantial factors that directly influence observers on the evaluation of skyline aesthetic values. Figure 6 shows the results of skyline remodelling of the four cities. All four city skylines have multiple category objects and evident difference of dominant categories. The skylines of Shanghai and New York are dominated by different kinds of buildings, whereas those of Hong Kong and Vancouver contain a larger proportion of mountain and vegetation. In addition, the statue is the most iconic component of New York’s skyline. Extraction and classification results of skylines in different cities.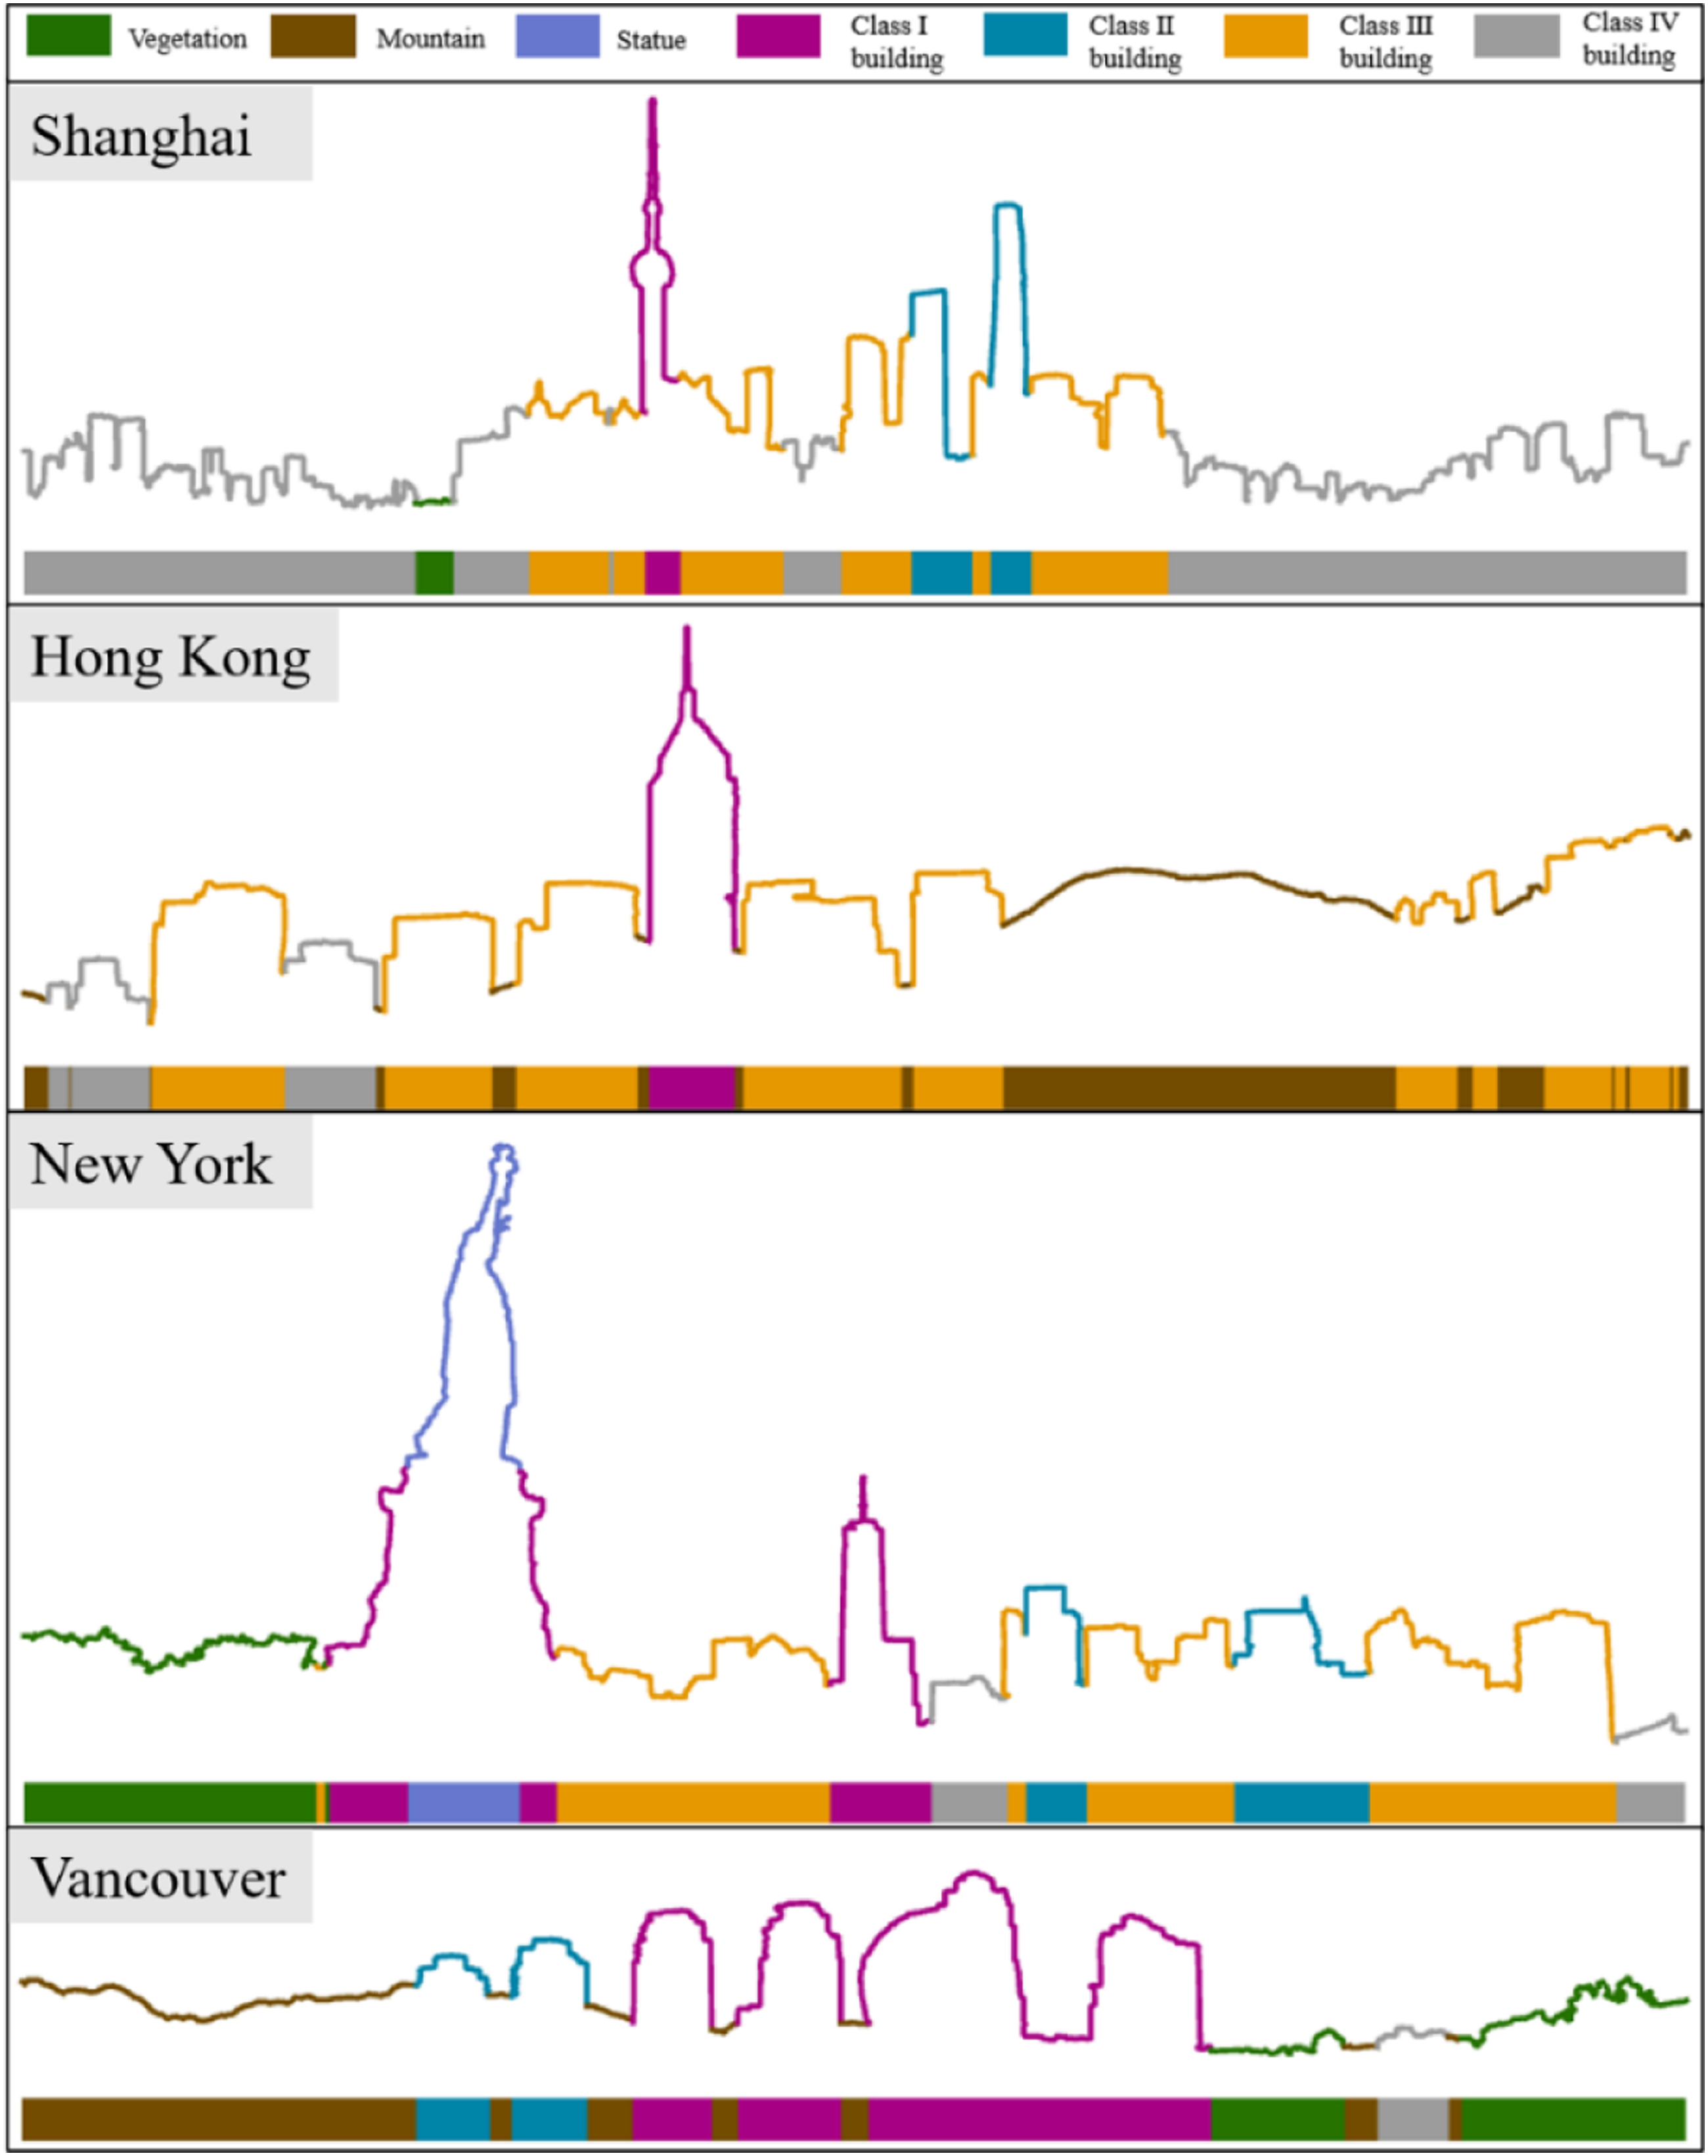
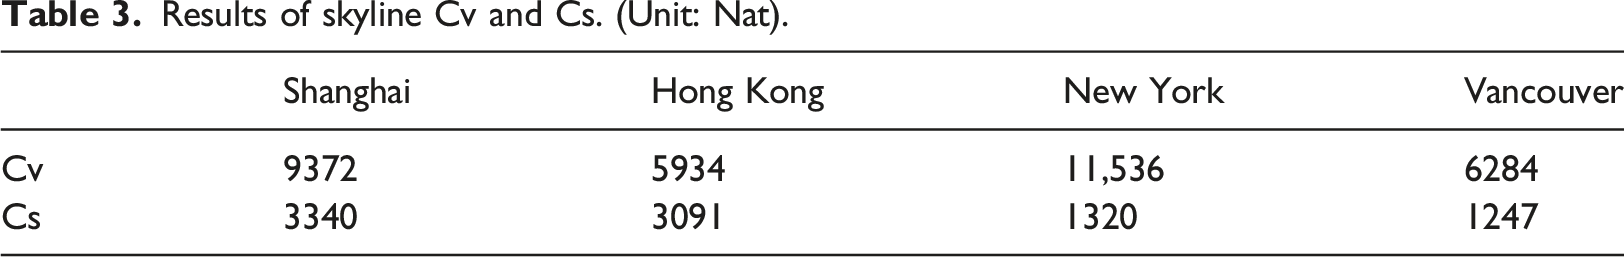
Results of skyline Cv and Cs. (Unit: Nat).
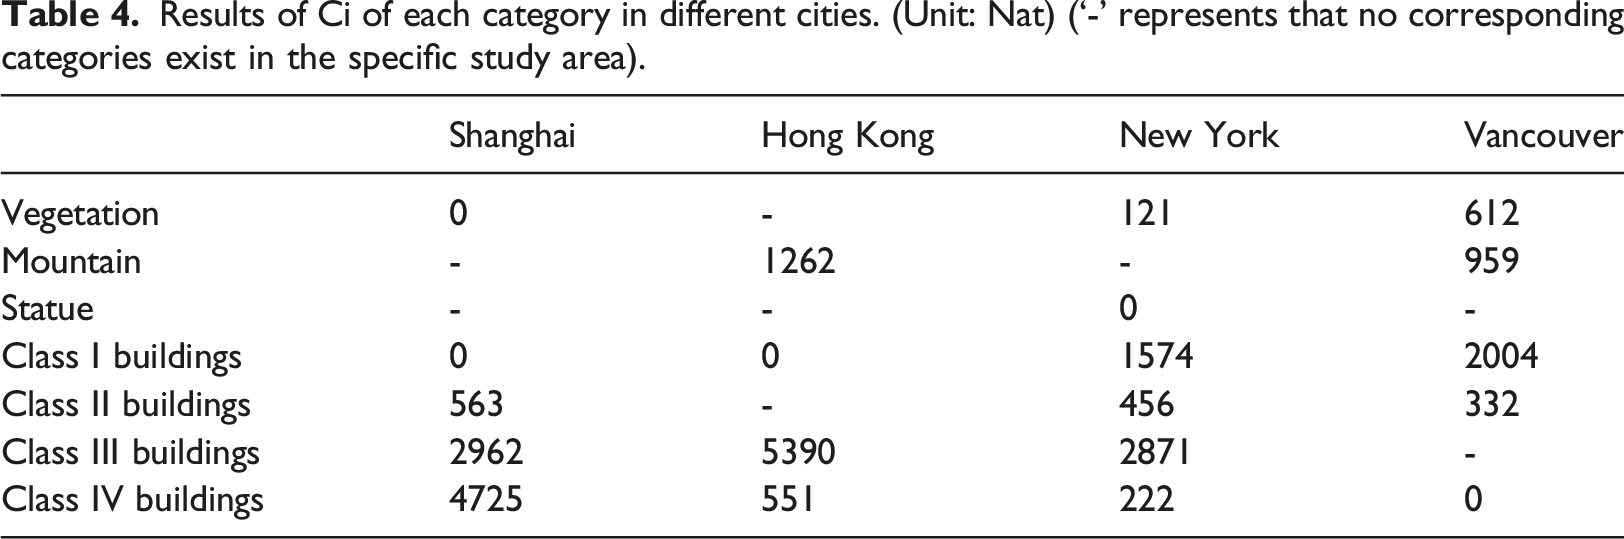
Results of Ci of each category in different cities. (Unit: Nat) (‘-’ represents that no corresponding categories exist in the specific study area).
Discussion and conclusions
Comparison of other evaluation methods
Results of silhouette complexity and fractal dimension.
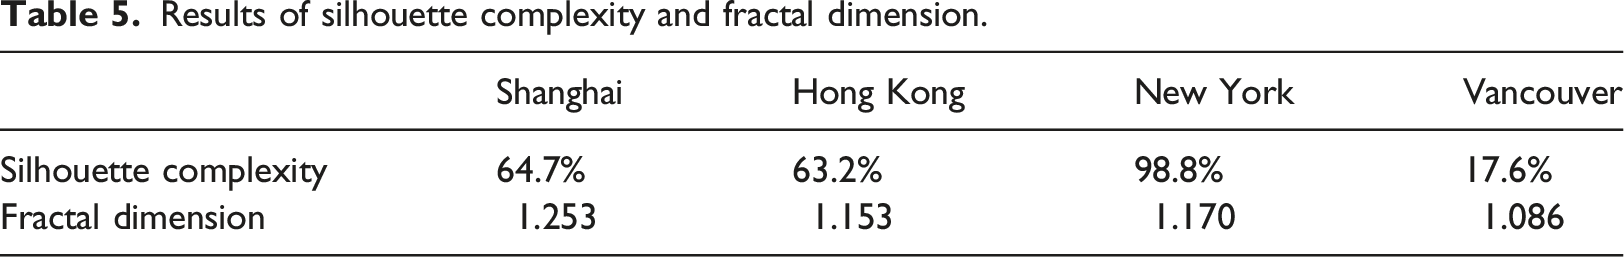
Table 5 shows that New York has the highest silhouette complexity, Shanghai and Hong Kong have similar silhouette complexity, and Vancouver has the lowest silhouette complexity. Figure 5 shows that New York’s skyline has a distinct peak point, Shanghai and Hong Kong have a similar degree of undulation, and Vancouver’s skyline is relatively smooth. Therefore, the results of silhouette complexity can reflect the morphological differences of different urban skylines. However, for silhouette complexity calculation, the results depend on several subjective processes including the determination of smoothing tolerance and the definition of the peak point. Therefore, the result of silhouette complexity is not unique.
For fractal dimension, previous studies indicated that undulating and rich micro level skylines usually obtain relatively high fractal dimension values (Cao and Zhang, 2013). Table 5 shows that Shanghai has the highest fractal dimension, followed by New York, Hong Kong and Vancouver. The results show the differences in the self-similarity of the four city skylines. Fractal dimension is an actively accurate, objective indicator. Fractal dimension represents the microscopic attributes of the skyline, and distinguishing the dissimilarities between different cities is difficult for humans (Lyu et al., 2019).
In this paper, the proposed new indicators, Cv and Cs, evaluate the skyline from the perspective of skyline object composition. When morphological indicators cannot distinguish the differences between cities, new indicators can further evaluate it. For example, the skylines of Shanghai and Hong Kong have different visual effects but similar silhouette complexity values. The results of Cv (Table 3) for Shanghai and Hong Kong are 9372 Nat and 5934 Nat, respectively, which can remarkably reflect the differences between these two cities. The fractal dimension values of Hong Kong and New York are also similar, differing by only 0.017. However, the Cv values for these two cities are 5934 Nat and 11,536 Nat, and the Cs values are 3091 Nat and 1320 Nat. Cv and Cs can further distinguish the differences in the skylines of Hong Kong and New York. The new indicators further improve the skyline evaluation system from the perspective of object composition.
The improvements of the proposed method in this paper are as follows: (1) Combination of natural and human landscapes. The urban skyline is the profile combining the natural landscape, buildings and sky (Yang et al., 2015). The aesthetic combination of natural landscape and modern architecture is one of the directions of urban development. The proposed method considers natural and human objects, which enrich the current evaluation of the skyline. (2) Combination of skyline morphology and its components. Previous studies of the skyline focused on the outlines without considering the different components of the skyline. Skylines with similar outlines may have different visual perceptions and aesthetic properties depending on their varied component objects. The method in this paper is a further development of the traditional morphological evaluation.
Discussion
The new indicators we proposed can reflect the impact of unique objects on skyline complexity and variation. In this study, the statue in New York has a shorter distance to the viewpoint than other objects on New York’s skyline, which brings a strong visual impact to the observers. Ci is able to quantify this type of impact. If an object is closer to the viewpoint, its proportion on the skyline will be larger, the Ci value will be lower. The low value of Ci indicates that class i has a concentrated distribution and would be easy to observe by people. In addition, it should be noted that when there is only one connected region in a certain category, Ci cannot express the visual difference brought by the viewpoint distance. This is because Ci has already reached the minimum value of 0 when there is only one connected region. In this case, it is possible to consider combining Ci with indicators from previous studies. For example, a general rule to follow for evaluating in spatial hierarchy (Jin and Wang, 2021) comes from the depth of field, including the proportion of foreground, middle-ground, and background. Spatial hierarchy indicator considers the effect of viewpoint distance on visual difference. Integrating Ci with spatial hierarchy indicator is a practical way to further analysis skyline.
Conclusion
In this paper, a skyline evaluation method based on the constitution theory is proposed. Firstly, the object-based image analysis method is used to extract the skyline and distinguish the component object category. Secondly, a skyline remodelling algorithm is established to distinguish building classes, which make the composition objects of the skyline more specific. Finally, based on the constitution theory, new indicators, Cv and Cs, are proposed. These two indicators evaluate the skyline in terms of its object composition and spatial distribution. Finally, the comparison with morphological indicators reveals that the new indicators proposed can distinguish the differences when the morphological indicators fail, and address the deficiency of skyline morphological evaluation.
The main innovation is the change of evaluation perspective, from the skyline morphology to the component objects of skyline. This paper considers the visual perception of observers on the skyline composed of different component objects. It enriches the previous quantitative evaluation methods of skyline.
Based on the ideas and methods of this paper, an issue can be further explored. The strategy used to classify buildings is to divide the height interval into four equal parts. This strategy is relatively simple and different from commonly used building classification system. If more parameters can be obtained, such as the distance between the viewpoint and the skyline scene, the observation angle, the real scene can be modelled. The real height of the building can be obtained and the skyline landscape can be quantitatively evaluated from the perspective of the real scene.
Footnotes
Declaration of conflicting interests
The author(s) declared no potential conflicts of interest with respect to the research, authorship, and/or publication of this article.
Funding
The author(s) disclosed receipt of the following financial support for the research, authorship, and/or publication of this article: This work was supported by the National Natural Science Foundation of China (42171402, 41930102); and Priority Academic Program Development of Jiangsu Higher Education Institutions (164320H116).