
Abstract
The land use mosaic that characterises our urban environments is complex and subject to regular and on-going change and transition. Land use change takes place as cities seek to meet ever evolving population, economic, social, and environmental objectives. However, our empirical capacity to map, measure and monitor the geographical shifts in land use at a fine spatial granularity and how these aggregate across the urban environment remain very limited. In this paper, we draw on parcel level land use data for a large metropolitan region in Australia for a 19-year period and employ sequence analysis to delineate the location and timing of shifts in land use. Results reveal both similarities between jurisdictional regions alongside the unique land use transitions that go some way to highlight context specific mechanisms. This study demonstrates the utility of our empirical approach in its capacity to inform regional development strategies through revealing the type, timing and location of land use change in relation to land use policy and planning goals.
Introduction
The urban land use mosaic is complex and experiences regular change and transition. Such shifts in land use have important implications for the social, economic and environmental functioning and sustainability of our cities (Haberl, et al., 2004; Sigler, et al., 2016). With cities around the world seeking to transition into more sustainable places, the need to better map, measure and monitor land use change and transitions have never been greater (Seto, et al., 2005). Despite this growing need, there remain important empirical shortfalls in the way urban land use change is both captured and measured (Rounsevell, et al., 2012).
Scholarship on land use change has charted the impacts on landscape patterns (Nagendra, et al., 2004) and unpacked the role and implication of both natural and human activities. From this body of work, we have developed an understanding of the impact imposed by changes in land use across a number of domains including ecosystem services (Polasky, et al., 2011), watersheds (Butt, et al., 2015), erosion (Borrelli, et al., 2020) and climate (Dale, 1997) to name a select few. Studies have employed a broad mix of empirical approaches, data sources and have examined land use change across a variety of situational contexts and over a range of timelines spanning several years (Yao, et al., 2017; Lu, et al., 2020) to many decades (Braimoh and Onishi, 2007; Zhou, et al., 2020).
From an urban land use change perspective, there exists a large body of research that has focussed on understanding problems that emerge from such shifts including questions concerning urban growth, infrastructure and services delivery, urban planning, migration and economic development. Some of these studies have captured land use change not only in a horizontal plane but also considered the vertical dimension of cities and in doing so have greater demands for high resolution land use data. This body of work has characterised land use change in terms of density (Kang 2010; Bocarejo et al., 2013), type (Braimoh and Onishi, 2007), price (Gibbons and Machin 2005; Malaitham et al., 2020) and policy change (Givord and Sillard, 2013). Yet, what remains less evident from current scholarship, is a focus on developing an understanding of different types of urban land use while concurrently measuring sequences of change rather than a focus on start and end states. Understanding the sequences of land use change will advance our understanding of the tempo and timing of changing land uses that hold important implications for the social, economic and environmental welfare of our cities.
To this end, the current paper aims to establish a new empirical framework with the capacity to map, measure and monitor land use change through examining the way in which individual locales transition through a sequence of land use states over time. More specifically, we employ sequence analysis to 19 annual waves of parcel-level land use in a rapidly changing urban region to delineate common types of transition. Furthermore, we introduce three new measures that when applied to the outputs from the sequence analysis enable us to trace the transition velocity, mix rate and intensification rate of land use change across the 19-year period.
Background
Studies examining land use change have a long and rich history with strong contributions from an ecological perspective over the past three decades (Dadashpoor et al., 2019). Here, remote sensing-based data and techniques have been the mainstay of these contributions given their capacity to offer broad spatial coverage over long time spans (Pflugmacher et al., 2012). Studies have examined changing land use at a variety of spatial and temporal scales and dependent upon the specific processes under examination vary spatially from global (Lambin and Meyfroidt, 2011) to parcel level (Bella and Irwin, 2002) and temporally from a period of months (Pan et al., 2019) to 300 years (Goldewijk, 2001).
Data sources employed in land use change studies principally draw on remotely sensed data (Green et al., 1994; Das and Angadi, 2022). Satellite borne data permit analyses that extend multiple decades and offer spatial and temporal resolutions that allow scholars to examine processes operating across a range of spatial and temporal scales and situational contexts. Despite the advantages of satellite data, its capacity to be processed in a manner to offer a detailed classification of urban land uses (e.g. the capacity to distinguish between different types of dwelling: e.g. units, townhouses and houses) is limited (albeit with some notable exceptions, including, Verburg, et al., 2004).
Nevertheless, this situation is changing. The data revolution of recent decades has led not only to the influx of new data sources (Kourtit et al., 2020) but also has permitted both the private and public sectors to see potential opportunities that existing data, like cadastral data, can offer. To satisfy demand in these data, private companies offer paid products, that include for example, CoreLogic (Seeskin, 2016), AIRDNA (Gunter et al., 2020) and Australian Property Monitor (APM) (Fuerst and Warren-Myers, 2021), each of which are related to the real estate domain. Many local governments also provide online tools to review parcel or property record data located in their jurisdictions to meet commitments to public information. Yet, the level of access in such releases is often limited in spatial and temporal coverage, for instance, the view of one property at a time from only the current year. But if a historical record of parcel data is available for analysis, it can address a range of questions that is not possible to tackle with the aerial sourced data.
In terms of analytic techniques that are used to measure, map, model and simulate land use change there is a broad array of approaches including fractals (Bosch et al., 2020), cellular automata (Yang et al., 2014), Bayesian methods (Almeida et al., 2005), gravity models (Samani et al., 2022), discrete outcome modelling (Zhou and Kockelman, 2008) and deep learning (Zhuang et al., 2022) to highlight a select few. As a continuous measure, land use change is often expressed as the number of land parcels, grids, cells, lots, dwellings and businesses, as a rental price or sale price, land value, area of the newly built housing, housing or commercial areas footprint, population or employment density. This variable is often modelled using linear regression techniques. Such models typically represent a function of individual and shared attributes of a parcel, cell or property. To tackle spatial data dependencies, linear models with a spatial lag or spatial error component have been employed (Anselin and Bera 1998).
Discrete binary and multiple outcome variables of land change can be a change ‘from’ or ‘to’ a specific type, lot subdivision or consolidation and be modelled with a binary logit, multi-nominal logit, mixed logit or microsimulation model (Braimoh and Onishi, 2007). There have been attempts to include a spatial component into discrete outcome models (Beron and Vijverberg, 2004) which continues to present ongoing methodological and computational challenges (Billé and Arbia, 2013). Unlike probabilistic models, CA-based techniques are founded on a set of deterministic rules (Clarke and Gaydos, 1998; Truong et al., 2022) and employ remotely sensed data and draw on a range of data from various disparate sources, converting each into raster layers.
Further, to understand and represent key characteristics and dynamics of land use change, there has been widespread use of spatial metrics. Spatial metrics, emerging from ecological and environmental studies derived from remotely sensed data estimate parameters based on land patches like patch size, shape, density (Herold et al., 2005), mean patch (Kong et al., 2012) and patch level (Verstegen and Goch, 2022).
Another group of metrics often used in urban research typically represent properties of neighbourhoods or zones in urban structure like density, accessibility and centrality (Lowry and Lowry, 2014). For instance, the measure of land use mix is more commonly used in transportation, public health or urban economics (Song et al., 2013) when evaluating a diversity of zoning overlays in urban agglomeration.
In sum, the scholarship on land use change is rich but to date has largely been focused on ecological applications and land use data borne from remote sensing sources. The current paper moves beyond current scholarship in three main ways. First, in the use of 19 years of land use data borne from a spatial cadastre, that allows a more detailed understanding of urban land uses (such as the capacity to distinguish between houses, townhouses, unit blocks) and extends beyond that which can be captured using remote sensing data and associated techniques. Second, is the first-time use of sequence analysis to urban land use change enabling us to cluster complex sequences of individual land parcels into a set of broad types that a deemed to follow similar transition trajectories. Third, in the development of three metrics that when applied to the outputs from the sequence analysis offer measures of the transition velocity, mix rate and intensification rate of land use change across the study period.
Analytical approach
To establish a new empirical framework with the capacity to map, measure and monitor land use change through a sequence of land use states over time, we draw on a specific case study context, namely South-East Queensland (SEQ), Australia. The analytical approach we deploy comprises four key analytic steps (Figure 1): (Step 1) Processing cadastral data; (Step 2) Sequence analysis; (Step 3) Assignment of transition metrics to each sequence cluster type; and (Step 4) Matching sequence cluster types between administrative jurisdictions. Four step analytical strategy.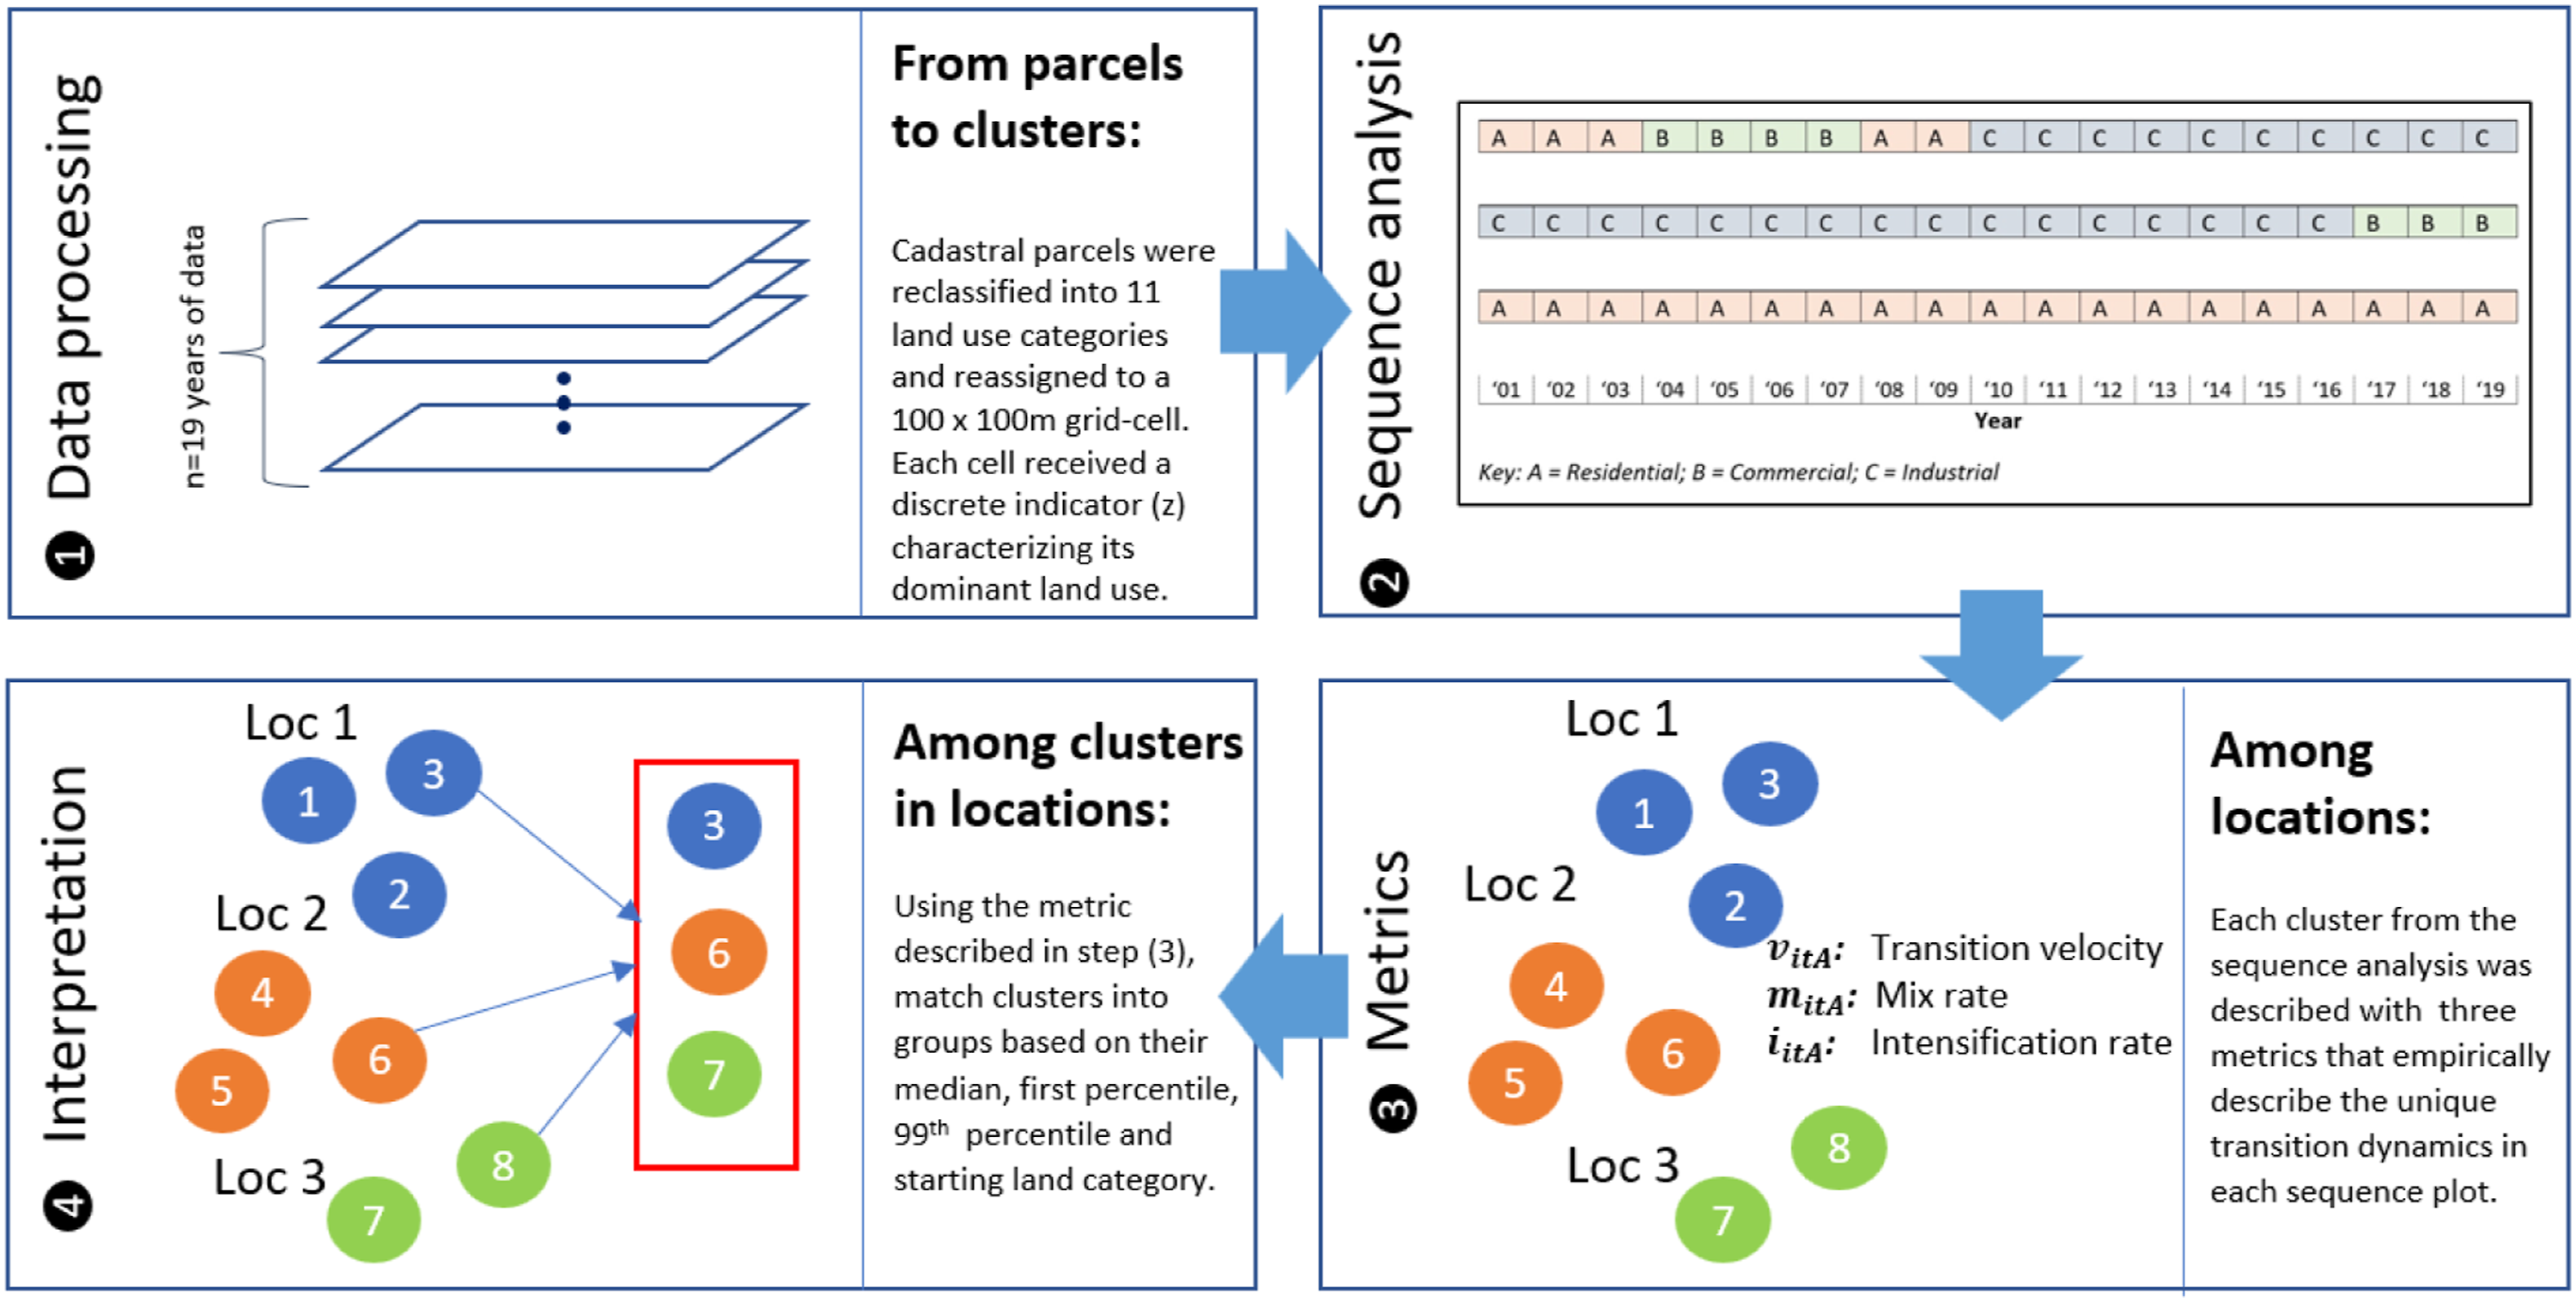
Our empirical approach is applied individually to each of the nine 1 Local Government Areas (LGAs) that together comprise the SEQ region (Figure S1 in the supplementary material). The LGAs are independently responsible for land use planning and policy development and aligned with various targets outlined in the SEQ regional plan. As such computing sequences for each LGA and comparing their similarities and differences is important in its capacity to reveal interesting insights into patterns of land use transformation and change.
Case study and data
SEQ is a rapidly growing region in the State of Queensland, Australia with an estimated resident population of 3.6 million people as of 2020 (QGSO, 2020). In the last two decades, the region has experienced large-scale rural to urban transition together with the intensification of development in existing urban centres. The regional master plan ‘Shaping SEQ 2017’ defines a vision for SEQ growth over 25 years (DILGP, 2017) within which there is an assertion of sustainably and liveability in regional development practices.
To accommodate future population growth, the regional plan sets a target of 60% of all new dwelling stock to be located within already established urban areas. The plan suggests diverse housing options including low, medium and high-density development. This policy marks a change from a typical suburban model of development prevailing in Australia decades before. In terms of land use, this means focusing on brown filed, infill types of development and redevelopment of existing land use to a higher density. The winning bid of Brisbane City, the capital of SEQ, to host the 2032 Olympic Games will add to the challenge of accommodating additional growth within the region.
Summary of cadastral data.
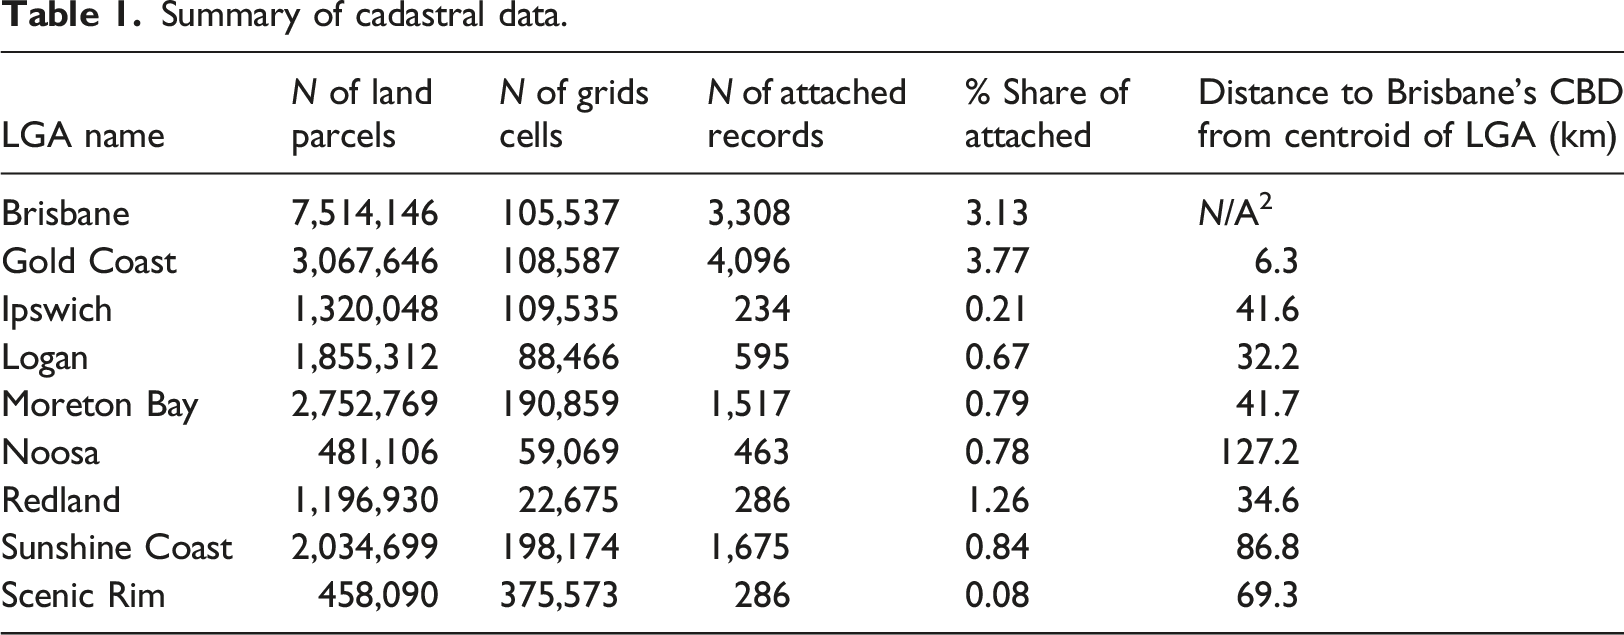
The parcel data were translated to a regular cellular grid with each cell measuring 100 × 100 m. The grid cell format was necessary for the construction of a panel land use dataset. The panel dataset ensured consistency among spatial units between 19 years of annual land data. Also, given that parcel boundaries are subject to frequent changes, like subdivision and aggregation, retaining the original parcel shape was unfeasible.
Each cell in the land use panel dataset received a discrete indicator z indicating the land use category based on the largest share within the area of a given grid cell. This was achieved using a spatial intersection between the cell and the parcel layer. The area of land use category z included in each cell i is estimated as a spatial intersection of land category z within cell boundaries:
To demonstrate the utility of the proposed analytic approach, we focus on a transition of land use to a single category, namely, the attached. Therefore, we put a constraint on the end state of each transition cell considering only the ‘attached’ records while leaving the initial state of the cell unconstrained. We are interested in a variation of this change across LGAs in the SEQ.
Sequence analysis
Change in land use across our case study context is examined using sequence analysis. Sequence analysis is a methodology that has seen broadening application in the social sciences for the exploration of sequences of events and phenomena (Abbott, 1995; MacIndoe and Abbott 2004). The technique permits patterns within sequences to be examined via two principal analytic steps. First, through using an optimal matching approach to compute pairwise distances between sequences to capture their similarity to one another. Next, by clustering the set of pairwise distances to delineate a set of meaningful groups, that can then be plotted in the form of a sequence plots. These sequence plots depict all sequences that fall within a given type and are a useful visual analytic to explore characteristics and dynamics of change within and across the groups of sequences.
Here, we conduct sequence analysis using the TraMineR package in R (Gabadinho, et al., 2011). An individual sequence is for a single grid cell and includes 19 states representing its land use for each year. Figure 1 gives a hypothetical set of three land use sequences each of which contain three different land use states (residential, commercial and industrial) across 19 states (or years).
We use the method ‘TRATE’ (transition rates) to compute the substitution-cost matrix and return an array with a distinct matrix for each time unit (year) on which we employ OM (Optimal Matching) to calculate the pairwise dissimilarities between sequences. 3 Next, using Ward hierarchical clustering on these distances individual sequences are clustered into a set of meaningful types.
To evaluate what the most appropriate number of types is for a given set of sequences, we compute a range of clusters and visually interpret the outputs. Here, we seek to visually decern meaningful differences between types, such that by adding an addition type to a given set of sequences no longer derives a new type that is distinguishable from others within the set. At this point, we consider the number of types to be appropriate.
Transition dynamics
To extend the utility of sequence plots, we introduce three additional metrics that empirically describe the unique transition dynamics captured in each sequence plot. Three measurements that capture the transition dynamics are as follows: transition velocity, mix rate and intensification rate. In particular, we calculate the number of land types in each year for a particular cluster pattern,
Transition velocity,
Mix rate,
Intensification rate, measures the percentage of grids that belong to the attached-dwelling type in each year for a particular cluster pattern:
These three measurements for each year in each clustering type for each area can be aggregated at the clustering level, or at the area level. The flexibility of aggregation at different observational levels allows the comparison of land use transition across years, across cluster types and across areas. It provides a great supplement to the graph plots from sequence analysis.
Matching among clusters
To identify groups among the clustering types and enable sequence analysis outputs from each of the nine different regions to be comparable, we perform an exact matching exercise. We use the metrics developed above for each type and find the median, 1 percentile, 99 percentile for the three measurements across 19 years. We merge all the values across different types and regions and divide the three measurements into tertiles. In addition, we identify the dominant land use type in the year 2000. The matching process is as follows: we match types by types across all the regions with the same measurement decile and the same dominant land type. We identify those matched types as groups that follow similar land use transitions.
Results
Sequence method
Results from the sequence analysis (second step of the analytical strategy, Figure 1) illustrate a transition from the various urban and rural land uses to the attached land category. With that, we simultaneously unveil the spatial and temporal evolution of changes in land use across the SEQ region.
This stage of analysis identifies types of land use changes with a genomic sequence method based on a similarity in grid cell transitions. Figure 2 illustrates the look of a standard output from the sequence analysis with an example of Sunshine Coast LGA (results for all LGAs are listed in Figures S2.1–S2.9 of the supplementary materials). Initially, the dataset for Sunshine Coast consisted of 11 land use categories and 198,174 grid cells across 19 years of cadastral data. These data were reduced to 1,675 grid cells that have ‘attached’ as the end state (in 2019). Sequence analysis resulted in the delineation of 6 cluster types for this LGA (Figure 2). Each cluster type contains information on transition patterns, the number of grid cell records and land use categories. One line on a sequence plot (Figure 2) corresponds to the history of a single grid cell transition measured yearly over 19 years. Cluster types for the Sunshine Coast LGA [transition to the attached dwelling category].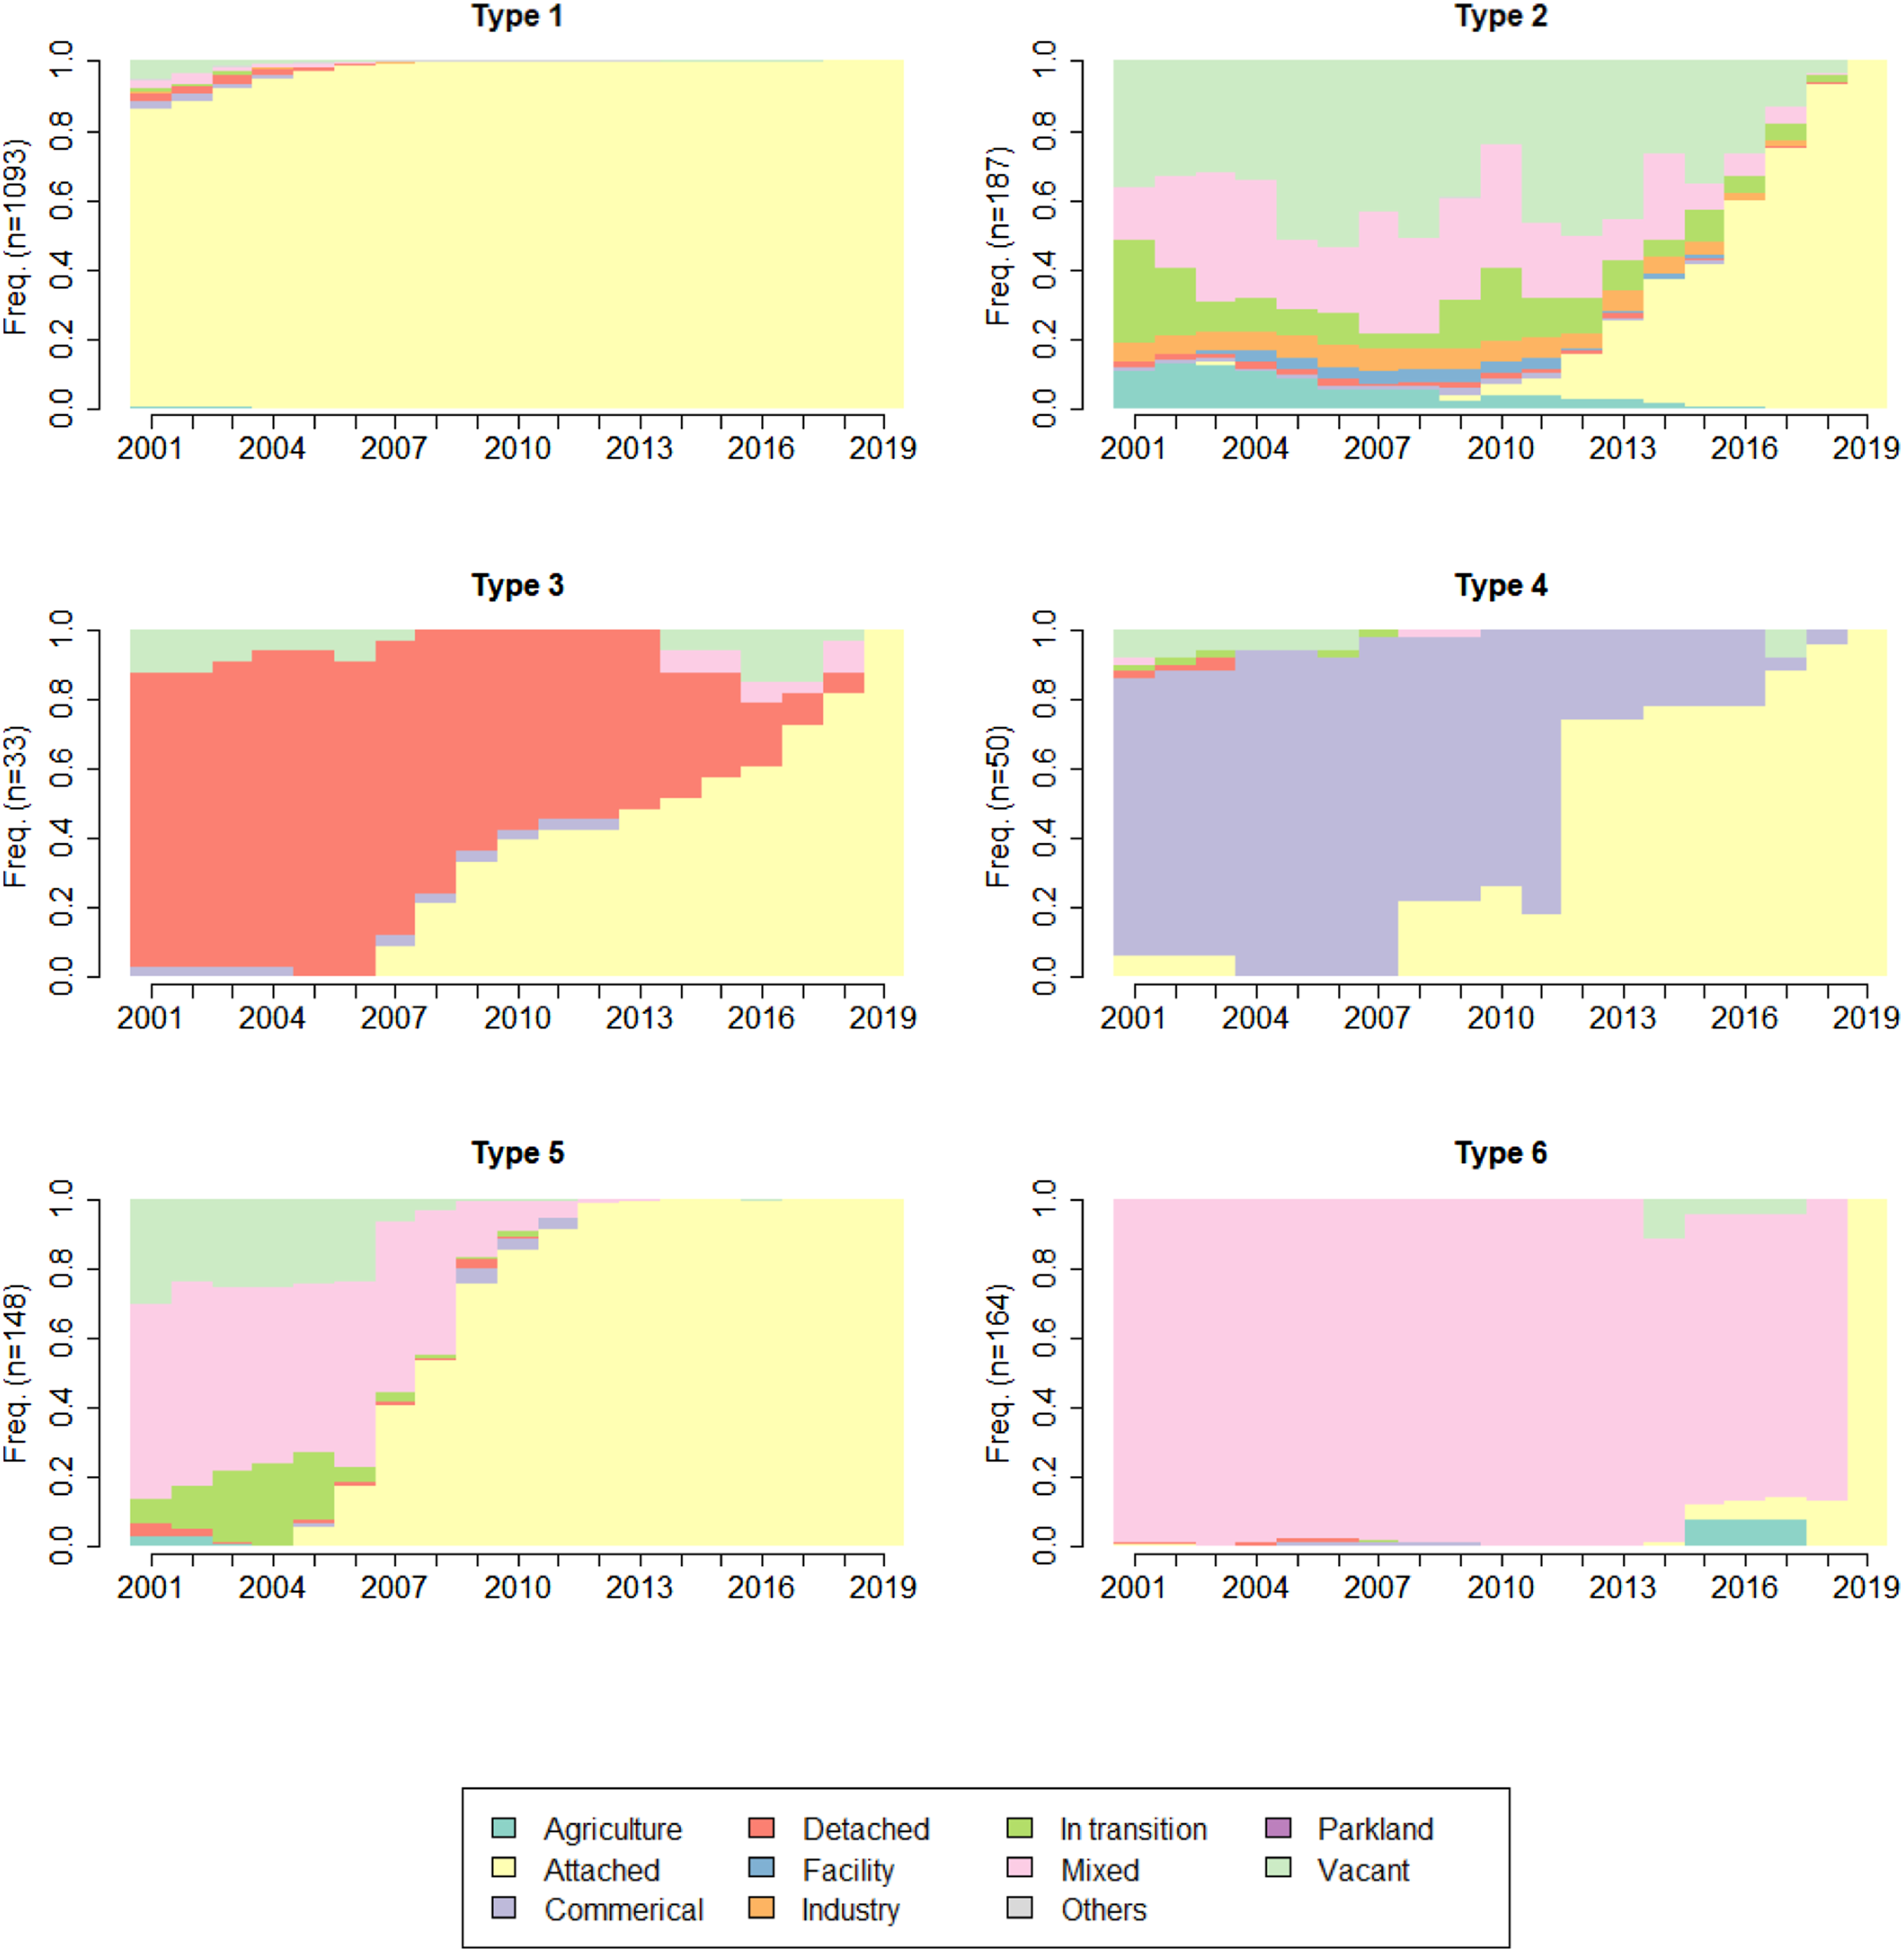
Our results allow a comprehensive analysis of land use conversion to the attached dwelling category. The first cluster type (Type 1) indicates no change in attached dwellings across the 19 years of land use data. This means that cells in this category belonged to the attached category at the beginning of the timeline (namely in the year 2000). The second type (Type 2) is comprised of cells that changed from the mixed land use category, the land type that is generally characterised by locales where housing is combined with retail activity. Type 2 also shows a large proportion of vacant parcels that were converted to attached housing. The timeline assigns this trend to the second half of the timeline, around 2012. The third type (Type 3) captures locations that experienced a conversion of detached to attached dwellings. This type of transition signifies a particular case of land use intensification when the former dwelling (of lower density) has been removed in favour of higher density dwelling structures. Similarly, in Type 4, commercial land transitioned to the attached dwelling category. The fifth type (Type 5) also shows the transition commencing early in the time sequence, around the year 2000, which aligns with that of Type 3. The latest wave of mixed land conversion to attached falls within cluster type six (Type 6).
In terms of development intensity, type (Type 3) is similar that that of type (Type 4) where established land uses changed to the attached dwelling category. Both types, (Types 3 and 4), appear to exhibit similar intensities of redevelopment patterns.
Comparing results across each of the nine LGAs allowed us to delineate interesting differences in transition patterns of grid cells. For instance, Figure 3 shows a single cluster type (Type 3) extracted from the Brisbane LGA revealing a distinct type of conversion from industrial to attached dwellings. This type of transition (brownfield redevelopment) was unique to the Brisbane LGA (pertaining to 72 cells or 2.2% of all cells experiencing a transition to attached by 2019) and was temporally bound, commencing around 2003 and continuing until 2018. Conversion from industrial to attached dwellings (Brisbane LGA).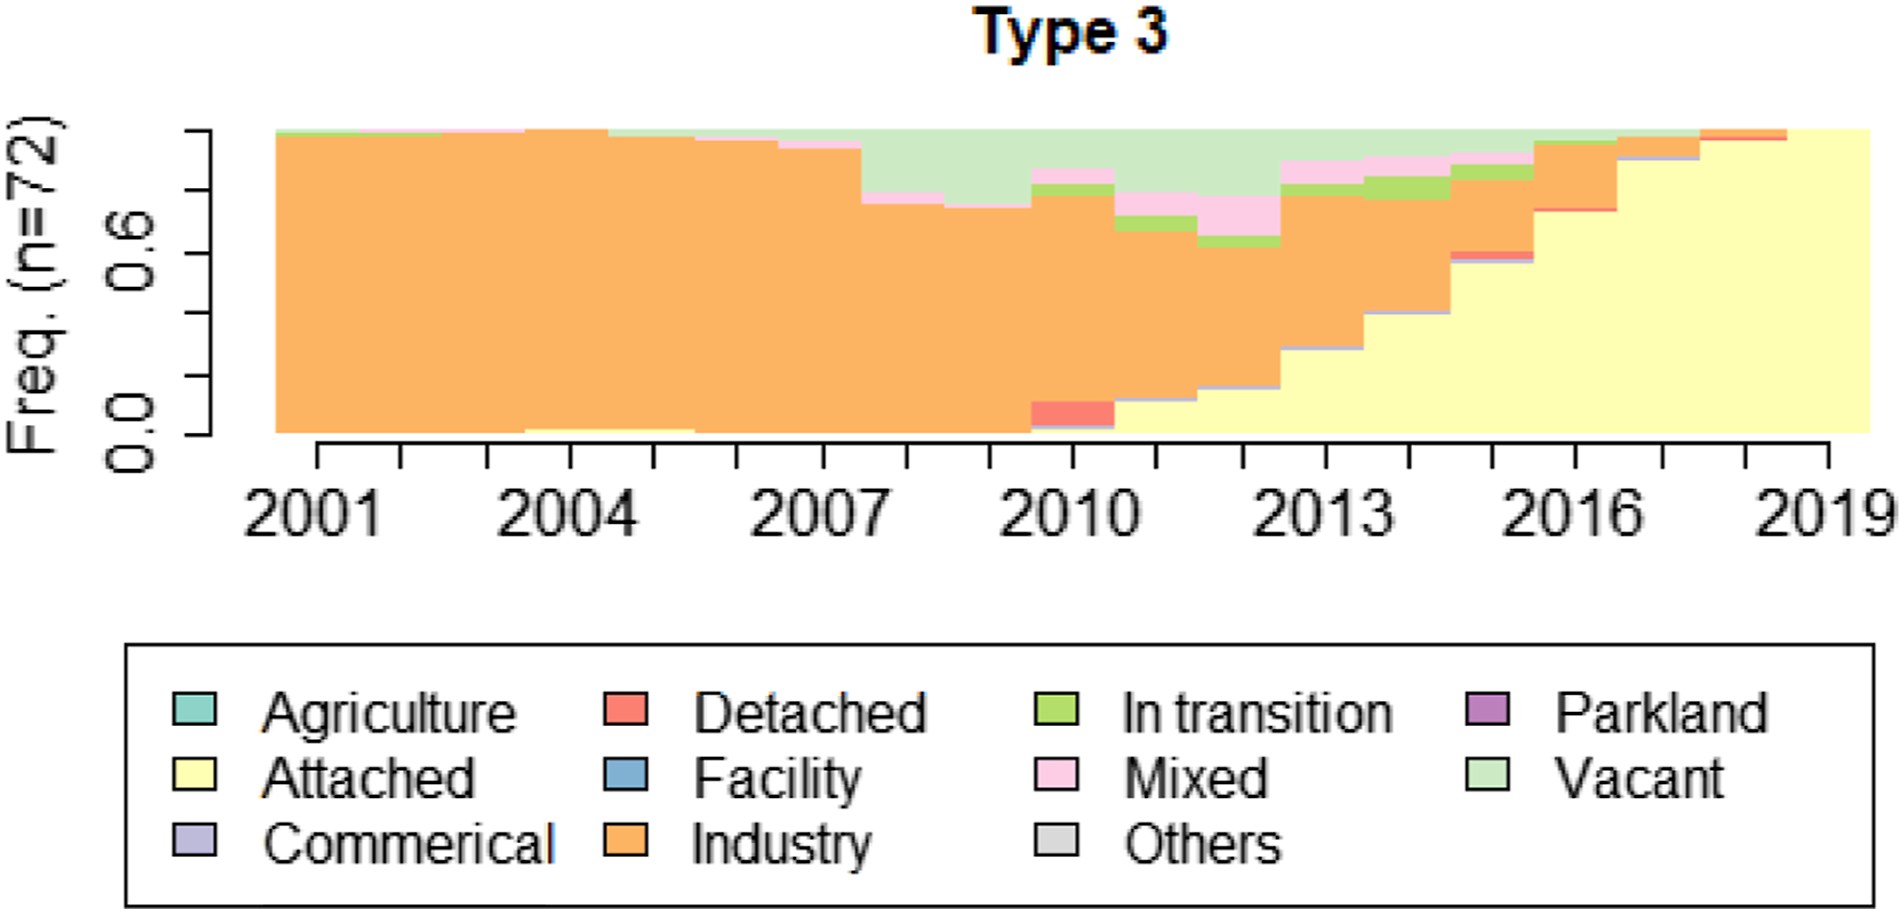
Transition dynamics
Transition metrics for the sunshine coast LGA (Cluster Type 2).
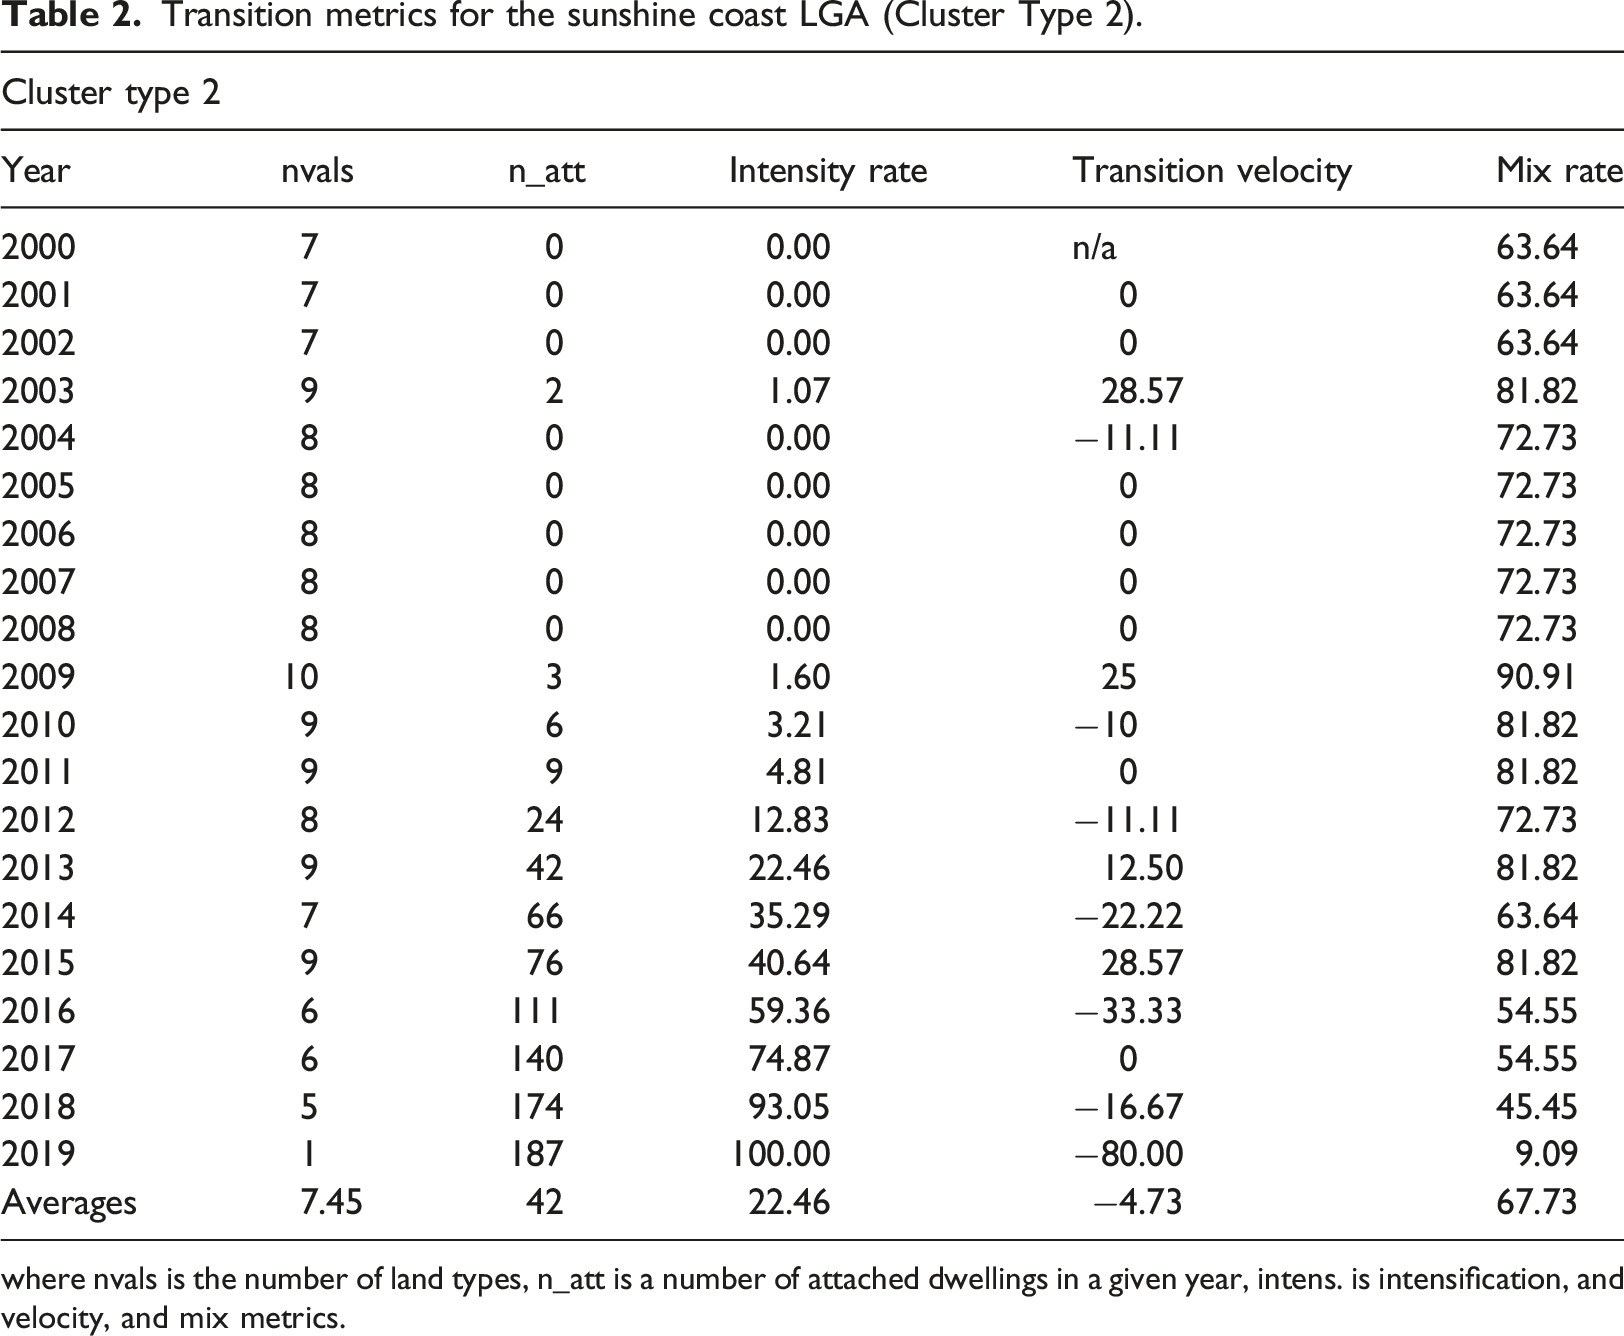
where nvals is the number of land types, n_att is a number of attached dwellings in a given year, intens. is intensification, and velocity, and mix metrics.
Matching results
Our empirical approach allows not only for the description of trends across each of the nine areas but also the identification of similarities of changes that exist between each jurisdiction. After processing land data from all study areas (Step 1), we arrive at multiple cluster types that represent grid cells transition in each LGA (Step 2). To quantitatively assess the transition characteristics of each cluster type in each LGA, we estimated our three metrics of (‘transition velocity’, ‘mix rate’ and ‘intensification rate’) (Step 3). In the next stage, these data were further reduced with an application of a matching algorithm (Step 4). Based on the inputs from the three metrics, the matching algorithm produced the matched groups of cluster types across all LGAs considered in the analysis.
A cluster group is a nominal category that signifies a combination of mutual pairs into a larger group. Figure 4 illustrates one such group where types from the Gold Coast, Sunshine Coast, Moreton Bay and Brisbane LGAs have been allocated to one group based on similarity in their metrics. In this example, the group of four LGAs delineate the transition of detached housing to the attached dwelling category. Figure 4 also depicts the map of the SEQ region revealing the location where these specific changes took place. Every other group resulting from this step of the analysis can be similarly displayed to that given in Figure 4. An example of the cluster group output based on matched cluster types.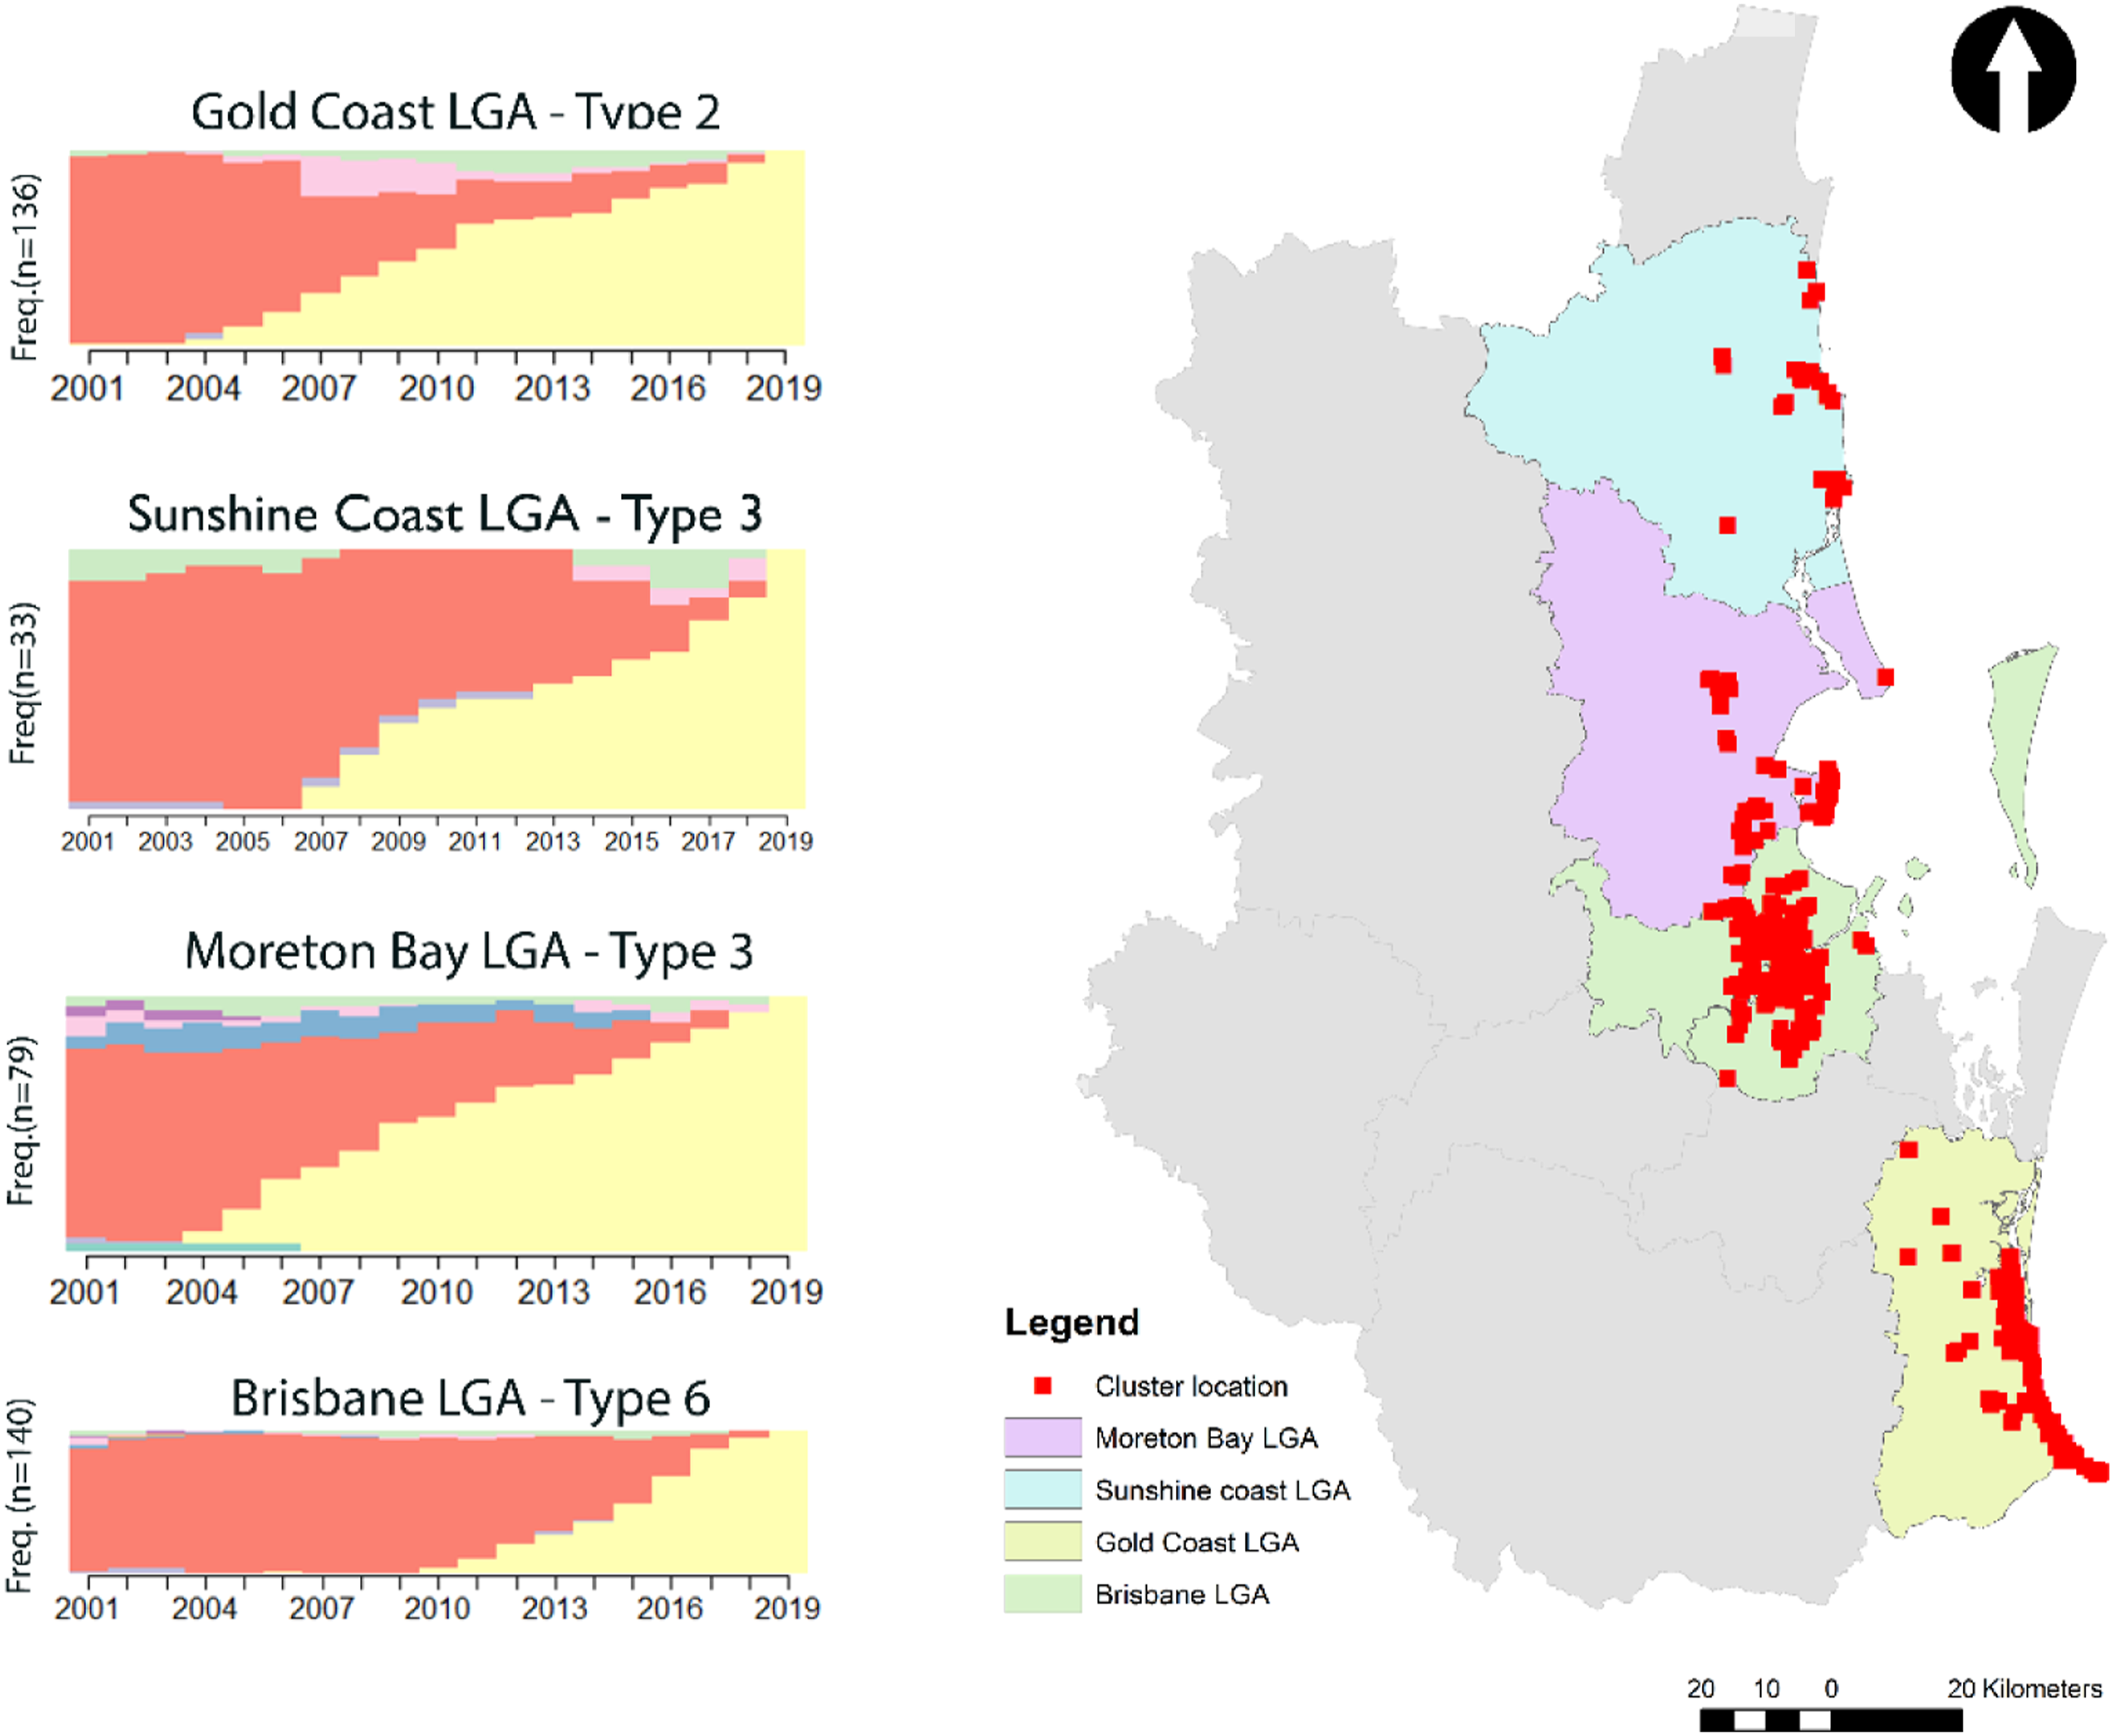
Discussion
The aim of the paper was to establish a new empirical framework to map, measure and monitor land use change. To this end, we delineated common types of land use transitions by examining annual waves of parcel-level data using sequence analysis. This paper contributes to the pool of analytical approaches examining land use changes with an application of a genomic sequence technique to the analysis of land parcel data.
Furthermore, the current study enables new questions related to regional land use changes to be investigated, such as the capacity to empirically detect and compare locales experiencing major redevelopment and transitions in land use. The sequence analysis approach facilitates exploration and assessment of the effectiveness of government planning policies and offers a new empirical assessment that can be helpful in understanding how observed land use transitions align against stipulated planning goals and targets.
Take for example, that we detected six clusters in the Sunshine Coast LGA through which we described the six meaningful land use transition patterns to the attached dwelling category (across the 19 year observation period: 2000–2019). Visualising the cluster outputs in the form of state distribution plots (as in Figure 2) offers a powerful method to illustrate the distinctions between land patterns from the starting state (in 2000) to that of the final state (in 2019). Through this visual depiction, we can visually examine the key land use types that were the main donors of change to the attached dwellings type. The visual also provides important insights into the pattern of temporal propagation of change across 19-year observation period. To this end, we can identify those locales that exhibit the strongest intensification patterns of redevelopment wherein the former dwellings of lower density or commercial structures are removed and replaced by attached dwellings. Further, through grouping our cluster results from all LGAs, based on the values derived from the three metrics (‘transition velocity’, ‘mix rate’ and ‘intensification rate’), we detected similar transition patterns (from the detached to attached dwellings) not only in the Sunshine Coast LGA but in the Gold Coast, Moreton Bay and Brisbane’s LGAs.
Our findings offer a new and important mechanism and evidence base through which observed redevelopment activity can be mapped, measured, monitored and interpreted in accordance with goals outlined in the SEQ regional plan. This is especially important given the SEQ region is one of the fastest-growing regions in Australia. Its typical suburban model of growth used to rely on a greenfield development that requires the provision of new infrastructure that is costly to build and maintain. The ‘Shaping SEQ 2017’ strategic plan (Department of Infrastructure, 2017) prioritises intensified development of already existing agglomerations. A land supply is controlled by local and state governments with zoning regulations that allow or prohibit development or redevelopment. On the one hand, the demand for land is driven by population pressures. Investors and developers act as agents producing the new housing stock to meet the demand. Given that land is a finite commodity, investors compete to maximise their profits and introduce additional floor space to increase returns from the finite land supply. What we have observed is that supply in certain highly sought-after regions appears to have been largely exhausted around the year 2005 marking the beginning of a process of large-scale change to the attached dwelling type across all LGAs within the SEQ region.
Our new method is likely to benefit two broad types of audiences. First, are urban scholars. The developed method produces discrete patterns of transition characterised by three metrics types. The variety of output measures enables a study of complex relationships between land use transition characteristics and regional factors. The second group are urban and regional planners and practitioners. While the local councils report on the critical indicators related to land development, the regional authorities monitor trends at the regional, state or national levels. With our new method, planners have the potential to routinely delineate hot spots of activities and track similarities and differences in regional dynamics as it relates to land use change. More specifically, the method represents a tool capable of tracking and reflecting on the performance of strategic policies.
The current study has several limitations. Firstly, we used land parcel area as a proxy for floor space wherein a more sophisticated weighting could be investigated (given data availability) with data describing actual floorspace. Secondly, the attached dwelling category included structures of various densities as townhouses, apartment blocks or building units. It is possible to disaggregate this category to more specific sub-types of attached land uses, but one needs to be mindful of sufficient sample size when performing sequence analysis. Such a classification is less likely to be applied to a regional study (such as the current study) but this more detailed classification would benefit analyses at finer spatial granularity.
Two useful extensions of the current study would be to first explore the relationship between policy interventions and the response from the land use system. The second would be to build an additional modelling capacity for forecasting future land changes from disaggregate land use data.
Conclusion
In sum, the urban land use mosaic is complex and is punctuated by consistent change and transition. Measuring, mapping and monitoring the patterns and dynamics of such shifts in land use are important given their implications for the social, economic and environmental welfare of our cities. This study goes some way to demonstrate the utility of our empirical approach in its capacity to inform local development strategies by revealing the type, timing and location of land use change in relation to regional land use policy and planning goals.
The current paper contributes to current scholarship in three principal ways. The first is through employing sequence analysis and in doing so address a general shortage of techniques that have the capacity to capture changes in land use across both spatial and temporal dimensions. The second contribution is in a deployment of the 19 years of administrative high-resolution parcel data. With that, we can decipher urban land change transitions that previously were hard to scope because of the aggregated nature of data sources. The third is the development of three new metrics that trace the transition velocity, mix and intensification rate of land use change within each of the identified transition types. These measures offer new insights into the dynamics of land use change within each cluster type.
Supplemental Material
Supplemental Material - Urban land use transitions: Examining change over 19 years using sequence analysis. The case of South-East Queensland, Australia
Supplemental Material for Urban land use transitions: Examining change over 19 years using sequence analysis. The case of South-East Queensland, Australia by Svitlana Pyrohova, Jiafei Hu and Jonathan Corcoran in Environment and Planning B: Urban Analytics and City Science.
Footnotes
Declaration of conflicting interests
The author(s) declared no potential conflicts of interest with respect to the research, authorship, and/or publication of this article.
Funding
The author(s) disclosed receipt of the following financial support for the research, authorship, and/or publication of this article: This research is funded by iMOVE CRC and supported by the Cooperative Research Centres program, an Australian Government initiative.
Supplemental Material
Supplemental material for this article is available online.
Notes
References
Supplementary Material
Please find the following supplemental material available below.
For Open Access articles published under a Creative Commons License, all supplemental material carries the same license as the article it is associated with.
For non-Open Access articles published, all supplemental material carries a non-exclusive license, and permission requests for re-use of supplemental material or any part of supplemental material shall be sent directly to the copyright owner as specified in the copyright notice associated with the article.