
Abstract
Housing retrofits are essential for meeting societal decarbonization goals, alongside addressing energy insecurity, improving public health, and creating new jobs. Yet, despite their multiple benefits and comprehensive government efforts to incentivize retrofits, adoption rates across the world remain low, usually less than 1% per year. Barriers to adoption among homeowners include lack of knowledge of what combination of energy retrofitting upgrades are most cost effective for their situation given available incentive programs. Similarly, cities lack urban-level analysis tools to optimize uptake of and predict carbon emissions reduction from existing incentive programs. To address the latter gap, we present a census-based Urban Building Energy Modeling framework that combines a technical energy saving potential analysis with a socioeconomic model that includes occupant demographics, local building regulations, and incentive eligibility criteria. We use the framework to evaluate the effectiveness of retrofit programs in two Boston neighborhoods with median incomes of $110,00 and $42,000. Results reveal that for the higher income, neighborhood predicted and actual adoption rates between 2014 and 2017 are comparable. In the lower income neighborhood, the proportion of households that would financially benefit from incentive offerings is higher. However, current participation rates do not reflect this difference suggesting that many viable projects do not happen for reasons that are not yet captured by the model. Urban planners, energy policy designers, and community advocates seeking to plan and evaluate energy incentive programs can use this framework to understand the breakdown of opportunities and barriers for different socio-demographic groups and geographic locations.
Introduction
In the United States, residential buildings account for 21 and 19% of energy consumption and carbon emissions, respectively (U.S. EIA, 2022). Experts agree that these emissions could be reduced by over 80% through widespread adoption of housing retrofits along with grid decarbonization efforts (Steven Nadel and Lowell Ungar, 2019; Goldstein et al., 2020; Larson et al., 2020; Reinhart et al., 2021; Williams et al., 2021; Berrill et al., 2022). Housing retrofits offer a variety of additional benefits from new well-paying jobs (Reinhart et al., 2021; Wei et al., 2010) to enhanced energy affordability (Hernández and Bird, 2010; Brown et al., 2020) and occupant health (Wilkinson et al., 2009; Ryan and Campbell, 2012; Gillingham et al., 2021). Given the universal appeal of building upgrades, the U.S. government has been supporting a string of energy efficiency incentive programs for over half a century. In 1976, the Department of Energy first started supporting low-income households via its Weatherization Assistance Program (WAP). Two years later, Congress first passed legislation requiring states to initiate energy efficiency standards for new buildings. Energy efficiency standards for electric appliances (Energy Star program) were introduced during the 1990s. Following the 2008 financial crisis, the 2009 American Recovery and Reinvestment Act (ARRA) significantly increased WAP’s funding and opened up energy efficiency incentives for all income levels (Allcott and Greenstone, 2012). In addition, new agreements between states and utility companies led to further incentive programs that are run by the utilities in their service territories. As a result, since 2013, most U.S. households have access to a (sometimes confusing) variety of subsidized services from technical assistance to financial incentives to implement energy efficiency measures in their homes (Seth et al., 2013). The 2021 Infrastructure Investment and Jobs Act and 2022 Inflation Reduction Act have only further buoyed these efforts (DeFazio, 2021; Yarmuth, 2022). There has never been greater political momentum to transition the U.S. residential building sector to low carbon homes than today.
How effective have the above-mentioned programs been historically? Previous studies observed an “energy efficiency gap” between the socially optimal level of energy efficiency and individuals’ choices what retrofits to implement (Allcott and Greenstone, 2012; Gillingham and Palmer, 2014). Recognized barriers to adoption include market failures, behavioral anomalies, and complicated regulations (Eker et al., 2018; Gillingham and Palmer, 2014; Reames, 2016). At the individual household level, explanations for the gap range from limited access to upfront capital (Forrester and Reames, 2020), ignorance about available programs (especially for non-English speakers), inability to evaluate costs and benefits, lack of time to manage a construction project, and/or limited trust in utilities (Reames, 2016; Eker et al., 2018; Nidam, 2019). There is particularly limited retrofitting activity in rental units since owners either do not get any benefits from the savings (split incentive) or they pass on costs of decarbonization in the form of higher rents (which can lead to eviction or displacement pressures). Low income and communities of color are particularly vulnerable to the aforementioned barriers, leading in disproportionately lower participation among these groups (Pigman et al., 2021; Reames et al., 2018; Sunter et al., 2019).
In summary, policymakers, utilities, and municipal governments have developed a plethora of well-intended incentive programs to support widespread adoption of energy saving measures in residential buildings to reduce building-related carbon emissions. However, the rate of local adoption of these programs remains low due to a combination of well understood reasons. To advance beyond the current impasse, we present a hybrid socio-techno-economic analysis framework that predicts the rate of retrofit adoption throughout a city or neighborhood. The goal of the model is to help municipal governments identify underused, financially viable opportunities within their jurisdiction and potentially to lobby to fit existing incentives, which are often designed at the state level, to their local needs.
Our model is an based on a digital twin technology called urban building energy modeling (UBEM) (Reinhart and Cerezo Davila, 2016). UBEM is an engineering model approach where geographic information system (GIS) data sets of existing buildings are converted into abstracted heat and mass flow models of each building in a city or neighborhood. These individual building energy models (BEM) are then combined with annual local weather files to predict hourly energy use in buildings for current as well as any combination of upgrade building conditions. Four main UBEM applications have been identified: (1) urban planning and new neighborhood design, (2) stock-level carbon reduction strategies, (3) individual building-level recommendations, and (4) buildings-to-grid integration (Ang et al., 2020). Our model falls under the use case (2) stock recommendation category. While most previous studies exclusively focused on technical feasibility, that is, the amount of carbon emissions that could result from stock-wide implementation of certain upgrades (Cerezo Davila et al., 2016; Buckley et al., 2021; Ang et al., 2022), a few studies also considered occupant demographics. Heidelberger and Rakha (2022) used demographic data to account for variation in household-level energy consumption pattern for a neighborhood in Atlanta, GA, USA. They defined four types of households to represent the residents of the studied neighborhoods to demonstrate that UBEMs that incorporate socio-demographic data may lead to more accurate results than traditional UBEMs with more uniform usage patterns. This conclusion aligns with previous studies that revealed significant differences in households energy consumption patterns by income and race, where urban areas with majority white population and higher income tend to have higher energy use intensity (Porse et al., 2016; Tong et al., 2021). Berzolla, Ang, and Reinhart recently introduce an UBEM model that differentiates retrofit adoption based on building ownership and household income for Oshkosh, WI (Zachary et al., 2022). Our augmented UBEM framework expands on previous efforts by combining technical upgrades, feasibility, and occupant demographics with local building regulations and eligibility to participate in existing incentives structures. The method is scalable across the U.S. and other regions where census data is available. We present its application to two neighborhoods in Boston, MA, USA.
Boston case study
Boston was selected as a case study city because of the seeming disconnect between the city’s status as the “most energy efficient city in the United States” (David et al., 2013), and its low energy efficiency implementation rates among small scale housing units. The bulk of housing energy efficiency incentives in Boston is provided by Mass Save, an umbrella brand for state-mandated, utility-operated energy efficiency programs. Mass Save was created through the 2008 Green Communities Act which requires energy providers to pursue all cost effective energy efficiency solutions (The Commonwealth of Massachusetts, 2008). According to Mass Save data for the city of Boston, only 2.5% of households implemented one or more energy efficiency measures between 2014 and 2017. The data also shows high variability in adoption, where 93% of adopters were homeowners. Further geographic analysis (see Figure S1 in supplementary materials) revealed that adoption was highest in peripheral neighborhoods that are characterized by single-family housing.
To better understand the high adoption variability between different neighborhoods, we selected two neighborhoods with significantly different median household income, upgrade regulations, and exposure to flooding (Figure S2 Supplementary material). The South End is a mix-use affluent neighborhood, located in proximity to Boston’s Central Business District. There are 506 single-family, two-family and three-family homes in the South End, which amount to 38% of the residential parcel area. The majority of residents are of higher income (median income above $110,000), and 80% are homeowners. All of the buildings in this area are part of the Boston Historic district zoning overlay, which requires a longer review process and mandates strict standards for persevering the exterior of a building. The South End is a coastal neighborhood, with high exposure to future flood risks due to extreme weather events and sea level rise.
In contrast, the Dudley Triangle area is part of the residential inland neighborhood Roxbury that is not exposed to coastal flood risks according to the City of Boston flood risk maps. Its residential typologies are similar to other residential neighborhoods across the city. The Dudley triangle area includes 360 single-family, two-family, and three-family homes, which amount to 85% of the residential parcels in this area. The majority of residents are of lower income (median income less than $42,000) and 70% are homeowners.
Methodology
To develop a census-based UBEM for the two neighborhoods, we implemented the following steps. Details are presented below. (1) Create shallow and deep retrofit scenarios based on retrofit measures that are both relevant to the local building stock and supported by incentive programs (2) Classify buildings by program type and occupant demographics (3) Build a Census-Based UBEM for shallow and deep upgrade scenarios (4) Determine regulatory feasibility and financial viability for both scenario upgrades in all buildings (5) Predict neighborhood level energy, carbon, and cost savings assuming that all financially viable upgrade projects are implemented
To ensure scalability, we use only publicly available data sources that can be found in many cities in the U.S. and worldwide. To create an UBEM, information is needed about the local climate, building typologies, and energy use profiles. To assess the costs of implementation and the availability of financial incentives, additional information is needed about the cost of each energy conservation measure, the cost of compliance with regulations, and the financial incentives for each energy conservation measure. Data for the case study was collected in 2018. We used the open access datasets described in Figure S3 in the supplementary material to build a census-based UBEM for two neighborhoods in Boston.
Step 1: Create shallow and deep retrofit scenarios
The process for creating relevant retrofit scenarios requires consideration of which combination of energy efficiency measures will be most effective in the evaluated region. Previous research has demonstrated how this process can be done collaboratively with the energy policy decision makers to inform future policy (Ang et al., 2022; Cerezo Davila et al., 2016). In this paper, we draw on previous studies of Boston buildings and incentive programs to create shallow and deep retrofit scenarios. The former scenario consist of measures that are low-cost, easy to implement, and can be completed within a day: Weatherization (weather stripping and sealing openings) and upgrade to solid state lighting. In Massachusetts, both strategies are available at no cost via a Mass Save audit. Deep retrofits require bigger changes to the building and equipment and are achieved at a higher cost and amortized over a longer time. Our deep retrofit scenario includes all shallow upgrades plus window upgrades to double pane windows, wall, attic, and basement insulation, appliance upgrades to EnergyStar standard, heating upgrades for boilers and domestic hot water, and cooling system upgrades. Additional upgrades under the deep retrofit scenario usually require upfront investment by the building owner even though partial rebates are available for all residents as well as additional assistance for select, lower income groups.
Step 2: Classify buildings by program type and occupant demographics
To create location specific building descriptions (archetypes), we apply a two-step classification process on the building data derived from the tax accessor data. First, we classify buildings by the number of units per floor. This occupant density positively correlates with number of residents and internal heat loads as a higher number of units necessarily indicates more energy demand. In parcels without a valid number of units entry, we use the number of kitchens as a proxy. Parcels without either entry field are excluded from further analysis. After establishing the number of units per building, we derive the ratio of number of units per number of floors. For each of the resulting 10 ratios we define unique structure types.
Second, we add a building age classification to determine differences between building structure types. A building age is a proxy for building materials and construction technology, determining how its walls and roof are constructed, how it is heated, the amount of insulation, and the type of windows used. In the Boston area, we note four timeframes: (1) pre-1950s; (2) 1951–1980; (3) 1981–2000; and (4) 2001-present. The time periods coincide with major changes to building codes and/or construction practices. Each building was assigned a timeframe category based on its year of construction or major renovation. Our 10 structure types and four building age categories lead to 40 building construction archetypes.
To introduce household demographics, we use entries from the American Census Survey (ACS). While we acknowledge that each individual household has a unique energy consumption pattern mostly associated with equipment and lighting power loads such as how often they use the television, kitchen appliances, or turns on the lights, there is no dataset that identifies household characteristics by housing unit. Therefore, in order to account for differences in energy consumption between different households, we created four census-based household types that are common for the two Boston neighborhoods: (1) Elderly Couples – Two people household characterized by using older appliances, going to bed early, and having lower equipment density; (2) Families – Four people household characterized by two adults working 9–5, medium appliance density, and highest equipment loads; (3) Young Professionals – Three people household characterized by staying up late, getting up early, and high density occupancy; (4) Students – Four people household characterized by staying up the latest, sleeping late, and high occupancy density. The four household types encompass broad age groups in different living arrangements with dramatically different energy usage patterns.
Lastly, we use the four household types to create four alternatives for occupancy density and use patterns for each building, resulting in a 4 x 40 = 160 unique building/household archetypes. Since the distribution of household types is only available at the census block, we model each building for each of the four household types and assign a weight of each result according to the block distribution. For example, for a block consisting of 75% Families and 25% Young Professionals, the simulation results for each building weighted at 75% and 25% for the Families and Young Professionals archetype, respectively.
Step 3: Build a census-based UBEM for shallow and deep upgrade scenarios
In step 3, we populate the building templates for the baseline, shallow and deep energy retrofit scenarios using MIT’s Urban Modeling Interface (UMI) (Christoph et al., 2013). Building templates provide non geometric building information construction materials and assemblies, usage schedules, and conditioning equipment. (Cerezo et al., 2014). For the baseline scenario, we derive properties from the Boston energy model (Cerezo Davila et al., 2016) which is mostly based on the U.S. Department of Energy (DOE) Benchmark Buildings (Torcelini et al., 2008). The different demographic types are modeled via custom equipment and occupancy schedules leading to the aforementioned 160 archetypes. The shallow and deep retrofit scenarios include upgrades to the above fields based on the ASHRAE 90.1-2013 (ASHRAE, 2013) and the 2008 ASHRAE Handbook (ASHRAE, 2008). The building construction and system parameters for the baseline and upgrade scenarios are outlined in Figure S6 of the supplementary documents.
Third, we define the lighting and equipment power density for all scenarios. The lighting and equipment power density varies by structure and household type. It is affected by the number of appliances and unique use pattern and by the total floor area of the building and the number of units. Lighting and equipment power density are calculated separately. Since both retrofit scenarios include upgrades to the lighting system, we reduce the lighting power density calculation for these scenarios. We assume that all incandescent bulbs would be converted into LEDs. Lastly, we reduce the equipment power density for the deep retrofit scenario. This scenario includes upgrades to the appliances to EnergyStar mandated consumption levels. The building parameters for the lighting and equipment power densities for the baseline and upgrade scenarios are outlined in Figure S6 of the supplementary materials.
Once the building templates are ready, we can run energy consumption simulations for each of the three scenarios. The UMI uses the DOE’s EnergyPlus whole building simulation engine (Crawley et al., 2001 via the so-called shoeboxer algorithm (Dogan and Reinhart, 2017). Four UMI models for each of the four household types are simulated separately for the baseline and two retrofit upgrades. The workflow for the classification and assignment of building characteristics and geometry and the subsequent generation and simulation of building energy models is summarized in Figures S4 and S5 of the supplementary materials.
Step 4: Determine financial viability for both scenario upgrades for each household type
We utilize the outputs of the 12 UBEMs (3 scenarios x 4 household types) along with other data sources to conduct a neighborhood level estimation of the implementation costs and energy savings. Our financial analysis includes the necessity to retrofit, the cost of retrofit implementation including potential incentives, energy savings, and the resulting net present value (NPV).
Assess retrofit necessity and cost
We evaluate all 1–3-unit residential buildings in both neighborhoods to determine if they are in need of a given retrofit. We assume that buildings that were constructed or remodeled before the Boston Green Energy standards were enacted in 2007 are in need of an energy retrofit. For all other buildings, we assume that they are in need of an upgrade and that costs for a shallow retrofit are null (due to the earlier mentioned Mass Save incentives for all households). Deep retrofitting costs correspond to the actual cost of implementation of all energy conservations measures plus additional costs to comply with regulations, prepare for climate hazards, abate hazardous materials or overcome structural risks.
Retrofitting costs are determined for 2019 based on a building’s tax records and material costs determined from local Home Depot offerings. Installation costs are based on the total living area, estimated window, wall, and rooftop areas as well as available roof area for solar installation. Our model also assumes that building owners need to upgrade their refrigerator, washing machine, dryer, dishwasher, and oven to EnergyStar standard. Cost estimates are provided in the technical documentation.
Any building that is located in a historic district is assigned an additional cost premium for insulation and window replacement, to account for the effort required to comply with those local regulations. Another additional cost is assigned to any building located in a flood risk overlay, to account for the cost of flood proofing. Depending on a buildings’ age, the following barriers might also be encountered: Irregular Construction can be expected in buildings built before 1985; Asbestos siding or insulation and Vermiculite Insulation are common building materials between 1800–1980; Lead Paint may be found in any building constructed prior to 1978; “Knob and Tube” electrical wiring remains somewhat common in buildings constructed before 1940. While there is no building specific record available to identify which of the above barriers might apply, local experts from the City of Boston Environment Department and private architecture firms assert that asbestos and lead abatement are the most common hazards in the Boston area. To account for the cost of overcoming these barriers, any building built or remodeled before 1985 is considered to have a barrier to retrofit implementation and is assigned a barrier mitigation cost that scales with the total building area.
Net present value (NPV) analysis
We calculate the NPV of energy savings for a 10 year time period, using an 8% discount rate and assuming energy savings start accruing a year after the implementation is completed. The 8% discount rate is set to be above the inflation rate of 2019, but still low relative to real-estate investments because it is intended to reflect the risk associated with the investment, and not a desirable profit rate. There is high uncertainty associated with the expected energy savings per household, since it depends on changing energy prices and user behavior after the retrofit project has been implemented (A. Greening L et al., 2000; Orea et al., 2015).
Energy savings are derived from the differences in energy use between an upgrade scenario and its baseline. Cost savings are based on average 2018 prices in Boston-Cambridge-Newton which corresponded to 0.225 $/kWh for electricity and 0.05 $/kWh for natural gas. Each parcel is assigned four energy savings NPV, one for each household type.
To understand the actual retrofitting costs and incentives by household type, we use an inventory of all federal, state, and municipal incentives applicable to the Boston area. Our inventory is based on the DSIRE search tool and includes 28 federal and state energy efficiency incentives programs (NC Clean Energy Technology Center, 2019) as well as several need-based incentive programs that are specific for the City of Boston. Each of these programs has different eligibility and income criteria as well as different application processes. The federal and state governments provide tax credits and exemptions for solar energy. Mass Save provides an umbrella of energy efficiency programs to upgrade lights, appliances, and HVAC equipment, as well as to install insulation. Income-eligible citizens are provided with further financial assistance for lead abatement and retrofit implementation. Lastly, the City of Boston offers several incentives for income-eligible citizens, with additional assistance for senior households or households with a child under 6. The full list of incentives used in this model is detailed in the technical documentation.
Based on the upgrade inventory, we assign different household-level retrofitting costs for each building depending on household type. This leads to potentially four different household-level retrofit costs for the same set of measures in a given building. The resulting net present value and payback times (assuming a 0% loan which are available through Mass Save) for each different building and household type determines the likelihood for a project to happen. For this proof-of-concept application, we assume that energy costs stay constant for the duration of the 10 years. Projects are deemed viable if the payback time is under 10 years. We note that the length of acceptable payback times for different household types is an active area of research and can easily be changed in our model.
Step 5: Predict neighborhood level energy, carbon, and cost savings
Finally, using demographic data, individual building results were scaled up for both neighborhoods. Each census block group has a unique distribution of household types represented as a percentage value for each of the four household types. As explained above, since we do not have demographic data more granular than the block level, the results for each building are weighted by the household type distribution from the block level.
Results
As for previous studies (Cerezo Davila et al., 2016), our results show a dramatic impact of retrofit implementation on the ability to meet city-wide carbon neutrality targets. Figure 1 shows that in both neighborhoods, stock-wide implementation of the deep energy retrofit scenario can reduce nearly 60% of the total carbon emissions of 1–3-unit family buildings. The figure also shows the amount of carbon emission reductions that will happen if only projects with a less than 10 years NPV are implemented. The red dotted line shows estimated carbon emissions stemming from the actual 2% participation rate observed in Boston between 2014–2017. Total annual carbon emissions (10,000 lbs CO2) by scenario.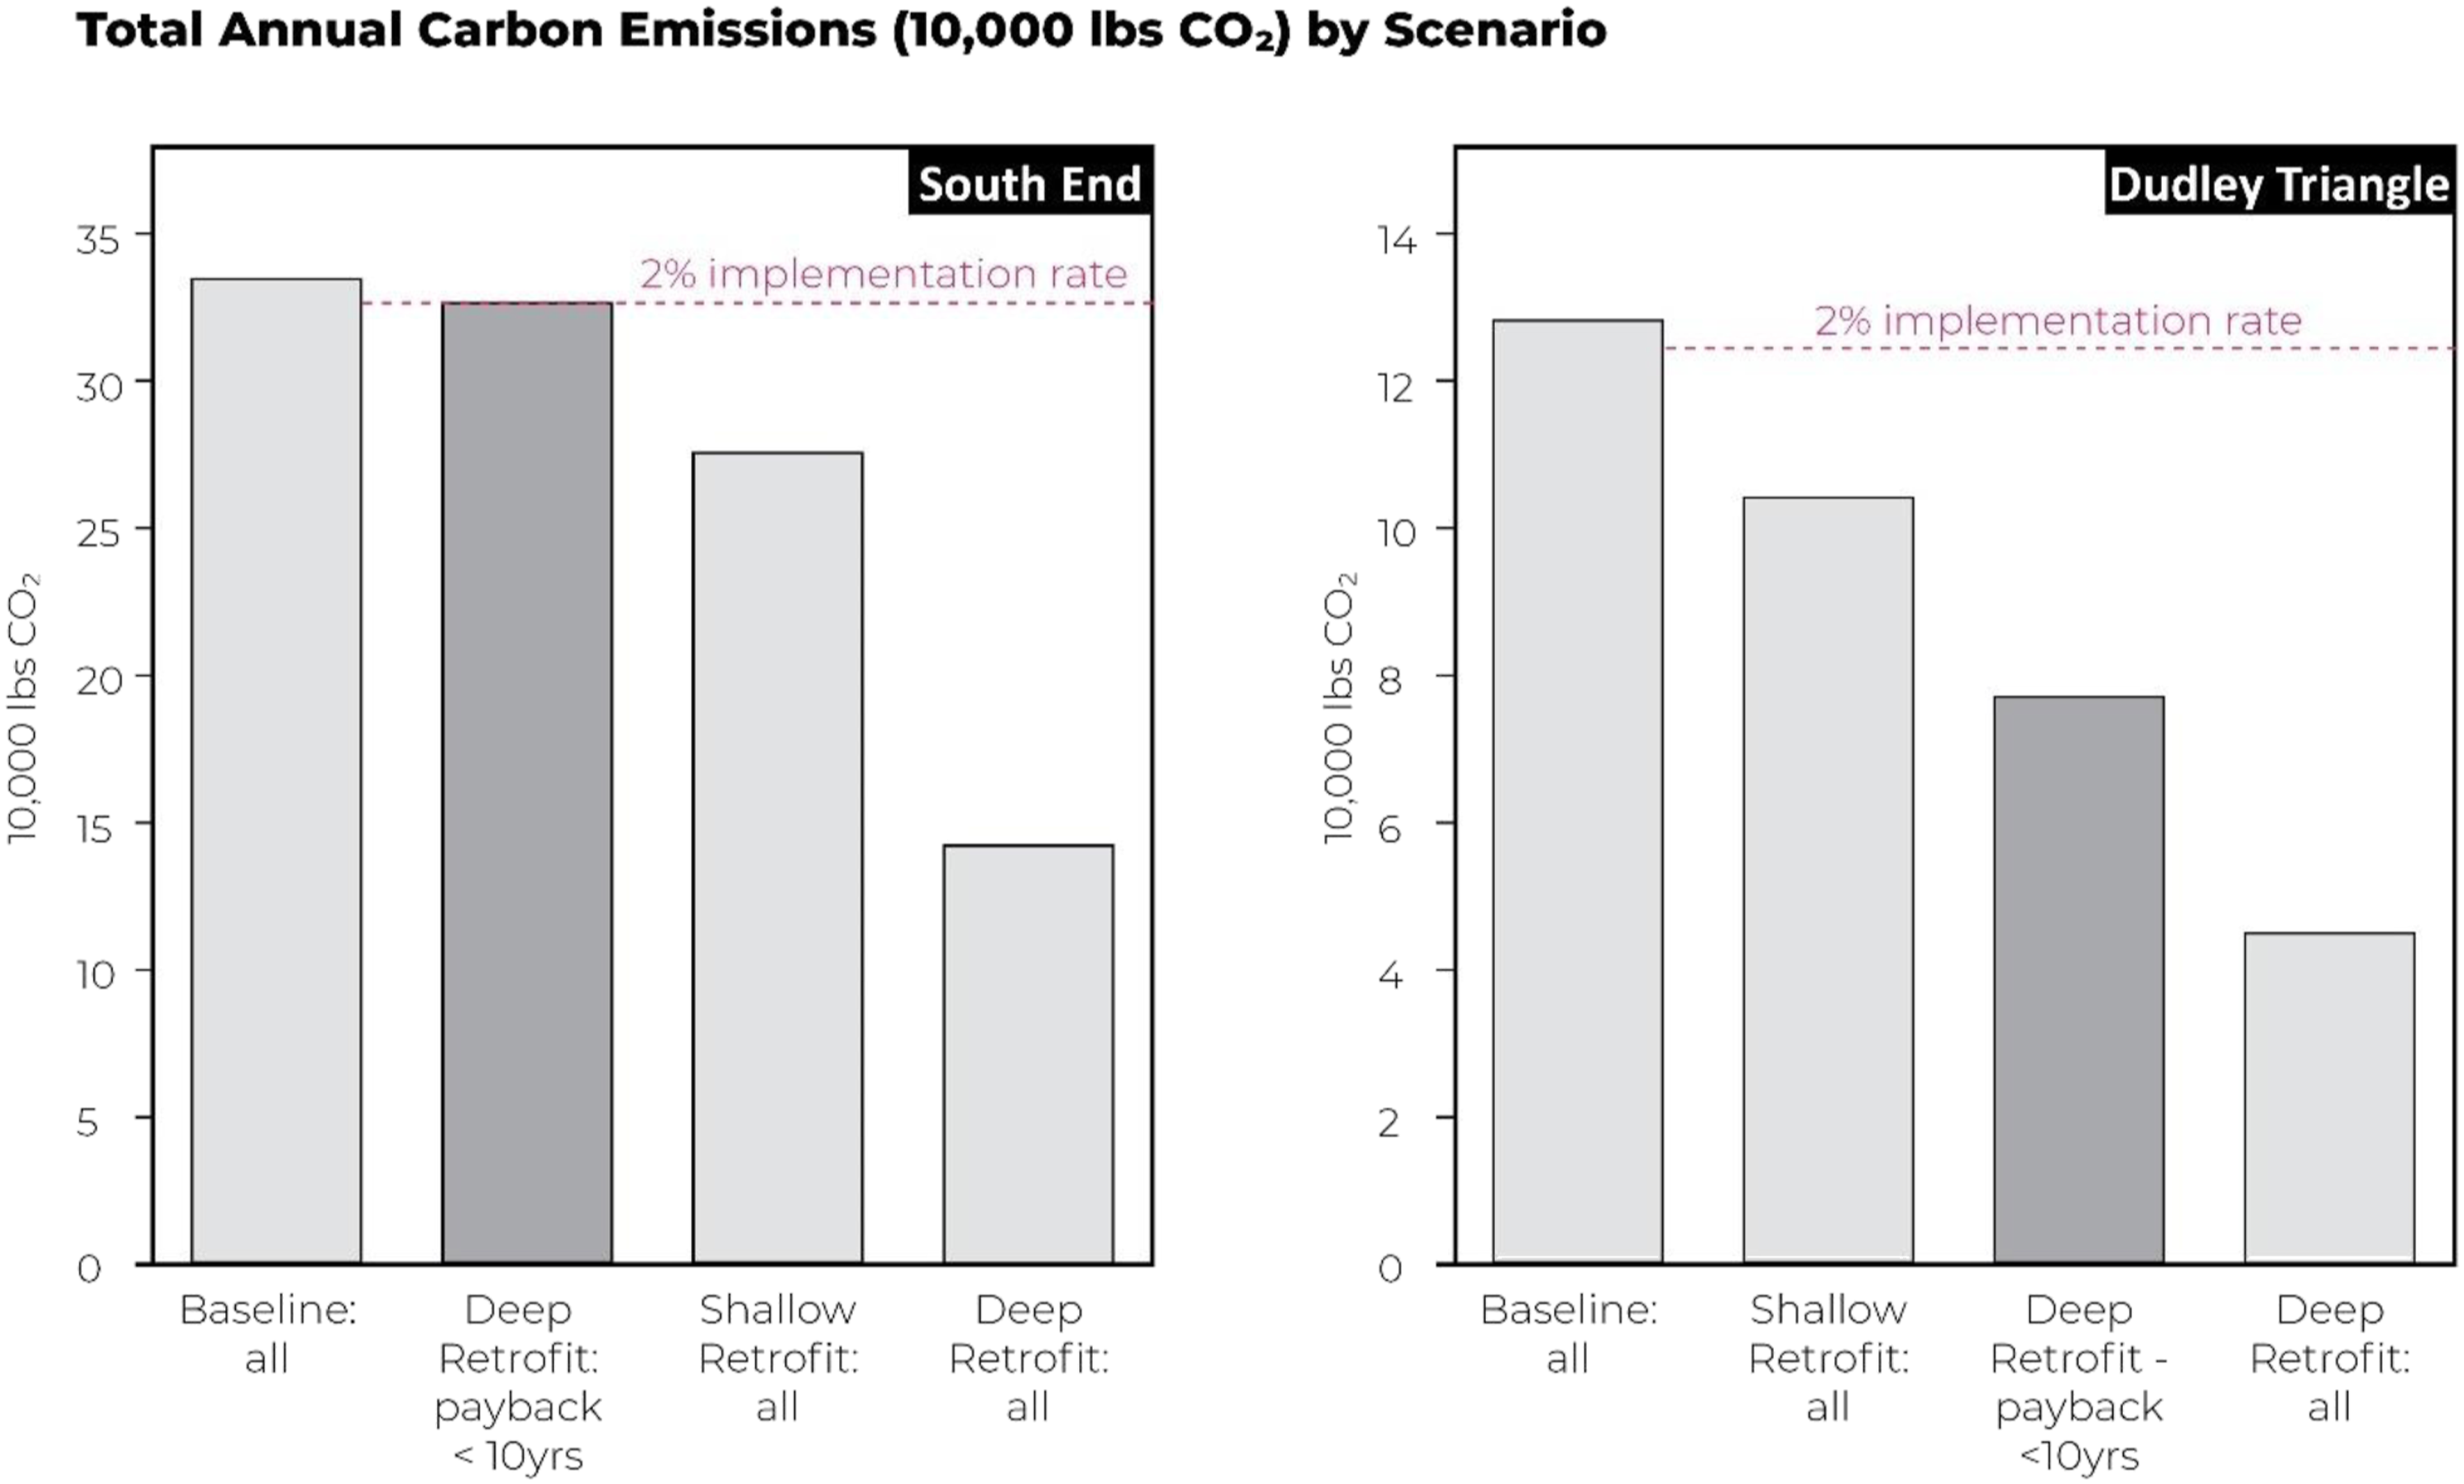
In the South End, less than 1% of the buildings can offset the cost of a deep retrofit over 10 years due to a combination of higher retrofit costs and ineligibility for need-based assistance. In this area, retrofit costs are higher due to the need to comply with the historic district regulation, and the need to floodproof the basements. Since households’ median income is high, most households are not eligible for additional financial incentives. Even if the limited subset of building that can offset the cost of a deep retrofit proceeds with implementation, the impact on the total energy consumption is minimal and less effective than the shallow retrofit scenario, where all buildings comply with a Mass Save audit which installs efficient lights and seals drafts. These results for the deep retrofit scenario are consistent with the under 2% participation rate in Mass Save programs for deep retrofit measures in Boston between 2014–2017. In this case, we conclude that financial barriers associated with regulation, climate resilience, and energy incentive packages, play a significant role in limiting the adoption of deep retrofits in the South End.
In Dudley Triangle, over 50% of the buildings can offset the cost of a deep retrofit over 10 years, mostly due to the higher share of lower income households that are eligible for need-based assistance from the federal, state, and municipal governments. If these households act, they can reduce the total neighborhood energy consumption by half. However, participation rates in the Dudley Triangle between 2014–2017 were less than 1%, significantly below the potential to retrofit buildings in this neighborhood. In this case, we conclude that non-financial barriers, that are not captured by our model, affect adoption of deep retrofits in Dudley Triangle. The literature on retrofit adoption in low-income neighborhoods suggests that non-financial barriers include access to information, ability to evaluate costs and benefits, the time to manage a construction project, and/or a lack of trust in utilities to conduct the retrofit (Reames, 2016; Eker et al., 2018; Nidam, 2019).
Figure S7 in the supplemental material shows the payback time by household type for the two neighborhoods. As 0% loans are available only up to 7 years, the dotted red line in the graphs shows how many households might be able to use this financial benefit. The chart reveals that most South End households will need more than 10 years to break even, with the median payback time ranging between 13–14 years across all buildings. In contrast, for Dudley Triangle, except for seniors, most households living in 2–3-unit family homes have a payback period shorter than 7 years, and most single-family homes have a payback period shorter than 10 years.
A closer look at the potential to retrofit by household type reveals that for the same income level and building type, the larger the household size, the more likely it is to be eligible for government incentives that will shorten the payback time. This explains why the household group elderly (2-member household) receives significantly less financial support than other groups and has longer payback time. It was surprising to receive these results because several government programs specifically target the low-income elderly population. One potential explanation for this result is that the block-level median household income in the Dudley area might be just a bit above the maximum amount for a 2-person household to qualify for financial assistance. While this result reflects a methodological limitation stemming from the need to generalize, it also supports previous studies showing that there is a financing coverage gap for moderate-income households (Forrester and Reames, 2020).
Discussion
Overall, our results reveal that low-medium income households, as typical for the Dudley Triangle neighborhood, have an underutilized potential to participate in retrofit programs. Results also show that the current incentive scheme will not motivate high income households, represented by the South End, thus creating a conflict between the Boston’s mission to achieve carbon neutrality by 2050 and its policies to achieve this target.
We demonstrated that the census-based, augmented UBEM approach introduced in this paper offers a more accurate financial assessment of the energy saving potential of different retrofitting measures at the individual household level, explaining why the uptake in certain neighborhoods is low. Compared to a conventional top-down assessment, our method utilizes multiple user profiles and building specific parameters thereby generating a model that is more representative of the actual neighborhood. The model offers a tool for policymakers to finetune existing incentive structures to enhance uptake. At the same time, our results for the Dudley Triangle show that even if financial boundary conditions are favorable, policy makers must also provide targeted assistance to overcome non-financial barriers to implementation among low-income households, so that they can participate and benefit from energy incentives programs.
Limitations and future research
We note several limitations to our study and outline future research directions. First, the uncalibrated Urban Building Energy Model provides rough estimates that indicate the trend of energy consumption under different scenarios but does not provide the exact total of energy consumption at the household level. Similarly, the calculation of the net present value of energy savings, the cost of implementation, and incentive package indicate the expected trend of these costs and not an exact estimate. Future research that implements this framework can add an additional step, conditional on having utility data and retrofit cost data, to provide more accurate estimates to decision makers.
Second, the UBEM framework provides aggregated estimates to support neighborhood and urban-level decision making. Individual level estimates should therefore be treated as approximations of potential savings in a given building.
Third, we explored four household types that are common in our case study city but are not representative of all household types within the studied geography. Researchers seeking to implement this methodology for a specific geography can co-create the household types in consultation with decision makers and community partners to cater for the specific needs of the targeted population.
Fourth, our study was focused on exploring two pre-determined scenarios which limited our ability to determine which individual measures are the most effective. Future research seeking to use UBEM to design new incentive programs can explore different retrofit scenarios and compare their ability to offset the cost of implementation for different.
Fifth, our carbon emissions calculation are sensitive to the composition of the energy grid in Massachusetts. Grid decarbonization efforts will significantly change our carbon emission estimates going forward.
Sixth, our cost offset calculations are sensitive to the energy price and inflation rate. While we assumed a fixed price of fuel for the timeframe of the analysis, we acknowledge that future variation in the price of fuel will affect the calculation of energy savings. Similarly, we acknowledge that the 8% discount estimate is no longer conservative in 2022, when there is an expectation for inflation.
Conclusions
The augmented, census-based Urban Building Energy Model proposed in this manuscript supports the design and evaluation of energy policy by estimating the urban area level energy consumption under different retrofit scenarios and their respective adoption probability. Urban planners, energy policy designers, and community advocates seeking to plan and evaluate energy incentive programs can use this framework to understand the breakdown of financial opportunities and barriers for each socio-demographic group and geographic location. These insights directly can inform the design of targeted incentive policies that seek to eliminate financial barriers to retrofit implementation, or be used in an evaluation of existing policies, to assess the existence and extent of financial barriers.
Supplemental Material
Supplemental Material - Census-based urban building energy modeling to evaluate the effectiveness of retrofit programs
Supplemental Material for Census-based urban building energy modeling to evaluate the effectiveness of retrofit programs by Yael Nidam, Ali Irani, Jamie Bemis and Christoph Reinhart in Environment and Planning B: Urban Analytics and City Science
Footnotes
Declaration of conflicting interests
The author(s) declared no potential conflicts of interest with respect to the research, authorship, and/or publication of this article.
Funding
The author(s) received no financial support for the research, authorship, and/or publication of this article.
Supplemental Material
Supplemental material for this article is available online
References
Supplementary Material
Please find the following supplemental material available below.
For Open Access articles published under a Creative Commons License, all supplemental material carries the same license as the article it is associated with.
For non-Open Access articles published, all supplemental material carries a non-exclusive license, and permission requests for re-use of supplemental material or any part of supplemental material shall be sent directly to the copyright owner as specified in the copyright notice associated with the article.