
Abstract
The completion progress of residential development projects and the length of construction are frequently discussed in the construction industry, but rarely studied by urban modellers. Nonetheless, a realistic reflection of housing supply processes is important for urban microsimulation and land use modelling. To predict the dwelling units generated over space and time, this paper decomposes the housing supply process into two major components: housing starts and completions, the nature and modelling logic of which are quite different. This paper deals with the latter segment, aiming to answer the question of: how long will it take to complete construction of new dwellings? A Cox Proportional Hazard (CPH) Model is employed to examine the “survival” rate of residential building projects and the probabilistic distribution of construction periods. Narrowing down the scope of research, this study investigates housing completions at the individual project level, and discusses the impact of structure type, surrounding land use, and accessibility on the housing completion rate. The Cities of Toronto, Hamilton, and Brampton in the Greater Toronto and Hamilton Area (GTHA) were selected to conduct the empirical study, with each representing different types of urban form to test model compatibility. The hazard models show good performance in replicating completion rates, and the impact of each factor on hazard ratio indicates that, single detached dwelling units with relatively homogeneous land use have the shortest completion time. This study could provide one component of a comprehensive framework for modelling housing supply, especially in urban microsimulation systems.
Keywords
Introduction
Two major components of the residential housing supply process are the decisions of when to start a housing development project and the length of time it takes to complete the construction after getting building permits from the government. It is these two processes that determine the rate at which new housing comes onto the market, but these processes are often modelled in relatively simplistic manner. Construction time, in particular is often not explicitly modelled at all. This paper addresses this gap in the literature by developing a model of housing construction durations for selected municipalities within the Greater Toronto and Hamilton Area (GTHA). In this paper, the length of the construction period is regarded as a random variable with a probabilistic distribution. Assuming the same average management ability of GTHA builders, this paper’s hypothesis is that the completion time for a housing project is similar, to some extent, to the survival time of patients, or service time of a working machine. Thus, a Cox Proportional Hazard model (CPH) might be employed to model the housing completion process.
Previous studies reveal that construction duration relates to the project size, housing demand variation, construction cost, and project management of contractors (Burrows et al., 2005; Kaka and Price, 1991; Kumaraswamy and Chan, 1995; Koo et al., 2010), which differ from the factors considered by developers when deciding when to start a project. In this study, the time to completion is represented as the “survival time” of the construction project, a random variable with a probabilistic distribution. The purpose of this paper is to predict the housing construction period and simulate the housing supply process within a broader urban microsimulation context. In particular, the modelling process of housing completion and housing starts are closely connected to the Integrated Land use, Transportation, and Environment (ILUTE) model system (Miller and Salvini, 1998, 2001; Rosenfield et al., 2013; Salvini and Miller, 2005), aiming to provide one component at a micro level within the overall modelling structure of ILUTE.
The paper is organized as follows: the modelling logic and framework for the residential construction process is discussed in Section 3, following a literature review of construction duration studies and modelling techniques in Section 2. Section 4 details the methodology of this study, the CPH model basic concepts, and application to construction completion modelling. Section 5 describes the residential construction market in the GTHA and introduces the data employed in the model. Section 6 presents the CPH modelling results in three selected cities within the Greater Toronto and Hamilton Area, Toronto, Brampton, and Hamilton, both in the aggregated and disaggregated by dwelling types. The prediction performances are compared in Section 6 as well. Finally, the findings of the study are summarized in Section 7, with study limitations and future research direction discussed.
Literature review
Construction duration and residential development processes have been widely discussed in the construction project management field. Previous research on residential construction duration indicates that factors affecting residential building progress mostly derive from three aspects: project cost and type of workload involved, locational features, and team management and project scheduling. Project cost is recognized as the best indicator of construction duration (Bashford et al., 2005; Choudhury and Rajan, 2003; Stoy et al., 2007; Walker and Vines, 2000) as it reflects the project size and quality of the work (Qiao et al., 2019). Mačková and Bašková (2014) apply only project cost in the simple regression to estimate the construction duration. Bayram (2017) found this works better than using amount of work. Though management-related factors and contractor’s ability are found to influence project durations (Al-Momani, 2000; Aalen, 1989; Durdyev et al., 2017; Odeh and Battaineh, 2002), these are difficult to quantitatively assess and include in the model. Other than the factors mentioned, other potential factors include finances, availability of resources, site conditions, site access, facility design type, and project complexity (Martin et al., 2006; Qiao et al., 2019).
Researchers have been attempting to develop models to predict the construction duration for better project planning and risk management, among which multivariate regression, temporal autoregressive models, and machine learning algorithms were applied, but hazard models have been seldom considered. Multivariate regression is most commonly applied in previous studies (Burrows et al., 2005; Chan and Kumaraswamy, 1999; Mackova et al., 2017; Stoy et al., 2007). Koo et al. (2010) applied a hybrid method of multivariate analysis, case-based reasoning, artificial neural networks, and Monte-Carlo simulation to predict the construction duration and achieve a prediction accuracy of 93.3%. Anysz and Buczkowski (2019) develop software to predict the construction duration and model which combination of properties of the project can cause significant delay. Though the hybrid method achieved high accuracy and simulation-based methods are explored for construction duration, the application could be overburden within an urban microsimulation system. The only research that applied a hazard model is by Qiao et al. (2019), who estimated the construction duration of highway projects by different types. The above methods applied can identify the major factors that cause delays, however, a large number of factors affect project duration and this inherent variability leads to a large variance in project duration. The probabilistic methods introduce stochastic elements into the model and give a probabilistic description about the duration instead of modelling an exact outcome (Greene and Hensher, 2010; Irfan et al., 2011; Qiao et al., 2019). Construction duration or the time to completion is in nature probabilistically distributed, and hazard model is suitable for analyzing the “time to occurrence” type of issue.
Built on the review of variables and methodologies applied in previous studies, this study applies a hazard model for modelling the construction duration. The major contribution of this study is that instead of a simplified treatment of housing supply in previous urban models, this study investigates the housing supply process in a comprehensive two-stage framework (housing starts and housing completion), and applies a survival model to predict residential construction duration within an urban microsimulation system.
The logic of modelling housing supply in urban microsimulation systems
The housing market module of ILUTE involves various processes including residential mobility decisions, housing supply, auctioning, and market clearing (Rosenfield et al., 2013). The market entry, property valuation, location choice, and auctioning modules are well structured, while the supply module only considers zoning, interest rate, type, size, location, and value of the new dwelling units. More detailed and realistic modelling is required for the supply side of the ILUTE model system.
Residential supply involves several decisions and actions of agents: the decision of developers to start a project, choices of dwelling type, location and number of dwelling units to build in the project, and the construction work of builders to complete the project. The construction process is complex, involving many detailed steps that are relatively fixed and routine, the details of which might not be of critical interest for urban microsimulation models such as ILUTE. Thus, the challenge in such models is to capture key explanatory variables consistent with the level of detail in such model systems that provide a robust, systematic prediction of construction times.
Following Farooq and Hurtubia, (2011) framework for urban built-space modelling, the modelling structure of housing supply with two stages of this study are proposed in Figure 1, with more focus on the housing completion (phase two) in this paper. As shown in Figure 1, from vacant land to new housing supply, developers need to make decisions on when, where to start, and the size (number of units) of the project, and then the construction activity of builders will determine when the project will be completed and when the new housing units will be available on the market. Structure of housing supply modelling with two phases.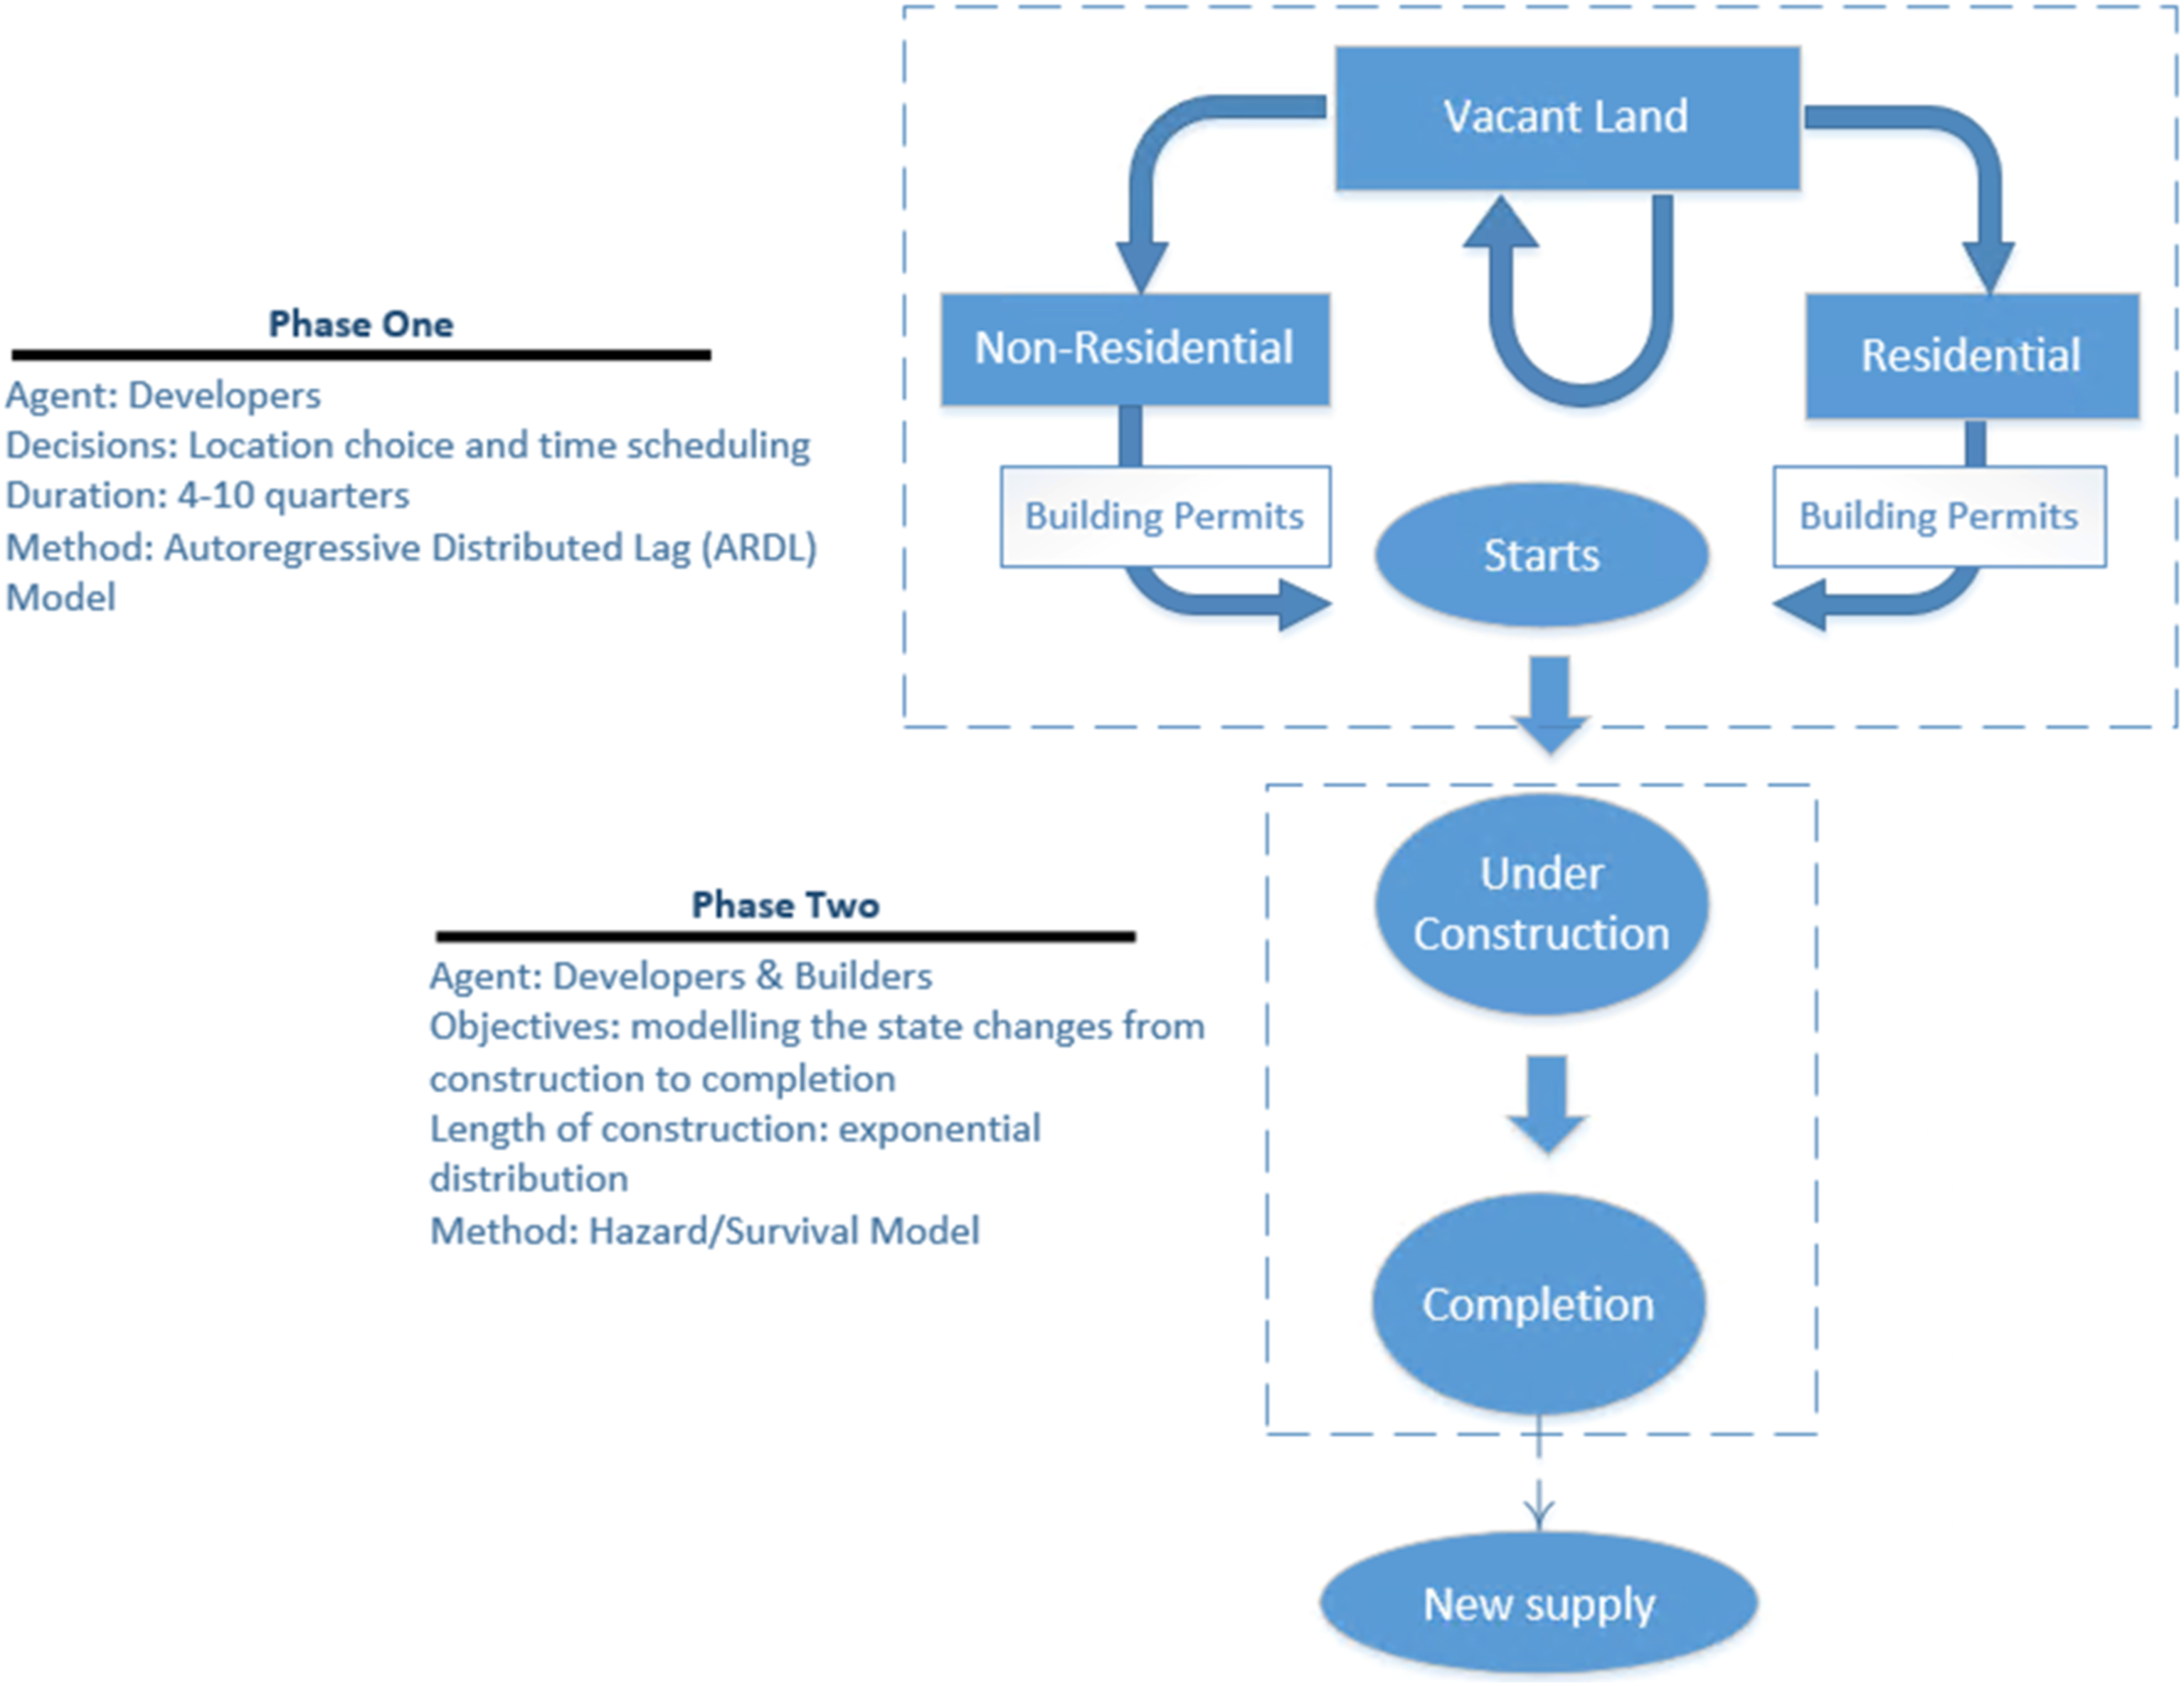
In phase two in Figure 1, the model system needs to determine the new housing supply available within the market, which is achieved sequentially by modelling the construction duration of the started projects. The total construction period may vary with the structure type and market conditions. Builders rely heavily on subcontractors to do the site work, and cooperate with each other locally with each subcontractor specializing in specific aspect of construction. Therefore, the construction length is also influenced by the labour rate, availability of specialized labour and material cost (Buzzelli and Harris, 2003; Farooq et al., 2010). From the perspective of stock-flow theories, the state change from under construction to completed should follow a state changing rate over time. Given, however, the multiplicity of factors influencing a project’s completion time (many of which are inevitably unknown within any land use modelling exercise), it is reasonable to model construction durations as a stochastic process. Empirical evidence shows that, indeed, construction durations generally follow a probabilistic distribution (Greene and Hensher, 2010; Irfan et al., 2011), such as exponential, Weibull, or Gamma distributions. Given this, a survival or hazard model would appear to be well suited to model the distribution of housing completions.
Methodology: Survival analysis of construction duration
Survival analysis examines and models the time it takes for events to occur (Fox and Weisberg, 2002; Schoenfeld, 1982). The original application of this analysis lies in the medical and engineering fields, and the typical events as the analysis object include human deaths or machinery working life, from which the term “survival analysis” derives. From these origins, survival analysis has seen much broader application into other fields in recent decades. Following Fox & Weisberg (2002), we reiterate the important concepts of survival analysis to build the discussion context, and explain the Cox Proportional Hazard (CPH) regression in detail below.
Survival analysis
The major objectives of survival/hazard analysis are estimating the distribution of survival times, predicting the hazard probability at certain time points, and examining the relationship between survival and its predictors or covariates. The project duration is the length of time between project starts and completions, which is considered as a survival time. Taking

The hazard model function form can be derived based on different assumptions concerning the distribution of survival time. For instance, if the survival times are assumed to follow an exponential distribution, then the density function is
Kaplan–Meier estimation and log rank test
The Kaplan–Meier estimator is a non-parametric statistic that allows us to estimate the survival function (Kaplan and Meier, 1958). This statistic gives the probability that an individual patient will survive past a particular time
The log-rank test is a large-sample chi-square test that uses as its criterion a statistic that provides an overall comparison of the KM curves being compared (Kleinbaum and Klein, 2012). This statistic makes use of observed versus expected cell counts for the log-rank statistic defined by each of the ordered failure times for the entire set of data being analyzed. Thus, using the log-rank test, we can identify whether different categories of observations have significantly different KM curves, which can provide a reference for the Cox Proportional Hazard model as well.
Cox proportional hazard model
Kaplan–Meier curves and log-rank tests are useful only when using categorical explanatory variables, but not for the quantitative predictors. An alternative method is the Cox Proportional Hazard (CPH) regression analysis, which works for both quantitative and categorical predictor variables (Bradburn et al., 2003; David, 1972).
The purpose of the CPH model is to evaluate simultaneously the effect of several factors on survival (Bradburn et al., 2003). Using the CPH model, it is possible to examine the relationship between the covariates and the survival rate. Most importantly, this examination enables the specification of a linear-like model for the log hazard. For example, a parametric model based on the exponential distribution may be written as


The Cox model, in contrast, leaves the baseline hazard function


This model is semi-parametric because, while the baseline hazard can take any form, the covariates enter the model linearly. The hazard ratio for any two cases at time
In this paper, the CPH model is applied to estimate the duration of residential construction, or the “survival length of the residential construction projects”. The factors in structure type, land use, magnitude of the construction, location, and labour costs are included in the model after referring to a broad literature on the construction process management.
Empirical study
Study area
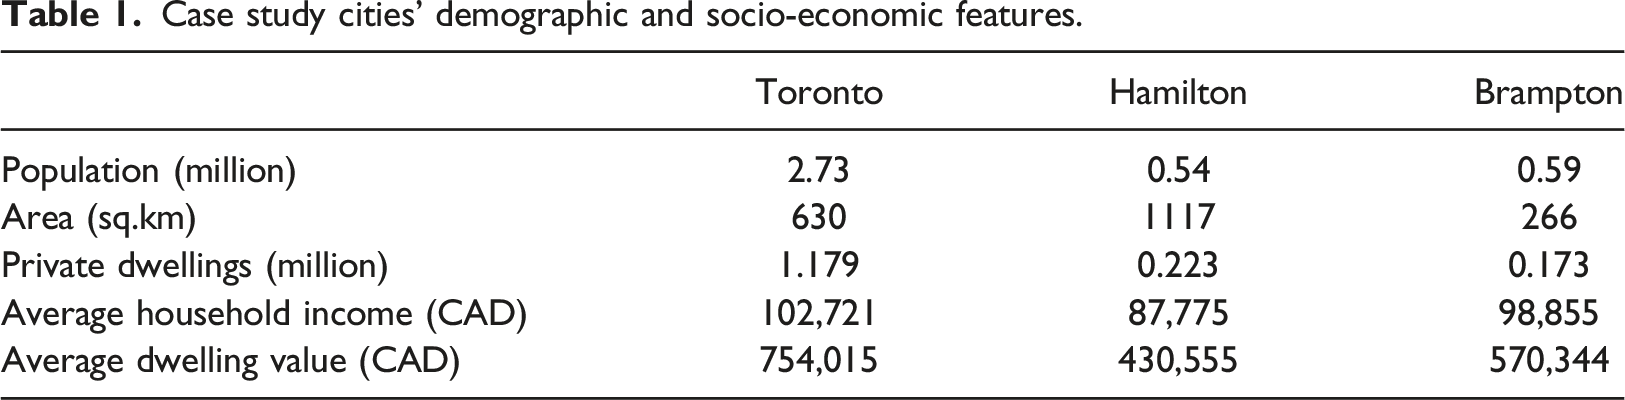
The empirical study area for this paper is the Greater Toronto and Hamilton Area (GTHA), where considerable residential development has occurred in the past few decades. Like other urban metropolitan regions in North America, the GTHA developed a strong urban core within the City of Toronto, and gradually sprawled to a wide range of suburban regions, where residential, industrial, and commercial buildings developed with lower density. The old Toronto downtown has more high-rise condo towers densely built, while due to limited land availability, the detached housings located within the central urban region were mostly built a long time ago, with ongoing renovation occurring. Townhouse, single and semi-detached dwelling units are the major dwelling types at the urban fringe, while some condo apartments have also been built at the major highway intersections. The cities of Hamilton and Brampton are typical sub-centres in the GTHA that interact with the City of Toronto.
Case study cities’ demographic and socio-economic features.
The number of housing completions by dwelling types are plotted in Figure 2 for the census subdivisions in the GTHA. The curve for each census subdistrict shows a relatively stable trend over the past 30 years.
2
Brampton has the highest number of single detached dwelling completed, especially since 2000, while most apartments completed are located in the city of Toronto. The semi-detached units follow a similar trend to the detached units, declining in the recent years due to increasing land price and limited availability. Townhouse completions on the other hand, have been rising, especially since 2015, as the dwelling units with more compact interior design and affordable price are generally preferred by the younger generation. In this study, we selected three census subdivisions, Toronto, Hamilton, and Brampton, as the study area, to compare how the CPH model performs when applied to various urban context (Table 1). The monthly number of housing completions by CSD
1
by dwelling types. Source: CMHC Housing Market Database.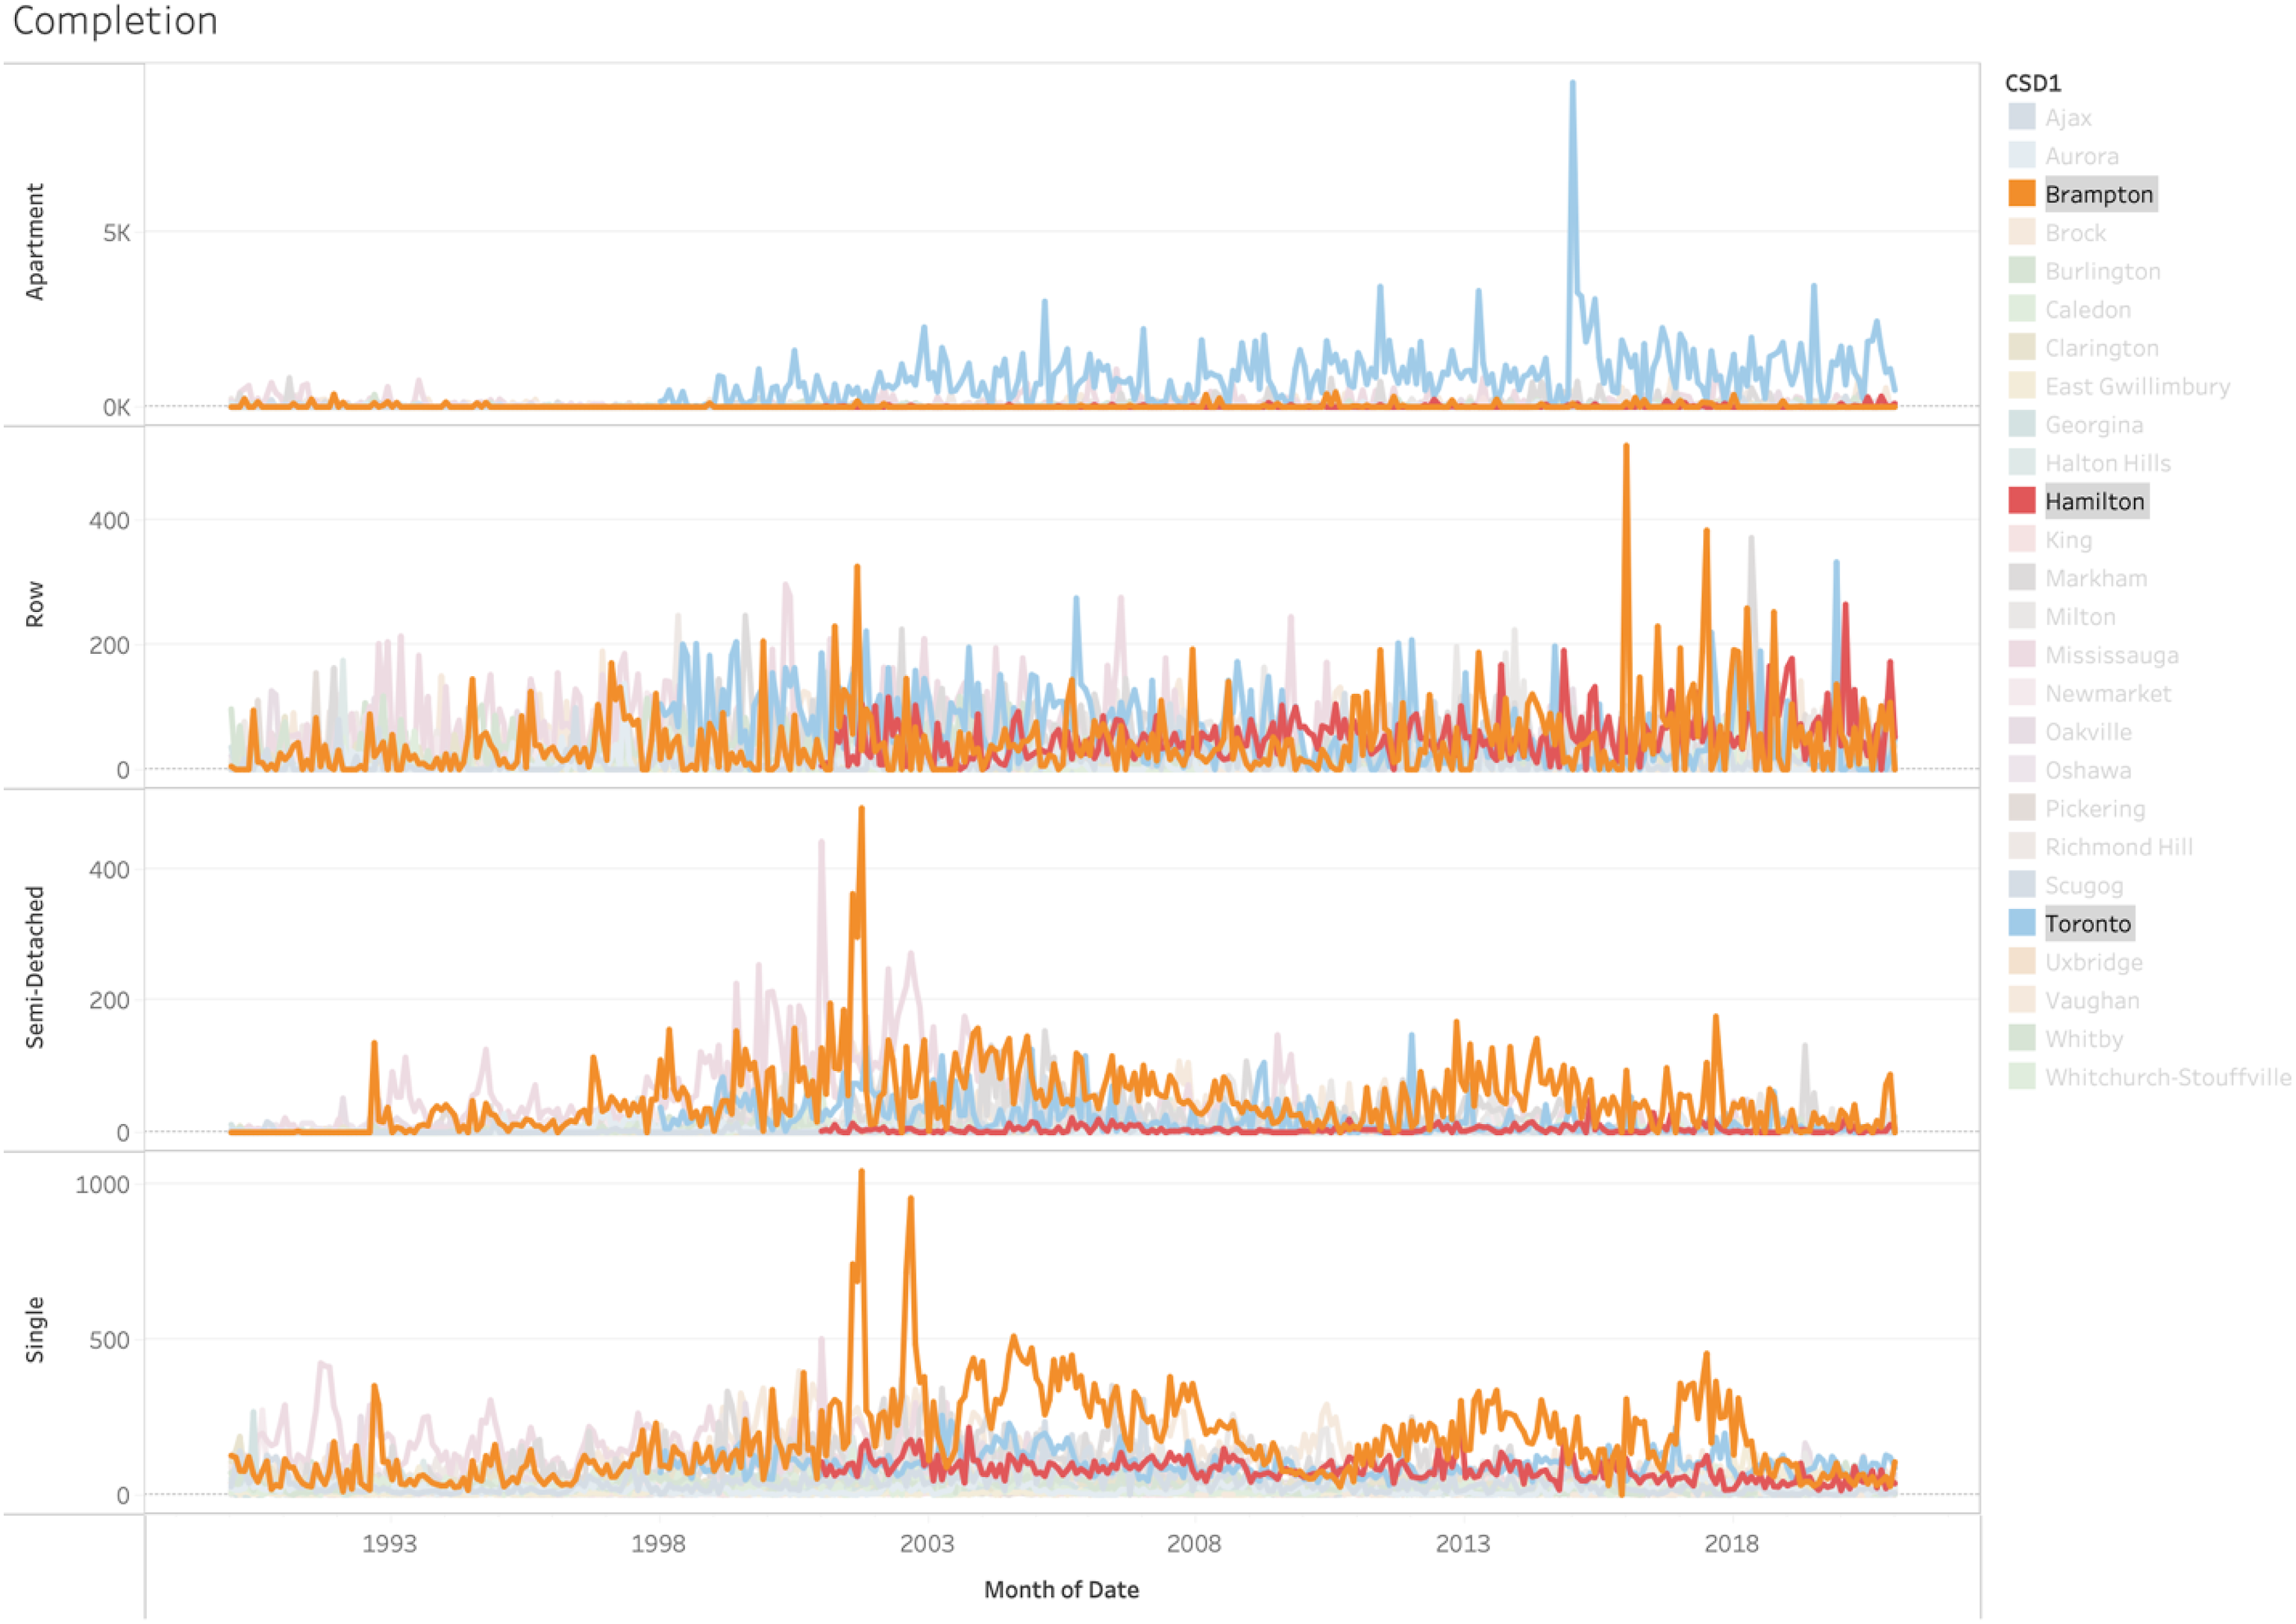
Data
The individual project-level building permits datasets for Toronto, Hamilton, and Brampton were collected to conduct the analysis. The construction length in the entire GTHA is also collected from Canada Mortgage and Housing Corporation (CMHC), plotted in Figure 3. The average construction length closely follows a gamma distribution, which is consistent with Hammadi’s (2020) research on the housing supply in the City of Toronto. The yearly changes of the construction length indicate that the parameters might need to be adjusted over time for the CPH model, and that the construction length has been getting longer during the past decade. The distribution of construction time indicates that housing completion rate might well be estimated through a hazard model. Distribution of construction duration in the GTHA.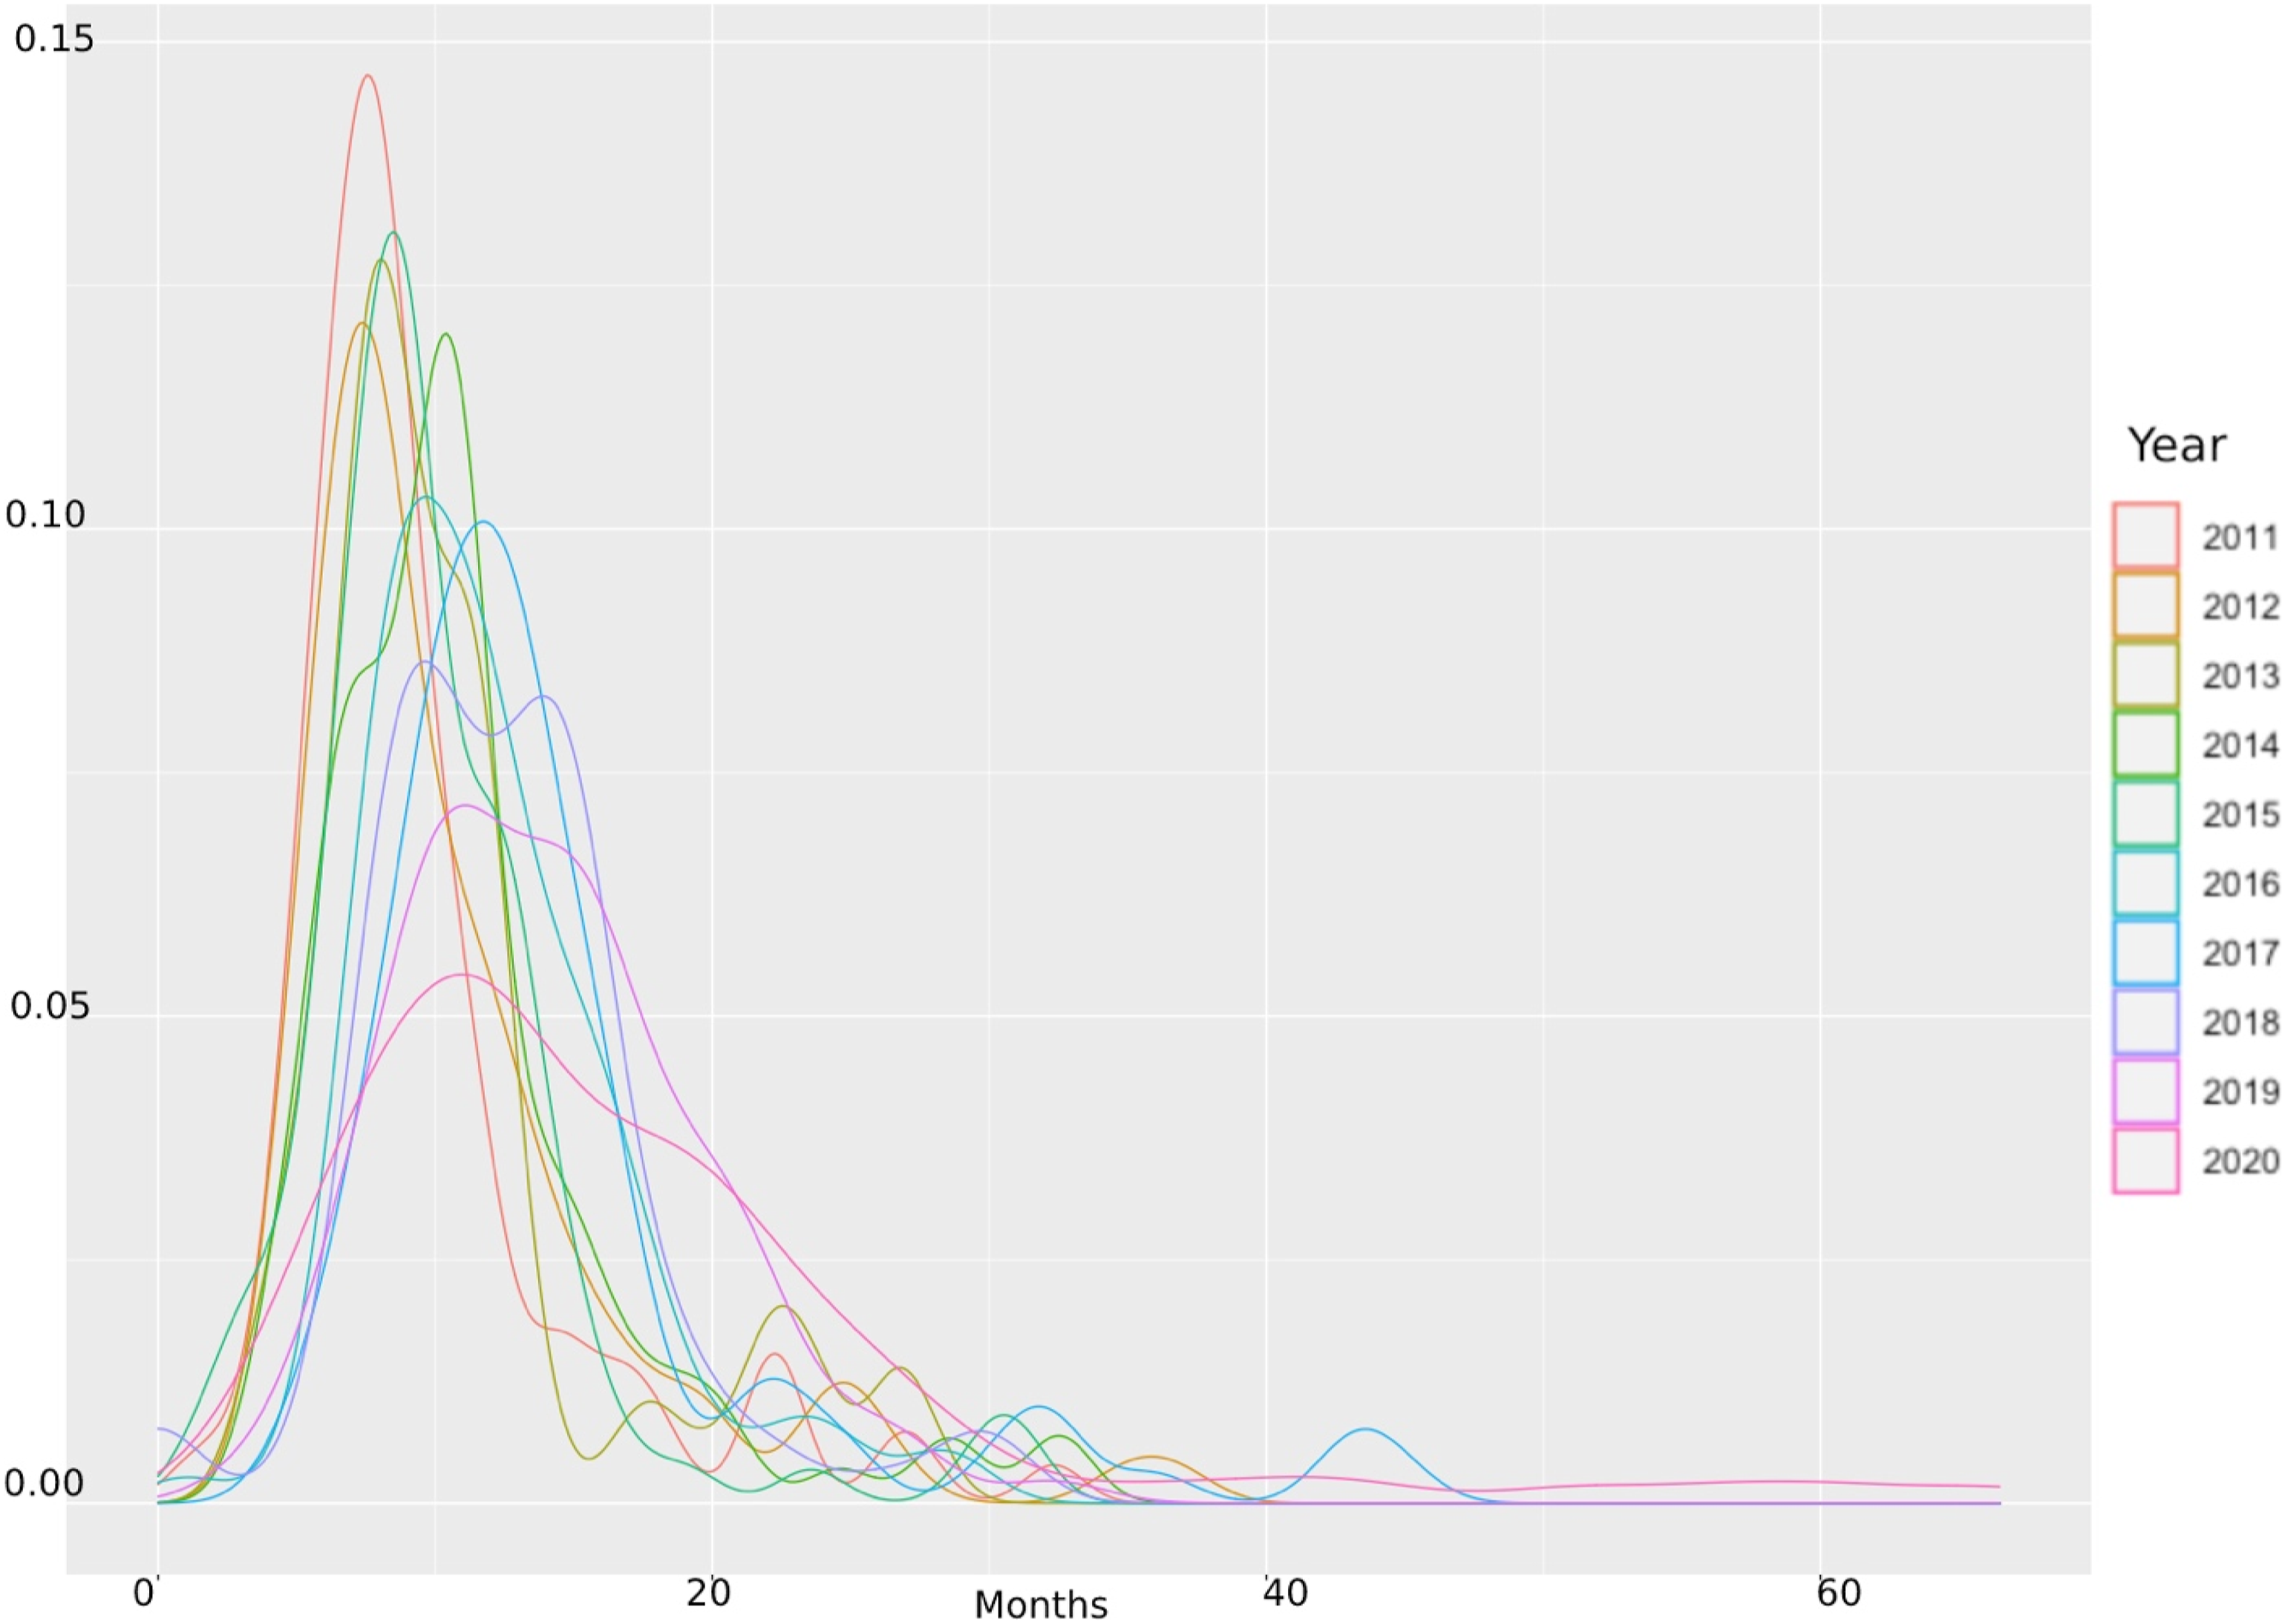
In this study, the censored 3 cases are defined as the issued building permits that have not been finished at the last observation period (the end of 2020), while the survival time of the projects are defined as the construction length, from the building permits issuance date through to the completion date. The time from application to issuance date, that is, the length of issuing the building permits by administration department, is not covered in the construction time of this study and would be assumed to be constant in the overall housing supply model system, since the length of issuance time is fairly short and has few variations compared to the construction duration. The construction length is computed in months, and the data from 2010 to 2020 for City of Toronto (35,583 records, with 23,180 projects completed and 12,403 under construction) and Brampton (20112 records, with 18,984 projects completed and 1128 under construction), 2008 to 2020 for Hamilton (15,756 records, with 13,473 projects completed and 2283 under construction), were collected from the urban building permits open database.
Variables affecting construction process and housing completion rate.
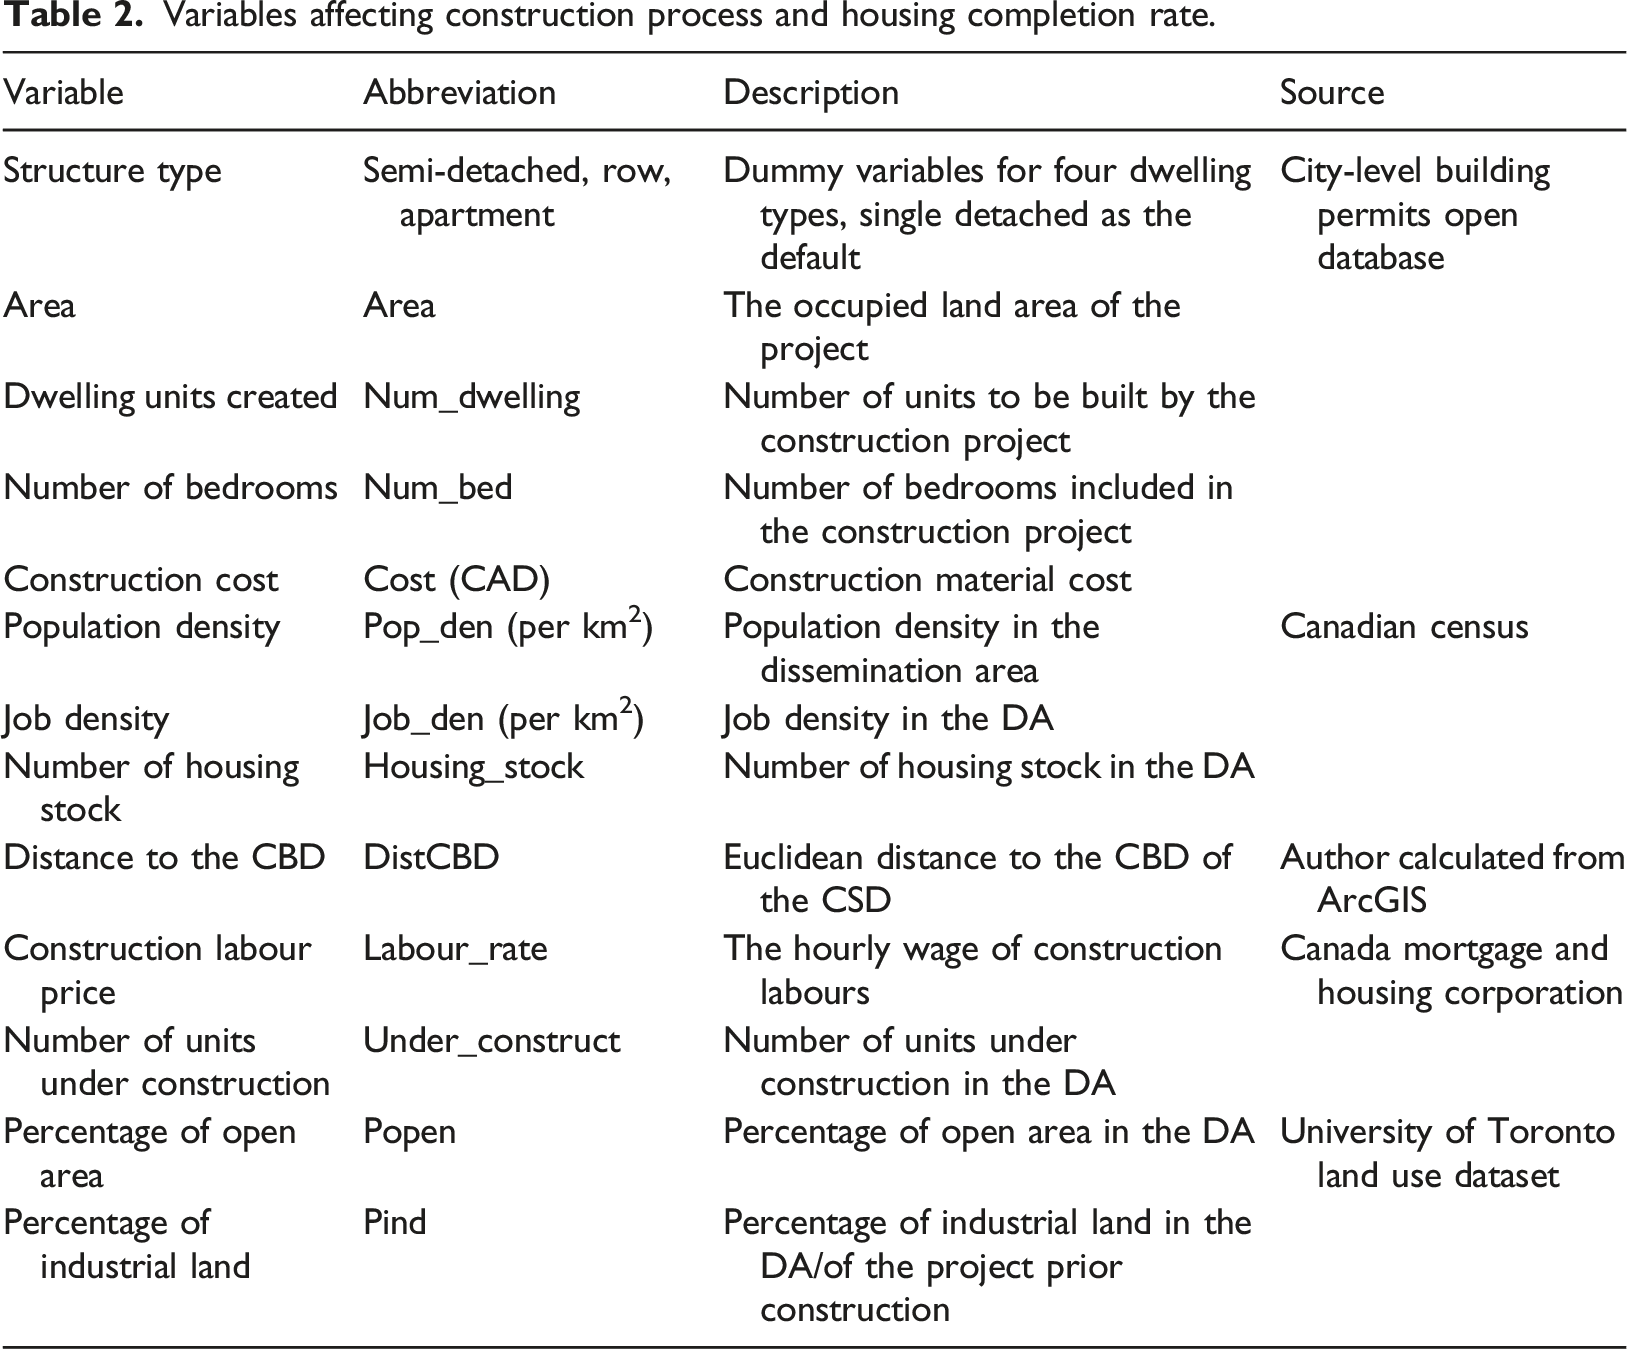
Results
In this section, the KM estimation applied to the samples in City of Toronto is first examined (results included in Supplementary File 1 due to limited space), with the log-rank test results being used to distinguish whether each factor is significantly impacting the construction duration, thereby providing a foundation for variable selection for the CPH model. Three diagnostic tests are then performed on the dataset to check if the model with variables selected could satisfy the assumption for the Cox Proportional Hazard model, with detailed diagnostic results in Supplementary File 2. Next, the CPH model results and application for Hamilton and Brampton are analyzed in detail, with prediction performances compared for the three different urban forms and dwelling types.
CPH model results for Toronto, Hamilton, and Brampton
CPH modelling result in Toronto.
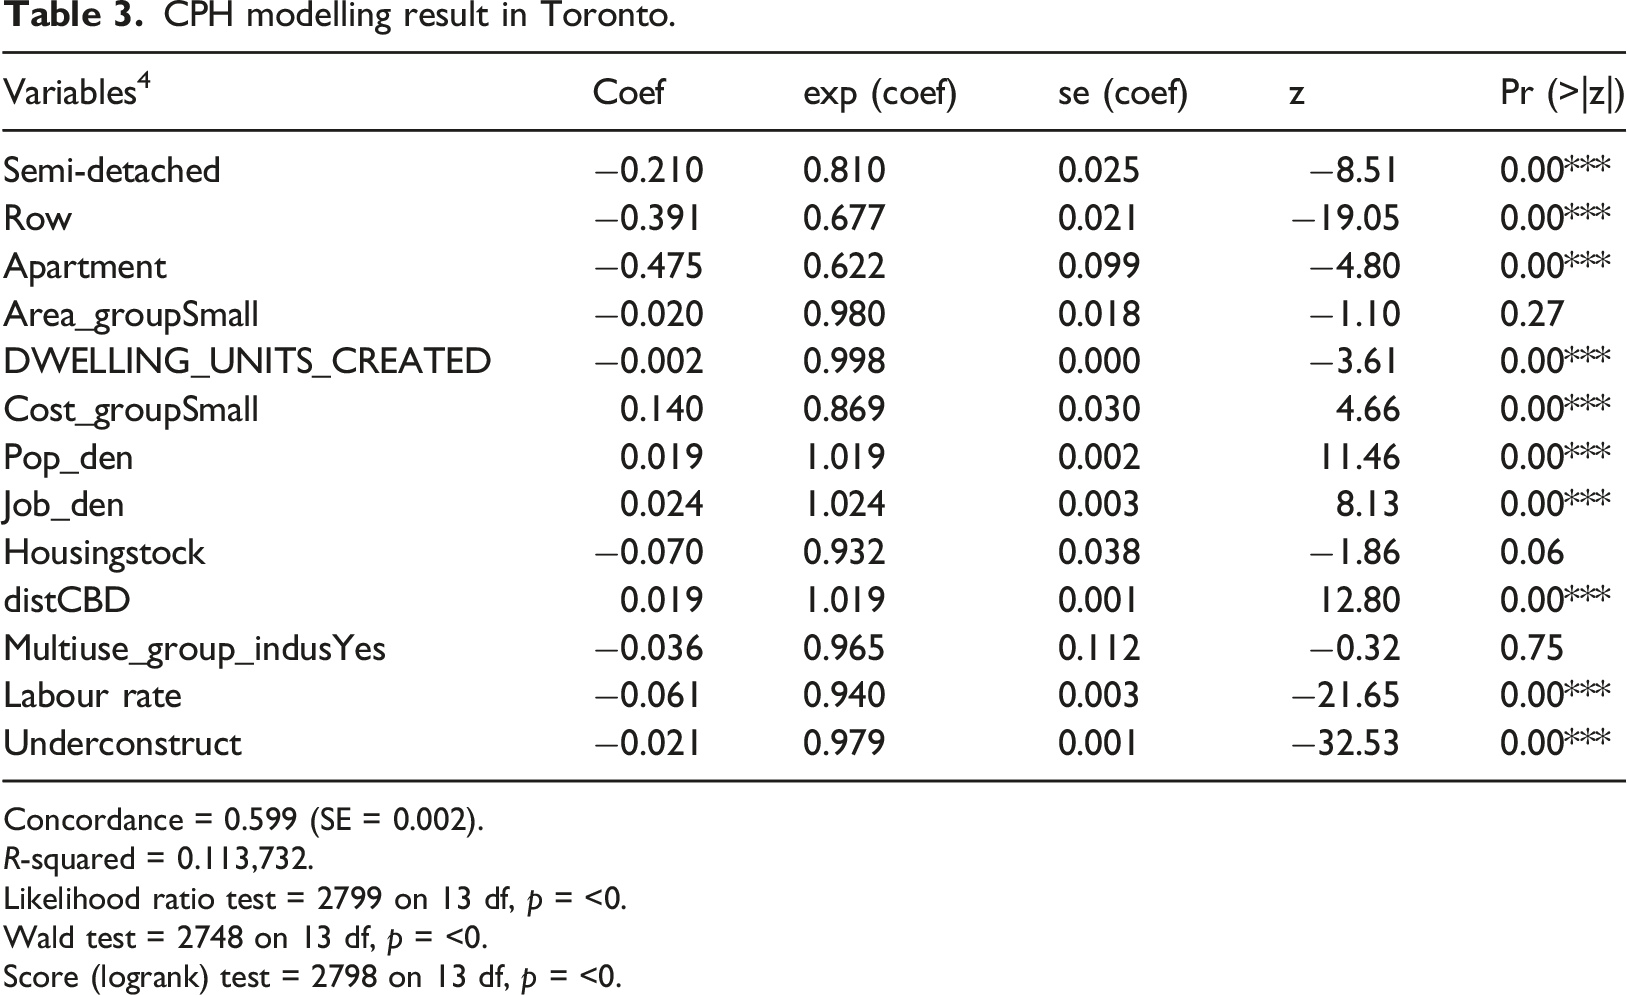
Concordance = 0.599 (SE = 0.002).
R-squared = 0.113,732.
Likelihood ratio test = 2799 on 13 df, p = <0.
Wald test = 2748 on 13 df, p = <0.
Score (logrank) test = 2798 on 13 df, p = <0.
The modelling results indicate that detached units with smaller project size, lower cost, locating far away from the CBD but with considerable population density, are more likely to complete faster. The p-value for dwelling units created is −0.002, with a hazard ratio HR or exp(coef) of 0.998, indicating a strong relationship between the size of the project and increased construction period (decreased risk of completion). The hazard ratios of covariates are interpretable as multiplicative effects on the hazard, or relative probability of hazard. For example, holding the other covariates constant, one unit of increase in the number of dwelling units decreases the completion by a factor of 0.998, or 0.2%. It could be concluded that larger project size is associated with lower completion rate. Similarly, the projects under 800,000 CAD increases the completion by a factor of 13.1%; a 1-km increase in the distance to the CBD increases the completion by 1.9%; a one percent increase in the labour rate could decrease the completion by a factor of 0.94; and a one unit of increase in the number of dwelling units under construction at the same time decreases the completion by a factor of 0.979.
The Cox proportional model can be visualized through a forest plot (Supplementary Figure 5). It shows the hazard ratios which are derived from the model for all covariates. Briefly, an HR >1 indicates an increased risk of death (increased probability of completion), while an HR <1, on the other hand, indicates a decreased risk. For instance, as shown in the forest plot, holding other variables constant, semi-detached units have completion probability 0.81 times of the detached units, and row, apartments have 0.68 and 0.62 times of the detached units, indicating that detached units are more likely to complete faster.
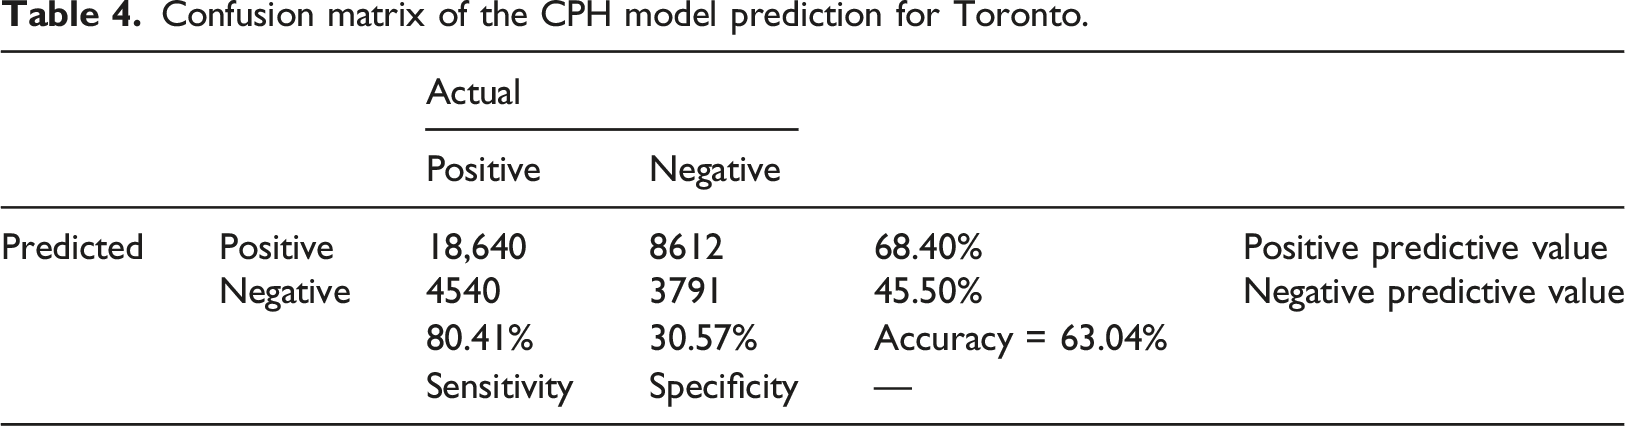
Confusion matrix of the CPH model prediction for Toronto.
As discussed in Section 5.2, some variables included in the model show non-proportional hazard in their coefficients in the CPH model; thus, it would be helpful to examine this issue in estimation of the additive hazard regression model as well, to allow for the variation in coefficients over time. Thus, we applied the Aalen’s additive hazard regression model to examine the changes of coefficients over time, as shown in Figure 4. The coefficient of the dummy variable for apartment shows a significant declining trend over time, indicating that as time passed, the projects of apartment compared to other projects would have stronger negative impact on the construction completion and would tend to experience even longer construction periods. Construction cost shows similar behaviour. Given that the changes coefficient estimates over time for most variables are slight, and given that the CPH model achieves reasonable prediction accuracy, it is still recommended to apply the CPH model for housing completion modelling in ILUTE-type applications. Variation of coefficients over time for the additive hazard model.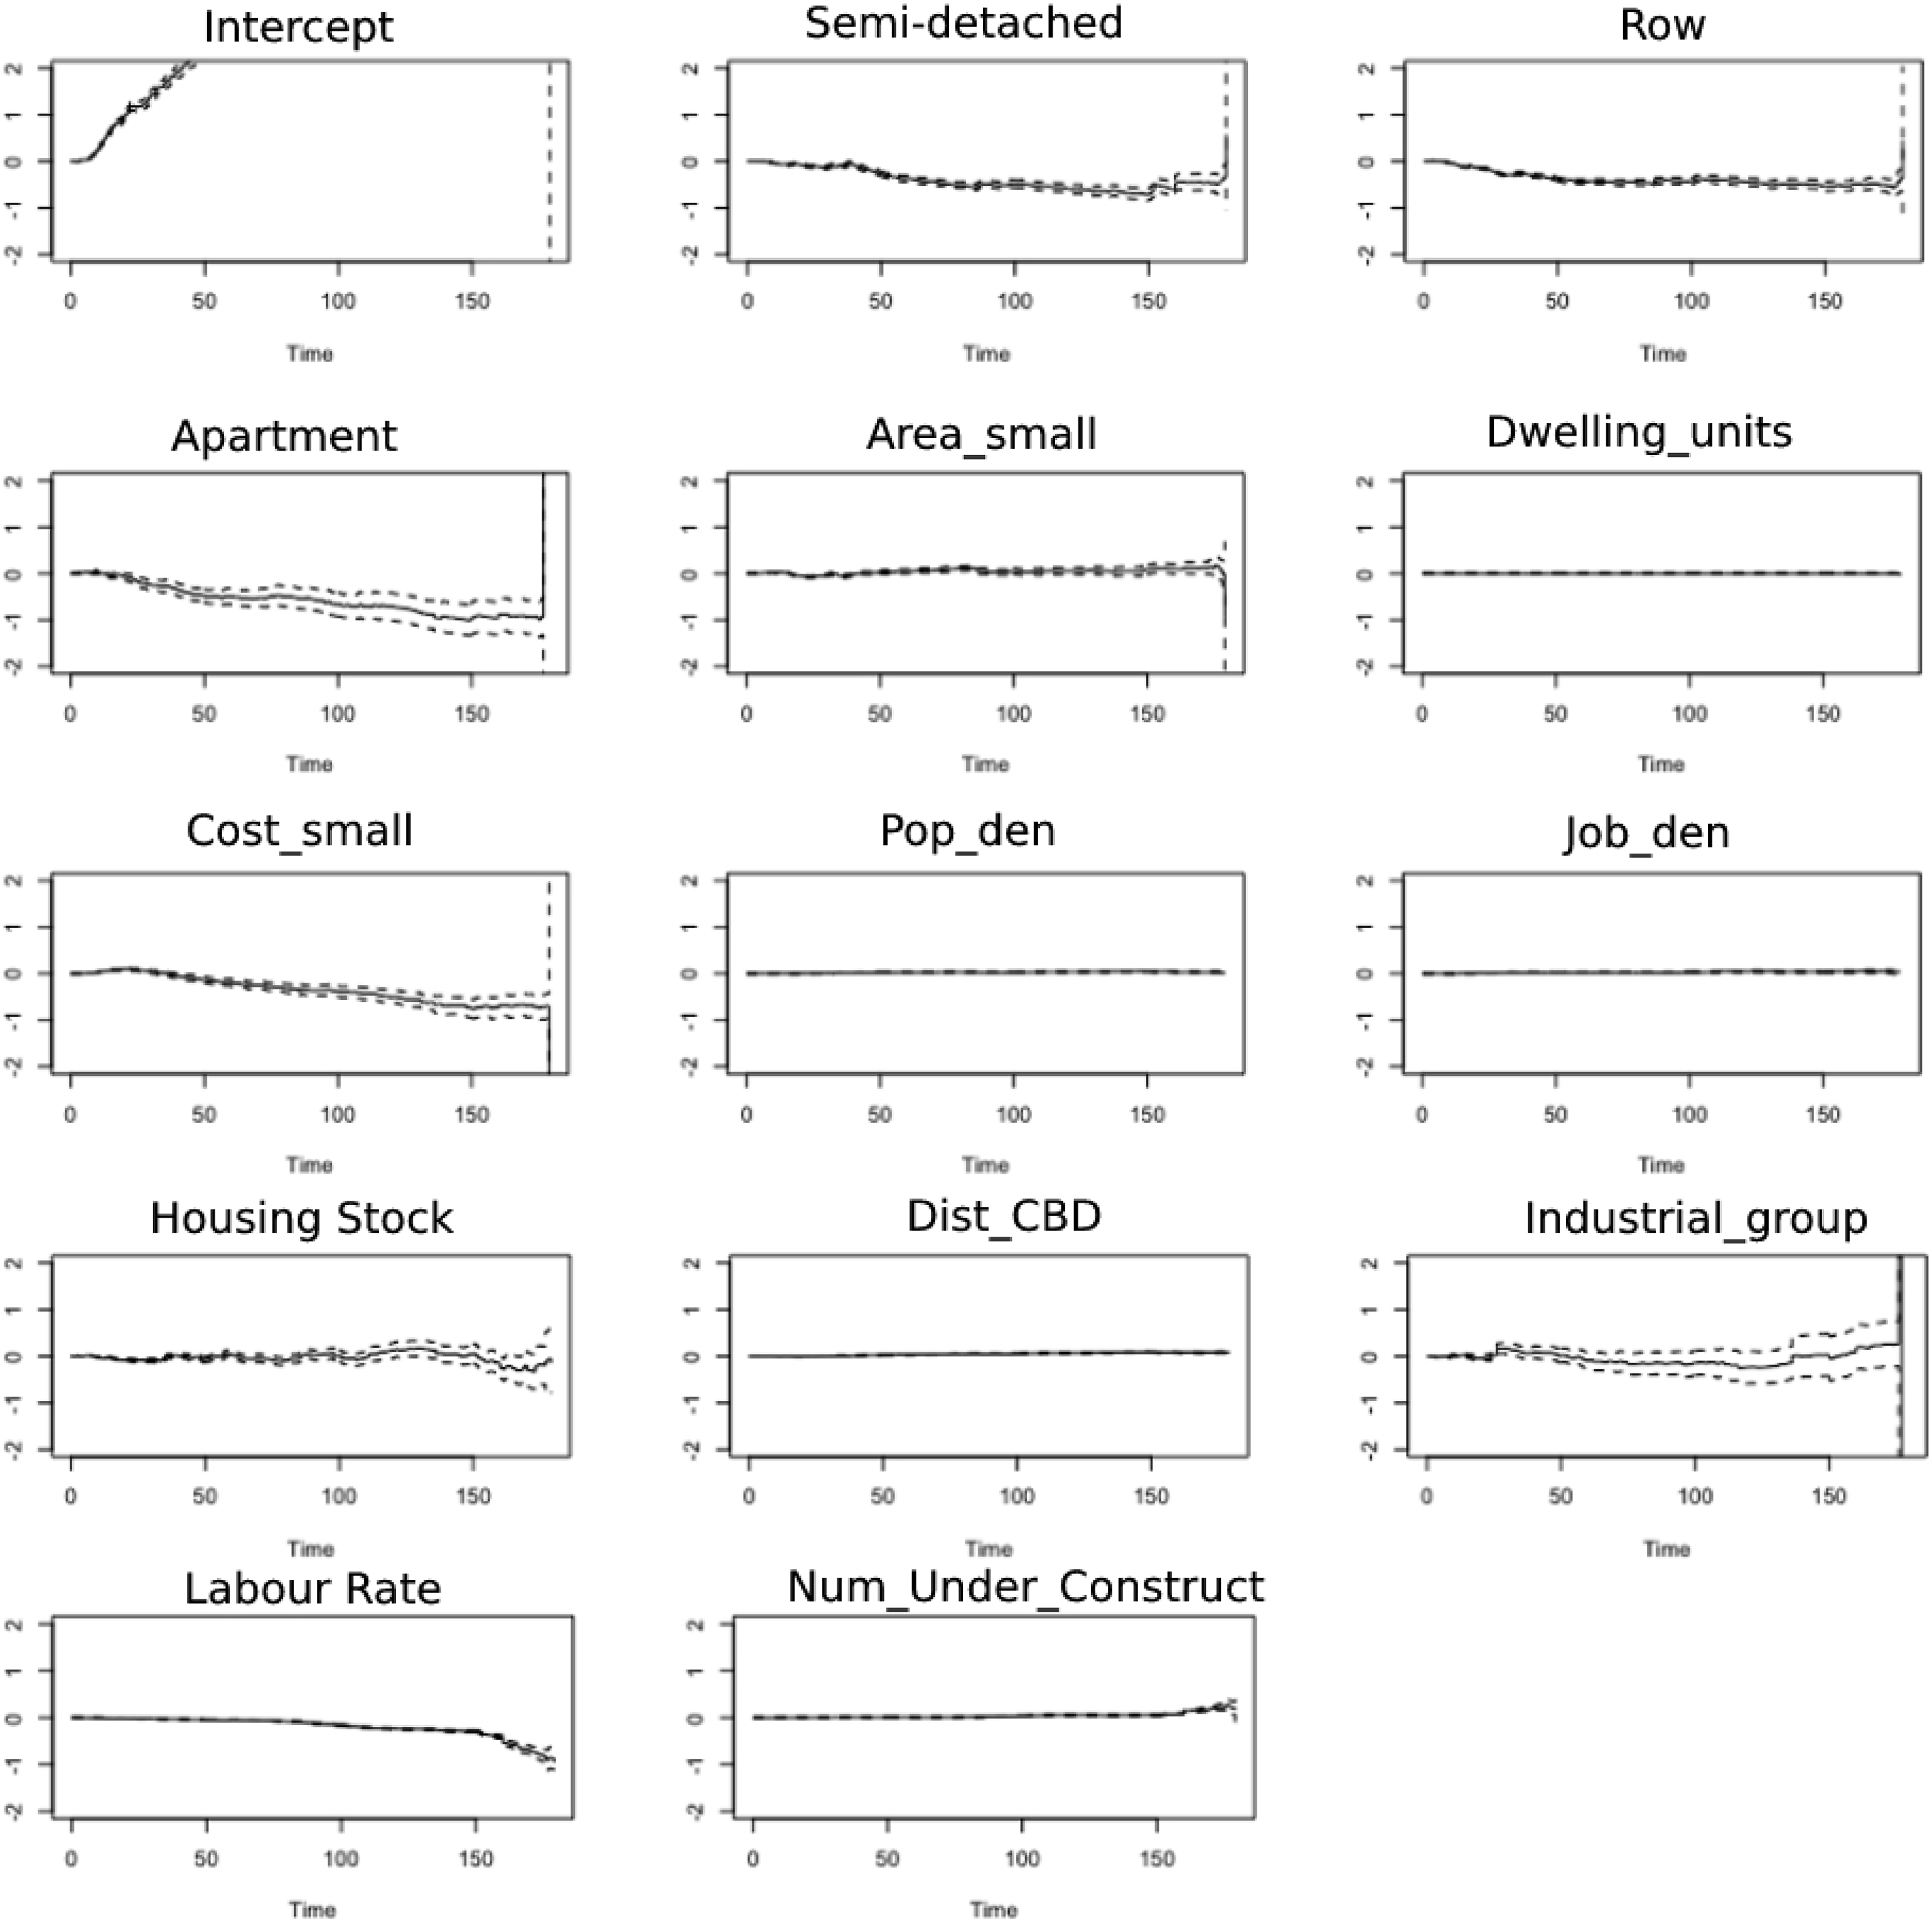
CPH model results in Hamilton.
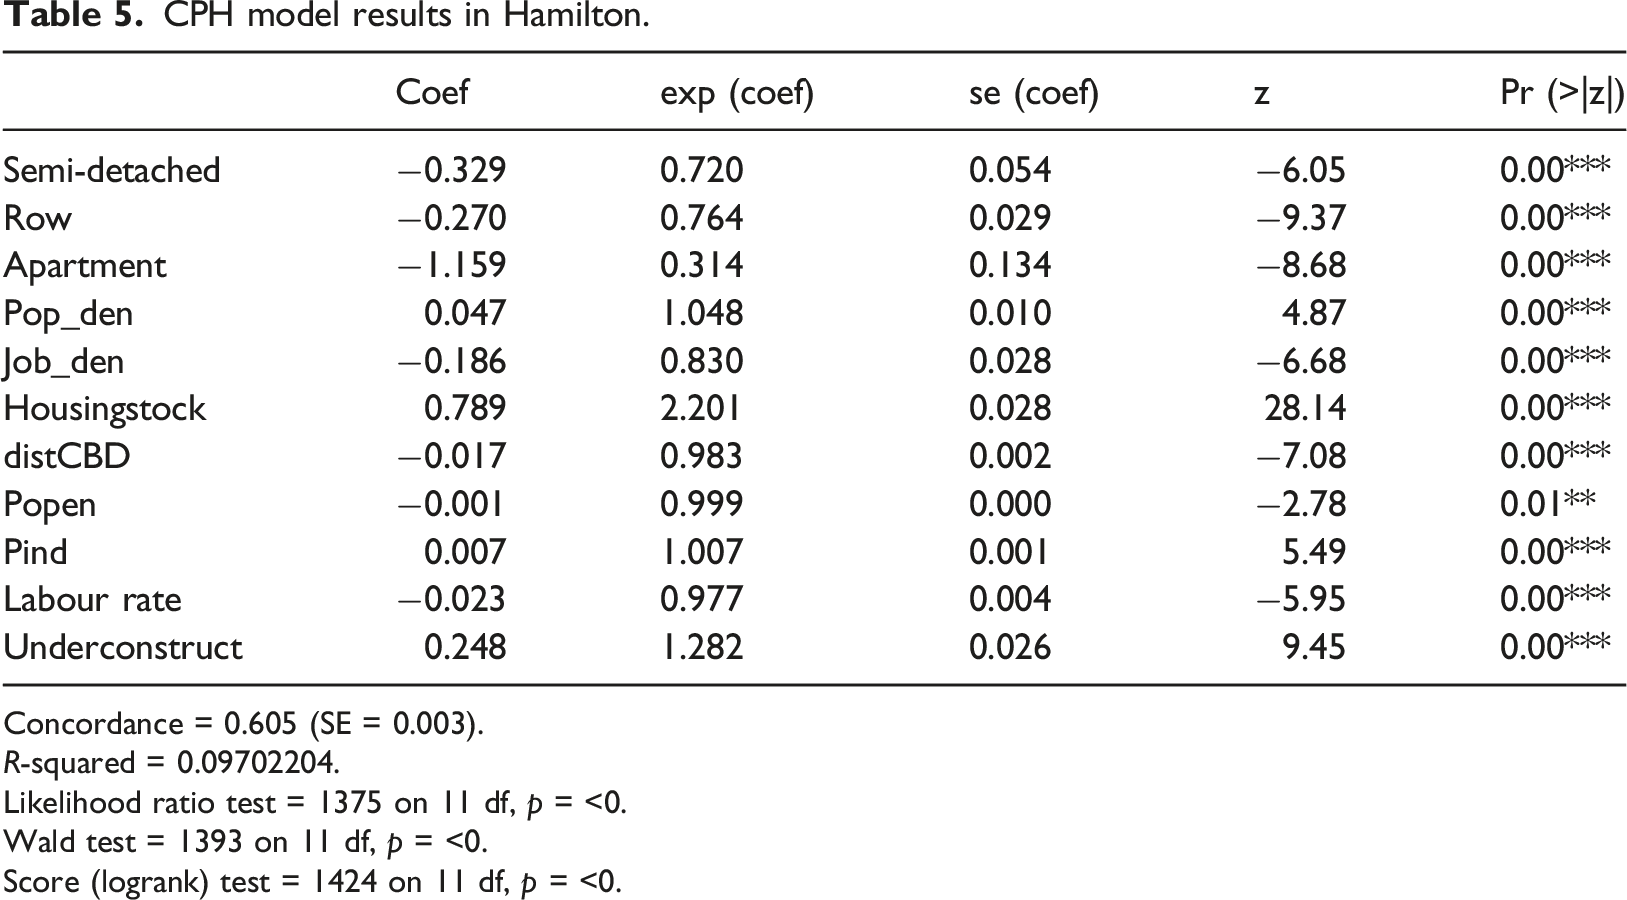
Concordance = 0.605 (SE = 0.003).
R-squared = 0.09702204.
Likelihood ratio test = 1375 on 11 df, p = <0.
Wald test = 1393 on 11 df, p = <0.
Score (logrank) test = 1424 on 11 df, p = <0.
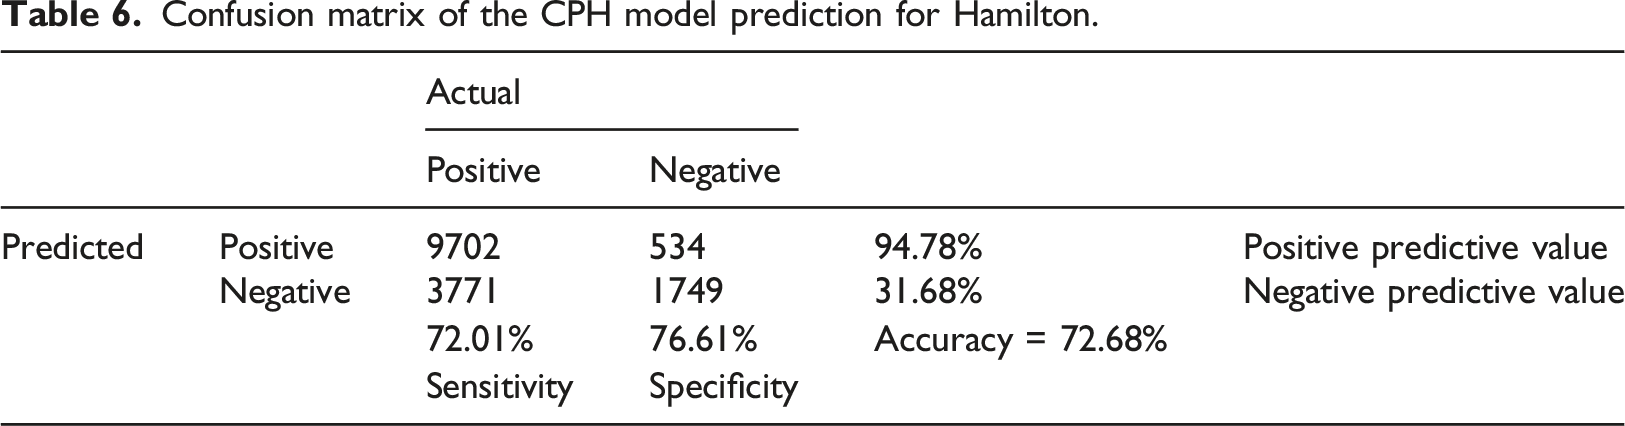
Confusion matrix of the CPH model prediction for Hamilton.
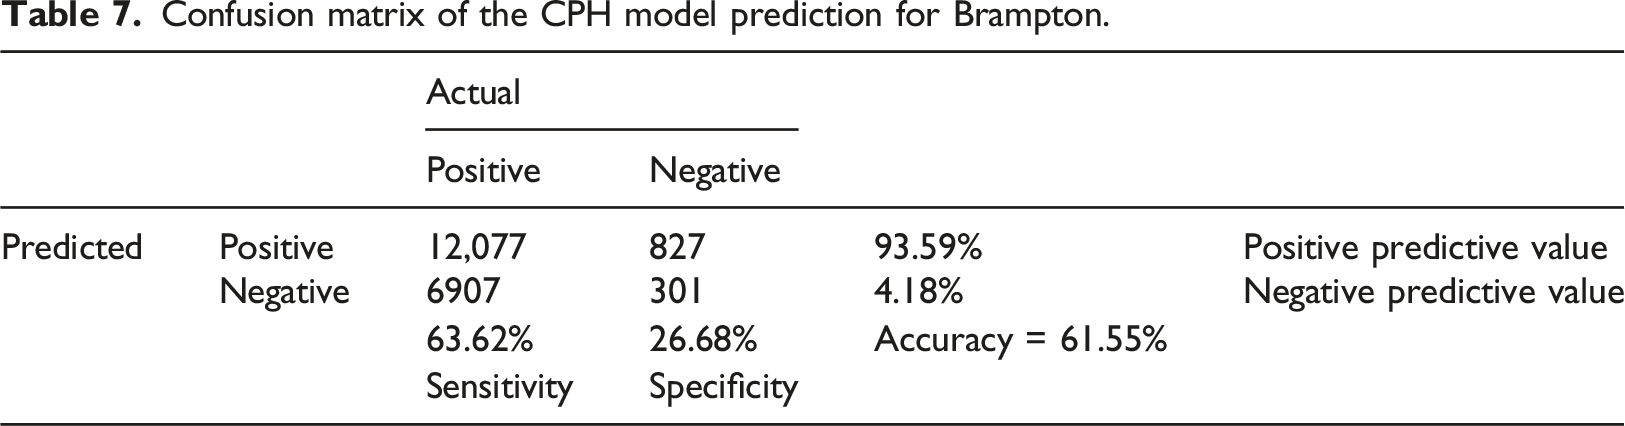
Confusion matrix of the CPH model prediction for Brampton.
CPH modelling result in Brampton.
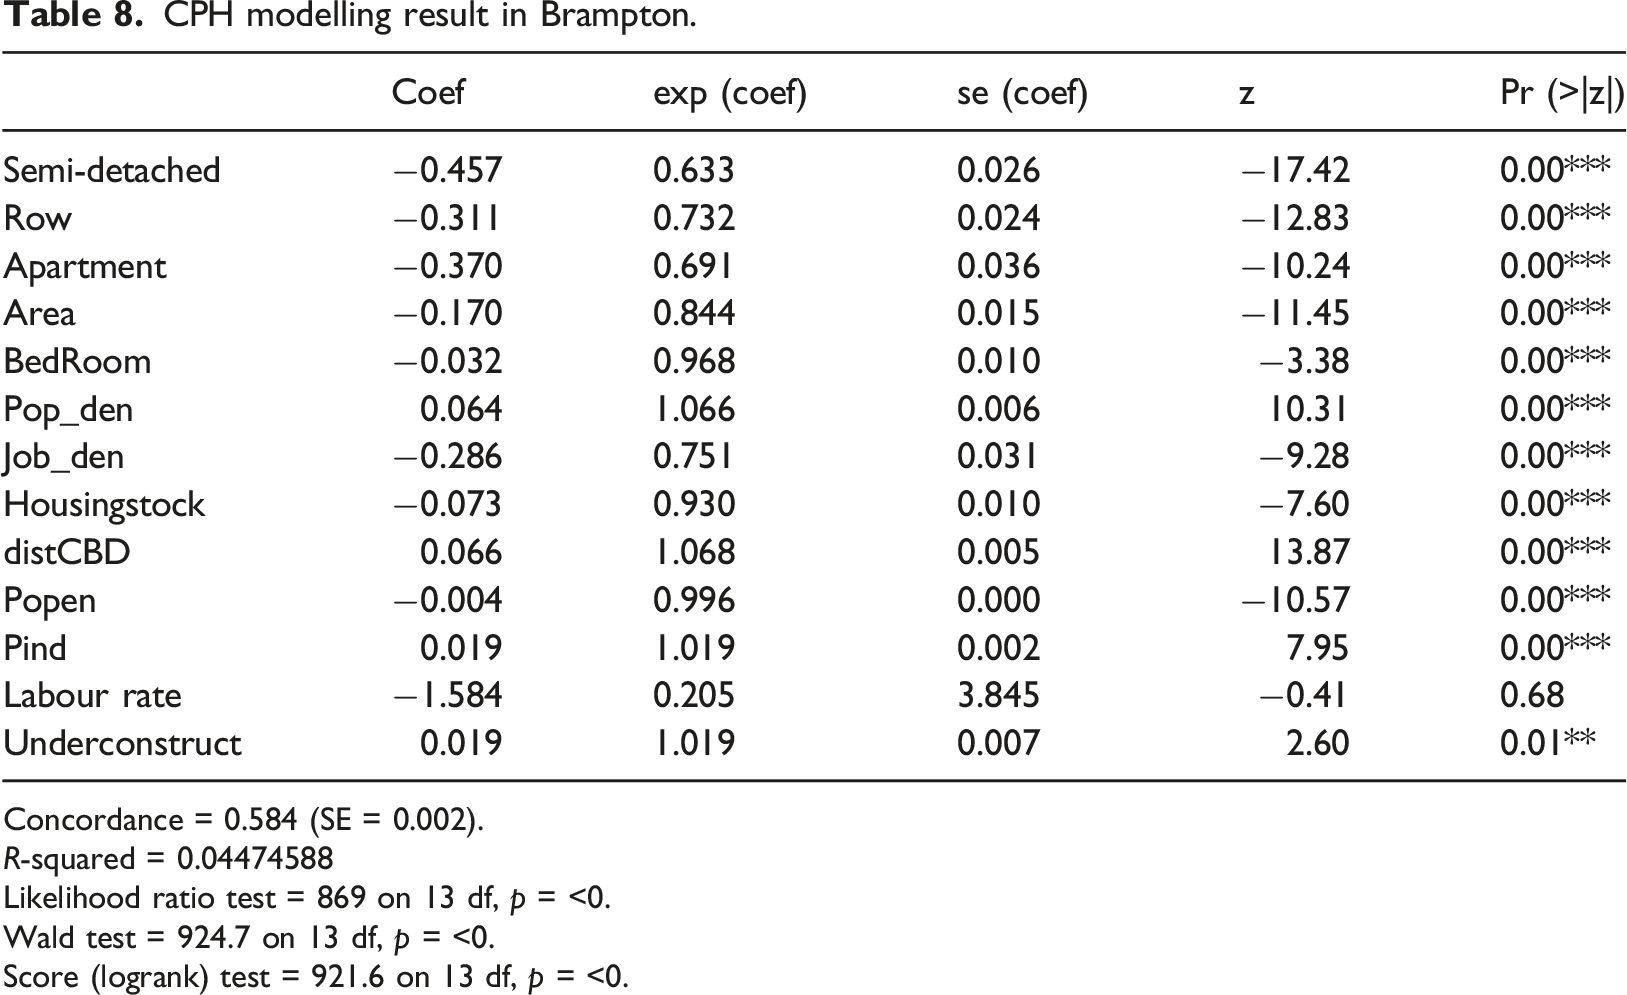
Concordance = 0.584 (SE = 0.002).
R-squared = 0.04474588
Likelihood ratio test = 869 on 13 df, p = <0.
Wald test = 924.7 on 13 df, p = <0.
Score (logrank) test = 921.6 on 13 df, p = <0.
CPH model results by dwelling types
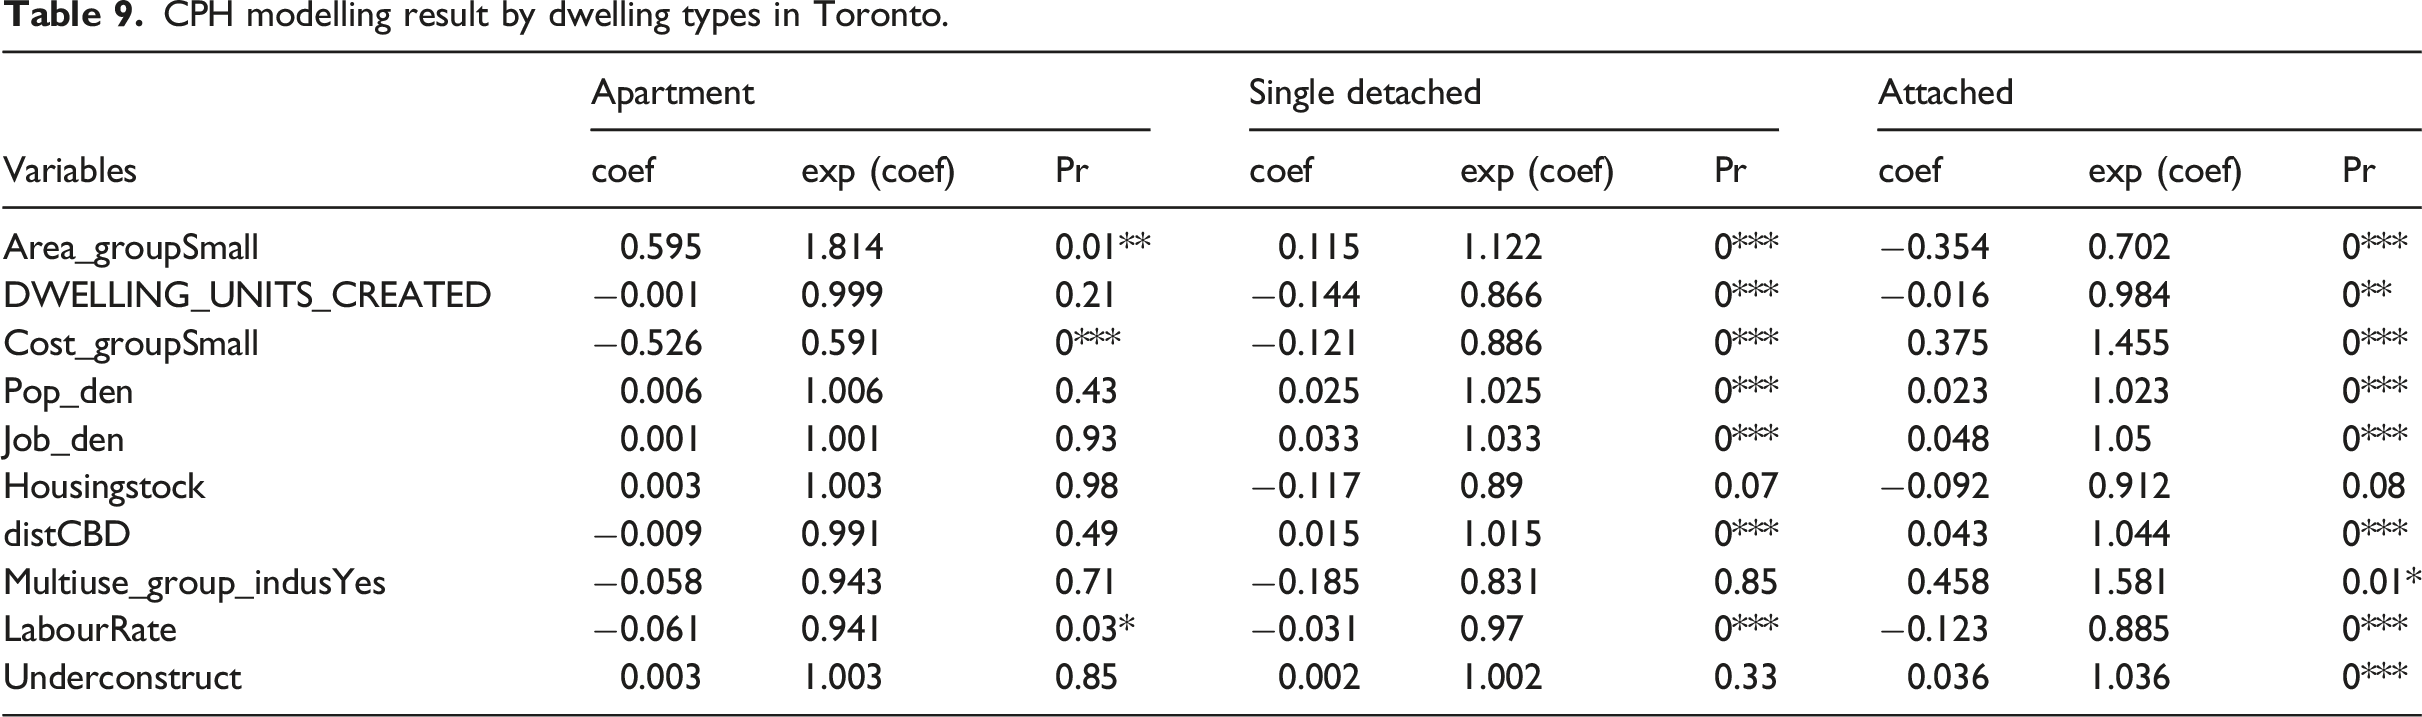
CPH modelling result by dwelling types in Toronto.
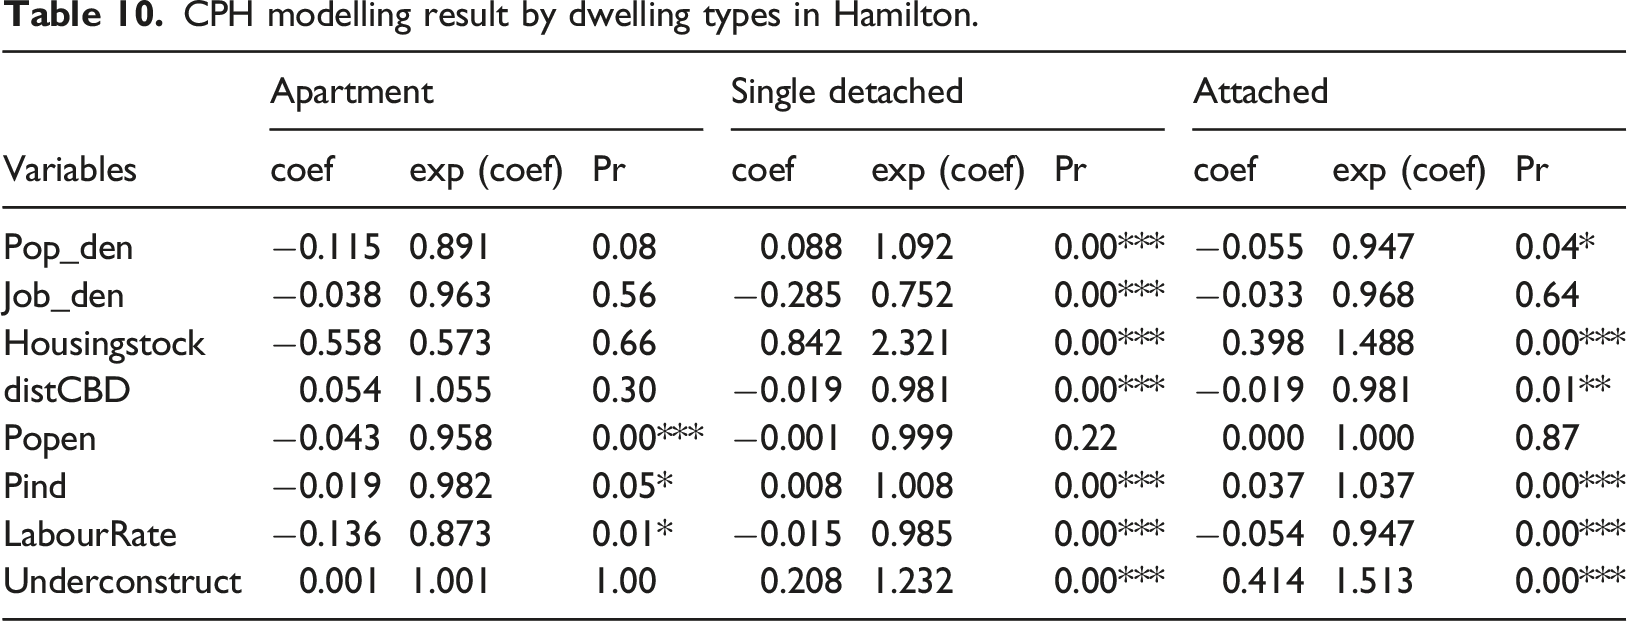
CPH modelling result by dwelling types in Hamilton.
CPH modelling result by dwelling types in Brampton.
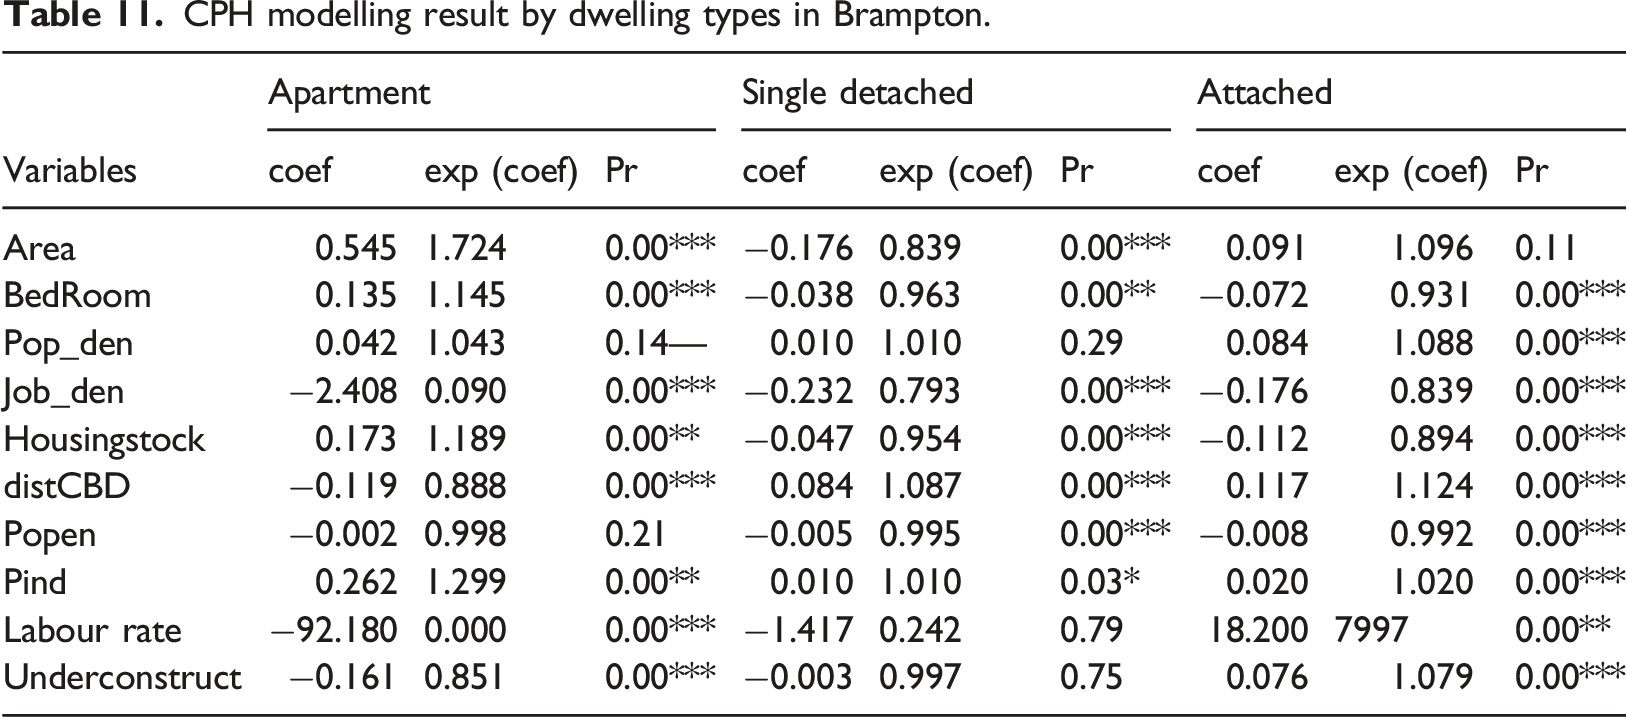
Apartment projects are more affected by the construction area, construction cost, previous land use of the construction site, and size of the project, while less influenced by location, and density. The apartment projects occupying small areas with higher cost have relatively higher probability to be completed. The CPH model for apartment projects performs better in Brampton than in Toronto and Hamilton, partly due to the heterogeneity of apartment building projects in the more developed cities which introduces more uncertainty.
Single detached projects are affected by all the factors. In general, for the three cities, single detached residential projects with smaller area, less bedrooms, less dwelling units created would take shorter times to complete. In terms of location, similar to the results of the full model, Brampton and Toronto have the same influential direction of the distance to the CBD and population density to the construction length, with projects that are far away from the CBD with considerable population density finishing more quickly than those locating near the city centre, while Hamilton has the exact opposite signs for these two variables.
Attached units are also affected by all the factors included. Different from the other two types, attached unit projects with larger occupied area, lower cost and locating far from the central area would finish more quickly.
Model performance evaluation
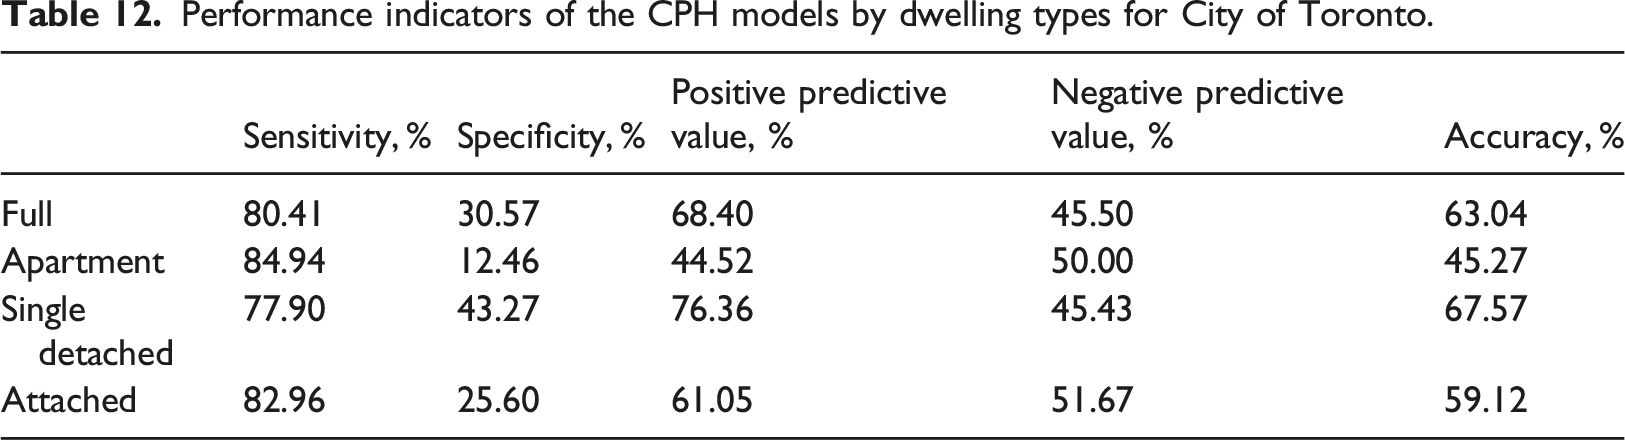
Performance indicators of the CPH models by dwelling types for City of Toronto.
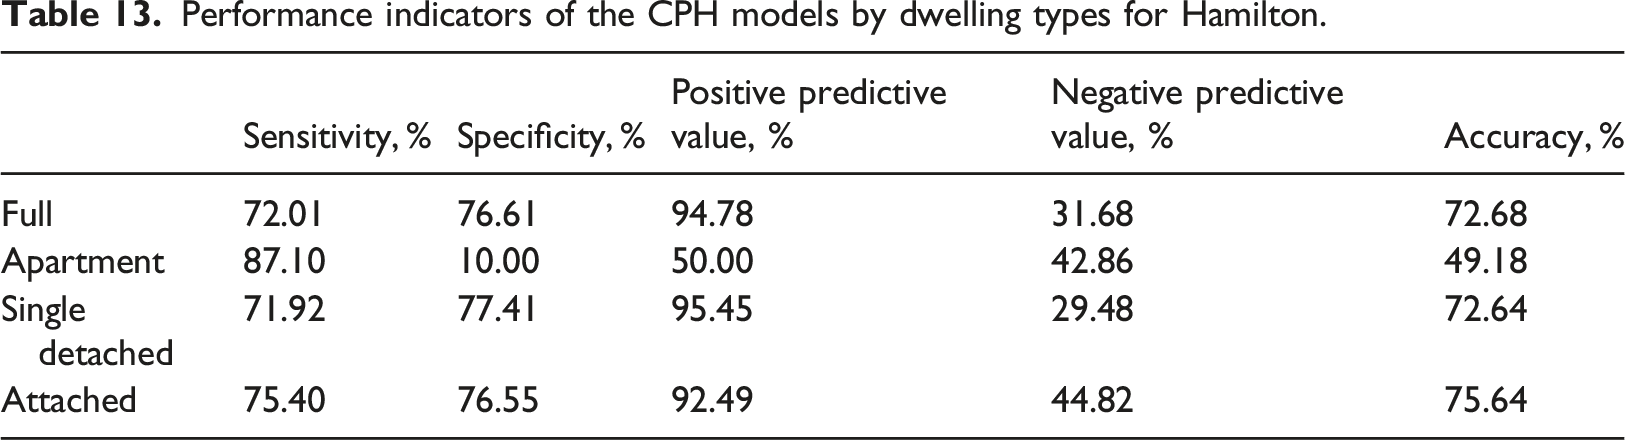
Performance indicators of the CPH models by dwelling types for Hamilton.
Performance indicators of the CPH models by dwelling types for Brampton.
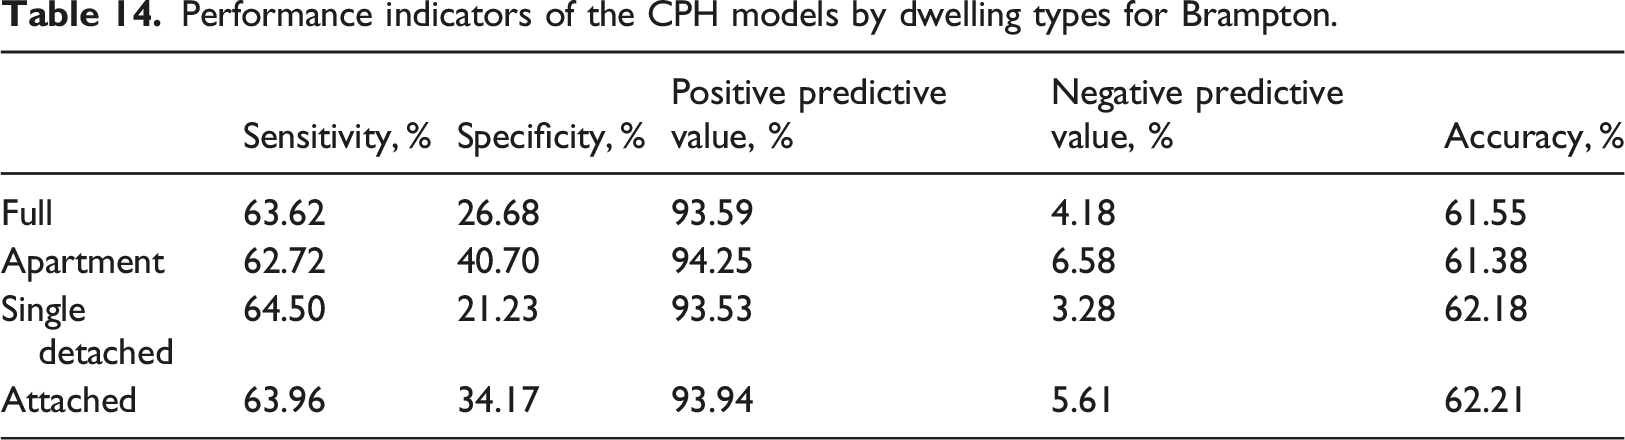
The CPH model for Hamilton achieves an accuracy of around 75% for single detached and attached projects (Table 13 and Supplementary Figure 7). However, the model did not perform well in specificity (the percentage of correctly identified actual negative cases in all the actual negative cases) for apartments and the negative predictive value (the percentage of correctly identified actual negative cases in all the predicted negative cases) for single detached units. The KM estimates generate very similar survival plots compared to the CPH model, which could indicate that the CPH model did well in fitting the sample. For Brampton, the model shows similar prediction performance (Table 14 and Supplementary Figure 8), and has the tendency to overpredict the number of completed cases, which should require adjustment when applied in an operational housing supply modelling system.
Conclusion and discussion
Previous urban models typically contain an oversimplified representation of the housing supply market; however, a realistic urban microsimulation system requires a more refined level of representation for the land development and housing provision process. The housing supply process has two major stages: start and completions. This study focuses on modelling housing construction durations within the context of eventually modelling housing supply in the ILUTE urban microsimulation system. This study contributes both to the literature of urban modelling and housing market modelling, as future urban microsimulation models can structure the housing supply side as indicated in this paper, and future studies in residential supply market can further investigate the stochastic property of residential construction. Applying the Cox Proportional Hazard Model, this study develops a modelling framework for housing completion, and provides a new approach to modelling the supply side of housing markets, which provides both methodological and theoretical insights for urban planners and modellers.
The CPH model presented in this paper achieves reasonable prediction accuracy in the empirical studies. The prediction cannot be compared directly with the other examples in the literature; however, the study provides a new and effective way to model the residential construction duration and the housing completion. Though having some issue in overpredicting completions, the model could accurately predict around 90% of the completions and reaches an overall accuracy of around 65% for the three case study cities examined, which is much better than the KM estimation (see the KM estimation in Supplementary File 3). The prediction performances differ for the three cities due to the differences in level of complexity of the residential construction process and housing market. In general, homogeneous real estate markets (such as Hamilton) have less uncertainty and are more predictable. In addition, structure type, size of the project, construction cost, labour cost and the previous land use of the land parcel, location, and density, are found to significantly affect construction durations. This influence was found to be stable over time for most variables, however, non-proportional hazard still exists for some variables and additive hazard regression could be applied as a complement to inspect for non-proportional effects within the main model.
Dwelling type is found to have a fundamental effect on construction duration and separate models for different dwelling types are recommended. Apartment projects in this model are not predicted as well as other dwelling types, the modelling of which could involve more factors that might better capture real estate market fluctuations. Further research focussed on apartment building construction could help to update the apartment supply model. Empirical studies in the three different cities with different urban form also reveals that the model is applicable in different urban contexts, with adjustment in the parameters, but the overall modelling framework remains valid. Unfortunately, we do not have a uniform dataset in the entire GTHA at the time. Another limitation of the study is that weather condition and construction ability of contractors affect the construction duration, which are not included in the model due to limited data availability. Future work could explore further in additional factors and parameters to improve the transferability of the model.
Supplemental Material
Supplemental Material - Predicting housing construction period based on a cox proportional hazard model––an empirical study of housing completions in the greater Toronto and Hamilton area
Supplemental Material for Predicting housing construction period based on a cox proportional hazard model––an empirical study of housing completions in the greater Toronto and Hamilton area by Yu Zhang and Eric J Miller in Environment and Planning B: Urban Analytics and City Science
Footnotes
Declaration of conflicting interests
The author(s) declared no potential conflicts of interest with respect to the research, authorship, and/or publication of this article.
Funding
The author(s) received no financial support for the research, authorship, and/or publication of this article.
Supplemental Material
Supplemental material for this article is available online.
Notes
References
Supplementary Material
Please find the following supplemental material available below.
For Open Access articles published under a Creative Commons License, all supplemental material carries the same license as the article it is associated with.
For non-Open Access articles published, all supplemental material carries a non-exclusive license, and permission requests for re-use of supplemental material or any part of supplemental material shall be sent directly to the copyright owner as specified in the copyright notice associated with the article.