
Abstract
Anthropogenic stocks are increasingly seen as potential reserves for secondary resources, which has led to a rapid development in research of urban metabolic systems. With regard to buildings and their associated material stocks and flows, one of the most critical shortcomings in the state-of-the-art is the knowledge gap for drivers, dynamics, patterns and linkages that affect the urban metabolism. This paper is premised on the idea that urban planning stirs up these material flows, so it should also adopt their sustainable management on its agenda. It presents an approach that highlights the intertwined nature of changing urban morphology and building material stocks and flows in space and time. An analytical framework, based on the principles of material flow analysis, is provided for an integrated, spatiotemporal study of urban morphology and urban metabolism of buildings, using building and plot data as the input and identifying internal processes of the urban metabolism as the output. The identified processes include greenfield development, infill construction, building replacement and shrinkage, each of which can be expected to have tangible yet very different material and environmental consequences in the form of embodied materials and CO2. The use of the framework is demonstrated with a case study in the Finnish city of Vantaa in 2000–2018. The case study shows patterns pertaining to a growing city unrestricted by geographic or historic factors, manifested as vast greenfield developments and replacement of a notably young building stock. As sustainability may soon call into question both these strategies, uncovering the material consequences of a city’s past urban (re)development strategies lay the foundation for using the presented approach proactively in planning support, in pursuit of more circular economy-based and low carbon cities.
Introduction
An increased awareness of the significance of the vast amounts of materials and buildings stockpiled in urban areas have in the recent past led to a shift in urban research from growth to stock-centred approaches (Kohler et al., 2009; Lanau et al., 2019). Despite their seemingly static character, urban building stocks are dynamic, shaped by inflows of resources and materials, which are converted into buildings and eventually, into outflows of demolition waste. Analogically to processes in the human body, this process is called Urban Metabolism (UM; please see Supplemental Table S1 for an overview of all abbreviations in the paper). UM generally encompasses all physical, chemical and biological processes in which resources circulate in the urban environment (Newman, 1999). However, the current paper views UM exclusively from a land use, building stock and material perspective. These form, according to Simmonds et al. (2013), the slowest processes in the UM, and in developed settings, they are governed by urban planning.
Over the past years, UM research and the modelling of metabolic urban systems has steadily evolved (Athanassiadis et al., 2015; Beloin-Saint-Pierre et al., 2017; Li and Kwan, 2018; Zhang, 2013). Material Flow Analysis (MFA) is among the most widely spread approaches to material-based assessments of the dynamic behaviour of stocks, their inflows and outflows. Depending on a study’s purpose, MFA can be performed on various scales: substances, materials and even whole products (Brunner and Rechberger, 2003), such as, in the case of this paper, buildings. The purposes range from solely descriptive research of stocks and flows to assessments of their ecological footprint (Beloin-Saint-Pierre et al., 2017; Li and Kwan, 2018). Some studies tackle waste and resource management (Lanau et al., 2019) while others forecast future recycling streams (Augiseau and Barles, 2017). Buildings’ UM studies, too, commonly quantify certain bulk materials (Guo and Huang, 2019; Lanau et al., 2019) and their recycling potentials. According to the circular economy (CE) hierarchy, however, recycling of materials is among the least favourable sustainability strategies (e.g. Ellen MacArthur Foundation, 2015) as it can require high energy and virgin material inputs despite utilising secondary raw material. Addressing higher hierarchy levels, such as waste avoidance through continued use and reuse of buildings, would require focussing on the product level, which is presently rarely done (Huuhka and Kolkwitz, 2021).
The current paper is built on the premise that decisions made in urban planning essentially give rise to the stocks and flows pertaining to buildings by providing limits to permissible construction activities. Coupling MFA with Geographical Information Systems (GIS) (Augiseau and Barles, 2017; Guo and Huang, 2019; Lanau et al., 2019; Li and Kwan, 2018) and 4D-GIS, where time is the fourth dimension (Chen et al., 2016), has allowed studying longitudinal and geographical aspects of demolition, construction, buildings and material stocks. However, limitations in data availability have resulted in residential buildings (RBs) being researched much more thoroughly than non-residential buildings (NRBs) despite them being a significant part of a building stock (Lanau et al., 2019) and particularly pronounced in demolitions (Huuhka and Lahdensivu, 2016). What is more, there is a critical knowledge gap for drivers, dynamics, patterns and linkages that affect the UM (Athanassiadis et al., 2015; Göswein et al., 2019; Lanau et al., 2019; Li and Kwan, 2018). This is manifested in the limited amount of research that cover these themes (Beloin-Saint-Pierre et al., 2017) and the focus on primarily descriptive studies (Li and Kwan, 2018).
So, the purpose of the current paper is to present a methodological framework that allows to identify internal processes of UM pertaining to buildings. These processes result more or less directly from urban planning, as planning determines if and how buildings may be constructed; whether they must be preserved (for instance, on the grounds of historic value) or if they can be demolished; and if and how existing ones may be further developed and adapted. Such activities not only change a city’s urban morphology, but also bring about construction and demolition material flows. Consequently, the dynamics of a city’s building-UM can be uncovered by investigating the changes in its urban morphology. The goal of this paper is to showcase how applying the analytical framework can help to answer the main research question: How do changes in a city’s urban morphology translate in space and time to material stocks and flows pertaining to buildings through different change mechanisms (greenfield development, infill construction, building replacement, shrinkage)?
As the presented analysis is a study of the relations between construction, demolition and stock on a plot level, it allows studying the dependencies between these phenomena in different spatial scales to also answer the following subquestions: How do the building stocks and flows relate to one another? How much of a city’s building-UM can be associated to a specific urban morphology change mechanism? Where do these changes and flows occur geographically within a city?
The use of the framework is demonstrated with a retrospective case study in the Finnish city of Vantaa. The results of using the framework are expected to vary significantly from case to case due to the interdependence between UM and urban planning, socioeconomic, and many other context-specific factors. Therefore, the framework is presented with the premise that in the era of the climate emergency, urban planning must adopt sustainable management of material stocks and flows, with their embodied CO2 emissions and other environmental impacts, on its agenda, along with the discipline’s more traditional aims. Studying a city’s building-UM with the provided framework can identify the mechanisms of material turnover and help to prioritise planning measures that safeguard resources and embodied carbon. This means bridging the gap between MFA and urban analytics so that buildings’ UM can become an integral part of the steadily evolving science of planning support (cf. Geertman and Stillwell, 2020). It is also a part of the cross-disciplinary tendency in urban morphology that enables the study of increasingly complex phenomena (cf. Oliveira and Medeiros, 2016).
Research method and material
Research approach and framework
The paper at hand presents a replicable approach for studying the intertwinement of UM and changing urban morphology by applying the principles of MFA on construction of buildings (inflows), their demolition (outflows) and building stocks spatiotemporally (Figure 1). The presented framework relates closely to the Network (NE) approach (cf. Beloin-Saint-Pierre et al., 2017), which is characterised not only by disaggregated inputs and outputs but also by a description of links between the different components. The building stock development, based on the process definition given in Baccini and Brunner (2012, p. 96), can be described with the following equation Geocoded bottom-up data of construction (a), demolition (b), building stock (c), and plots (d) are combined to study how material stocks and flows pertaining to buildings result from changes in urban morphology (e), specifically greenfield development (f), infill construction (g), building replacement (h), and shrinkage (i).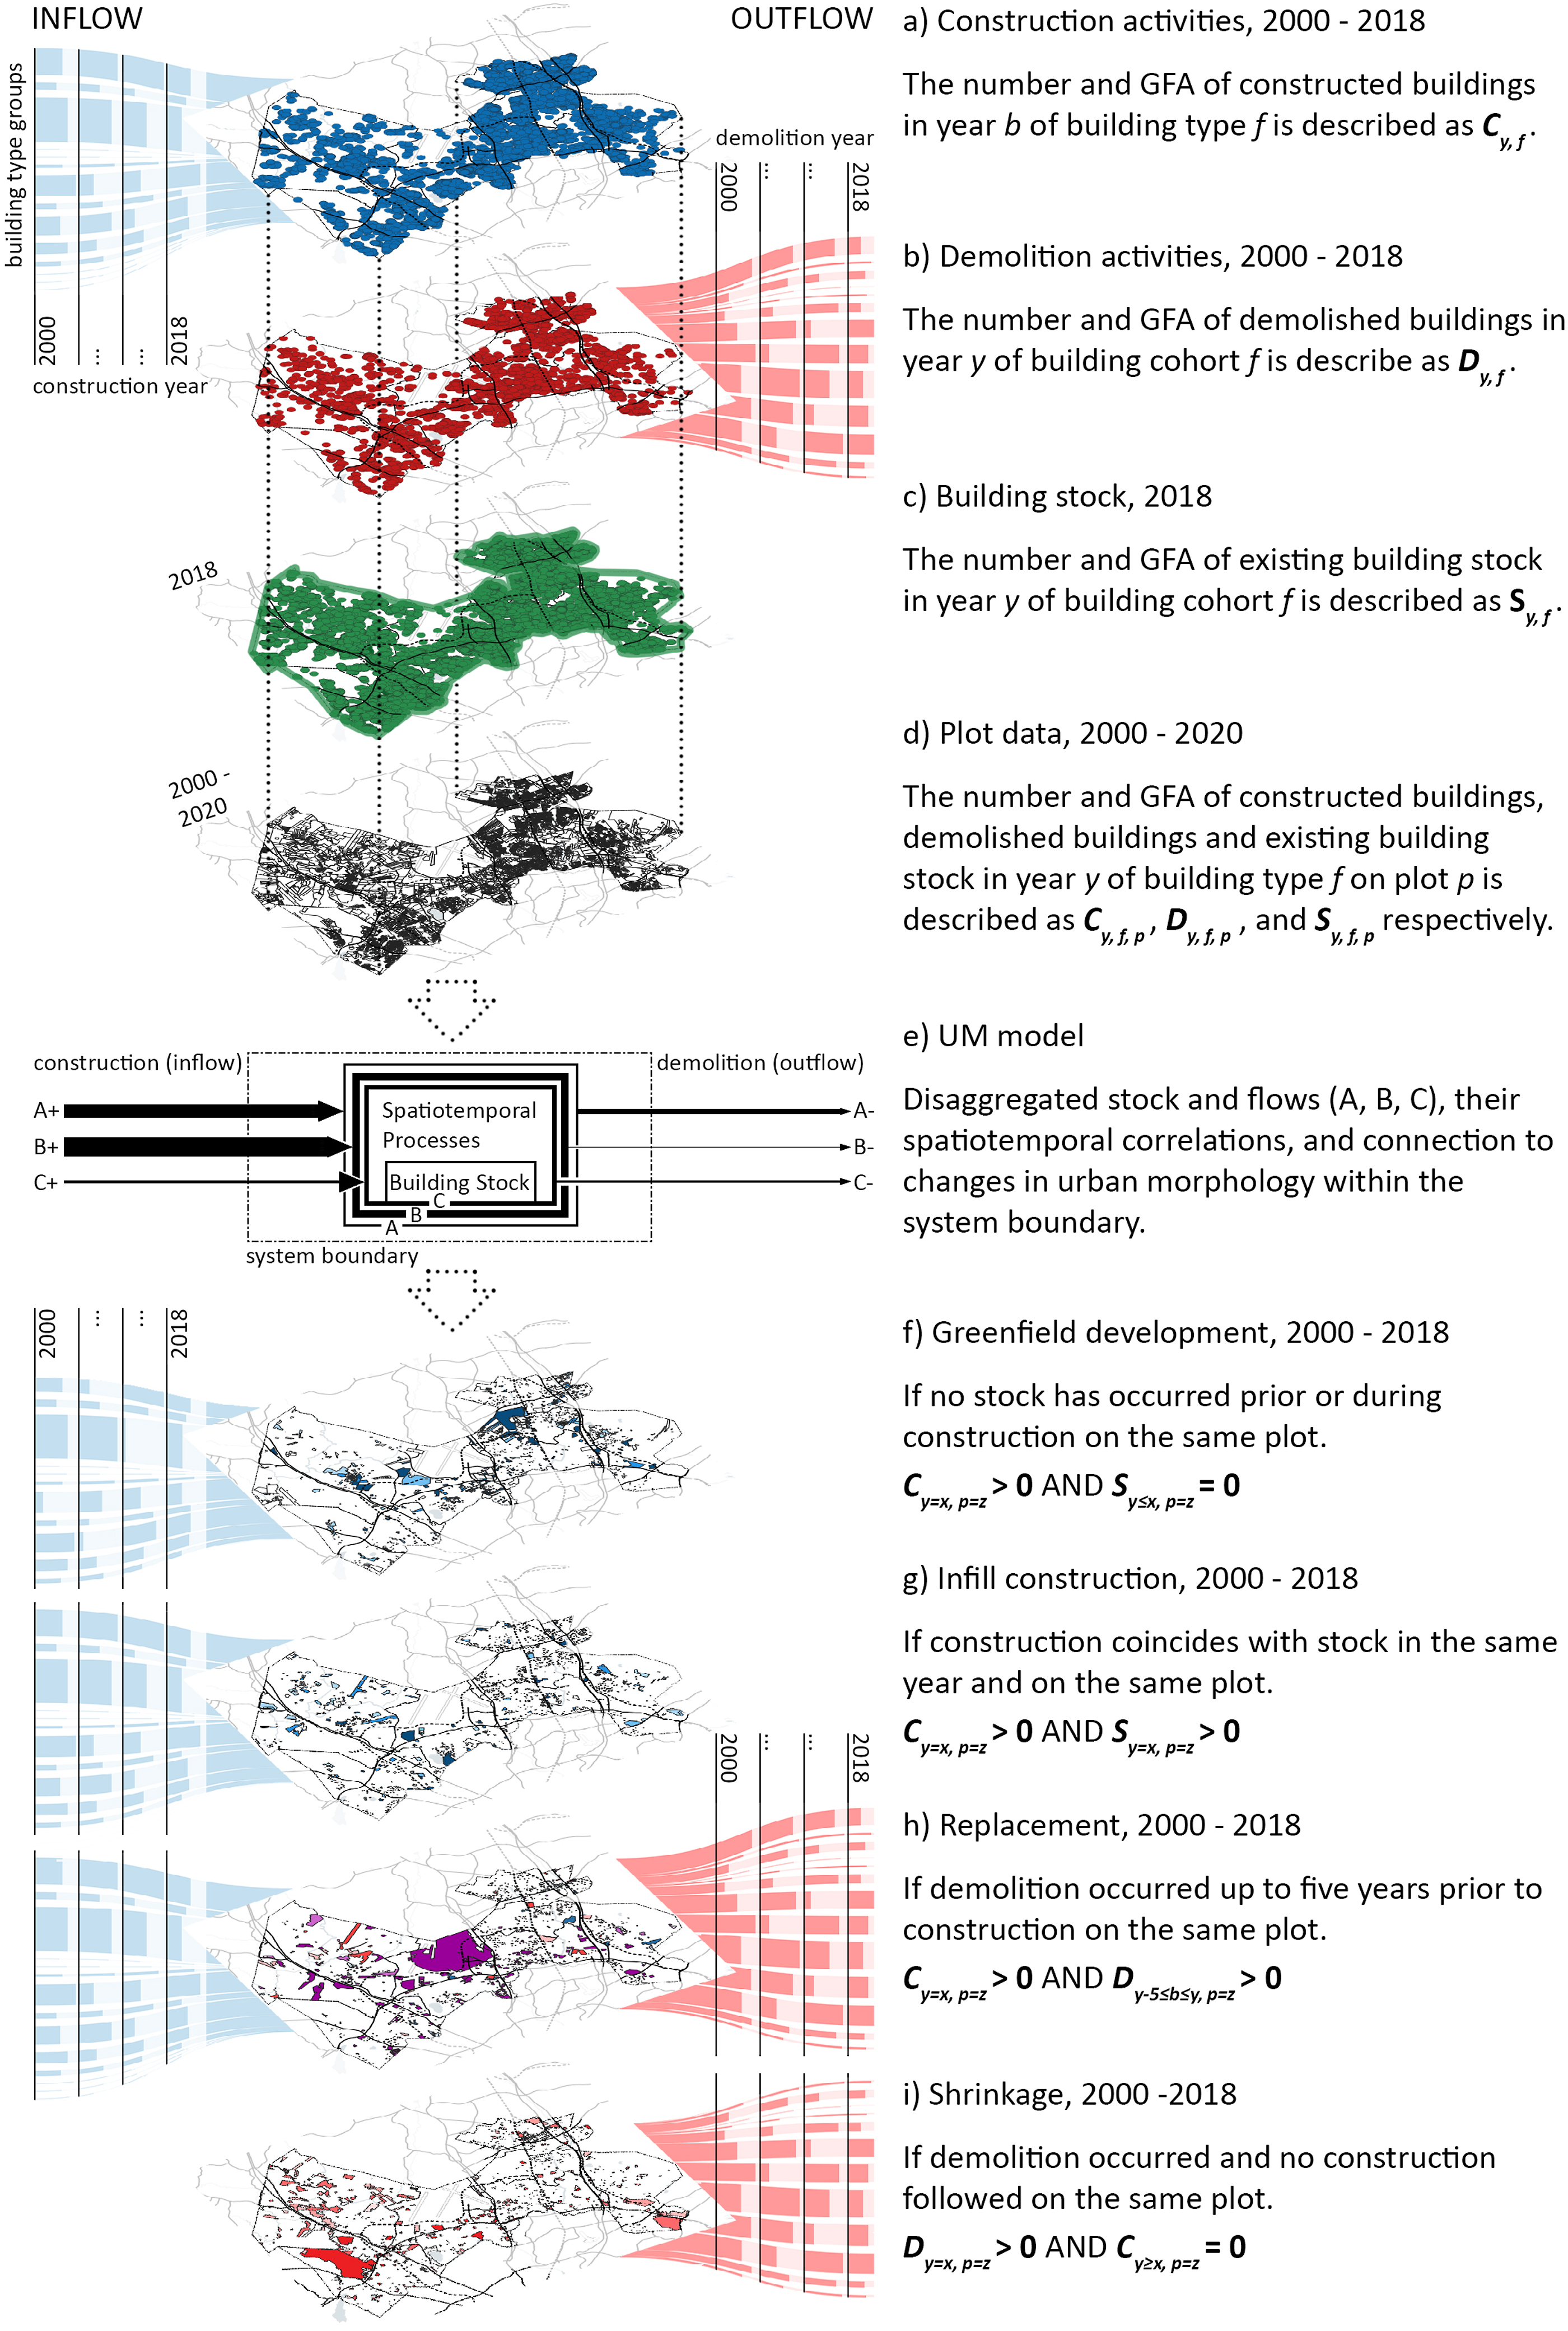

Given that locations of the buildings are known, the construction, demolition and stock can be placed on a map in 4D-GIS (Figure 1 a, b, c), with their respective plots (Figure 1 (d)). By looking at how they overlap, different types of changes in urban morphology can be identified that have differing material flow impacts. Such processes entail (1) greenfield development, which corresponds to exclusive material inflow; (2) infill construction, which results in material inflow but also retains already stockpiled materials; (3) building replacement (often known as urban renewal), which stirs up both outflows and inflows of materials; (4) shrinking areas, which are dominated by waste outflows. Greenfield development (Figure 1 (f)) can be recognised by identifying plots without any building mass prior to new construction. Infill development (Figure 1(g)) is found on plots where existing buildings are present and where new construction pursues, but no demolition occurs. Replacement (Figure 1 (h)) can be found by looking at plots where demolition and construction coincided either subsequently or where demolition took place shortly after (in the case study, up to 5 years after construction). Shrinkage (Figure 1(i)) can be identified by looking at demolition-dominated areas without any new construction. Due to the predominance of greenfield development and replacement in the Finnish city of Vantaa, shrinkage and infill development will not be widely demonstrated in the case study that follows.
The framework uses numbers and gross floor area (GFA) of buildings to measure the material inflows and outflows. The flows of virgin and waste materials associated with the different types of urban morphology changes can be explicitly quantified if the material contents of the buildings in question are known or can be assessed with the help of other similar buildings. Alas, this is not the case for Vantaa or for Finland more generally, so this aspect of MFA will not be demonstrated in the results but remains a task for future research.
Research data
The research data needed for the introduced approach encompasses building and plot data. In the paper’s case study in Vantaa, Finland, the input data for buildings consists of two distinct sets. The first one covers a total of 3434 records of buildings that were demolished in Vantaa between 2000 and 2018. The second one comprises Vantaa’s existing building stock in December 2018 and contains 39,816 records. In principle, the register contains over 100 attributes for a building, such as unique building identifiers, building location (e.g. several types of coordinates, municipality number and plot code), building measures (whole building and divided by space function), dates (e.g. construction, demolition), main materials (façade and structural frame), construction type (e.g. in situ, prefabrication), building equipment (e.g. elevator, solar panels, heating, water supply and electricity), funding, ownership and information on the technical performance (e.g. energy class, fire safety). Whether the data has factually been recorded, however, varies significantly and resulted in a selection of attributes which were found to be most reliable and relevant for the purposes of the current study. These are building function, building measures in gross floor area (GFA), dates for construction and demolition in years, type of ownership and location by coordinates.
The minimum attributes required to replicate the presented approach with bottom-up data are indicators for the spatiotemporal occurrence, that is, building location (coordinates or plot identification) and year of construction and/or demolition. Building size and function add further depth to the study. In this case, the data covers over 70 different building functions (Supplemental Table S2) which were categorised into 13 BTGs (f in equation (1)) or two main groups (RBs and NRBs) to allow a comparison with research previously conducted in Finland that uses a similar categorisation. Furthermore, the data consists of 17 types of ownership which were categorised into private (private persons, housing companies and private businesses), public (including publicly owned businesses), other and not available due to a lack of data. Generally, the used data must be disaggregatable but need not be as comprehensive as in this case study. Both datasets went through several steps of processing (Supplemental Figure S1): demolished buildings erroneously marked as existing were transferred into the correct set; missing information on the building GFA was compensated with an average created from complete records; and duplicates were deleted. Finally, the data for the case study comprises 3543 records of buildings demolished between 2000 and 2018, and 39,348 records of existing buildings in 2018 (including 12,304 buildings constructed between 2000 and 2018).
Similarly, the plot data also consists of two sets. Plot data from early January 2020 was retrieved from the open data of the National Land Survey of Finland (n.d.). Given that plot structure changes over time through mergers and splits, the plots in the year 2000 were acquired from the City of Vantaa which allowed to identify these changes. Their comparison allowed to identify cases in which demolished and built buildings were initially on different plots that were later merged or on the same plot that was split into two or more smaller plots. It can be viable to conduct the analysis with plot data from 1 year only. However, this may corrupt findings, as some split plots may come off wrongly as greenfield development, and greenfield land merged with adjacent plots may erroneously become interpreted as already developed land. Consequently, using plot data from at least two cross-sectional years (the beginning and the end of the study period) is strongly recommended.
Case study
In the study, demolished, newly built and existing buildings were classified into cohorts by BTG, construction year or decade, or age. Both number of buildings and GFA were used as mass indicators. First, the data was examined with the help of descriptive statistics in a spreadsheet (Microsoft Excel). Then, the spatiotemporal occurrence of buildings was studied in GIS with MapInfo Professional and QGIS programmes.
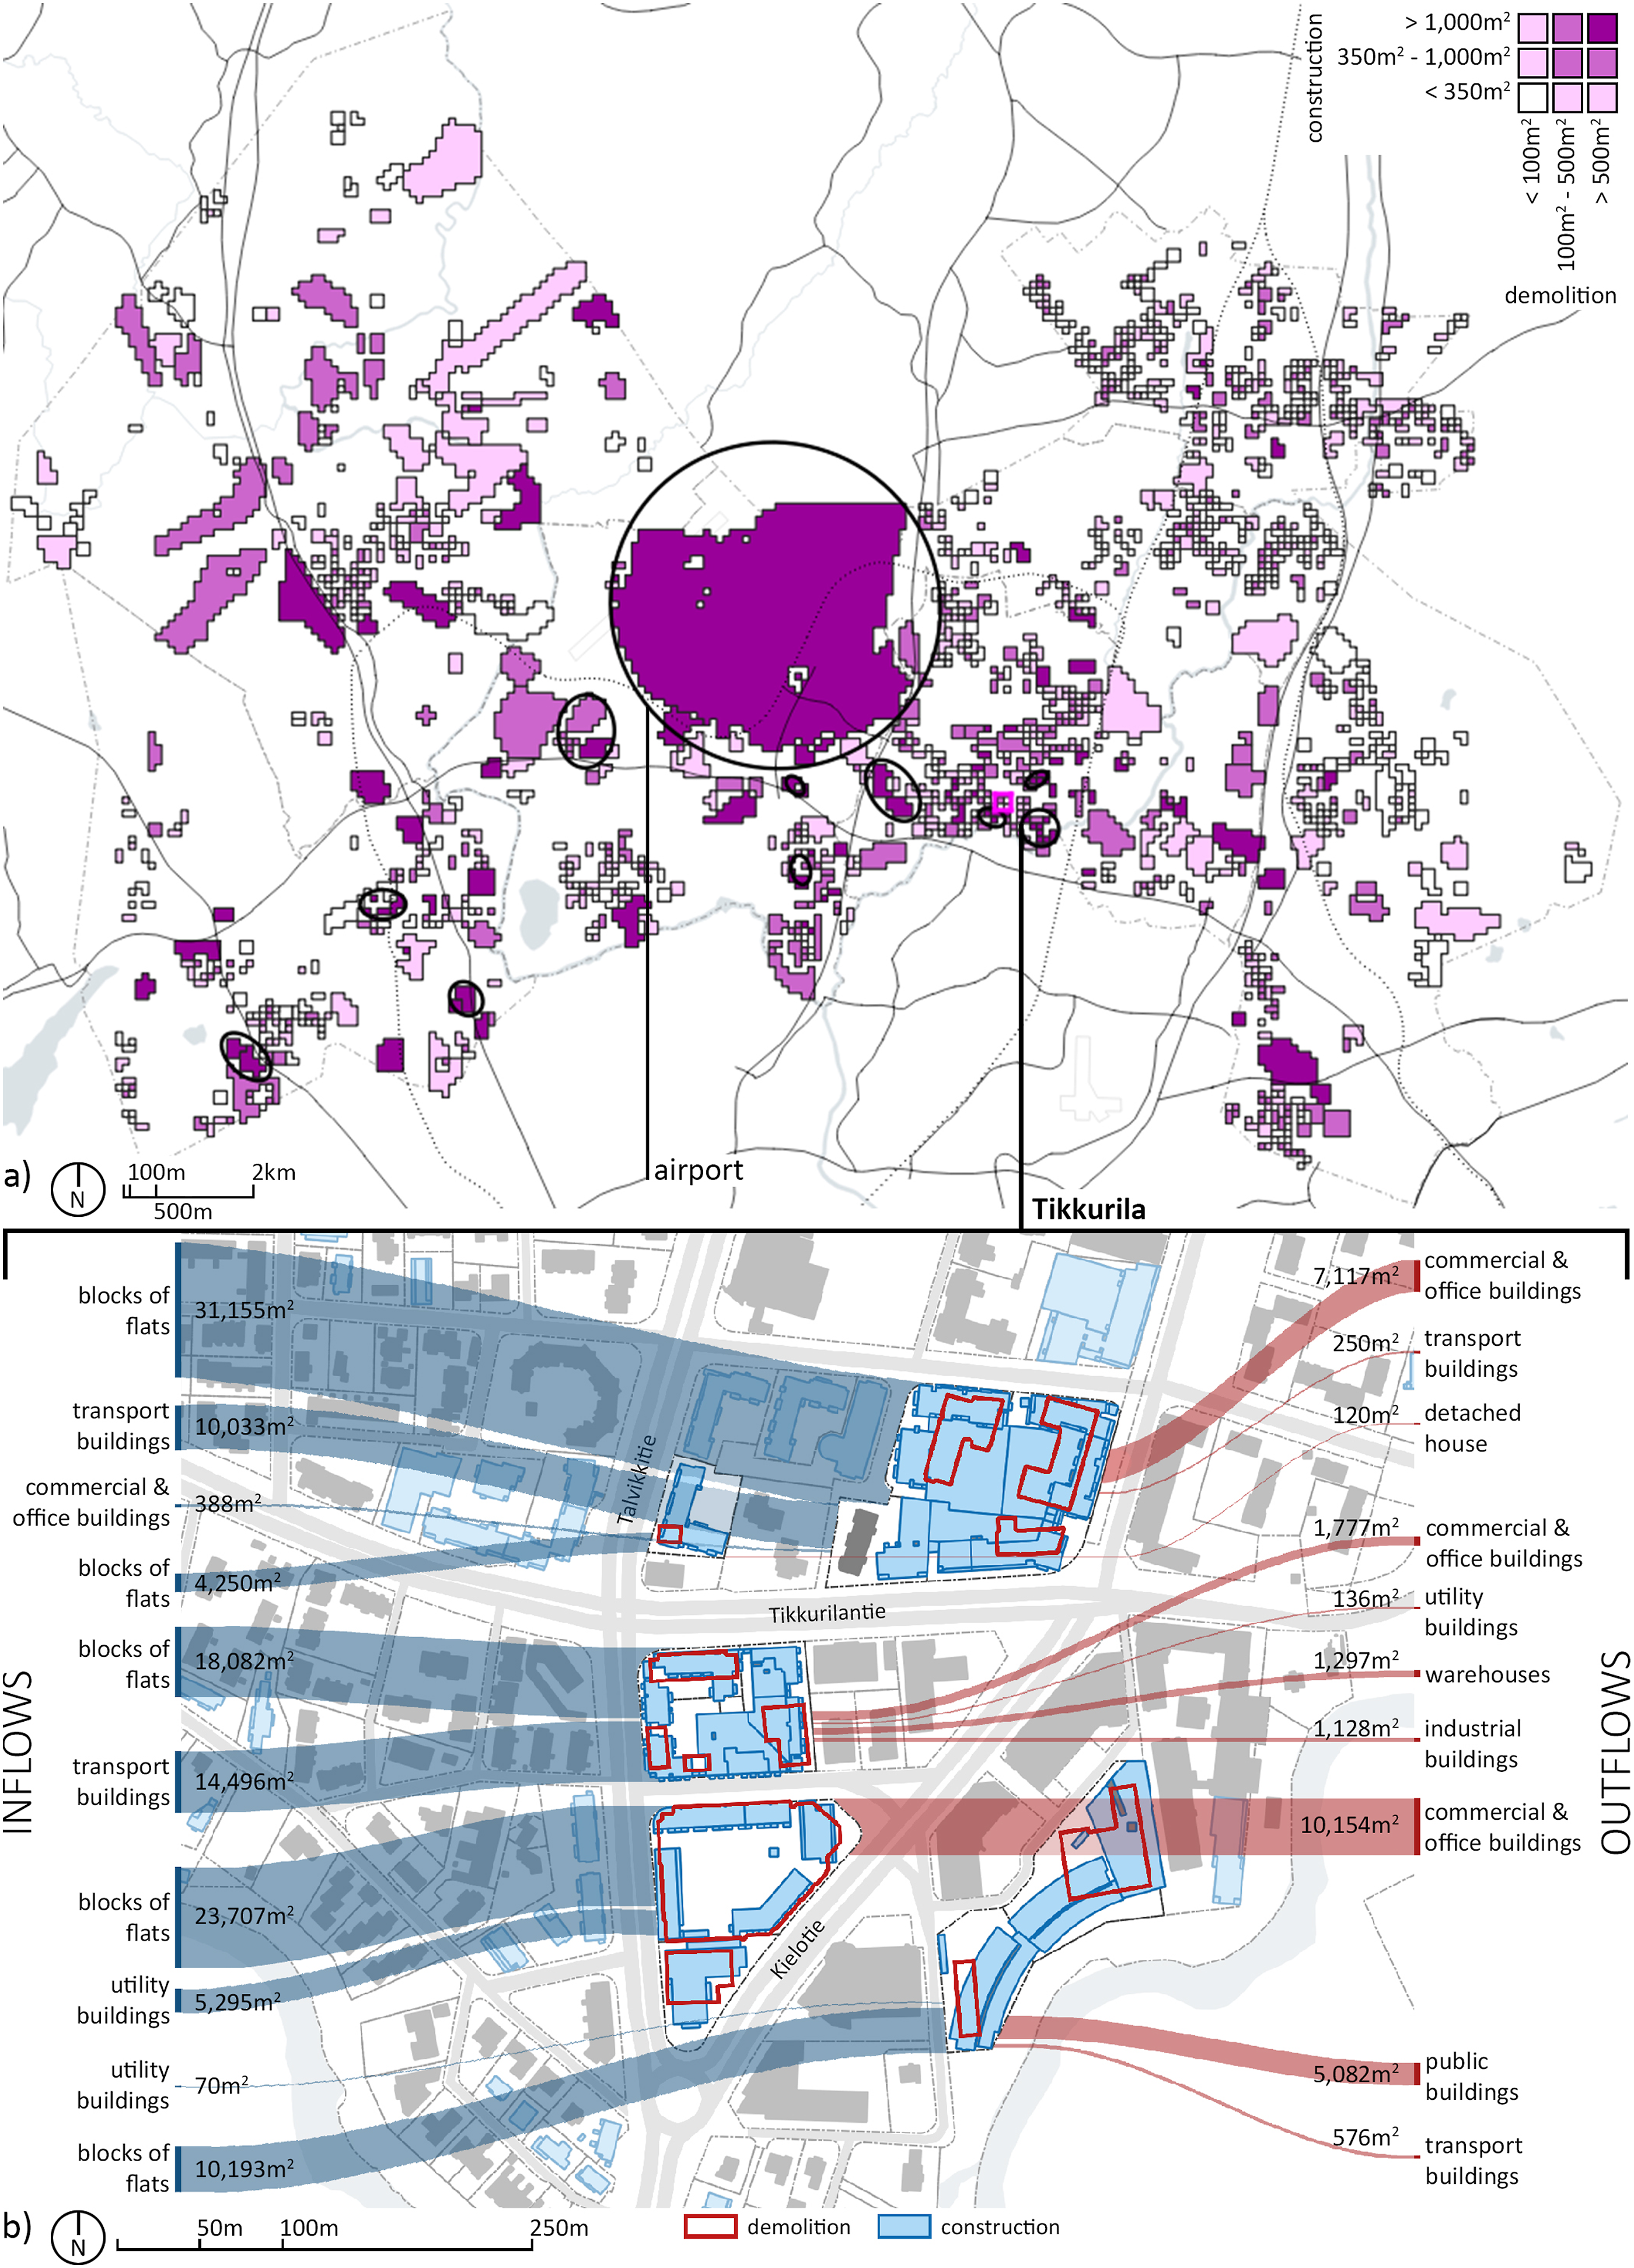
To improve readability, the point data of buildings was merged into a square grid with a mesh size of 250 m (as can be seen in Figure 2). The plot data was accentuated by merging it into a 100-m-wide grid (as visible in Figure 3 top). In addition to visualising, accentuating the spatial results helps to identify clusters of the spatial phenomena. Clusters are generally defined as hotspots in which construction, demolition or both occur in significant numbers while considering both GFA and number of buildings. To become a cluster, a group of buildings needs to be located on adjacent or opposite plots. Either location (around areas of interest like train stations), building typology, or year of construction or demolition require to indicate a certain logical connection between the construction or demolition activities. In this study, the presented building stock clusters are at least 150,000 m2 total GFA, construction clusters 50,000 m2 and demolition clusters at least 25,000 m2. Spatial distribution of building gross floor area in Vantaa: (a) building stock in 2000; (b) building stock in 2018; (c) new construction 2000–2018; (d) demolition 2000–2018. Identified clusters circled and most important ones named. Building replacement that occurred on a plot level: a) Findings throughout Vantaa were merged into a 100 m × 100 m grid; b) Southern Tikkurila zoom-in area where demolition and construction formed one of the most pronounced replacement clusters.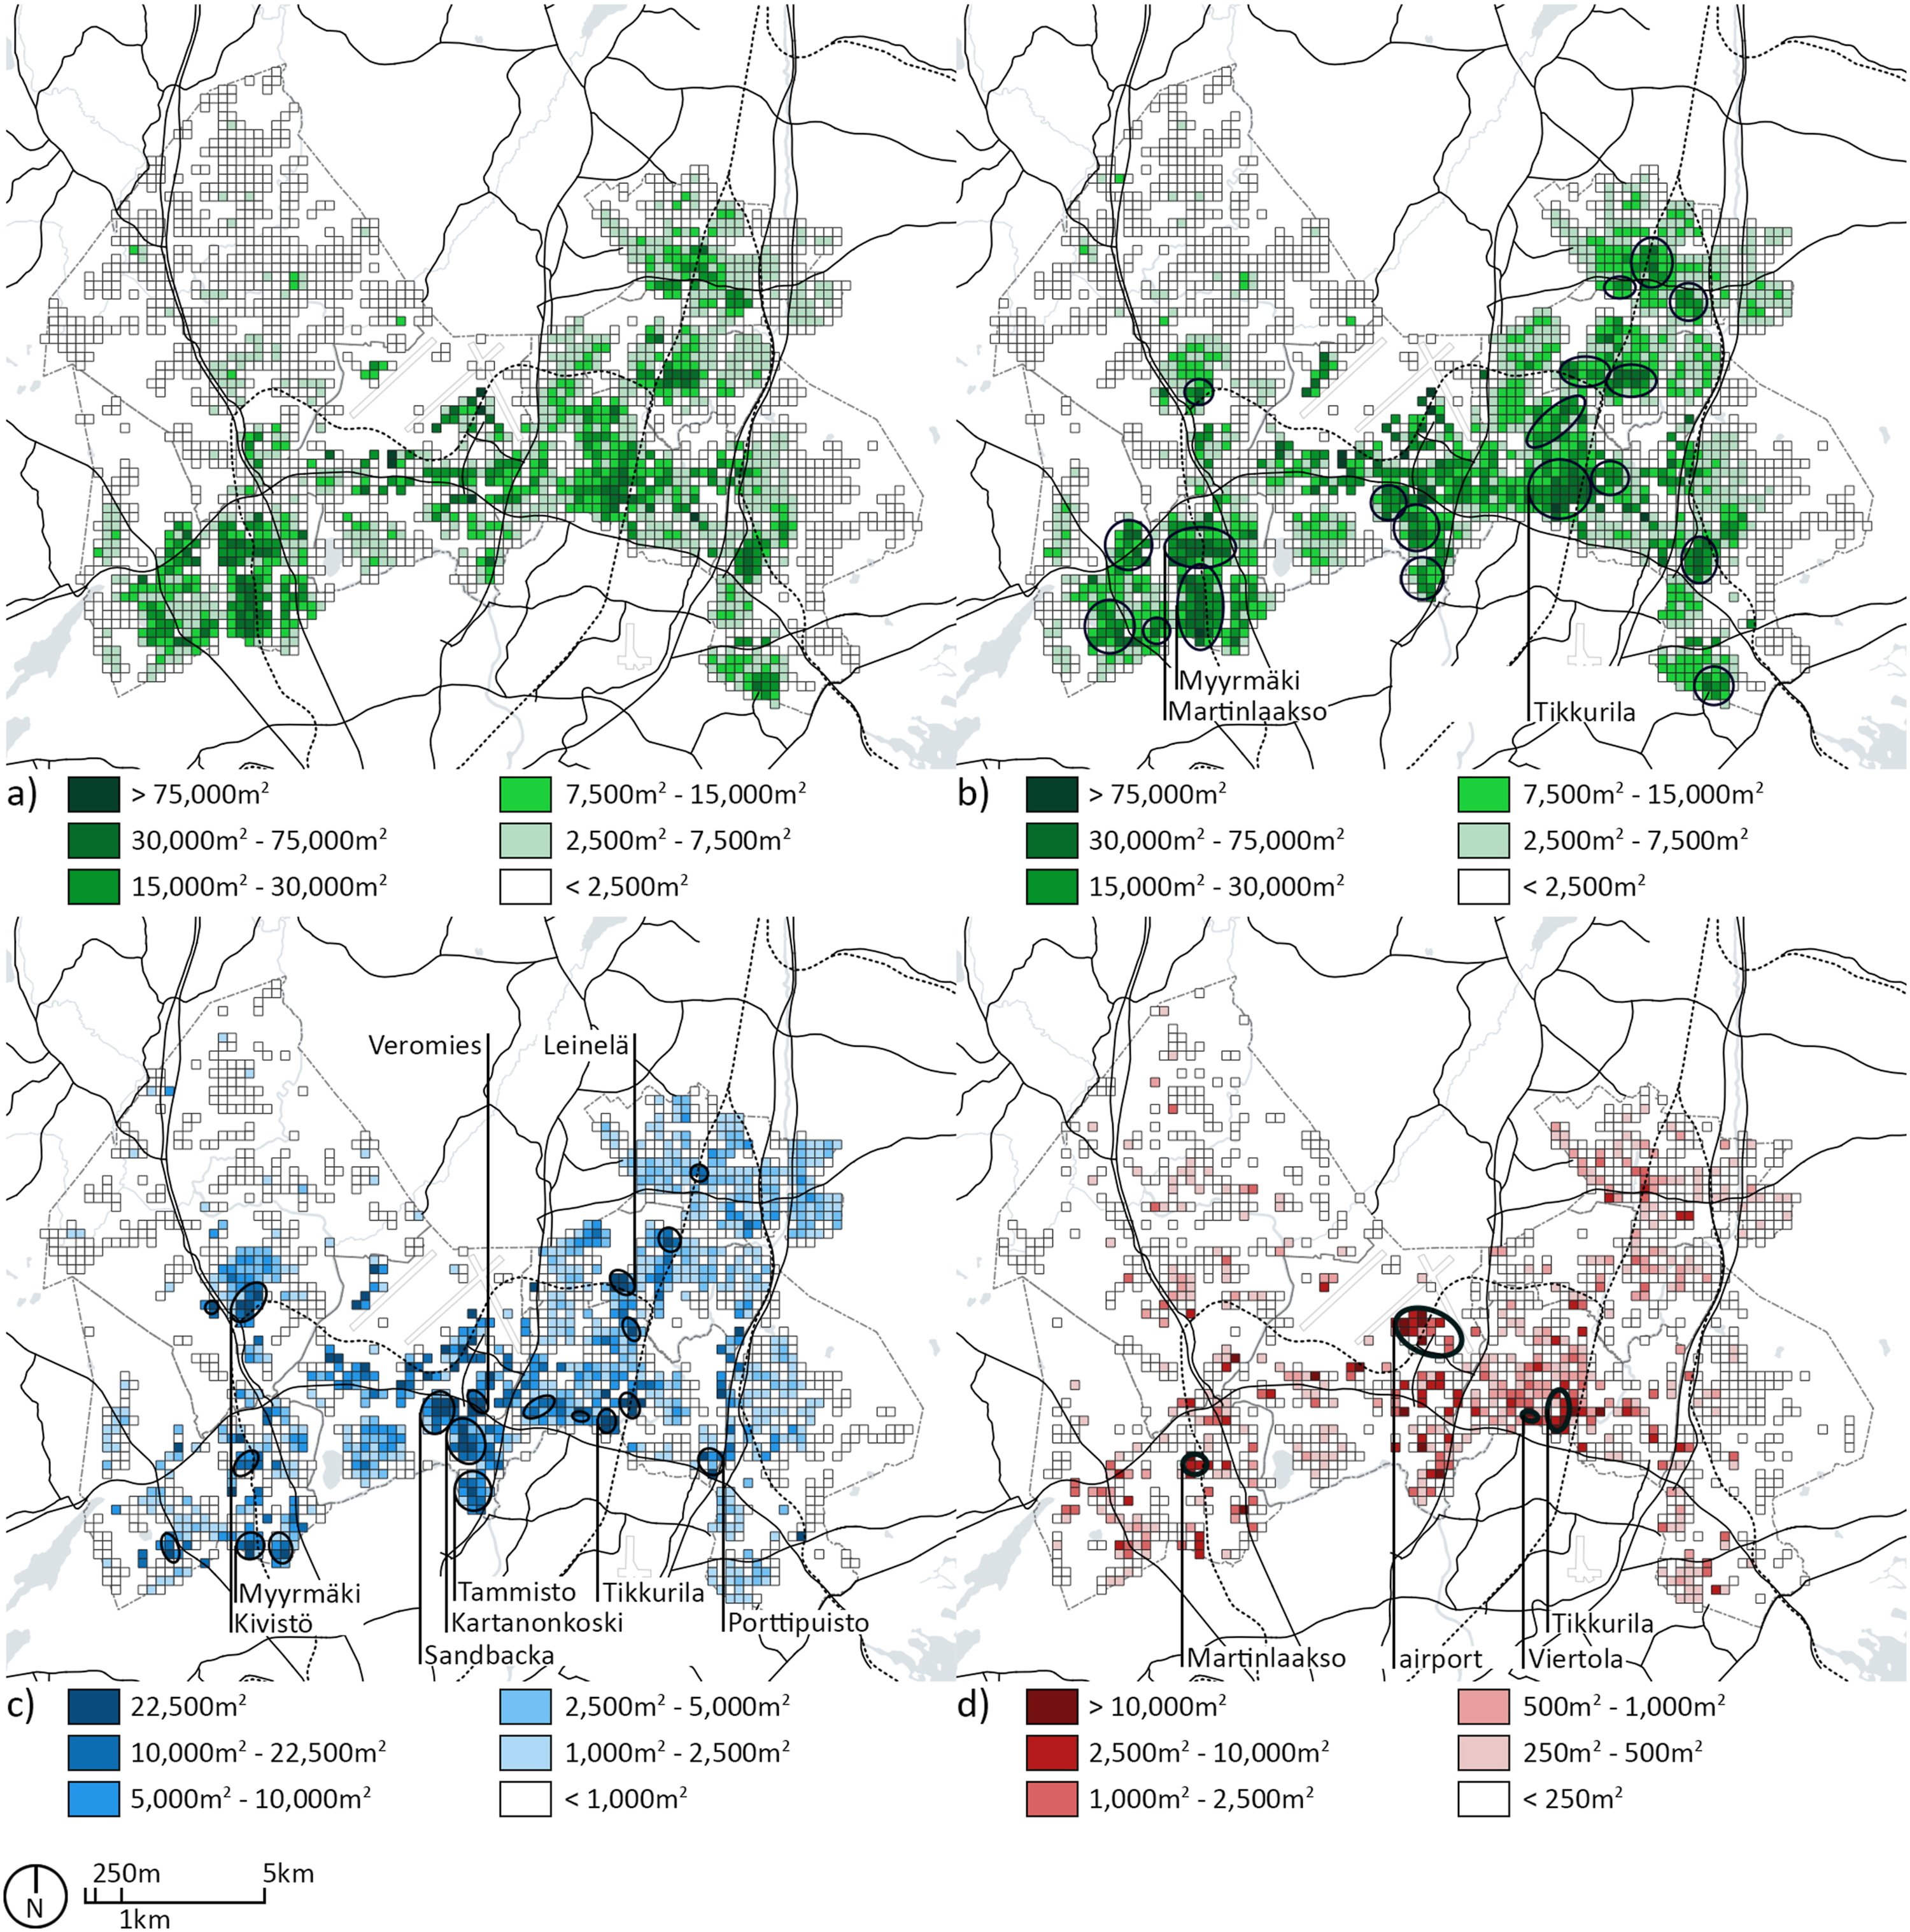
Methodological uncertainties
The study of greenfields, through its definition in this research, contains a potential source for error by risking to include brown- and greyfields as well. Therefore, aerial photographs were used to support and proof findings. A similar bias may lie within the study of shrinkage. Since construction could occur after the studied time-period, odds are that what is identified as shrinkage can in fact be replacement. Here, instead of aerial photographs, plans for urban renewal could be utilised to spot replacement erroneously labelled as shrinkage. However, a certain margin of potential errors remains.
Case study results
Overview
Vantaa is located in the Finnish capital region in the country’s South. Its administrative centre is Tikkurila. Finland’s largest airport is situated in Vantaa which is the main entryway into the country and one of its most important traffic nodes. Therefore, Vantaa is an important business location with several company headquarters within its borders. It is the country’s fourth largest city and for the past 30 years constantly among the fastest growing ones (Statistics Finland, n.d.). Since 2000, 12,304 buildings, that is, 6,288,806 m2 GFA were built while 3543 buildings, that is, 910,588 m2 were demolished. In 2018, Vantaa’s building stock consisted of 39,348 buildings with a total of 18, 557, 756 m2 GFA. With a population increase from 178,471 to 228,166 residents between 2000 and 2018 (Statistics Finland, n.d.), the residential per capita GFA also increased by 0.79% annually from 39.78 m2 to 45.47 m2, in line with the nation-wide trend of 0.8% (Kurvinen et al., 2021). During the studied period, the annual net building stock addition (construction minus demolition) was on average 461 buildings or 283,064 m2 GFA. The overall net addition to the stock over the two-decade period was 71% for the number of buildings and 86% for the floor area. Respectively, the replacement rates, that is, the proportionate part of demolition corresponding to construction, are 29% (number of buildings) and 14% (floor area). In other words, in terms of pure quantities and before any spatial coincidence is examined, nearly every third new building ‘replaced’ a previously existing one. Vantaa’s replacement rates are above the respective national averages of 22% and 12% (Huuhka and Lahdensivu, 2016) but below the 38% and 24% of the similarly sized city of Tampere (Huuhka and Kolkwitz, 2021). The lower replacement rates in combination with fast growth imply that Vantaa may have expanded more pronouncedly outwards, towards previously unbuilt land.
Stock distribution and development
Vantaa is divided into seven major regions: Kivistö and Myyrmäki in the West, Aviapolis including the airport in the centre, Tikkurila and Hakunila in the South-East and Koivukylä and Korso in the North-East. These are further subdivided into 60 city districts. Several motorways run through Vantaa connecting the capital Helsinki with areas further up North, whereas the West-East ring road three is the outermost of the two beltways in the greater Helsinki area. The central railway node in Tikkurila connects the rest of Finland to Helsinki in addition to the ring rail line, which feeds the airport and districts located further West. Overall, Vantaa’s infrastructure plays a critical role in the city’s development and is the backbone of its macrostructure. Figure 2(b) shows the distribution of the existing buildings in Vantaa in 2018. Compared to Tampere (Huuhka and Kolkwitz, 2021), stock distribution in Vantaa is a much more heterogenic with clusters spread across the municipality. The concentrations include the urban clusters Martinlaakso and Myyrmäki in the South-West comprising over 1.6 million m2 GFA, of which more than 70% are blocks of flats. Tikkurila is the densest built urban area and Vantaa’s cultural and commercial centre. Here, over 1.1 million m2 GFA of mixed-use is located at one of Finland’s busiest railway transportation hubs.
Construction
Comparing maps a and b in Figure 2, one can retrace the changes in urban morphology or as the so-called evolutionary temporal dynamic (cf. Göswein et al., 2019) between 2000 and 2018. Figure 2(c) shows the spatial distribution of GFA that was added to the stock during this period. The 19 circled clusters make around one-third of total new construction and contain over two-thirds of newly built housing GFA located in blocks of flats. The clusters can be grouped into three categories by the prevailing BTG. First, residential areas, like Kivistö, where almost 25% of total new construction is found. These types of areas were more often former greenfields than already developed areas, while infill was the least common pattern for them. Second, mixed-use areas like Tikkurila centre or Sandbacka, the development of which required changes in land use and hence, simultaneously resulted in a noteworthy amount of demolition. Third, commercially and industrially used new areas, such as Veromies or Porttipuisto, were established on green- or brownfield land or in areas where demolition preceded construction.
Greenfield development
Comparing the building stock densities in 2000 and 2018 (Figure 2, maps (a) and (b)), one can observe how certain areas have emerged or darkened, that is, gained stock. In total, 50% of newly built GFA is located in former greenfields, witnessing Vantaa growing by sprawling out towards new areas. One million m2, that is, 50% of newly built blocks of flats in GFA situate in former greenfields. Detached houses and warehouses are also significantly present BTGs with each approximately 500,000 m2 (44% and 65% of their total GFA, respectively). More than 450,000 m2, that is, 50% of newly built commercial and office buildings are also greenfield development.
Greenfield development clusters commonly belong to the first type of construction clusters, that is, they are housing-dominated. Large parts of Kartanonkoski in the South used to be farmland, and Kivistö in the West began to develop from a forested area as a railway station was established in 2015. Such co-evolution of infrastructure and building stock is typical to urban growth (Gontia et al., 2020). In the instances of Sandbacka and Leinelä, field and forest land close to already existing neighbourhoods were developed into predominantly residential areas.
Demolition and shrinkage
Demolition in the studied period formed roughly three clusters (Figure 2(d)) where almost one-third of total demolished GFA concentrated. The first cluster is a relatively loose assembly of demolished blocks of flats, commercial, office, and public buildings close to Martinlaakso railway station. The second cluster in Tikkurila and the neighbouring Viertola mainly comprises of commercial, office and industrial buildings. The third, and by far the largest demolition cluster, formed in the airport area. Over 150,000 m2, that is, more than 15% of total demolished GFA was located here, the large majority of which was transport buildings, unsurprisingly.
Approximately 290,000 m2 of total demolition is located on plots where, according to the definition in Figure 1(i), shrinkage occurred. However, looking at redevelopment after 2018 shows that in circa one-third of these cases, demolition has been followed by new construction. This suggests that the demolition is actually part of replacement, as does Vantaa’s growth-oriented context.
Replacement
Demolition is a costly undertaking that seldom happens for no reason. When demolition and construction overlap on the same plot, they qualify spatiotemporally as replacement (as e.g. in Tikkurila and Martinlaakso in Figure 2, maps c and d). In total, around 2250 demolished buildings and ca. 3800 new ones, 64% and 31% of total demolition and construction, respectively, situate on replacement plots. In numbers of buildings, small-scale BTGs such as detached houses and utility buildings dominate demolition and construction and often replace one another. In GFA, over 600,000 m2, more than two-thirds of total demolition, were replaced with ca. 2.5 million m2, 40% of total new construction. This makes the replacement rate within the replacement clusters 24%, that is, doubles the initial, roughly calculated rate of 12%. Generally, this reinforces the theory that replacement is a significant driver for demolition. With each more than 100,000 m2 GFA, transport buildings and warehouses are the BTGs that were demolished to the largest extent, followed by industrial, and commercial buildings (including offices) with each around 80,000 m2. With over 870,000 m2 GFA, blocks of flats are by far the most significant BTG built to replace the existing stock. With ca. 415,000 m2 come commercial and office buildings, followed by detached houses and transport buildings with each just over 350,000 m2.
The construction of blocks of flats most typically coincided with the demolition of either industrial production buildings, office buildings, commercial buildings or smaller blocks of flats. Newly built office buildings, on the other hand, often occurred on plots formerly belonging to warehouses or smaller office buildings, while warehouses often replaced other warehouses. In any case, the change of function in land use seems to play a major role in the replacement.
Specific replacement clusters (Figure 3(a)) were found to contain around 15% of total new construction and almost 38% of total demolition in GFA. By far the most significant of all replacement clusters is the airport area which comprises eight adjacent plots that accumulate almost 190,000 m2 demolished GFA (mainly transport buildings, warehouses but also commercial and office buildings, and public buildings) and more than 475,000 m2 of new construction (mainly transport buildings, commercial and office buildings, and warehouses). Other cluster areas accumulate in total approximately 155,000 m2 of demolished GFA replaced by ca. 475,000 m2 of new construction.
Figure 3(b) zooms in on the southern Tikkurila replacement cluster where mainly commercially used building GFA was demolished to make way for the new construction of mainly high-rise residential buildings, showing the impact of land use change on material flows at close range. Within a radius of 250m, more than 30,000 m2 building GFA was replaced by almost 125,000 m2 on 15 plots.
Overall, 75% of demolition in replacement clusters (in GFA) comprises of NRBs: warehouses, industrial, commercial and office buildings which – in two-thirds of the cases – get replaced with blocks of flats, showcasing the change of function the urban areas are undergoing.
Stock development by building type groups
In total, numbers of buildings demolished and built, utility buildings and detached houses outweigh any other BTGs. Due to their typically small size, findings by GFA are significantly different. Figures 4 and Supplemental Figure S2 portray the stock development in GFA for different BTGs. With almost two million m2 of new construction but only ca. 50,000 m2 of demolition, blocks of flats have been significantly stocked. RBs in general only make up 19% of total demolished floor area, while their share of total new construction is more than 50%. This reflects the low replacement of RBs and the overall increase of housing in a growing city. Additionally, the high losses of NRBs and additions of RBs match previously identified replacement patterns, that is, the former often replacing the latter. With replacement rates at around 50% and relatively low construction activities, the net stock additions for public, and industrial buildings are among the lowest of all BTGs. Despite the demolition of warehouses and transport buildings being at the highest, their replacement rates are comparably low, which reflects higher net stock additions than for industrial, and public buildings. Stock development for the most significant BTGs in 2000–2018. Note the different scales of y-axes for different BTGs.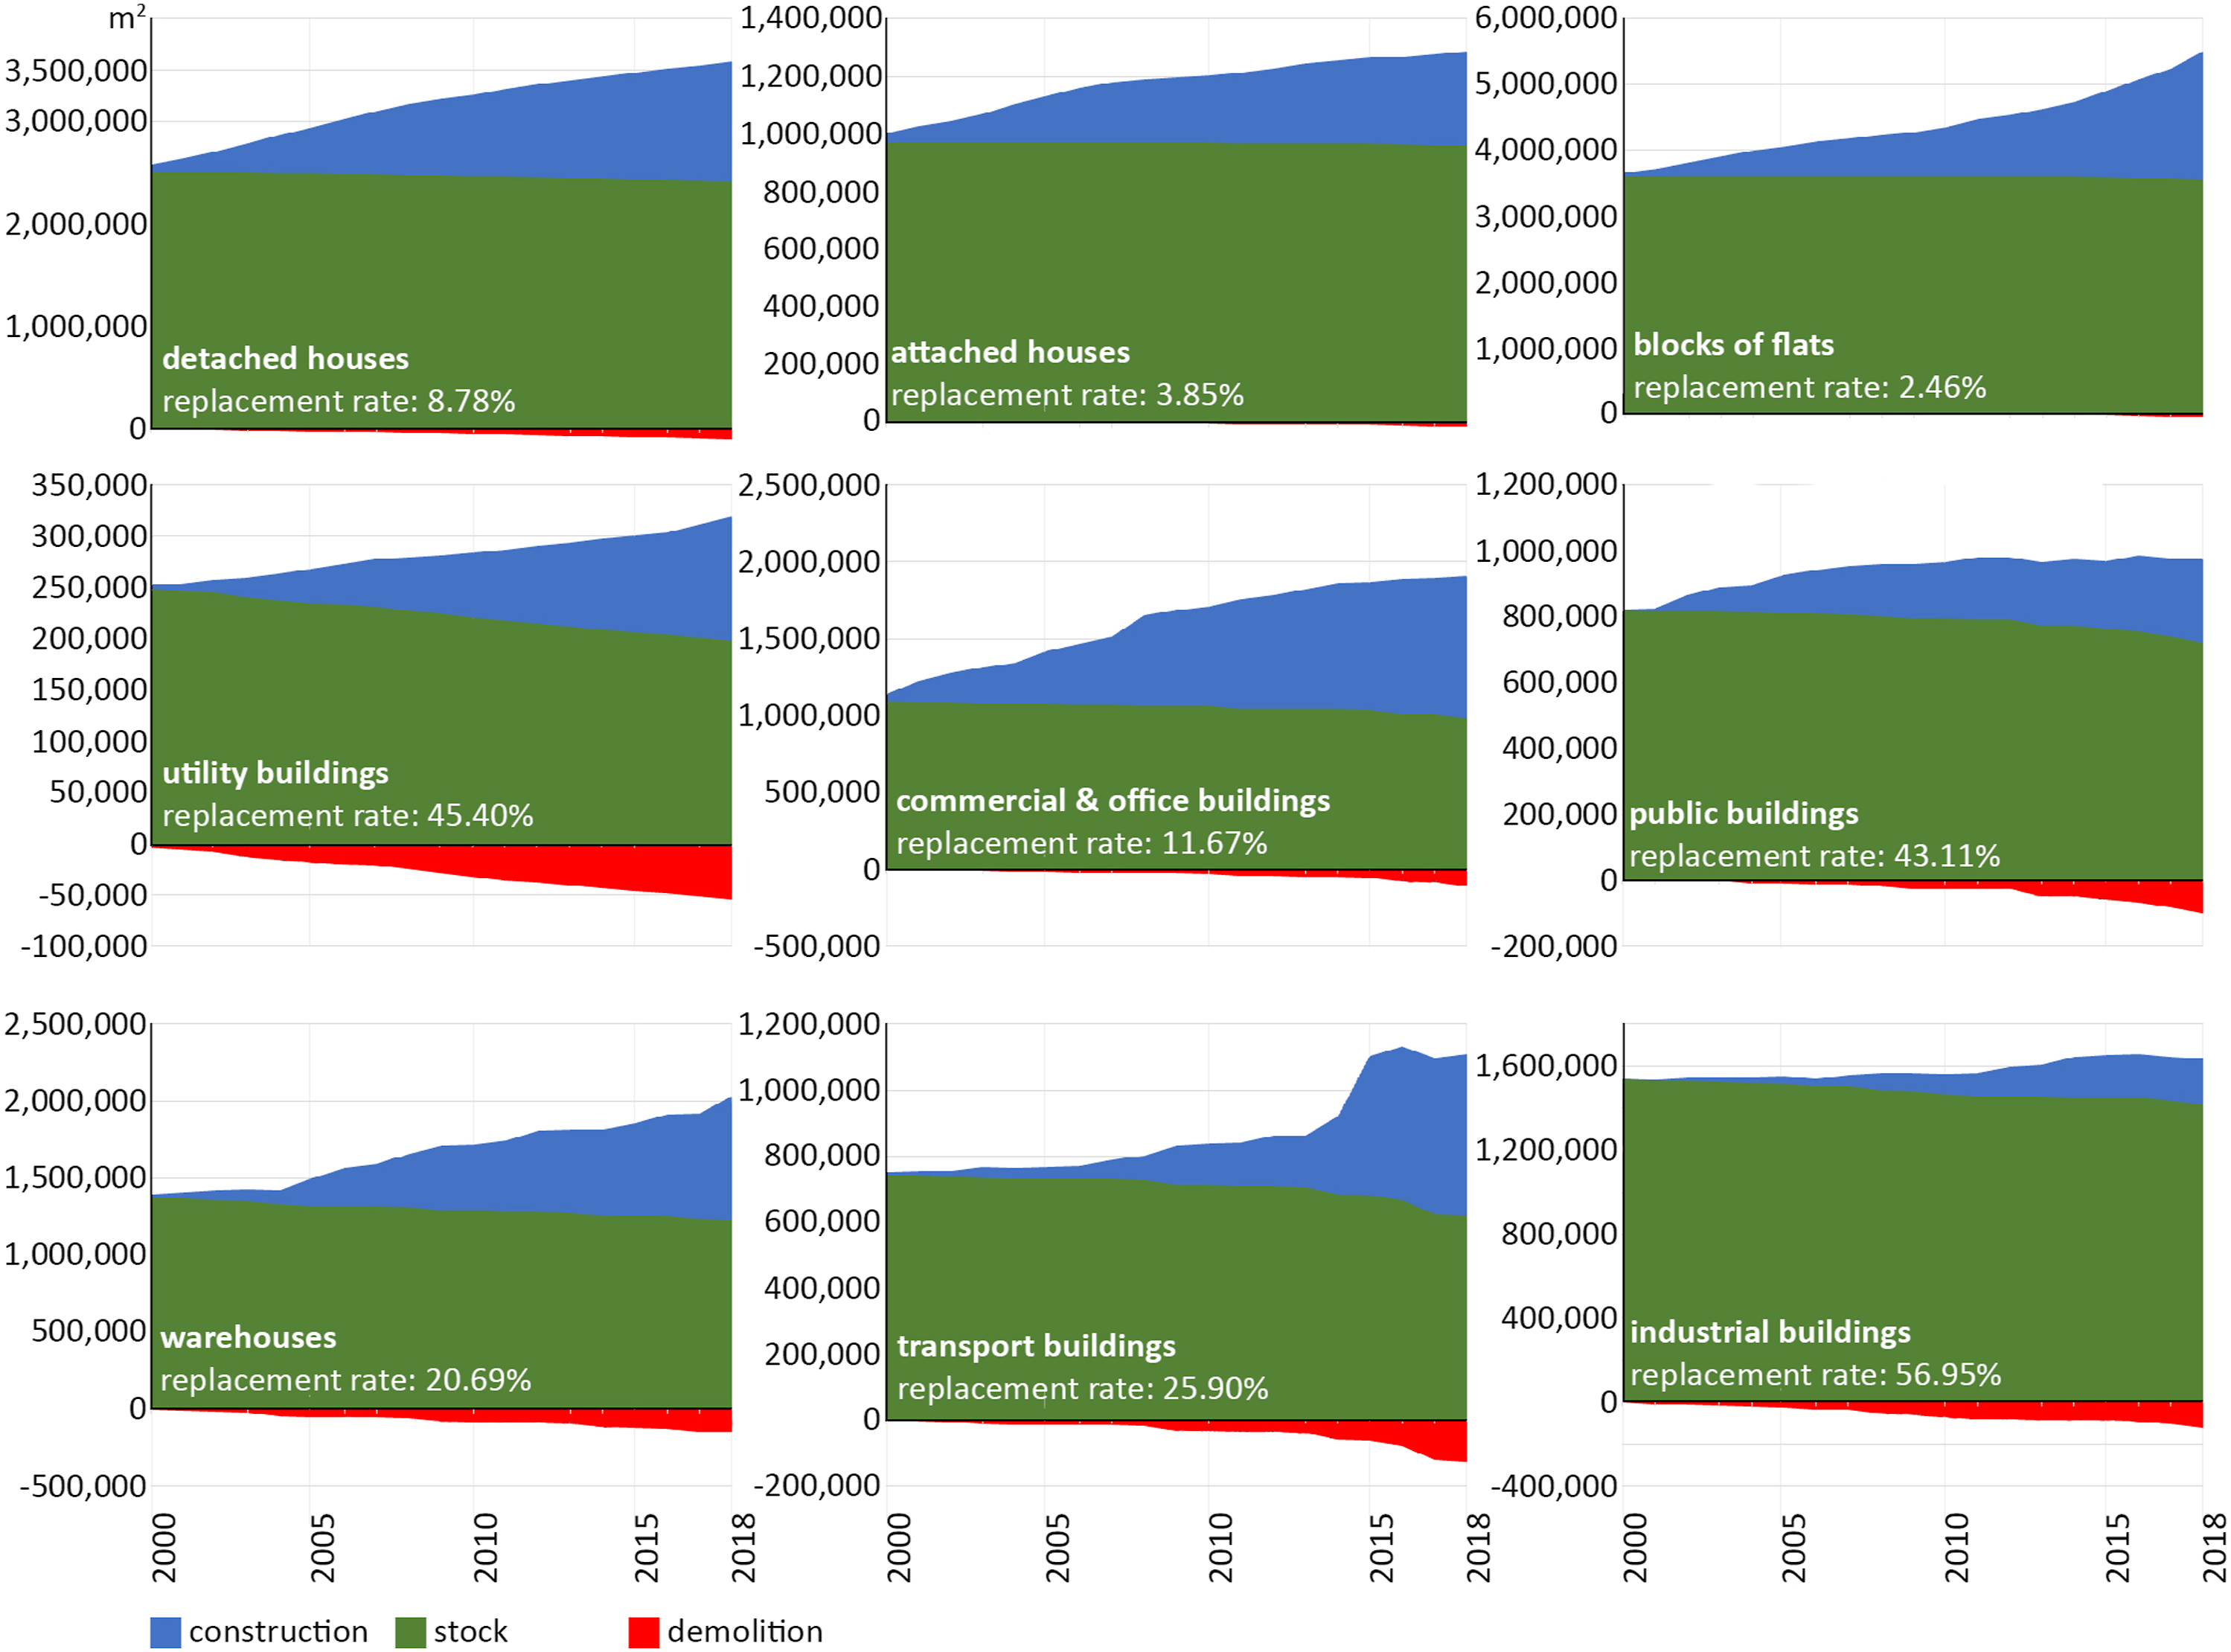
Building size and age
Most demolished NRBs were smaller than their equivalents in new construction (Supplemental Figure S3). This is especially pronounced for demolished commercial and office buildings whose average size of ca. 900 m2 was significantly below that of around 5,000 m2 for new buildings. As the most heavily demolished BTG, warehouses follow a similar trend: new construction is on average around three times larger. The average size of a built detached house (174 m2) is also almost double the demolished ones. Overall, one reason for demolition and building replacement seems to be the tendency towards larger facilities.
Comparing former greenfields and replacement areas, average sizes are usually larger on greenfield developments than replacement areas. However, for blocks of flats, average size on replacement plots is with 2911 m2 substantially larger than on greenfield plots. On the contrary, new commercial and office buildings on former greenfields are, with an average size of 7530 m2, more than 1000 m2 larger than in replacement areas. Within this category, big box stores, department stores and shopping centres typically situate in greenfields, whereas smaller office buildings are usually built on replacement plots.
Since 2000, Vantaa’s building stock has become significantly younger. The overall average age of existing buildings was 50 years in 2000 but has decreased to 36 years in 2018. Despite relatively early industrialisation in Tikkurila, Vantaa maintained a predominantly rural character until the 1960s which marked the starting point for rapid growth. The large amount of demolished detached houses originating from the 1950s and 1960s reflects both Vantaa’s past low-density character. Around one-third of demolished buildings reached their end-of-life by 45 years, and another one-third after 45–60 years. In the case of RBs, more than 60% were demolished after a 40–60-year lifespan.
The overall median and average age of demolished buildings at the time of demolition are 54 and 58 years in Vantaa, respectively. However, significant differences between the different BTGs occur. With 66 years, utility and agricultural buildings are on average the oldest BTG at the time of demolition. With 34 years, demolished public buildings showcase the youngest average age at the time of demolition, followed by commercial and office buildings with 36 years and warehouses with 37 years. The five demolished BTGs with the shortest actualized average lifespans (industrial, transport, public, commercial and office buildings, and warehouses) add up to almost 70% of total demolished floor area, compared to the five oldest (detached, utility and agricultural buildings, blocks of flats and holiday cottages) which accumulate only 28%.
Ownership
The vast majority (84%) of the existing GFA in Vantaa is privately owned – 36.5% thereof by private businesses, 30.5% by housing companies and 17% by private persons. Ownership’s influence on demolition can be analysed by looking at over- or underrepresentation of certain owner types for demolished buildings in comparison to the stock (Supplemental Figure S4). For RBs, demolition by private businesses is overrepresented, reflecting profit-driven renewal (cf. Thomsen and Van der Flier, 2009), whereas owner-occupiers are less inclined to demolish homes (Thomsen and Van Der Flier, 2011). Rather surprisingly though, housing companies are overrepresented as owners for certain demolished NRBs. However, as such NRBs were replaced with housing (or housing-supportive BTGs), this is assumably because there are private developers behind the developments before the homes are provided to individuals.
Discussion
Methodological implications
The research provided a framework for studying a city’s building stocks and flows through their spatiotemporal correlations and structural dynamics. Combining the research of urban morphology with that of stocks and flows shows how findings from one aspect can supplement the other and contribute to a better understanding about the UM processes within a city, which in Vantaa’s case were driven by population growth (cf. Gontia et al., 2020) and characterised by intertwined infrastructure and building construction on greenfield land. Approximately two-thirds of demolition in Vantaa and around 90% of construction could be associated with replacement and greenfield development, as opposed to infill, which hardly occurred. As for shrinkage and as mentioned in section 2.4, the framework cannot reliably identify genuine near-history decline because construction (i.e. replacement) may be occurring in the present or near future. So, in a near-history retrospective study, such as the paper’s case study, discretion is needed in the interpretation of the results. In a growing city like Vantaa, shrinkage constitutes less pressure on the existing stock than replacement, but shrinkage hotspots may still occur, for example, in socially troubled areas. However, in genuine decline-contexts, buildings are more likely abandoned than demolished (Thomsen and Van Der Flier, 2011).
One significant omission in the current approach is, still, the lack of material and environmental indicators for stocks and flows, which would help to explicitly quantify the environmental burdens, such as virgin material use, waste production and CO2 emissions, of the different UM processes (as in e.g. Stephan and Athanassiadis, 2017; Schandl et al., 2020). However, material passports and climate declarations could be mandated from new buildings to gather this data, the more widespread use of pre-demolition audits (cf. European Commission, 2016) could help to accumulate data on demolished buildings’ material contents, which could be used as a proxy for similar building cohorts that still stand.
Another shortcoming is that in- and outflows generated by building renovation, transformation or adaptation are not included, even though they can carry significant impacts. Such interventions, which usually are not easily detectable from urban morphology changes, would require additional data, which is presently often lacking. In general, the presented framework afford extension by a variety of data types, as long as the data included enables the spatiotemporal comparison of stocks and flows by applying a unified functional unit for quantity (e.g. number of products, GFA) or mass (e.g. kilogrammes of materials).
Case study findings
Overall, the findings for demolition in Vantaa, linked with the city’s rapid growth, are not surprising in the light of previous studies. Fast urban growth has been identified as a key driver for large-scale demolition (Fishman et al., 2015; Thomsen and Van Der Flier, 2011), not only in Finland (Huuhka and Lahdensivu, 2016), but also in, for example, the Netherlands (Thomsen and Van Der Flier, 2009). Furthermore, Goldblum and Wong (2000) have identified expansions of urban areas increasing the indirect pressure on peripheral zones resulting in demolition and replacement of low-density dwellings.
The prevailing pattern where NRBs are replaced by RBs is not unexpectable in relation to previous research, either. For instance, in Finland, Huuhka (2016: 51) has shown this pattern in cities in a nation-wide analysis. Studying office buildings in particular, Remøy (2010: 105) has concluded that vacancies and demolition of business premises are often not so much driven by a quantitative need for more such spaces as a qualitative demand for new kind of spaces. Today, changes in work life induced by the COVID-19 pandemic (French, 2022; Kong et al., 2022; Naor et al., 2022) can be expected to further increase vacancies in the existing office building stock while introducing a desire to have more space at the home. All of this highlights the need to incorporate NRBs in these analyses, which internationally too often focus solely on the residential building stock (e.g. Gontia et al., 2020), though in many cases for data availability reasons.
Furthermore, the comparison to the existing research in the city of Tampere (Huuhka and Kolkwitz, 2021) uncovers different patterns despite the cities’ similar size, highlighting the case-specific nature of changes in urban morphology and the associated material stocks and flows. Despite a noteworthy replacement phenomenon, Vantaa’s geographical context and comparatively rural past have allowed a higher level of greenfield development, manifested as less replacement compared to Tampere (cf. Huuhka and Kolkwitz, 2021). This is an important reminder that building stocks and their dynamics are shaped by context-specific factors and events, even in seemingly similar sociocultural settings. Furthermore, building stocks in historic (heritage-listed) town centres (cf. Mao et al., 2020; Miatto et al., 2019) are likely less susceptible to demolition than centrally located buildings in the Finnish building stock, which is characteristically young and Modernist in international comparison. However, the Finnish findings call into question whether land use and construction should indeed be considered hardly or very slowly ‘reversible’ in all contexts, as Simmonds et al. (2013) suggest. Moreover, Chmielewska et al. (2022) have showed how housing preferences have changed due to the COVID-19 pandemic and lead to an increase in greenfield development to residential areas also elsewhere.
Implications for planning
Cities are considered to play a crucial role in the implementation of CE policies by directing building and material flows through, for example, construction and demolition permits (Augiseau, 2020; Augiseau and Kim, 2021). The case study for Vantaa illustrates how an overall picture can be formed retrospectively of the material consequences that a city’s strategies have resulted in over time. However, the presented approach can also find proactive application in supporting more sustainable and CE-based urban planning, which is what Behnisch et al. (2019) have called for more widely from urban morphology analyses. The proposed framework can be used for assessing alternative development plans’ impact as a basis for decision-making. The addition of explicit environmental indicators on top of the presented framework will provide significant value for managing the environmental impacts of urban (re)development in a goal-oriented manner.
However, even without such indicators, both replacement (Thomsen and Van der Flier, 2009; Wang et al., 2019) and greenfield can be deduced to be less environmentally favourable strategies for urban growth than compact redevelopment and infill (Burchell et al., 1998; De Sousa, 2002). Sustainability will likely necessitate reconsidering large-scale replacement of buildings as a planning strategy in near future, as life-cycle analyses are showing refurbishment and adaptation to be more climate-friendly alternatives on the building level (Huuhka et al., 2021). The understanding of context-specific demolition and replacement patterns, in combination with the building stock composition, can help planning to proactively identify and address buildings susceptible to demolition in the future. In Vantaa for one, high demolition and low new construction of industrial buildings suggest that the remaining industrial buildings may eventually become such target. Planning has the opportunity to turn some of the prospective demolition into adaptive reuse and therefore, reduce the material turnover and the loss of cultural heritage.
Furthermore, densification, that is, the replacement of smaller buildings by larger ones was a major source of demolition in Vantaa. Since the densification targeted areas that were already dense in Vantaa’s context, it raises the question whether the current development will indeed be the saturation point for densification. Should the replacement strategy be resorted to in these areas in the future, it will induce even more voluminous material flows and associated environmental impacts. This underscores the importance of development strategies that consider circular futures for novel buildings already in today’s planning.
Moreover, the ownership/tenure plays a crucial role behind decision-making on demolition (Thomsen and Van Der Flier, 2011). Findings from this study have shown that private businesses and developer-initiated newly built housing companies are behind the vast majority of demolition in Vantaa. As an alternative to demolition, building adaptation and refurbishment are often not only more favourable for the environment but in many cases also more affordable for the people (Babangida et al., 2012). Hence, urban policymaking needs to create further incentives for companies (cf. Joensuu et al., 2020) to make building life-cycle extension the new status quo.
Conclusion
This research presented an approach to the UM of buildings in which the dynamic behaviour of a building stock and the intertwined changes in urban morphology were investigated in space and time by scrutinising the in- and outflows of buildings (construction and demolition). The purpose was to demonstrate the usage of MFA in urban analytics, focussing on the drivers and linkages in a city’s UM. The presented analytical framework distinguishes greenfield development, infill construction, building replacement and shrinkage as spatiotemporal processes within the UM, which are driven by changes in urban form, functions and structure, and which have tangible yet differing material and environmental implications.
The case study to demonstrate the approach was located in the Finnish city of Vantaa in 2000–2018. Of the framework’s four spatiotemporal UM processes, two were emphasised in Vantaa, namely, greenfield development and building replacement. The key findings from the case study include, firstly, that greenfield development was by far the most significant means of urban growth for the city. Second, NRBs that were demolished after a very short lifespan made around 70% of total demolished GFA, highlighting the central role of the less studied NRBs in UM. Third, RBs replaced large numbers of NRBs, making change of function-induced building replacement the single biggest driver for demolition. Comparing Vantaa’s findings to those of another Finnish city from a previous study underscored the case-specificity of the changes in urban morphology and the associated UM, even between two cities of a similar size and sociocultural context.
The approach enables to analyse the consequences of a city’s urban planning policies retrospectively, as demonstrated in the paper’s case study. However, it could also be used in a proactive way in planning support science to help planners make more sustainable urban (re)development choices in future. The latter will greatly benefit from further research adding explicit environmental indicators on embodied materials and CO2 on top of the presented framework.
Supplemental Material
Supplemental Material - How changes in urban morphology translate into urban metabolisms of building stocks: A framework for spatiotemporal material flow analysis and a case study
Supplemental Material for How changes in urban morphology translate into urban metabolisms of building stocks: A framework for spatiotemporal material flow analysis and a case study by Mario Max Kolkwitz, Elina Luotonen and Satu Huuhka in Environment and Planning B: Urban Analytics and City Science
Footnotes
Acknowledgements
The authors thank the City of Vantaa, in particular Kimmo Nekkula, Juha Huuhtanen and Jyri Moisio, for providing the datasets for the research. We also thank our colleague Jaana Vanhatalo for helping out with software-related questions, and colleagues Tapio Kaasalainen, Jesús Alberto Pulido-Arcas and Raúl Castaño De la Rosa for providing feedback.
Declaration of conflicting interests
The author(s) declared no potential conflicts of interest with respect to the research, authorship, and/or publication of this article.
Funding
The authors disclosed receipt of the following financial support for the research, authorship, and/or publication of this article: This work has been conducted in the Circular Construction in Regenerative Cities (CIRCuIT) project. The project has received funding from the European Union’s Horizon 2020 research and innovation programme under grant agreement no. 821201.
Supplemental material
Supplement material for this article is available in online.
References
Supplementary Material
Please find the following supplemental material available below.
For Open Access articles published under a Creative Commons License, all supplemental material carries the same license as the article it is associated with.
For non-Open Access articles published, all supplemental material carries a non-exclusive license, and permission requests for re-use of supplemental material or any part of supplemental material shall be sent directly to the copyright owner as specified in the copyright notice associated with the article.