
Abstract
Although location theory is now almost two centuries old, the firms' location choice processes areyet to be fully understood. And while accessibility, in some form, has long been used as an explanatory factor, spatial configuration measures (space syntax) have hardly been used in location models, and longitudinal analyses have also been infrequent. Therefore, a panel multinomial logit model is implemented in Lisbon to explore the role of this specific type of accessibility measures in shaping firm location, throughout a 15-year period, using data from 1995, 2002 and 2010. The analysis is focused on retail activity (five retail categories), restaurants and cafes. The results show that firm location can persistently be related to Local integration and Choice, although the magnitude of the relationship changes depending on the commercial category. These results reinforce the general idea that good urban design can potentially counteract information costs and help commerce locate in new areas of the city while allowing it to continue to succeed in the city’s older, more central areas.
Introduction
While the existence of modern cities has been attributed to the revival of trade in medieval times (Pirenne, 1925), retail has been acknowledged as a promoter of social interaction since at least the 1960s (Jacobs, 1961). Although cities had existed for millennia, before the Middle Ages they did not possess two fundamental attributes of modern cities: a middle-class population and a communal organisation (Pirenne, 1925). That community of people came to connect at retail, thus creating the sidewalk life we associate with cities (Jacobs, 1961). Apart from fostering liveability, retail is also a vital economic sector. Since Britain once being called a ‘nation of shopkeepers’ (Smith, 1776), retail has become the largest private-sector employer in Europe (wholesale and retail trade, transport, accommodation and food services) (Eurostat, 2017) while being worth $5570.4 billion in the USA (U.S. Census Bureau, 2022).
The ‘sidewalk life-creating retail’ of the 1960s was not unlike the small businesses we turned to during the COVID-19 pandemic when travel restrictions and the fear of contracting the disease turned many of us into customers and even supporters of local stores (Gordon-Wilson, 2022; Musselwhite et al., 2020). However, during the same time, e-commerce increased from 13.8% of worldwide retail sales in 2019 to a predicted 21% in 2022 (Statista, 2022). To some extent, the enforced relationship with local stores may counteract the ‘retail apocalypse’ that large digital-based companies were expected to bring upon traditional physical retailers (Hänninen et al., 2021; Helm et al., 2020). Local stores (or at least some) may thrive by catering to residents who want to buy food and daily necessities without leaving the safety of their neighbourhoods (Fei et al., 2020).
Nevertheless, and although stores are also increasingly becoming a ‘showroom, museum, and warehouse and fulfilment centre’ (Sachdeva and Goel, 2015) to add value to customer experience in the face of online competition, location is still a critical factor in determining an outlet’s success (Lin et al., 2018; Zambrano-Rey et al., 2019). Location theory has long informed the choice of an optimal location for economic activity, starting with Von Thünen’s ‘proto’ bid-rent theory (Von Thunen, 1826). Land rent falls as the distance to a central market increases to offset transportation costs (Von Thunen, 1826). Hence, those less dependent on proximity to a centre to sell their goods can locate farther from it. Therefore, accessibility measures first entered location models as distance to a centre. Distance to a centre is still a frequent explanatory variable in firm location models (Elgar et al., 2009), although more sophisticated accessibility measures have since been devised.
Consequently, and because the relationship between the presence of economic activities and urban configuration is relevant for urban planning, accessibility has entered retail location modelling through network centrality and accessibility measures such as betweenness, closeness and degree centrality (Porta et al., 2006). Spatial configuration measures such as integration, connectivity and choice although equivalent to closeness, degree and betweenness (Hillier and Iida, 2005; Omer and Goldblatt, 2016), have hardly been used in location modelling. Nevertheless, they have proven significant at predicting economic activity, and specifically retail location (Hillier, 1996; Lin et al., 2018; Martí et al., 2021; Mora, 2003; Ortiz-Chao and Hillier, 2007). The poor assimilation of spatial configuration measures by location modelling can eventually be attributed to the fact that, as measures become more abstract, their association with traffic flow modelling becomes less obvious, and this has been one of the main goals of location modelling (Batty, 2009).
Hence, this paper sets to analyse the impacts of spatial configuration on retail location in the framework of an (adapted) firm location model. The model is a multinomial logit with random effects that estimates the utility of a location for hosting a specific category from between five categories of retail, plus restaurants and cafes. To the best of our knowledge, the use of spatial configuration – or space syntax measures (Hillier, 1996; Hillier and Hanson, 1984) – on a multinomial panel model is unique. The most similar firm location models have been those of Sevtsuk (2014), while not being multinomial, and Mejia-Dorantes and Martín-Ramos (2013), while not using space syntax or centrality measures. Neither uses a panel specification.
As our main research hypothesis, we will test whether Choice and Integration can predict retail location persistently. Choice (betweenness) has proven a significant estimator of retail location (Buzzacchi et al., 2020; Sevtsuk, 2014) since it accounts for movement between any origin-destination pair of locations (or axial segments, in our case). Stores located in segments with a high value of choice (betweenness) benefit from the visibility of through traffic (Lin et al., 2018). Local integration (r=3) is heavily connected with pedestrian movement (Hillier, 1996). Considering the role of local businesses during the COVID-19 pandemic, testing the relationship between local integration and store location may provide relevant insights for urban design and the regulation of economic activity in years to come.
The following section presents the specific research framework of the paper, with a short literature review focused on space syntax measures and their relationship with retail location models while also adding some context on other explanatory variables and firm location models in general. This is followed by presenting the case study and data and the methodology and results. The paper closes with the conclusions and further research.
Research framework
Space Syntax was first introduced by Hillier and Hanson as a method to describe the built environment in a rigorous mathematical way (Hillier and Hanson, 1984). Integration, Connectivity and Choice are the three essential measures of the space syntax methodology. These measures are expected to be directly related to movement and, thus, to economic activity seeking to maximise the opportunities provided by movement (Hillier, 1996; Hillier et al., 1993). Summing up the concepts, Integration indicates the distance of any given space to all others in a system; Connectivity shows the number of nodes directly accessible from one node; and Choice (global) indicates the number of times a specific axial line lies on the shortest topological paths between any pair of axial lines in the system (Hillier and Hanson, 1984). Local measures of integration and choice can be obtained by defining a specific number of axial steps. Local integration of 3 axial steps (int r=3) is strongly related to pedestrian movement (Hillier, 1996). Additional information about the Space Syntax method is presented in the Supplementary Material.
After the space syntax framework was settled, Kim and Sohn (2002) are some of the first using space syntax measures to predict economic activity. A high correlation between space syntax indicators is found in two areas of Seoul, ultimately leading to using integration alone to predict office location (Kim and Sohn, 2002). This high correlation between space syntax measures has also been noted by other researchers (Berghauser Pont et al., 2019; Scoppa and Peponis, 2015). In Barcelona (Mora, 2003) and Mexico City (Ortiz-Chao and Hillier, 2007), both integration and connectivity are found to be significant predictors of the presence of economic activity. Assuming that integration and choice are equivalent to closeness and betweenness (Hillier and Iida, 2005), some analyses based on those measures can be brought in to support the discussion.
Hence, Sevtsuk (2014) finds that the relationship among the betweenness of a location and the presence of retail is significant for most store categories. Buzzachi et al. (2020) also find that betweenness is a significant predictor of retail location for convenience and shopping goods, although dependent on the trip’s purpose. Other researchers focus mainly on firm location, although similar conclusions can be drawn about retail (as a type of firm). For example, Ravulaparthy and Goulias (2016) find that betweenness can be related to retail location with a positive impact in smaller influence areas and a negative impact in larger ones. The conclusion is that a larger influence area will imply more competition (Ravulaparthy and Goulias, 2014, 2016).
Agglomeration effects were also introduced very early in the discussion about firm location (Marshall, 1920), considering that firms and businesses benefit from localisation economies (e.g. access to a skilled labour force and information spillovers). A different form of agglomeration comes from urbanisation economies since businesses locating close to one another to benefit, for example, from better infrastructures (Lösch, 1940). Agglomeration effects have also been emphasised in retail location models since stores tend to cluster, either for competitive purposes (Hotelling, 1929) or to benefit from information spillovers and multipurpose shopping (Caplin and Leahy, 1998; McLafferty and Ghosh, 1986). Stores selling goods that need to be compared or even ‘experienced’ before the purchase (comparison or ‘shopping’ goods (Copeland, 1923; Nelson, 1970)) will benefit more from locating in proximity, and hence (e.g.) antiques or clothing items tend to present a more noticeable clustering pattern (Krider and Putler, 2013).
Population density has also been a crucial factor for the location of firms and businesses, representing both the labour force (Dijk and Pellenbarg, 2000; Elgar et al., 2009; Weber, 1909) and the demand (Christaller, 1933; Lösch, 1940; Ravulaparthy and Goulias, 2016; Waddell et al., 2003). Using firm internal attributes (e.g. age, size, growth rate) as independent variables has also proven to be significant for estimating entire life-cycle location events, such as birth, death, growth and relocation (Van Wissen, 2000; Wever, 1983). Ultimately, variables that are hard to collect (proximity to the business owner’s residence) or more abstract (prestige of the location as perceived by the business owner) may ultimately explain a good deal of firm location (Elgar and Miller, 2010).
Therefore, we propose to model our research considering explanatory variables related to market area characteristics (e.g. population density, age of dwellings) along with different measures of accessibility and agglomeration to analyse the interaction between retail location, spatial configuration and, to some extent, land use. The framework is similar to the one used by Mejia-Dorantes et al. (2012) while focusing on different categories of retail instead of firms and using panel data (1995, 2002 and 2010) on commercial establishments to which all other variables (socio-demographics, spatial configuration) are related.
Case study and data
Case study and dependent variable
The analysis is carried out in Lisbon, using (point) data about stores’ locations and categories from a commercial census implemented by the municipality between 1995 and 2010 (Câmara Municipal de Lisboa, 2020). Axial data comes from two existing axial maps from 1994 and 2003 (Serdoura, 2006) and an axial map purposefully created for this analysis using spatial data from 2012. To make the panel, we used commercial activity data from 1995, 2002 and 2010 (Câmara Municipal De Lisboa, 2020) and population and housing Census data for 1991, 2001 and 2011 (INE, 2020). The final dataset contains 11.964 operating commercial establishments for 1995, 12.554 for 2002 and 13.216 for 2010. For simplicity, all data will be referred to as 1995, 2002 and 2010 data from this point on (even though, for example, commercial establishments data from 2010 is related with 2011 housing and population census data and 2012 space syntax data).
Considering the scope of research, we address only the stores located in the street (‘street commerce’ (Sevtsuk, 2020)) since shopping mall stores’ location dynamics is different. In shopping malls, footfall and clustering are the results of a store location that is designed to maximise profits for both tenants and the mall developer by the later (Carter and Vandell, 2006). Nevertheless, the presence of shopping malls in the vicinity of stores enters the models as an explanatory variable since the presence of a mall may impact stores located around it (Maoh, 2005).
As for the categories being considered, and while the nature of the product influences the choice of location, this nature can be defined as generalist as convenience and shopping (comparison) goods (Copeland, 1923; Nelson, 1970) or as thorough as using the three-digit NAICS (North American Industry Classification System) (Sevtsuk, 2014). Using fewer categories leads to a more marked distinction between the goods. For example, population density is found to be positively related to convenience goods and negatively to comparison goods by Buzzacchi et al. (2020). In comparison, Sevtsuk (2014) finds negative or non-significant relationships between proximity to population and all types of goods (except for miscellaneous).
The seven categories used in our models consider the goods’ nature and the frequency of purchases. The classification is adapted from the one used by the municipality in its commercial census (Câmara Municipal De Lisboa, 2020). The municipality’s classification is itself an adaptation of the official Portuguese Classification of Economic Activities (‘Classificação das Atividades Económicas’ (CAE)) (Institututo Nacional De Estatística, 2007), and thus, not unlike the NAICS classification. Although we assume there may be a less marked distinction between the goods than the one we would find using fewer categories, we expect that the insights about different goods’ location patterns will make up for this.
Hence, we considered stores to be grouped as Foodstuffs (supermarkets, bakeries, groceries and similar establishments), Personal Use Items (mainly clothing, clothing accessories and shoes), Household Articles (mostly furniture, home appliances and home decoration items), Leisure items (sporting goods, bookshops, music stores, etc.), Miscellaneous (all other retail items not included in the remaining categories), Restaurants (and similar establishments) and Cafes (and similar establishments). Store category poses as the dependent variable. The analysis is implemented within the municipality of Lisbon, that between 1995 and 2010, occupied an area of 100.5 km2 (Direção Geral do Território, 2020).
Finally, since the commercial census (Câmara Municipal De Lisboa, 2020) did not include information about vacant stores, we were left with no obvious base category for our model. Hence, we defined non-operating stores as all stores that were ever part of the panel and that were empty at a specific year. A practical alternative would have been to use any category as the base outcome since it does not affect the validity of the results. However, it affects its interpretation since comparing a store (of any category) against a non-operating store says something about the location. A non-operating store is perceived as having less utility, at least by store owners, at a given time. Alternatively, comparing a store category against any another says ‘only’ that a store is perceived as having more (or less) utility for a specific purpose (category), which we found less interesting.
Therefore, non-operating stores were defined as mentioned, with exceptions being made for stores located in buildings that did not yet exist or no longer existed at a specific year, which entered the panel only after construction or were removed if already demolished. The implication is that a building where a store will open has some utility for commercial purposes, although less than other stores at that time. In the other way, keeping stores that are closed in the panel may correspond to stores that are indeed vacant. We found that 981 stores that were closed in 2002 had reopened in 2010. Moreover, we find that this approach may be closer to a real-life scenario than considering all buildings as having the potential to host a store, which is a common assumption in binomial models (Buzzacchi et al., 2020; Sevtsuk, 2014). Not all buildings can host a store due to regulations, or the buildings' characteristics, for example.
Spatial configuration, sociodemographic and other explanatory variables
Summary statistics of the explanatory variables.
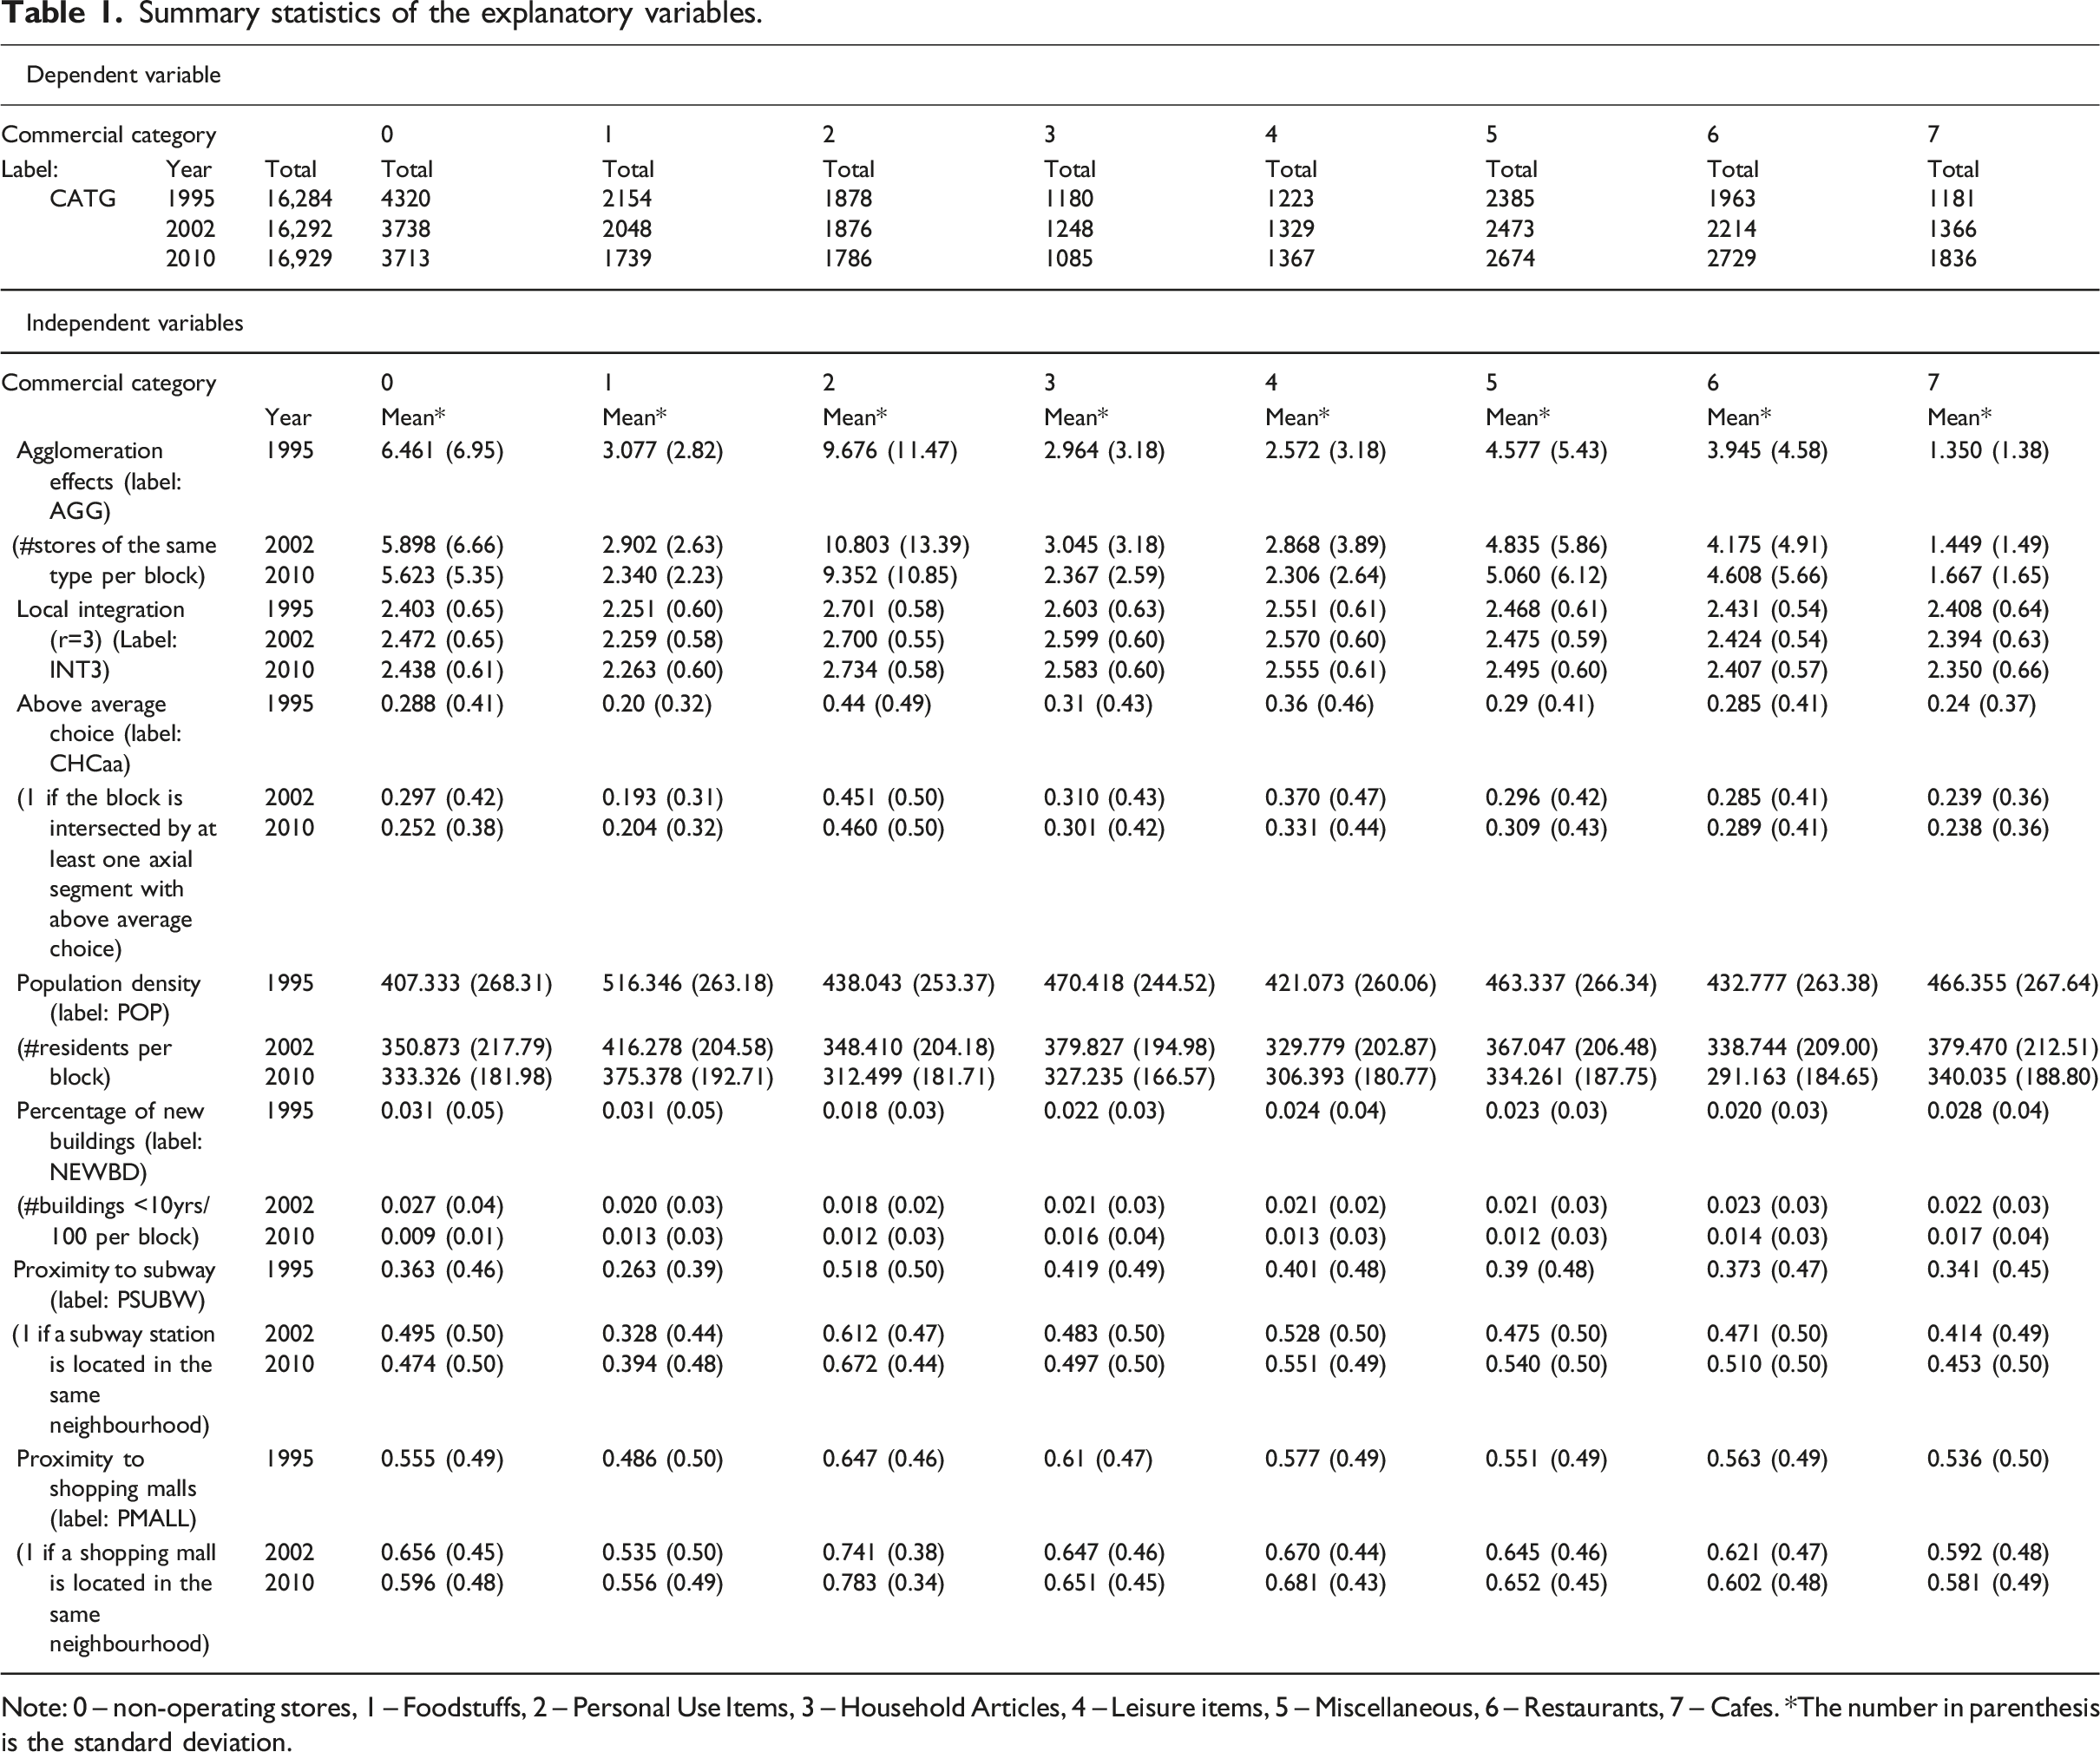
Note: 0 – non-operating stores, 1 – Foodstuffs, 2 – Personal Use Items, 3 – Household Articles, 4 – Leisure items, 5 – Miscellaneous, 6 – Restaurants, 7 – Cafes. *The number in parenthesis is the standard deviation.
Methodology and results
This research aims to estimate the relationship between spatial configuration and store location through 15 years and considering 16.929 commercial locations (amounting to an uneven panel of 49.505 individual observations). Moreover, we propose estimating store location considering five retail categories plus restaurants and cafes. Since our outcome is categorical and with no natural ordering, we find that a multinomial logit (MNL) will be appropriate for modelling the results. The MNL is used within the random utility framework (McFadden, 1973) that takes on the following formulation for a panel model (Grilli and Rampichini, 2007; Hartzel et al., 2001)
Multinomial logit panel model. Parameter estimates by business category sector (retail, restaurants and cafes).
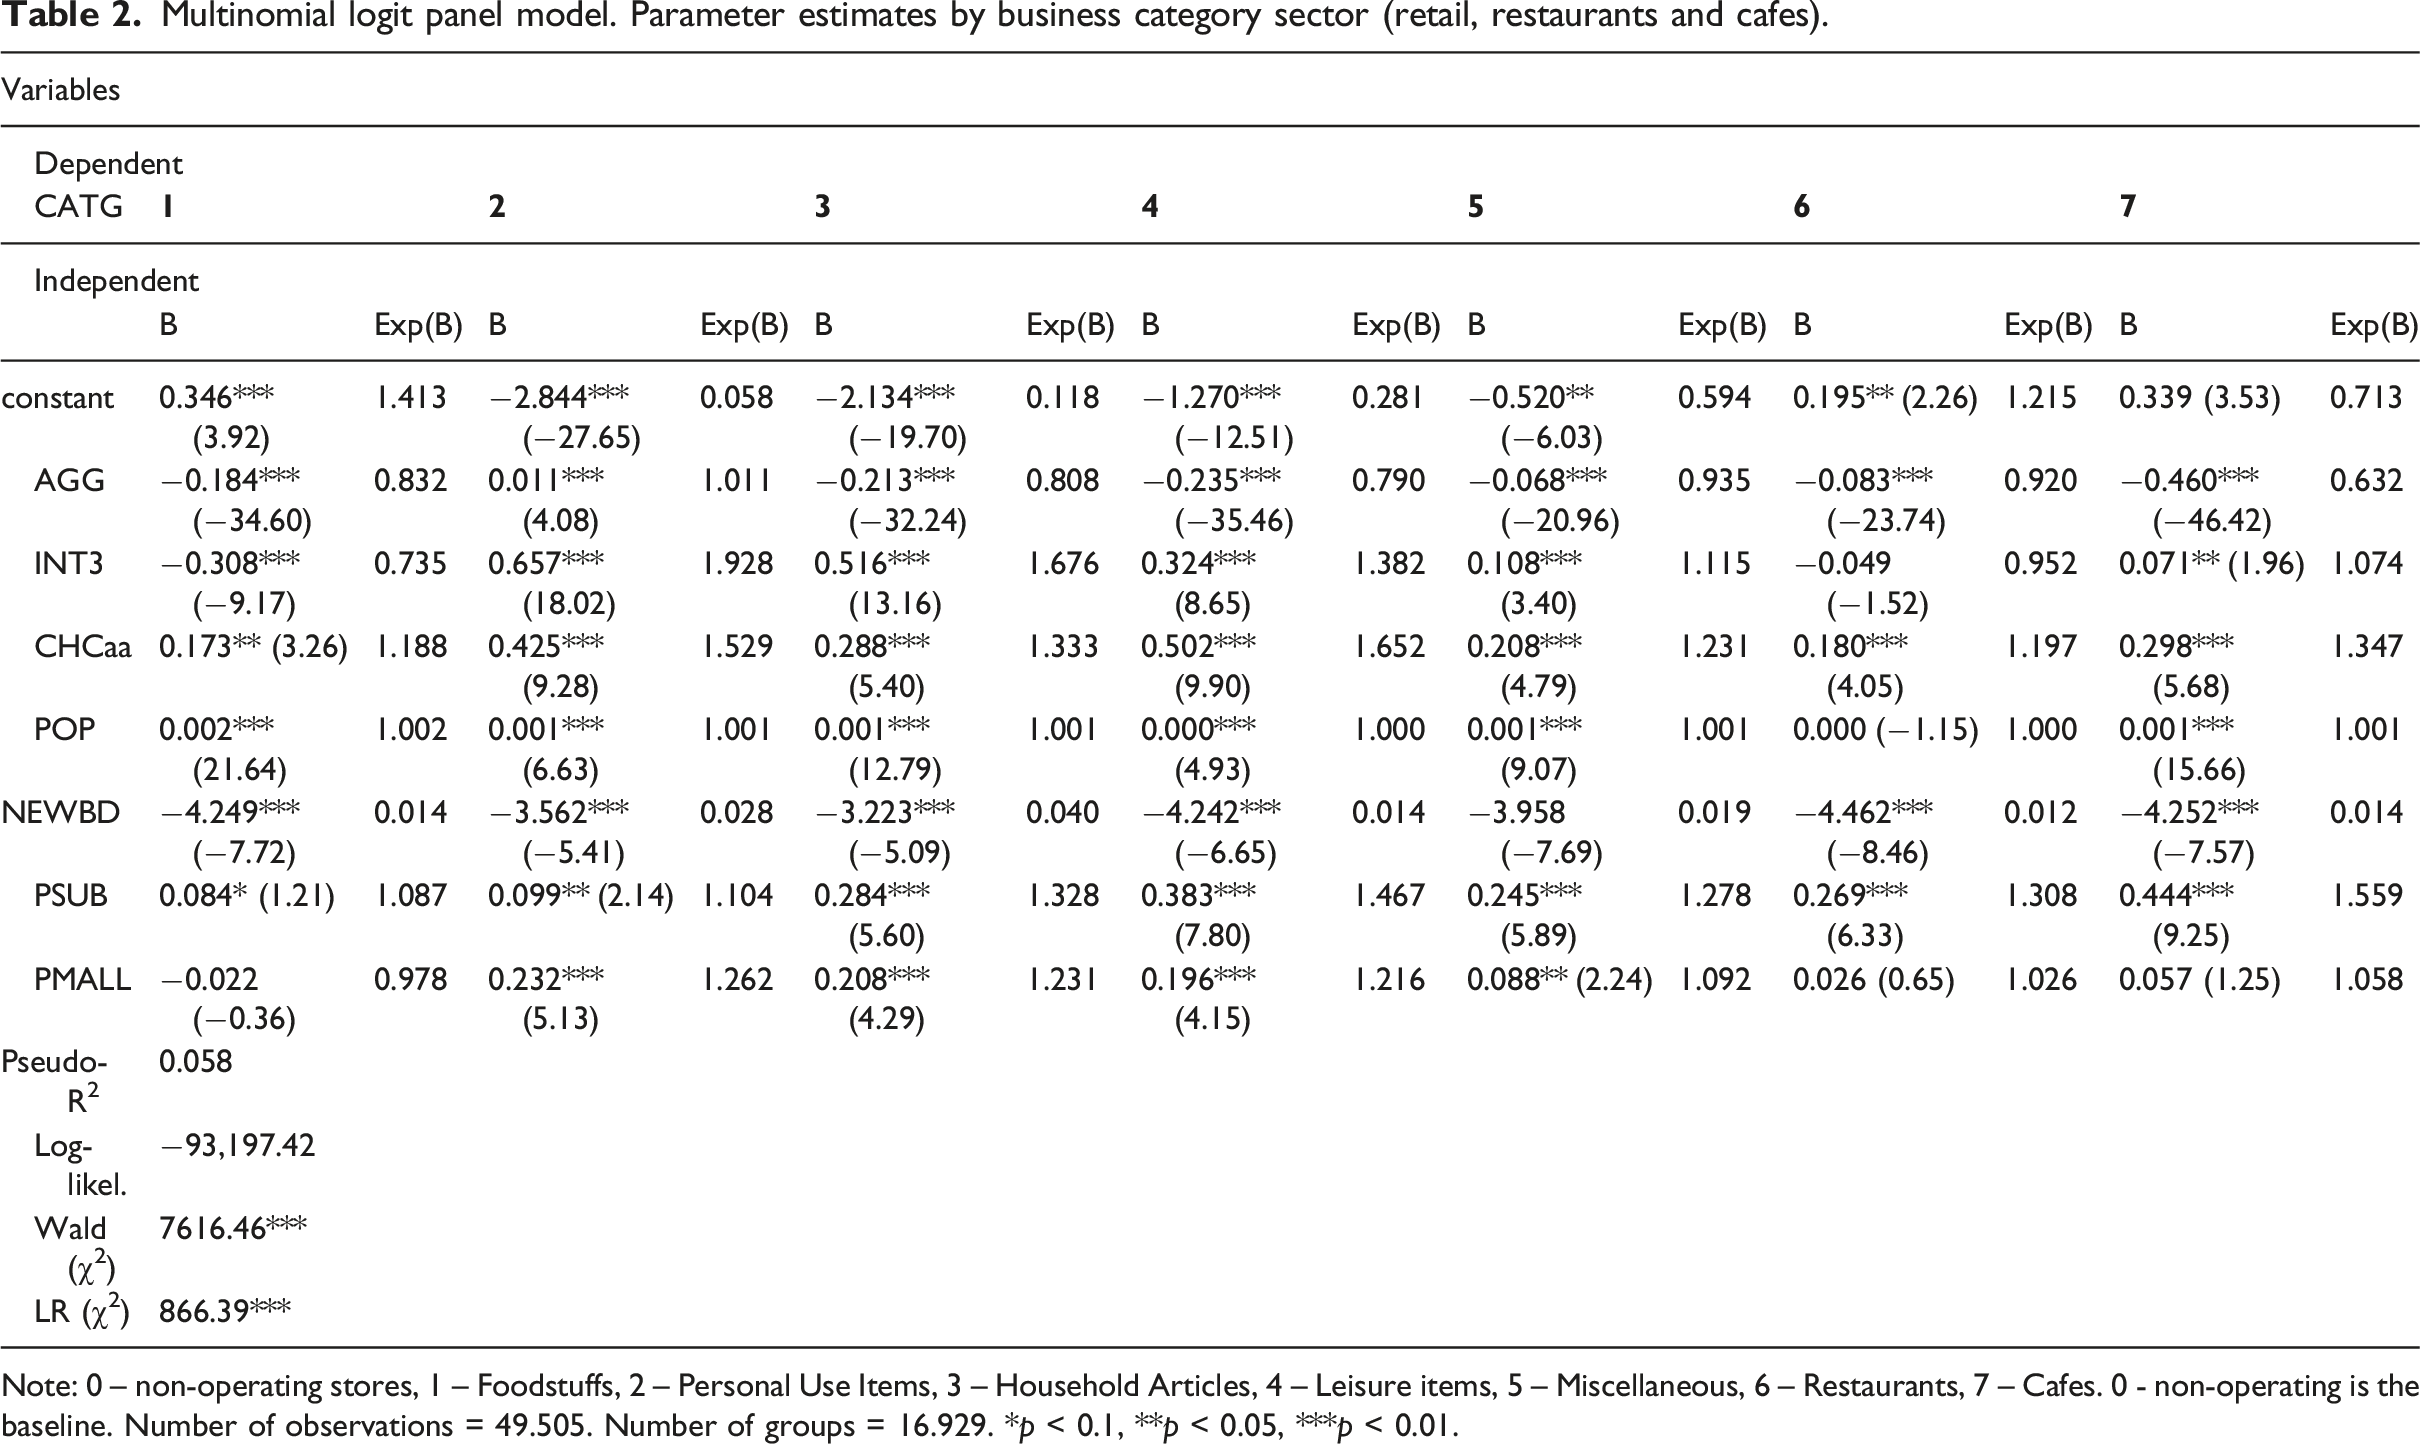
Note: 0 – non-operating stores, 1 – Foodstuffs, 2 – Personal Use Items, 3 – Household Articles, 4 – Leisure items, 5 – Miscellaneous, 6 – Restaurants, 7 – Cafes. 0 - non-operating is the baseline. Number of observations = 49.505. Number of groups = 16.929. *p < 0.1, **p < 0.05, ***p < 0.01.
Agglomeration (AGG) is significant in predicting every category. Contrarily to models using binary outcomes (Buzzacchi et al., 2020; Sevtsuk, 2014). AGG is not always positive. This is because our baseline is non-operating stores, revealing a strong agglomeration (clustering) effect. Non-operating stores cluster more than every other type, except for Personal Use Items. Considering that non-operating stores are not yet open or are vacant, the model shows that the ‘supply’ of buildings with characteristics perceived as desirable (while being able to host retail) is very concentrated, which we find plausible while also being supported by the subsequent analysis.
As for Personal use items (mainly clothing, clothing accessories and shoes) clustering more than any other store (the only category to have a significant and positive relationship with AGG), this may be explained by these being goods that rely heavily on comparison and hence, on clustering. Sevtsuk (2014) also finds Clothing and Clothing Accessories Stores presenting a very high clustering effect, with Food Services and Drinking Places presenting the highest clustering coefficient in his models. We find that this does not disagree with our results since we are dealing with panel data from a period of changing shopping habits. Eating out became a form of entertainment and status display during this period (Warde and Martens, 2000). Businesses such as restaurants could eventually risk opening outside commercial districts while hoping to find business. This combination leads to a less clustered pattern of Restaurants in our model, although still very clustered. Restaurants are just 8% less likely to cluster than non-operating stores.
Considering spatial configuration variables, local integration (INT3) is significant at predicting every category except Restaurants and positive with all except for Foodstuffs and Restaurants. Foodstuffs include supermarkets, bakeries, groceries and similar establishments, which have been found not to reveal competitive clustering, eventually being ‘the most undifferentiated convenience goods’ (Sevtsuk, 2014). Foodstuffs locate in proximity to their consumers, in neighbourhoods with different spatial configurations. As for Restaurants, the explanation may be the same as presented before. These businesses became widespread in this period and started relying (less) on pedestrian movement. Eventually, some became destinations on their own, which is better predicted by choice (CHCaa).
Above Average Choice (CHCaa), as was defined, represents location on a block that is easily reachable coming from any point in the city. The variable is significant and positive with every category, although presenting a higher coefficient in categories that can be seen as destinations, such as Personal Use items and Leisure items. The positive effect on categories such as Foodstuffs or Cafes is less obvious, with the explanation being eventually found by looking at the remaining variables. Hence, proximity to a subway station (PSUB) is also positively and significantly related to store location for all categories. Proximity to shopping malls (PMALL) predicts positively and significantly all categories except Foodstuffs, Restaurants and Cafes.
Looking at the Pearson correlation matrix of independent variables in the Supplementary Material, we find that CHCaa, AGG, INT3, PSUB and PMALL were all significantly related in 1995 and 2010 (although with a correlation low enough not to compromise the models' results). This is because the subway network, although expanding, is still relatively small and, in 1995, covered essentially the city’s most central area. Afterwards, it expanded to areas that have, in general, an above average choice, a high integration, or both. Figures S2–S7 as for PMALL, the variable considers both the larger shopping malls that started to compete with the centre, and the smaller ones that were, to some extent, integrated into the general commercial structure (Colaço and De Abreu e Silva, 2021). Many of the latter were also located near streets with above average choice.
The generally positive and significant relationship between stores' location and CHCaa, , INT3, PSUB and PMALL ultimately suggest a commercial ‘structure’ of the city. This structure contains a ‘central area’, which in 1995 corresponded to the historic CBD and its expansion area (Cachinho, 1994), where the main avenues, the subway, the shopping malls, and the majority of street commerce located and hence, related. Since the relationship is found in a panel model, the results suggests that, even after 1995, street commerce has kept, to some extent, a similar relationship with these variables. smaller clusters can also be related to oneof these characteristics (location in areas CHCaa, INT3, PSUB and PMALL). The coefficients related to the percentage of new buildings (NEWBD) support the idea that stores are less willing to open in new areas, eventually because of information costs (Caplin and Leahy, 1998). Nevertheless, the model results show that these effects can be, to some extent, counteracted by the presence of one or all the remaining features (CHCaa, INT3, PSUB and PMALL).
Finally, the relationship with population density (POP) is significant but with a very low coefficient, suggesting that stores rely on residents only to some extent, in Lisbon. The threshold population (Berry and Garrison, 1958) of a store is eventually found outside a block, which is plausible.
Conclusions and further research
Retail activity is an essential feature of urban life. It creates lively streets and a sense of belonging (Jacobs, 1961; Salgueiro and Erkip, 2014) while promoting sustainable mobility and local employment (Sevtsuk, 2014). It is also an important sector of the economy, leading retailers to permanently devise new ways of approaching the consumers. From the ‘classic store formula’ to the omnichannel distribution (Belu and Marinoiu, 2014), the business model has suffered an intense change in the last decades, eventually since the introduction of the first shopping centres and big-box retail competing with town centre retail already in the 1960s (Fernandes and Chamusca, 2014). Although some predicted a ‘retail apocalypse’ (Helm et al., 2020), the local store may survive due to the opening of physical stores by digital-native brands (Dougherty, 2019), with the consumer-local store relationship having also been reinforced during COVID-19 (Gordon-Wilson, 2022; Musselwhite et al., 2020).
Nevertheless, although the city centre has declined in most European cities since the 1990s (Dolega and Lord, 2020), the centre still concentrates a good part of the activity due to the cost of creating information spillovers (Caplin and Leahy, 1998). These information spillovers have been mostly assumed by big box and large chain stores outside better-known commercial districts (Caplin and Leahy, 1998). And since retail location models have mostly been a ‘static snapshot of retailers’ distribution’ (Buzzacchi et al., 2020), the information about location choices of stores located outside malls has been limited to the insights deriving from those snapshots. Therefore, we set at analysing retail location (including also restaurants and cafes) using panel data and considering 15 years to try and capture the persistent effect spatial configuration (and accessibility) measures on retail location, which have not been given sufficient attention in location modelling.
Our model shows that Choice and Local Integration are significant predictors of commercial location through time. This is true both in the centre and in more peripheral areas. Nevertheless, a high percentage of new buildings (<10 years) impacts significantly and negatively the chances of a store being open in a specific location. This is in line with what was stated in the previous paragraph (being the first to locate comes at a cost). However, high values of choice and local integration, along with the proximity to a shopping mall or a subway station may counteract this effect. This has consequences for policymaking since policies related to urban design, the regulation of economic activities and the planning of transportation infrastructures can be explicitly designed to support the location of street commerce.
As a practical example, our choice variable (CHCaa), which is directly related to the ease of reaching a block, shows that some street segments may be essential for vehicular traffic since they are ultimately helping to connect the entire city. When the destination is reached, the car can be dropped, and the final path made on foot, which will be especially easy if the local integration is also high. We find that this idea can be further explored in commercial districts to address the everlasting car vs pedestrian debate. Moreover, this relates directly to the concept of neighbourhood units and local commerce that has recently been reintroduced in the 15-minute cities (Moreno et al., 2021).
Finally, we cannot hope that older, less educated and less affluent residents will all locate in dense commercial areas or be able to shop online (Beckers et al., 2018; Clarke et al., 2015; Colaço and De Abreu e Silva, 2022; Farag et al., 2006). Some may be excluded from the e-shopping revolution . Hence, we hope this paper contributes to informing urban planning and policymaking in a way that favours local commerce. Local commerce pays service to the population, which was more evident than ever during the COVID-19 pandemic. Good urban design and the strategic planning of transportation infrastructures may ultimately favour local businesses e in a very effective manner by creating externalities that will benefit street commerce in a permanent way. Drafting affordable housing policies to contravene the possible uptake in rents due to the provision of amenities and accessibility may also be necessary and is crucial to the debate about sustainability and the cities we want to live in.
Further research will address digital transformation impacts (e-shopping) on location choices. Qualitative assessments of small business owners’ decisions to locate may also add to the fit of location models (Elgar and Miller, 2010) within a mixed-methods framework. Access to more recent data will also lead to improved model versions and a better understanding of retail location phenomena in the face of technological change.
Supplemental Material
Exploring the role of accessibility in shaping retail location using space syntax measures: A panel-data analysis in Lisbon, 1995–2010
Supplemental Material for Exploring the role of accessibility in shaping retail location using space syntax measures: A panel-data analysis in Lisbon, 1995–2010 by Rui Colaço, João de Abreu e Silva in Environment and Planning B: Urban Analytics and City Science
Footnotes
Acknowledgements
The authors gratefully acknowledge Prof. Francisco Serdoura for providing axial maps for 1994 and 2003. The authors would like to thank Fundação para a Ciência e a Tecnologia (FCT) for Rui Colaço’s PhD grant SFRH/BD/136003/2018, as well as for providing financial support to the project PTDC/EGE-ECO/28805/2017 - Transport Infrastructure and Urban Spatial Structure: Economic, Social and Environmental Effects (TiTuSS).
Declaration of conflicting interests
The author(s) declared no potential conflicts of interest with respect to the research, authorship, and/or publication of this article.
Funding
This work also received financial support from FCT as part of the project PTDC/EGE-ECO/28805/2017-Transport Infrastructure and Urban Spatial Structure: Economic, Social and Environmental Effects (TiTuSS).
Data availability
Supplemental Material
Supplemental material for this article is available online.
Author Biographies
Rui Colaço is a PhD Candidate in Territorial Engineering at Instituto Superior Técnico (IST), Universidade de Lisboa, Portugal. His research (at CERIS) is presently focused on retail location, e-shopping, and urban planning. Before, he worked for 15 years in the private and public sectors as a civil engineer and urban planner. His background is also in Territorial Engineering at the IST. Since Fall 2022, he is also a Fulbrighter (UCSB).
João de Abreu e Silva is an Associate Professor at Instituto Superior Técnico (IST), Universidade de Lisboa, Portugal, and a researcher at CEris. His main research interests are focused on travel behavior and its interactions with land use patterns and the role of transport in urbanization patterns. He is a member of two TRB standing committees, and of the International Steering Committee for the Travel Survey Conference (ISCTSC). and chair of the World Society for Transport and Land Use Research (WSTLUR).
References
Supplementary Material
Please find the following supplemental material available below.
For Open Access articles published under a Creative Commons License, all supplemental material carries the same license as the article it is associated with.
For non-Open Access articles published, all supplemental material carries a non-exclusive license, and permission requests for re-use of supplemental material or any part of supplemental material shall be sent directly to the copyright owner as specified in the copyright notice associated with the article.