
Abstract
Improving the built environment to support walking is a popular strategy to increase urban sustainability and walkability. In the past decade alone, many US cities have implemented crosswalk visibility enhancement programs as part of road safety improvements and active transportation plans. However, there are no systematic ways of measuring and monitoring the presence of key built environment attributes that influence the safety and walkability of an area, such as marked crosswalks. Furthermore, little is known about how these attributes change over time at a national scale. In this paper, we introduce an innovative approach using a deep learning-based computer vision model on Street View images to identify changes in intersection-level marked crosswalks around more than 4,000 US transit stations over a 14-year period. We found an increase in the overall number of marked crosswalks at intersections. Furthermore, high-visibility crosswalks became more common, as they replaced existing parallel-line crosswalks. We further examine crosswalks around transit stations in New York City and San Francisco to illustrate geographic variations and compare associations with other characteristics of the built environment as reported in the Smart Location Database. Areas with increases in high-visibility crosswalks focused on high density residential areas and areas with a higher percent of zero-vehicle households. However, geographic variations exist. For example, in San Francisco, transit station areas outside downtown or major corridors (South and Southwest of the city) had the lower prevalence of marked crosswalks. This analysis confirms important gaps in crosswalk visibility that call for safety enhancements and opens the door for additional research involving these data. We conclude by discussing the limitations and future research opportunities using computer vision to automatically detect large-scale transportation infrastructure changes at a relatively low cost.
Keywords
Introduction
Crosswalk visibility enhancements are considered effective measures to improve road safety at pedestrian crossing locations (Federal Highway Administration, 2018a, 2018b). According to the Federal Highway Administration (FHWA), crosswalk visibility enhancements can reduce crashes by 23–48% (Federal Highway Administration, 2018a). Following the federal guidelines, US cities have implemented crosswalk visibility enhancements as a part of road safety improvement or active transportation projects. Improved road safety can encourage more walking, and provide better pedestrian access to transit stations (Aston et al., 2020), which in turn promotes sustainable means of transportation. Particularly, high-visibility crosswalk markings often serve as a safety countermeasure to enhance the visibility of crosswalks compared with the standard parallel lines, though empirical evidence is mixed on the actual safety benefits (Zegeer et al., 2001). In fact, the safety benefit of marked crosswalks has been one of the most debated topics in pedestrian safety research for several decades (Mitman et al., 2008).
The lack of consistent, high-resolution longitudinal data makes it challenging to quantitatively measure how crosswalk visibility enhancements influence road safety, and, more broadly, to monitor the built environment attributes that promote sustainable mobility. To generate such data, prior studies have conducted manual inspections, either in person or by using digital imagery (Earls and Visher, 1997). For example, Mooney et al. (Mooney et al., 2016) manually labeled nine built environment characteristics including the presence of crosswalks at 532 intersections of New York City from Google Street View, to assess their association with pedestrian injury. Similar approaches (Boarnet et al., 2006; Clifton et al., 2007; Fox et al., 2015) have produced rich data elsewhere; however, they are similarly limited in spatial and temporal extent. OpenStreetMap (OSM) took a collaborative approach and let users freely edit its database. However, coverage is low and potentially biased in certain geographies: only 14.22% of all crossings have attributes that indicate the presence and categories of crosswalks and are mainly in European countries (OpenStreetMap, 2021). These crowdsourced labels are usually inconsistent and lack temporal resolution. Previous studies map the geographic distribution of marked crosswalks and its association with built environment factors using manual inventory methods such as audits. For example, in the City of San Francisco, Moran (2022) found that intersections exhibit crosswalk ‘corridor effects’ that often cluster along certain streets including commercial areas. Accurately identifying marked crosswalks at scale has the potential to generate data with much higher spatiotemporal coverage and enable large-scale analysis of the prevalence, placement, and impact of crosswalk enhancements.
The recent increase in resolution and coverage of satellite and Street View imagery, combined with advanced computing technologies including machine learning and artificial intelligence, offers an unprecedented opportunity to produce this data at scale (Li and Sheng, 2021). As is evident by several recent reviews, the application of computer vision on GSV has demonstrated emerging interests at the intersection of computer science and planning literature in the past decade. Particularly, the application of image classification, image segmentation, object detection, and representation learning on street view imagery has the potential to identify the presence or obtain fine-grained built environment measures (Li and Sheng, 2021). Despite this potential, few studies have implemented such approaches so far. Similarly, Crooks and See (2022) identified three areas of future applications of street-level imagery in urban planning: detection of urban change, predicting socioeconomic characteristics, and augmented reality and navigation. Relatedly, a recent National Academies Consensus Report on Strategies for Implementing Physical Activity Surveillance recommends the development of methods, including accelerating the use of computer vision, to assess street characteristics that can support walking (National Academies of Sciences, Engineering and Medicine, 2019). One example is Berriel et al. (2017), which developed a deep learning model to classify zebra crossings from high-resolution satellite imagery. However, Street View imagery offers several advantages over satellite imagery for urban infrastructure detection, most notably higher spatial resolution and fewer occlusions. There has been an abundance of work on developing computer vision algorithms for interpreting Street View images, mostly driven by the availability of labeled Street View datasets for model training and evaluation, such as CamVid (Brostow et al., 2008), the KITTI Vision Benchmark Suite (Geiger et al., 2013), Cityscapes (Cordts et al., 2016), and Mapillary Vistas (Neuhold et al., 2017). While recent studies have demonstrated the feasibility of using Street View images to detect built environment features, including surveillance cameras (Sheng et al., 2021), greenery (Li et al., 2015), buildings (Kang et al., 2018), and urban infrastructure such as utility poles (Zhang et al., 2018) and sidewalks (Ning et al., 2021), few have deployed the models for built environment feature extraction and generated a national-scale longitude dataset for further investigation.
In order to fill the current data gap, this study uses Google Street View imagery and a deep learning-based computer vision model to construct a publicly available longitudinal crosswalk dataset of 38,350 unique intersections within a 250-m buffer of 4,417 transit-oriented development (TOD) stations (Center for Transit-Oriented Development, 2021) in the United States annually from 2007 to 2020. In the rest of this paper, we will first describe the methods for compiling this dataset. Then, we will present findings from examining the patterns of station-area crosswalk enhancement over the years. Finally, we will discuss limitations and future research opportunities using this and other AI-generated built environment datasets.
Methods
We use Google Street View imagery as the data source for marked crosswalk detection due to its relatively low cost, high spatial resolution, and availability of historical images. We focus on TOD station areas in this study because pedestrian safety enhancement projects in proximity to transit station areas tend to be given higher priorities, and crosswalk improvements therefore are more likely to be prioritized.
Sampling and image acquisition
To balance geographic coverage with the number of image samples over time, we targeted intersections within 250 meters of 4,417 existing TOD stations from 77 transit agencies across the United States as of January 2021 (Center for Transit-Oriented Development, 2021). We extracted road networks including nodes and edges around each TOD station from OpenStreetMap (OSM) to locate intersections. Figure 1 shows the locations of all TOD stations and an example of selected intersections around two adjacent stations. The targeted area covers a total of 38,350 unique intersections. Selected TOD stations (N = 4,417) and an example of station-area intersections within 250-m buffers of two TOD stations in New Jersey.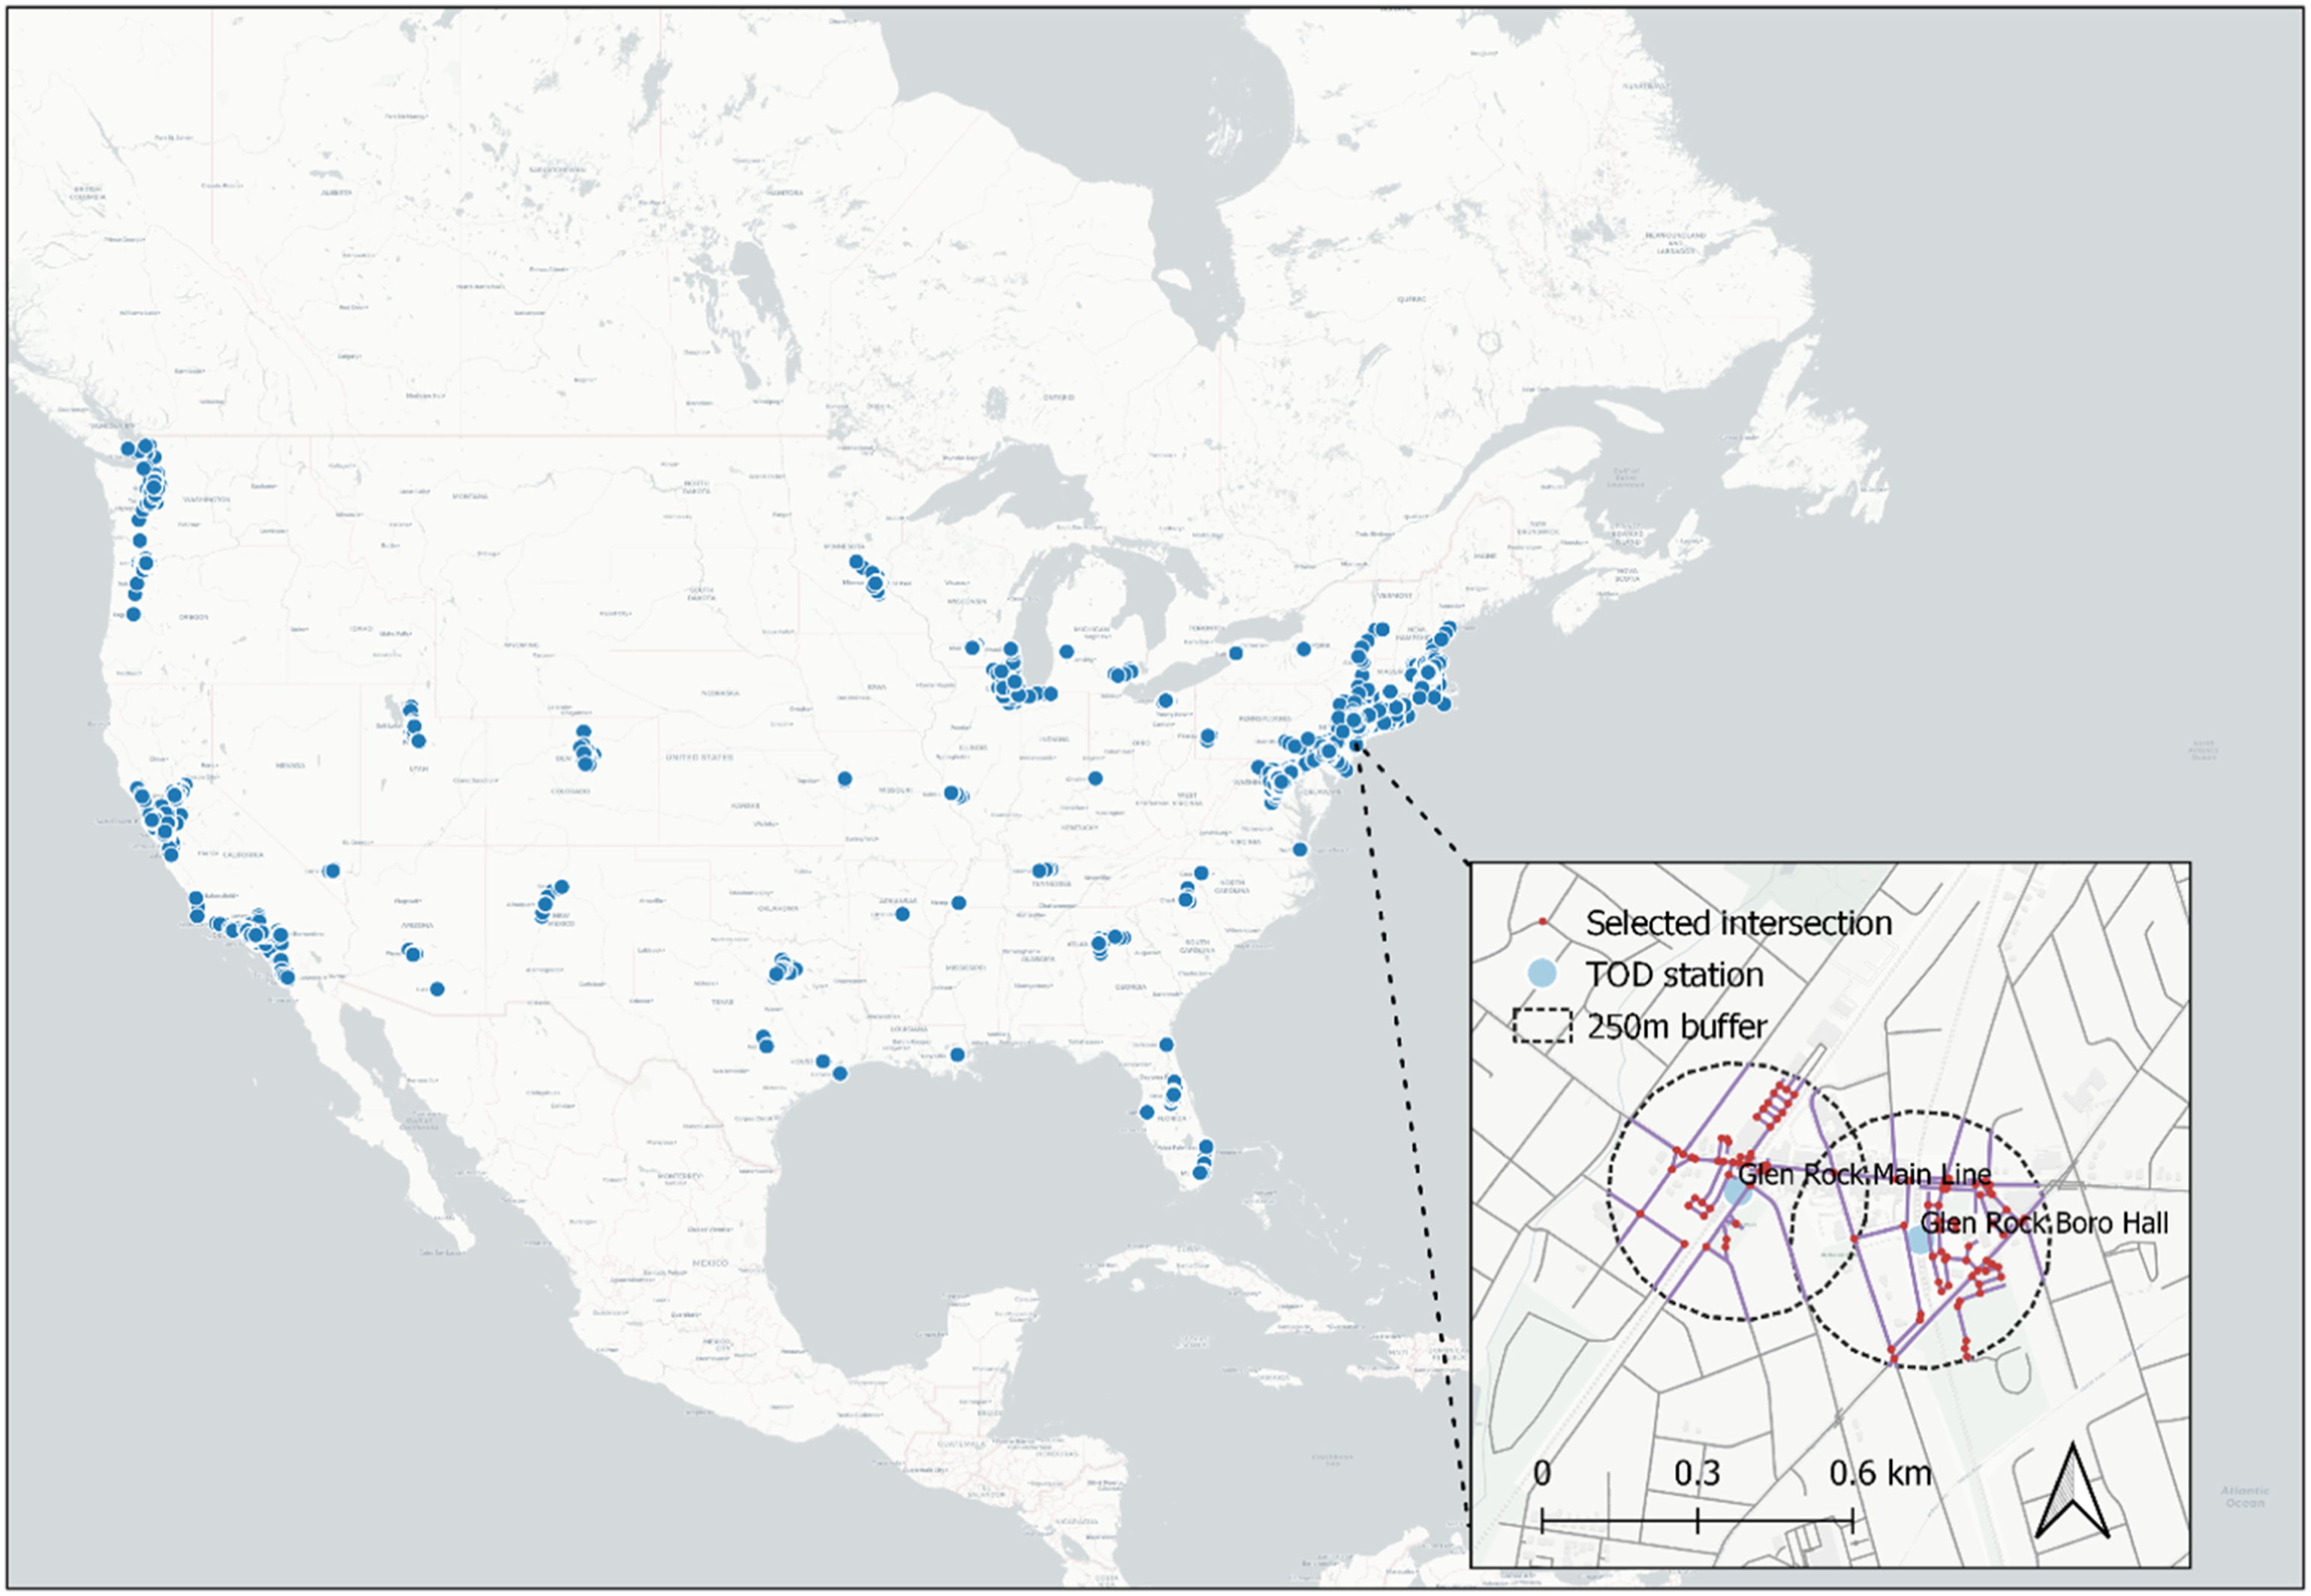
We obtained Google Street View imagery capturing all historical panoramas (360-degree views) within 15 meters of each intersection. For each year from 2007 to 2020, we selected the panorama closest to each intersection when more than one panorama was available. We removed all panoramas captured indoors. To minimize optical distortion, we used a flat horizontal pitch and split each 360-degree panorama into four 90-degree images of size 640 pixels by 640 pixels with North, East, South, and West headings, respectively. This gave us a total of 230,536 unique panoramas and 922,144 images. On average, each intersection has 6 years of Street View images available out of the 14 consecutive years (2007–2020) investigated. Figure 2 shows the coverage of Street View imagery throughout the 14-year period. Most of the years have more than 20% of the intersections covered by Google Street View. Notably, there is a significant drop in Google’s archived Street View images in 2010. Percentage of intersections with Google street view images, 2007–2020.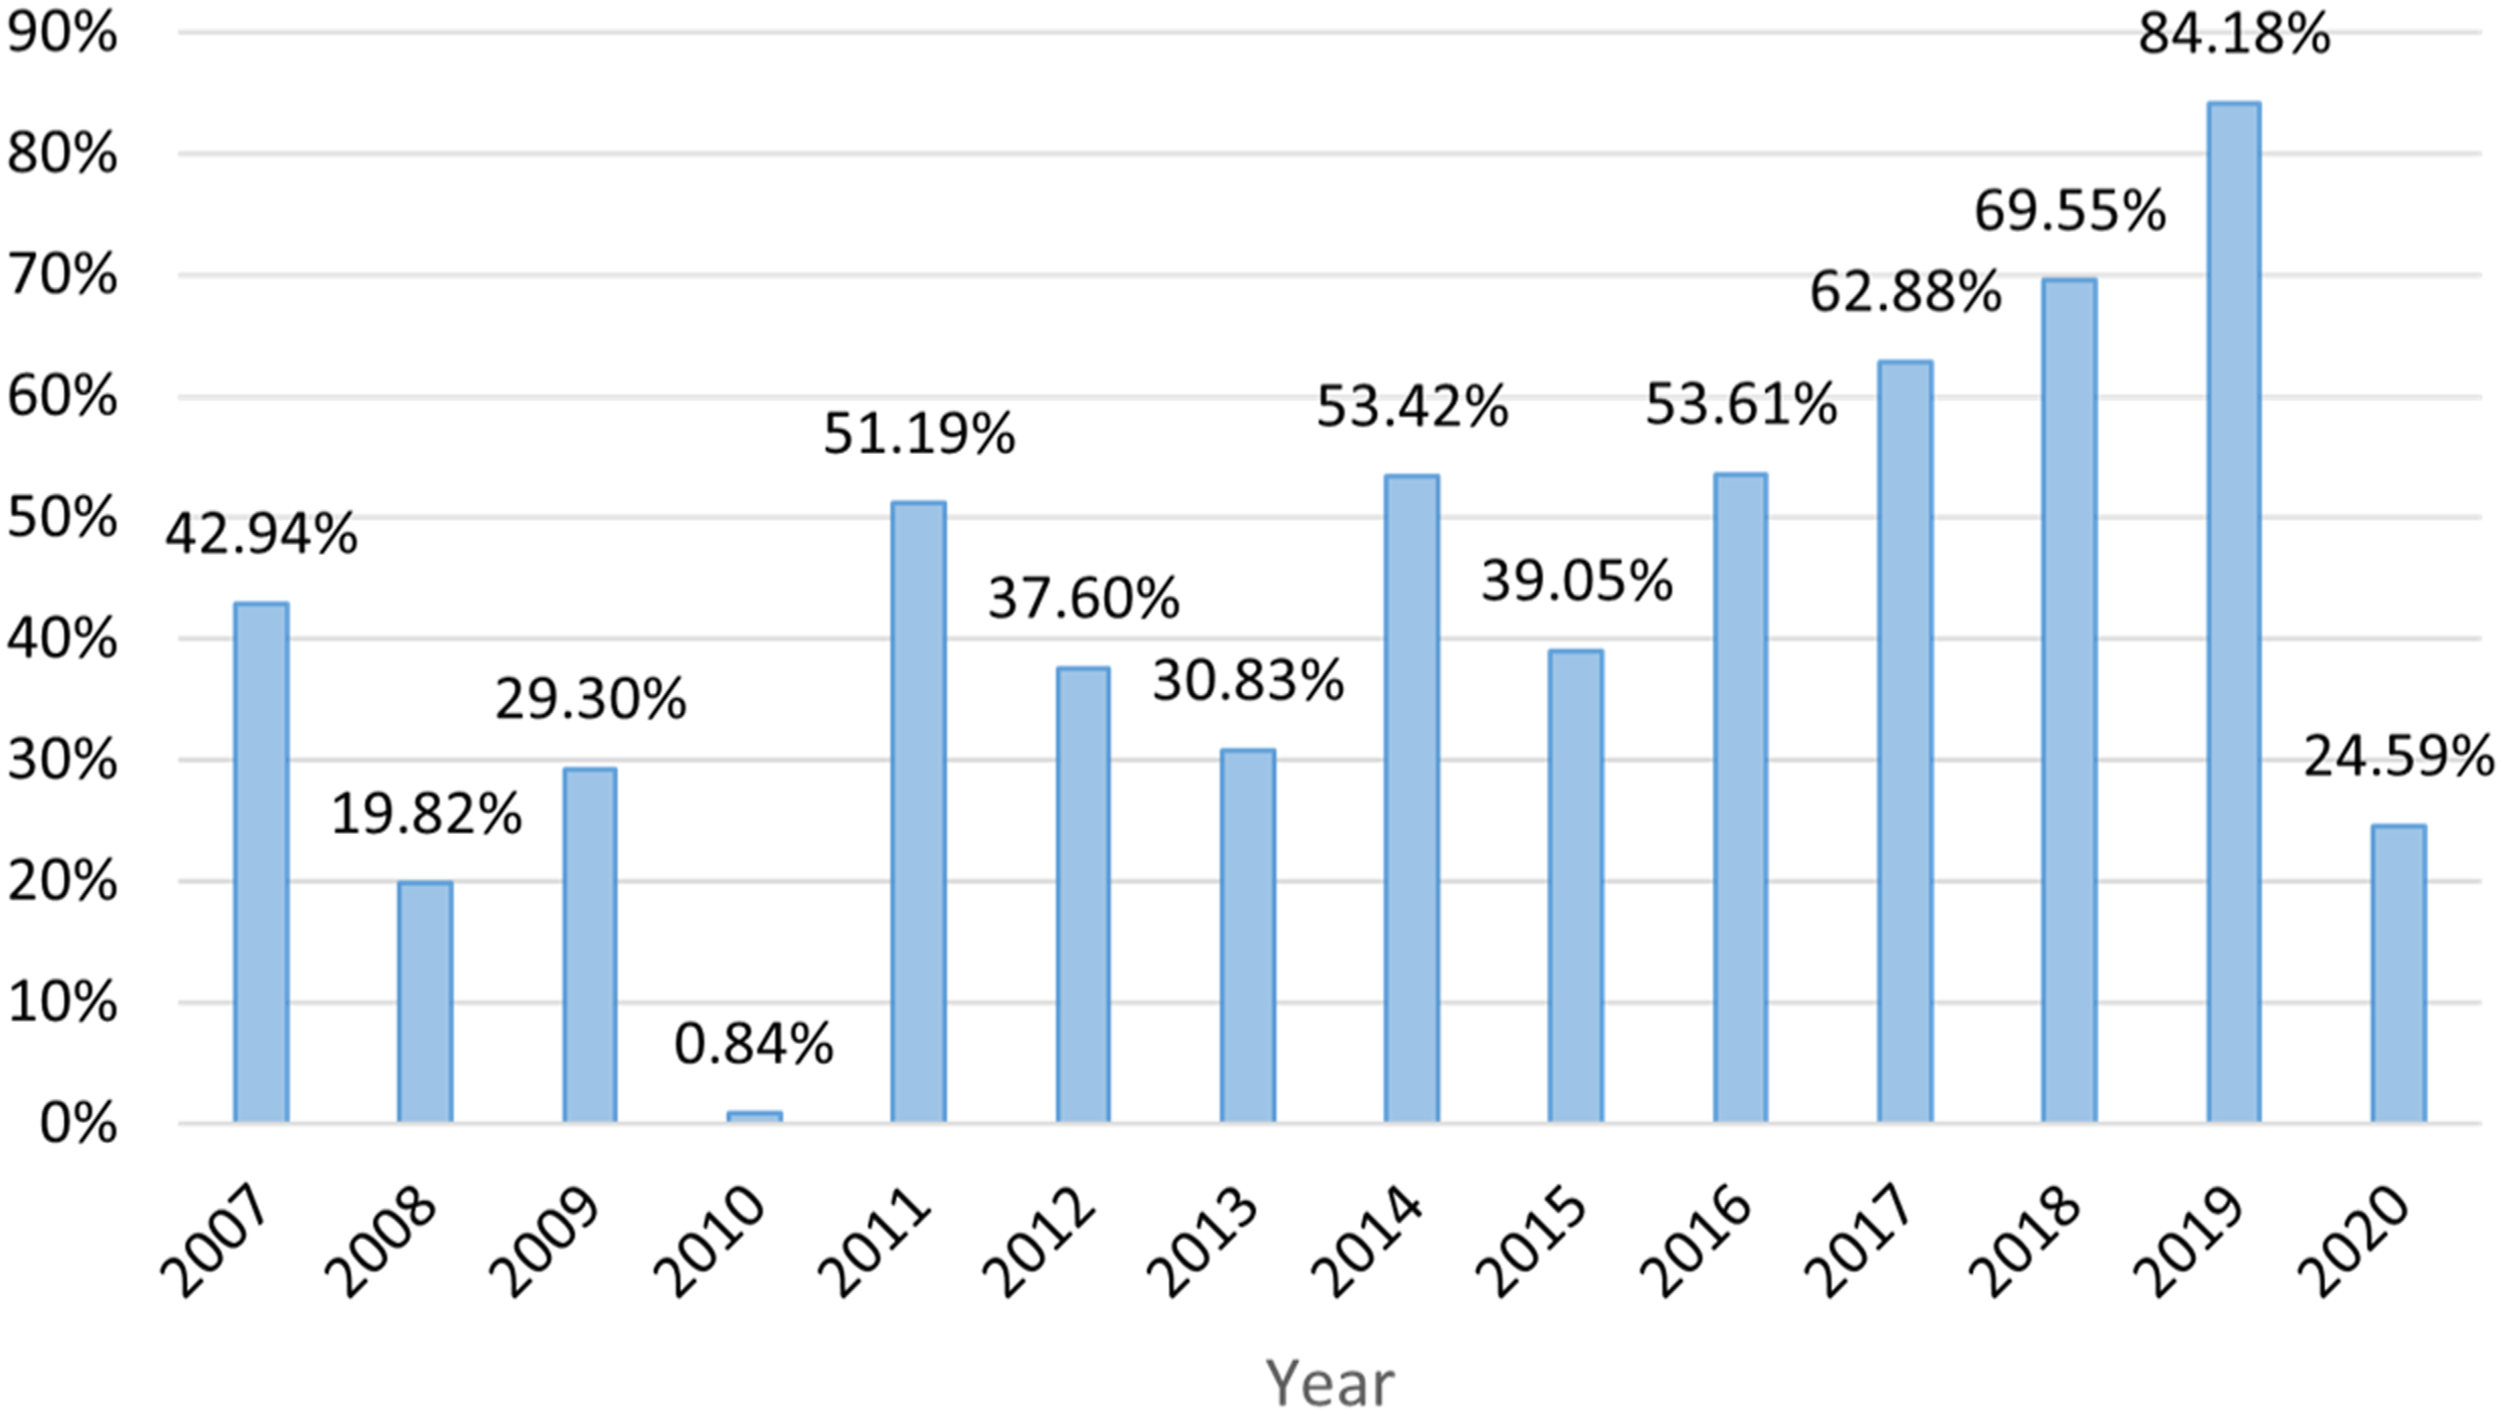
Summary statistics of TOD area intersection coverage by transit agency.
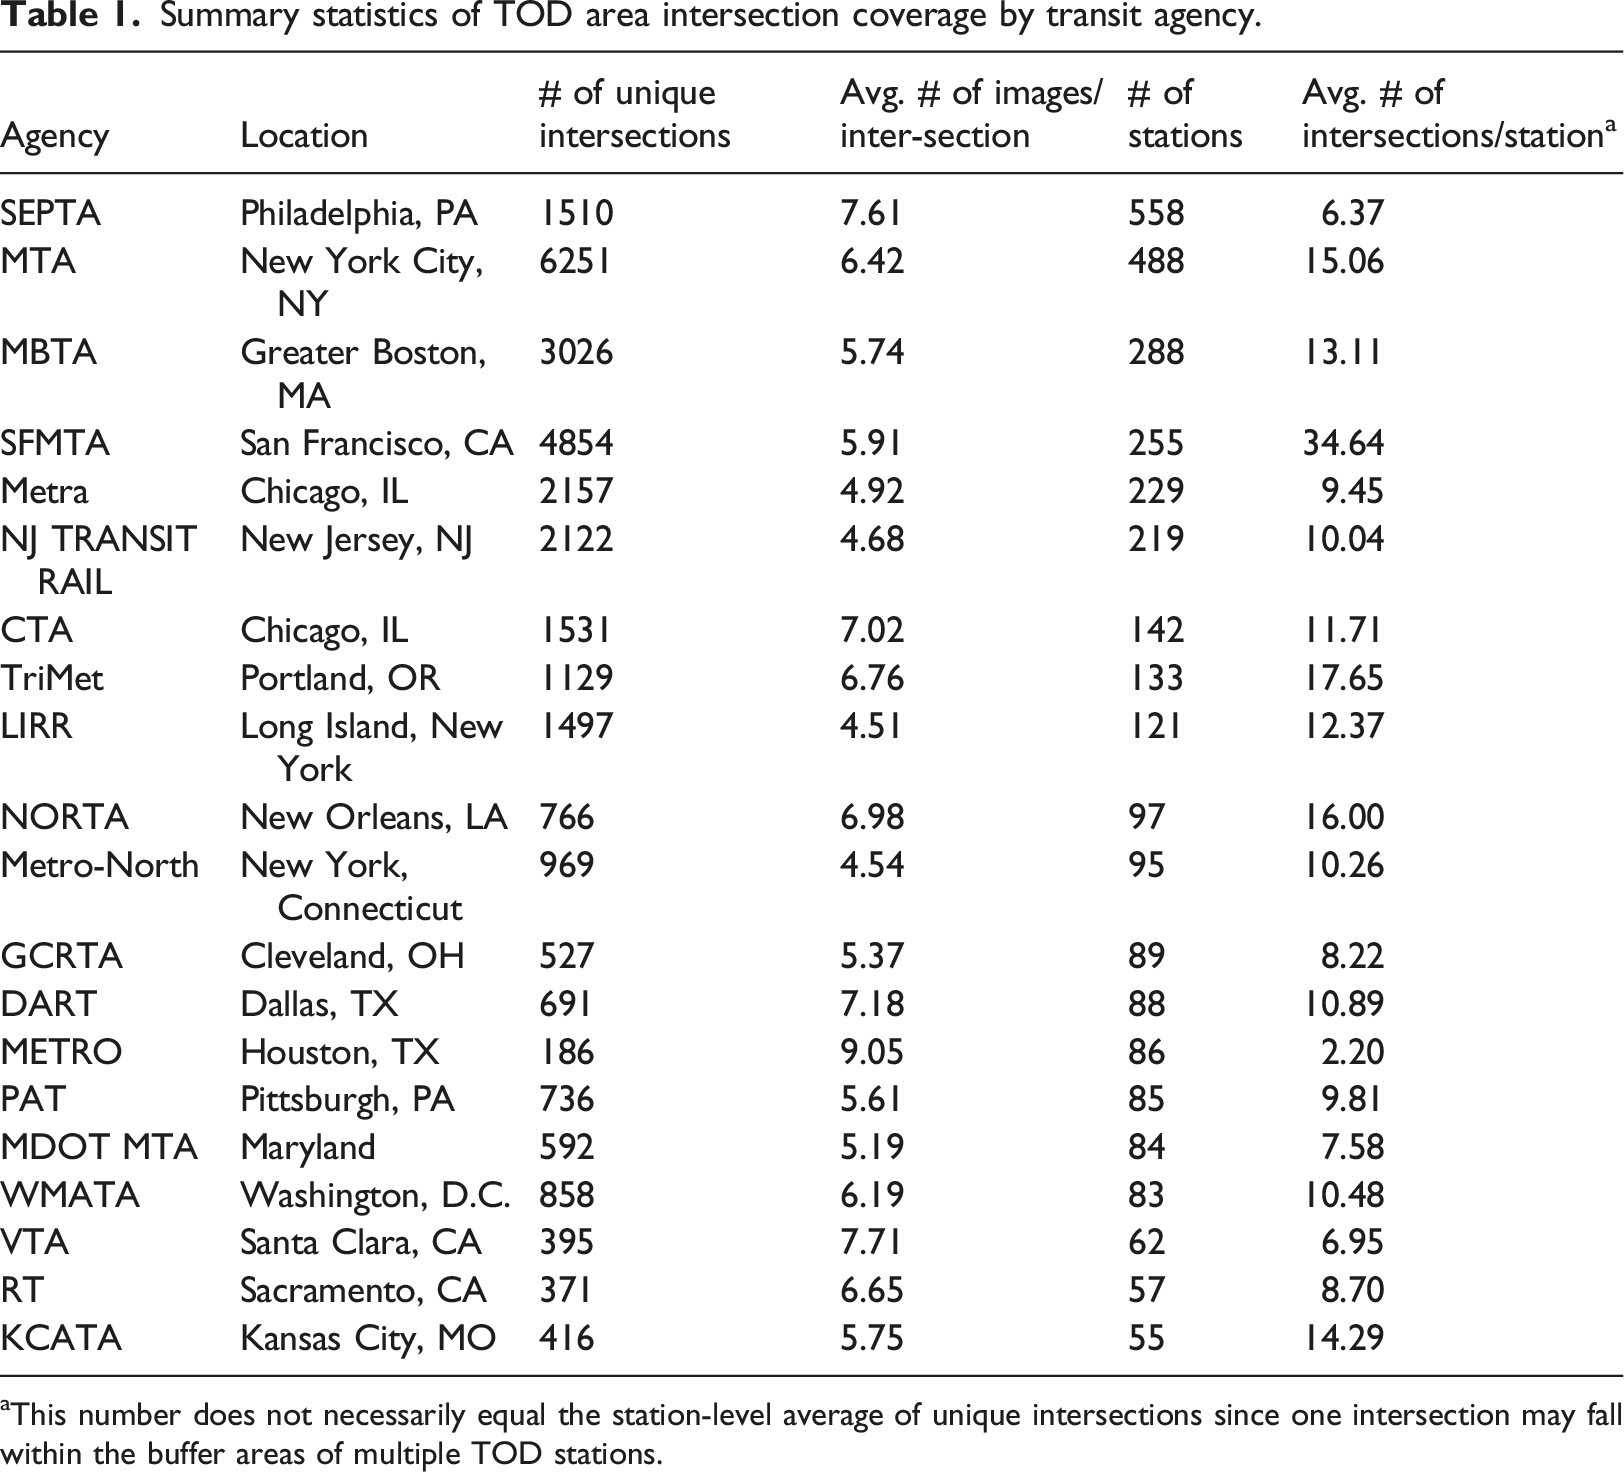
aThis number does not necessarily equal the station-level average of unique intersections since one intersection may fall within the buffer areas of multiple TOD stations.
Model development
We developed a deep learning-based object detection model trained on 4,925 hand-labeled Google Street View images to automatically detect the number of marked (parallel-line and high-visibility) crosswalks in each image (Figure 3). We explored several ways to classify different types of marked crosswalks, considering model performance, practicality, and policy relevance. We categorized marked crosswalks into parallel-line and high-visibility crosswalks which includes all but the simple parallel-line crosswalks commonly seen in the US, while the patterns of high-visibility as a result of crosswalk enhancement projects vary among jurisdictions. High-visibility crosswalks include a variety of marked crosswalks such as ladder, continental, or diagonal markings (Federal Highway Administration, 2009). The training sample was selected from the inventory of all available Google Street View historical images and balanced across urban and suburban areas. Examples of crosswalk detection from street view imagery.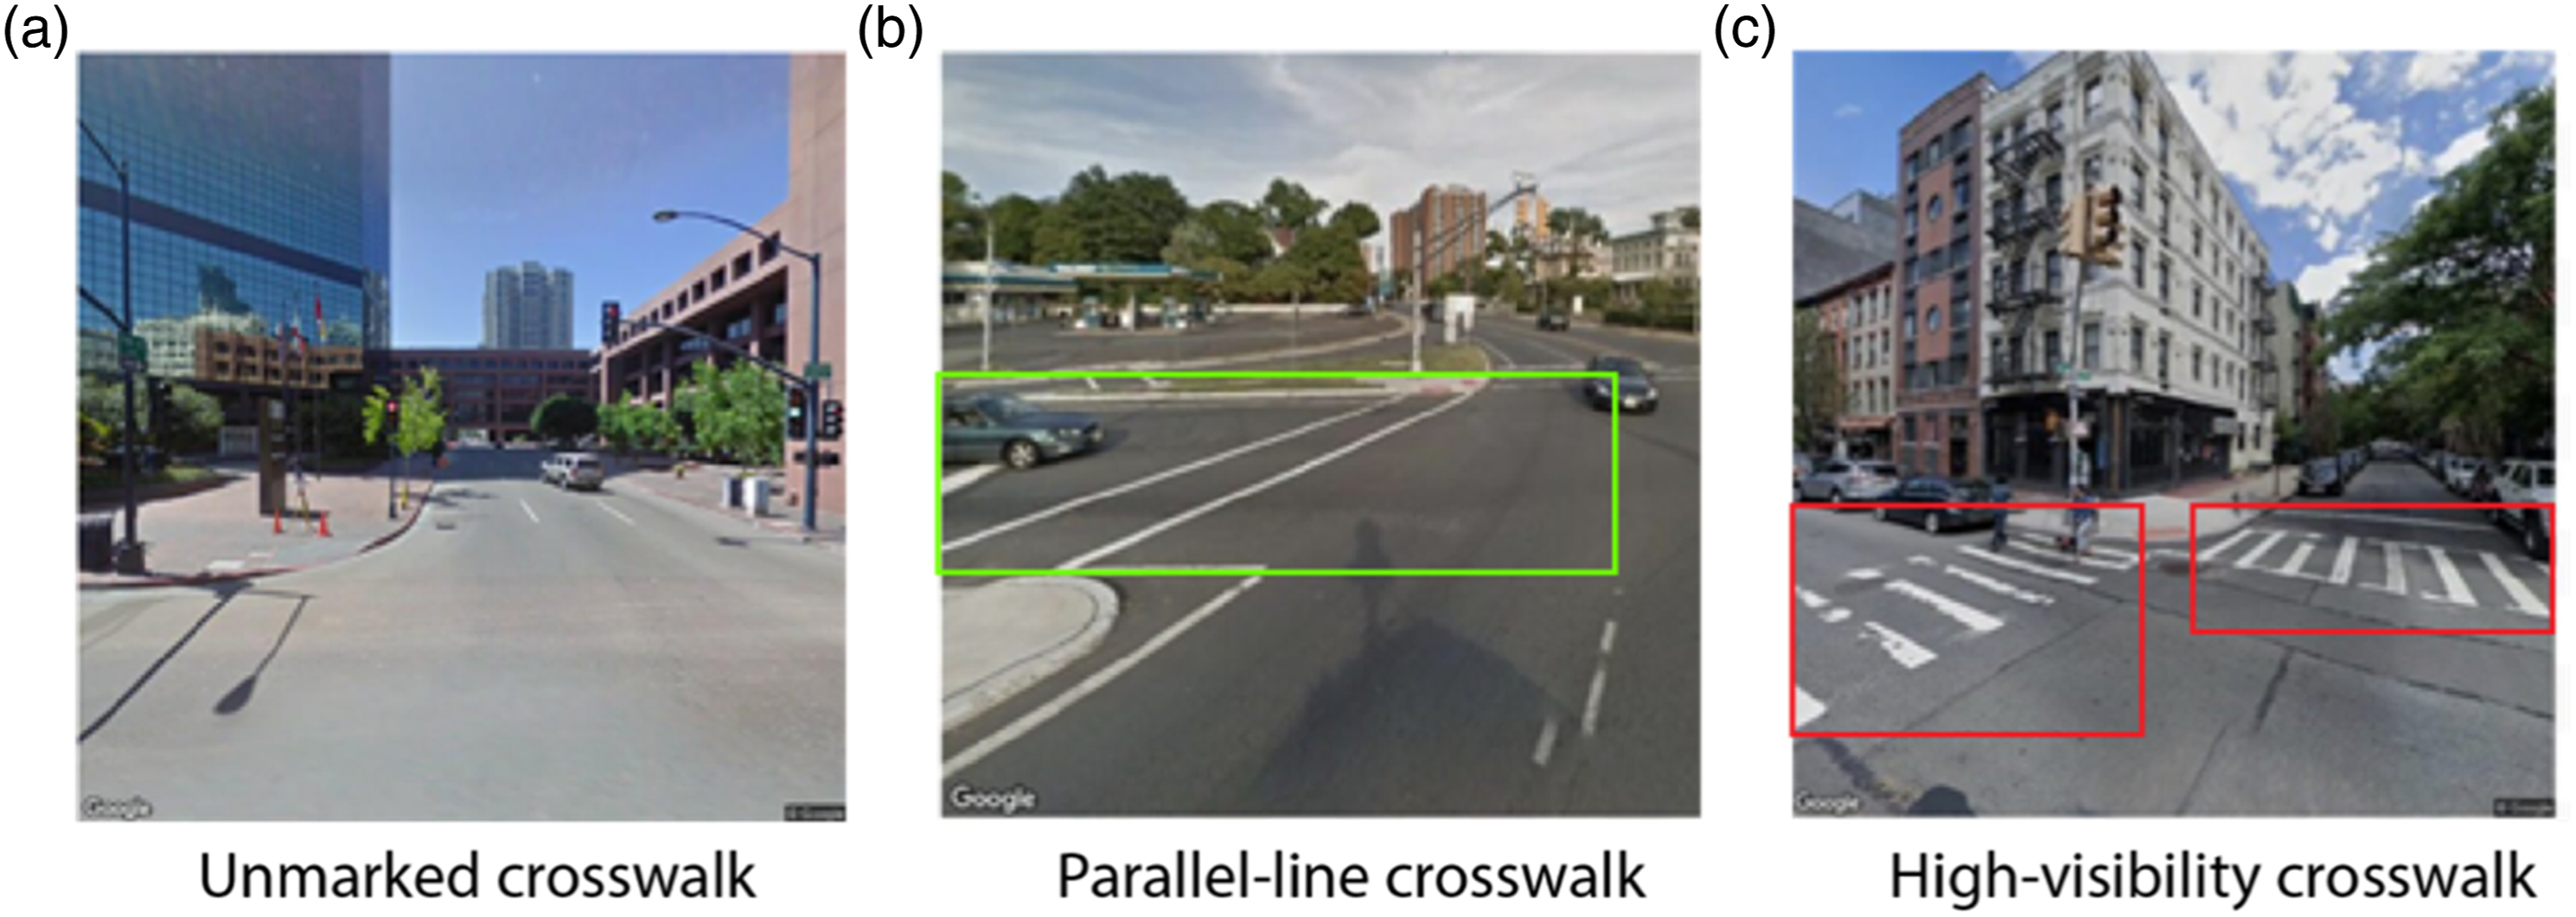
We annotated the images using a labeling service which specializes in annotating training images for computer vision. One of our research experts with domain knowledge in transportation planning performed quality analysis/quality control of all labeled images. Erroneously labeled images as determined by the expert were relabeled by the label provider. Each image in the dataset was annotated with bounding box labels around all instances of the marked crosswalks in the image. Partially present crosswalks were also labeled. In total, we have 1,440 instances of unmarked crosswalk, 2,428 instances of parallel-line crosswalk and 4,592 instances of sidewalks annotated. The labeled dataset was split into a training set (N = 2,872) to learn model parameters, a validation set (N = 1,144) to select model hyperparameters, and a test set (N = 909) to evaluate the performance of the best model on previously unseen examples. The training, validation, and test sets were sampled to ensure images from the same TOD stations were in the same set.
We developed convolutional neural networks (CNNs) to identify parallel-line and high-visibility crosswalks from street-level imagery automatically. The specific CNN architecture explored was FasterRCNN (Ren et al., 2015). Although ResNet101 performed slightly better than ResNet50, ResNet101 is ∼5x slower than ResNet50 so we decided to use ResNet50 to significantly expedite deployment time. The model takes an image as input and produces bounding box predictions where each bounding box is associated with a confidence score and a classification of the box into one of the crosswalk types. The network was optimized using stochastic gradient descent with an Adam optimizer (Kingma and Ba, 2017). We experimented with learning rates on a logarithmic scale from 0.0001 to 0.5, and two initialization schemes, including random initialization and initialization of weights from a network pre-trained on ImageNet (Deng et al., 2009). We trained the networks for 20 epochs, evaluated the networks on the validation set after each epoch, and saved the checkpoint that achieved the highest performance on the validation set. We additionally investigated the impact of data augmentation and variation of the balancing ratio between the aforementioned two datasets. Before input to the network, all images were center cropped to square dimensions and resized to 500 by 500 pixels. We explored additional random data augmentation during training, including random crops, flips, affine transformations, salt and pepper noise, and elastic transformations. When pre-training the network on ImageNet, images were normalized using the mean and standard deviation of the images in the ImageNet training set before being input to the network. We determined the best model by choosing the model which achieved the highest average precision (AP) score on the validation set.
We evaluated the best model on the test set using a variety of metrics including AP, precision, recall, and F1. For each image, the model can produce multiple bounding boxes, where each bounding box is associated with a confidence score. We first use AP to evaluate the performance of the model across all confidence score thresholds using a 0.5 Intersection-over-Union (IoU) threshold (only count a detection as a match if the IoU between the predicted bounding box and ground truth bounding box is higher than 0.5). The best model achieved an average precision (AP) of 0.63 for detecting parallel-line crosswalks, an AP of 0.71 for high-visibility crosswalks, and an overall AP of 0.69 on the test set. To determine the confidence score at which bounding boxes are kept, we choose a threshold to maximize the F1 score on the validation set. At this threshold, the model achieved an overall precision of 0.68, a recall of 0.94, and an F1 score of 0.79 on the test set.
Model deployment and imputation
We deployed the model to all 922,144 historical images obtained from Google Street View, which produced the number of parallel-line and high-visibility crosswalks detected at each intersection. Only 402 (∼1%) of the 38,350 unique intersections do not have any Street View images within 15 meters throughout the years. We dropped these intersections from the final dataset.
We used a combination of deep learning model prediction and imputation to infer the number of parallel-line and high-visibility crosswalks at each intersection in each year between 2007 and 2020. We deployed the best model to detect parallel-line and high-visibility crosswalks at each intersection in a particular year whenever the Street View image is available. For each Street View image, the model outputs bounding boxes indicating either parallel-line or high-visibility crosswalks (Figure 4). We combined the four 90-degree images from each panorama by summing up the number of bounding boxes locating parallel-line and high-visibility crosswalks. Since one crosswalk could be present in more than one image, the total number of parallel-line or high-visibility crosswalks per panorama ranges from 0 to 18. Schematic diagram of model deployment.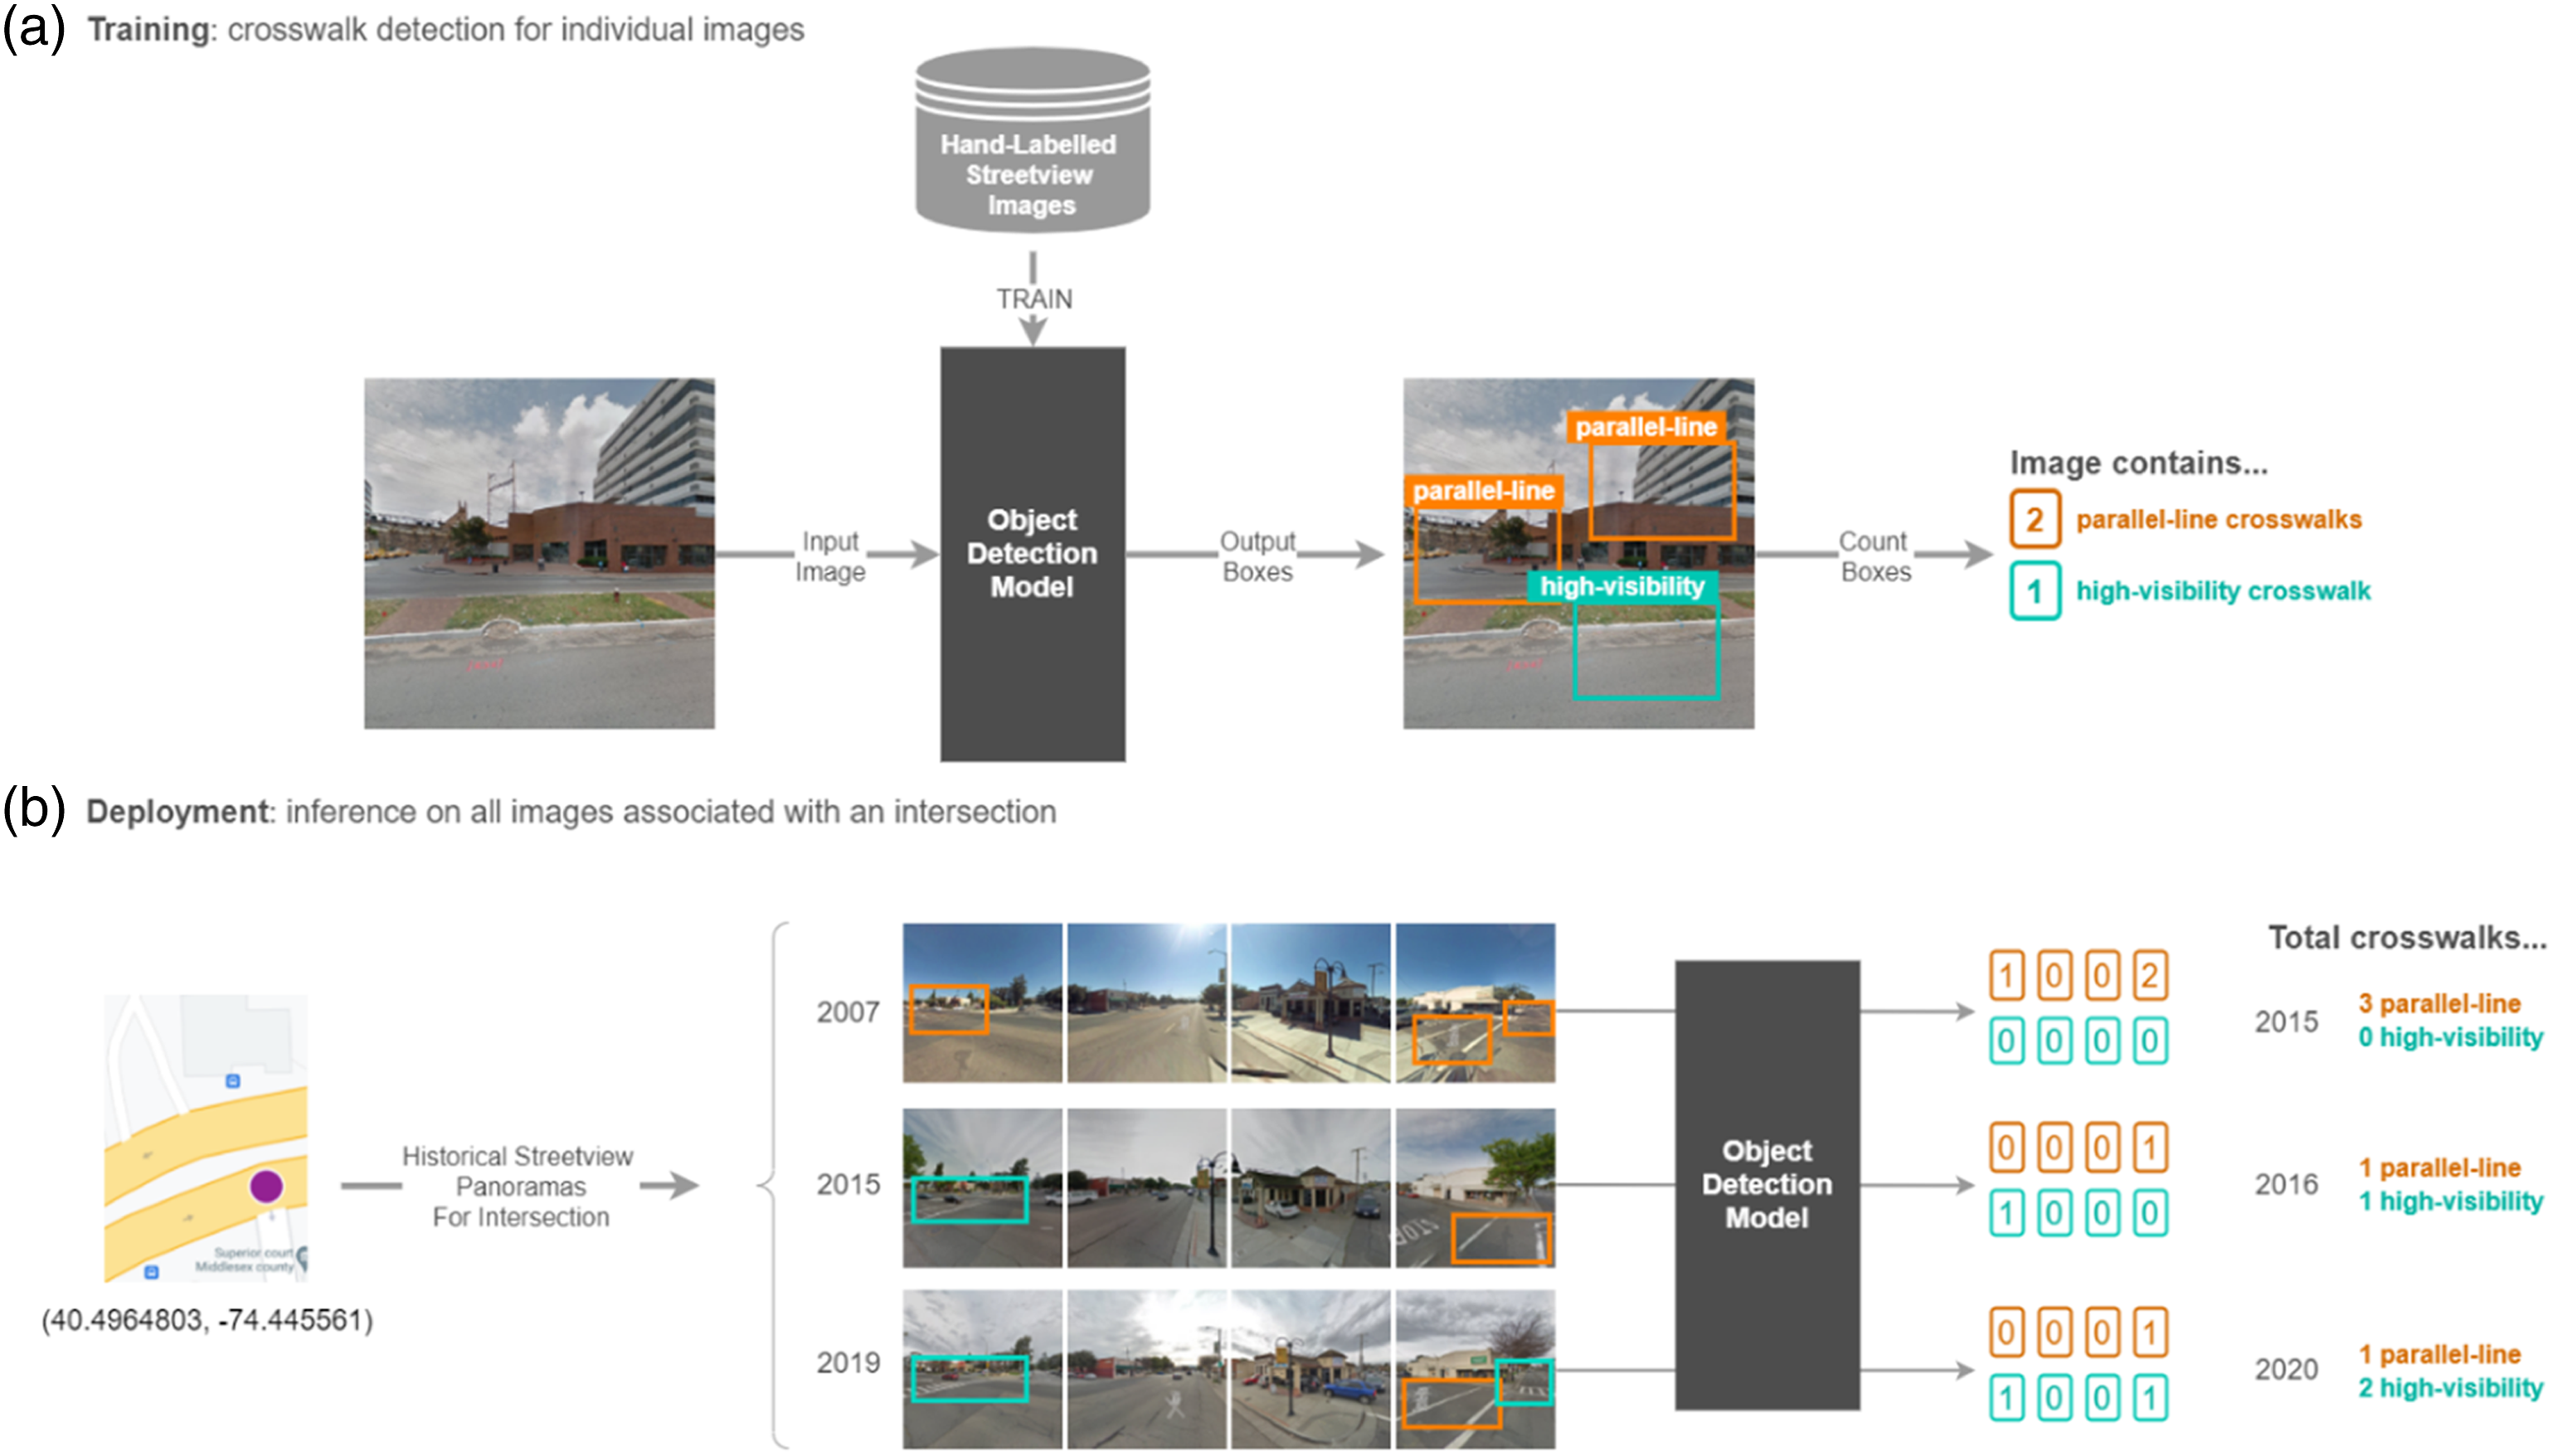
Example of the imputation process at one intersection.
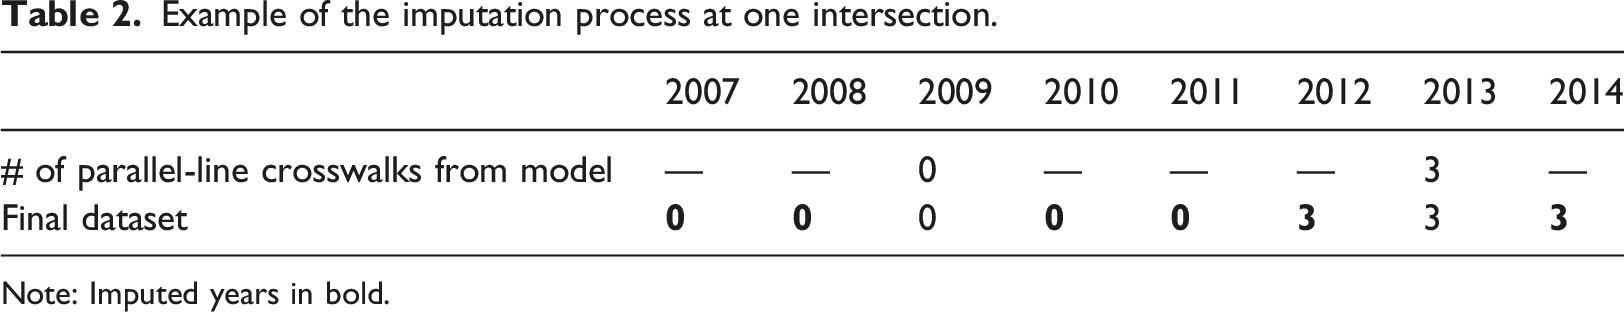
Note: Imputed years in bold.
The final dataset includes the inference results of crosswalk counts per category at 51,746 intersections 1 corresponding to 4,417 transit stations and 77 transit agencies for 14 consecutive years between 2007 and 2020.
Findings
The national-scale dataset provides numerous opportunities for examining station-area pedestrian access over time. We present three major findings from our exploratory analysis in the following section.
1. There is a notable increase in marked crosswalks, and a shift from parallel-line to high-visibility crosswalks between 2007 and 2020
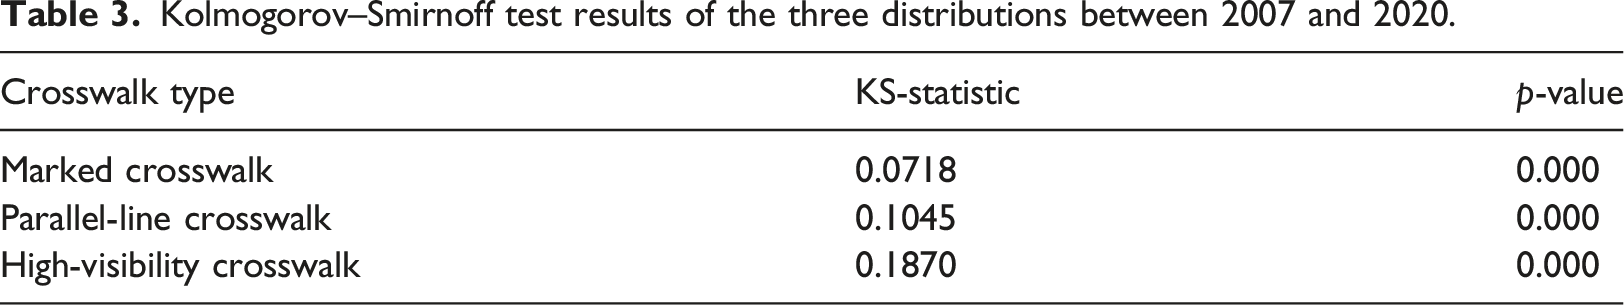
Figure 5 shows the distribution of the number of marked crosswalks as well as changes in estimated number of parallel-line and high-visibility crosswalks detected by our model at the 51,746 transit-adjacent intersections in 2007 and 2020. There has been an overall increase in the number of marked crosswalks including both parallel-line and high-visibility crosswalks as shown by the decrease of intersections with no marked crosswalk, and a shift of distribution to higher numbers of crosswalk occurrence. The medians are shown by dashed lines. Histogram of number of marked crosswalks at each intersection in 2007 and 2020 (N = 38,350). Median shown by dashed line (medians are the same in both years for parallel-line crosswalks).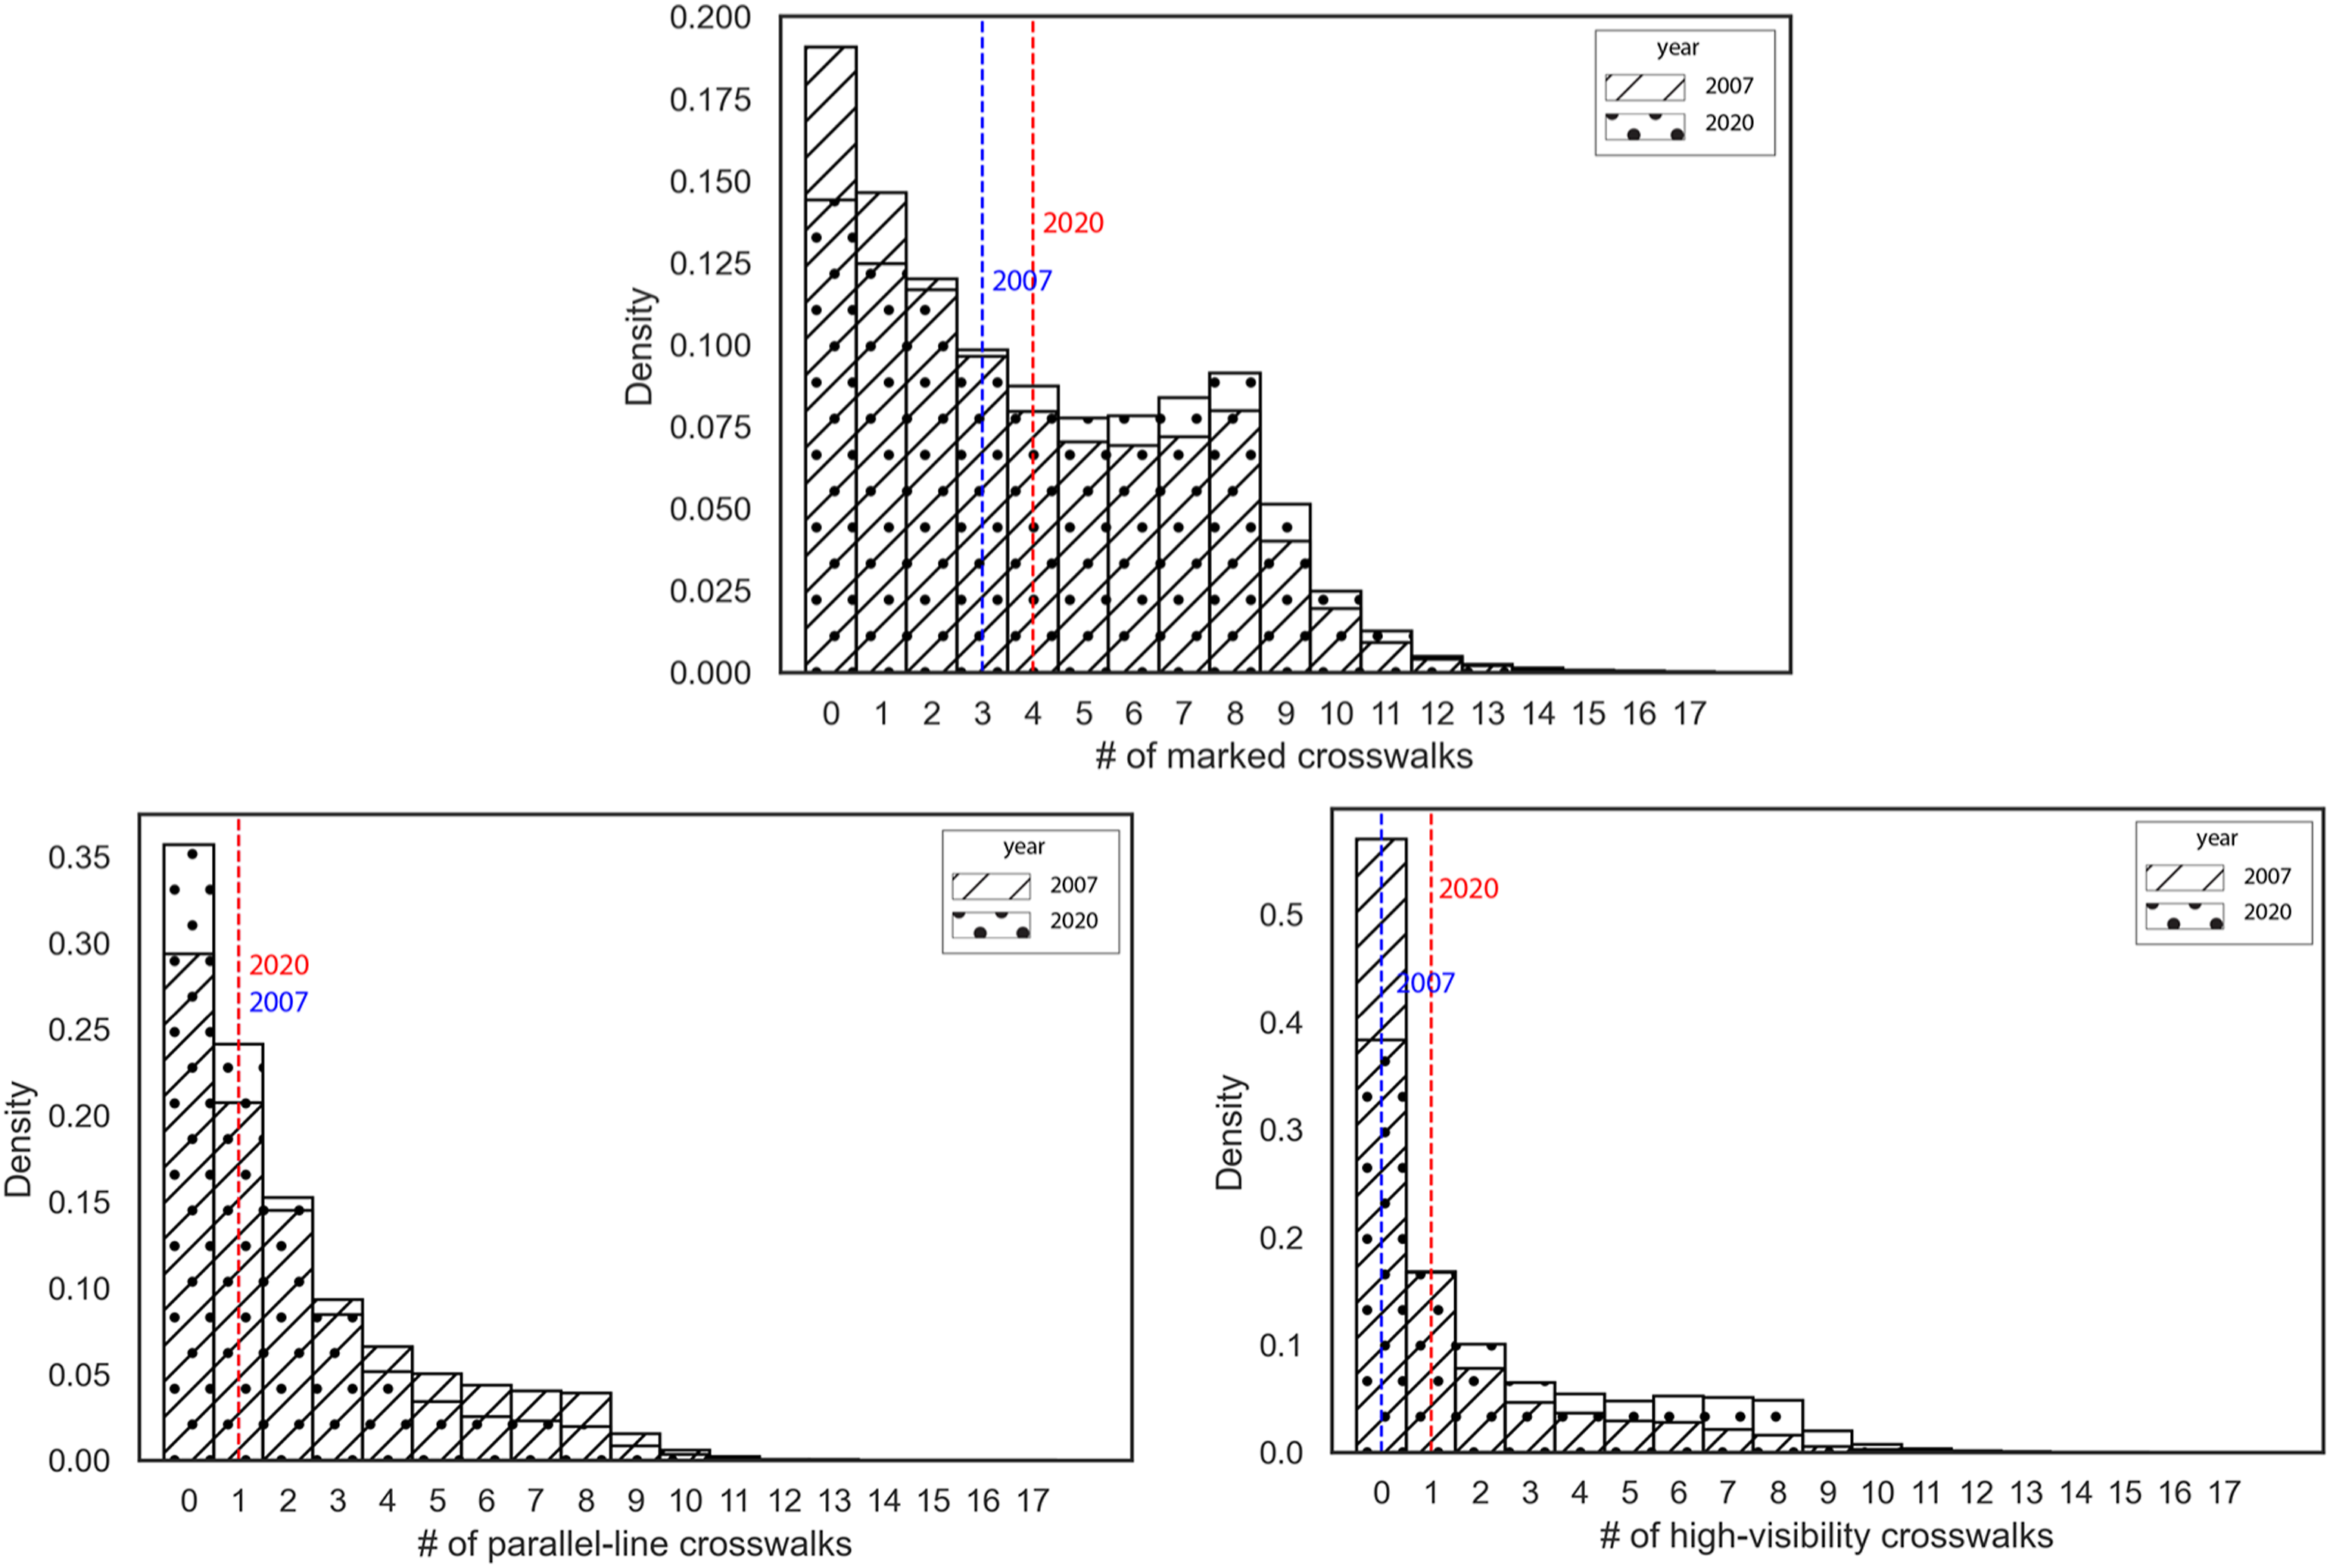
Kolmogorov–Smirnoff test results of the three distributions between 2007 and 2020.
The percentage of intersections with no marked crosswalk in the sample decreased from 19.1% in 2007 to 14.4% in 2020. Similarly, the percentage of intersections with parallel-line crosswalks decreased from 70.7% to 64.3%, while the percentage of intersections with high-visibility crosswalks significantly increased from 43.0% to 61.7%. Such a pattern and shift to high-visibility crosswalks is evident by the increase in the average number of marked and high-visibility crosswalks per intersection. Taken together, this shows noteworthy increases in crosswalk visibility enhancements by installing marked crosswalks and upgrading parallel-line crosswalks to high-visibility crosswalks.
2. Growing trend in the overall number of marked crosswalks and upgrading to high-visibility crosswalks is consistent across the United States, and throughout 2007 and 2020 period, but with regional variation
There is a substantial increase in the overall number of marked and high-visibility crosswalks over the years (Figure 6). Before 2011, the number of marked crosswalks steadily increased, due to the rapid increase in high-visibility crosswalks. The number of parallel-line crosswalks was almost constant during this period. After 2011, the total number minimally increased, with high-visibility crosswalks replacing parallel-line crosswalks. The number of high-visibility crosswalks eventually caught up with the number of parallel-lines crosswalks in 2017. The trend persists after 2017 with high-visibility crosswalks becoming most prevalent in transit station-area intersections. While over 80% of the intersections at each TOD station area have been covered by either parallel-line or high-visibility crosswalks throughout the period, the average percentage of intersections with high-visibility crosswalks increased from 40.9% in 2007 to 59.0% in 2020. Top: average number of marked crosswalks per intersection (N = 38,350), 2007–2020; Bottom: Average percentage of intersections with marked crosswalks at each TOD station area (N = 4417), 2007–2020.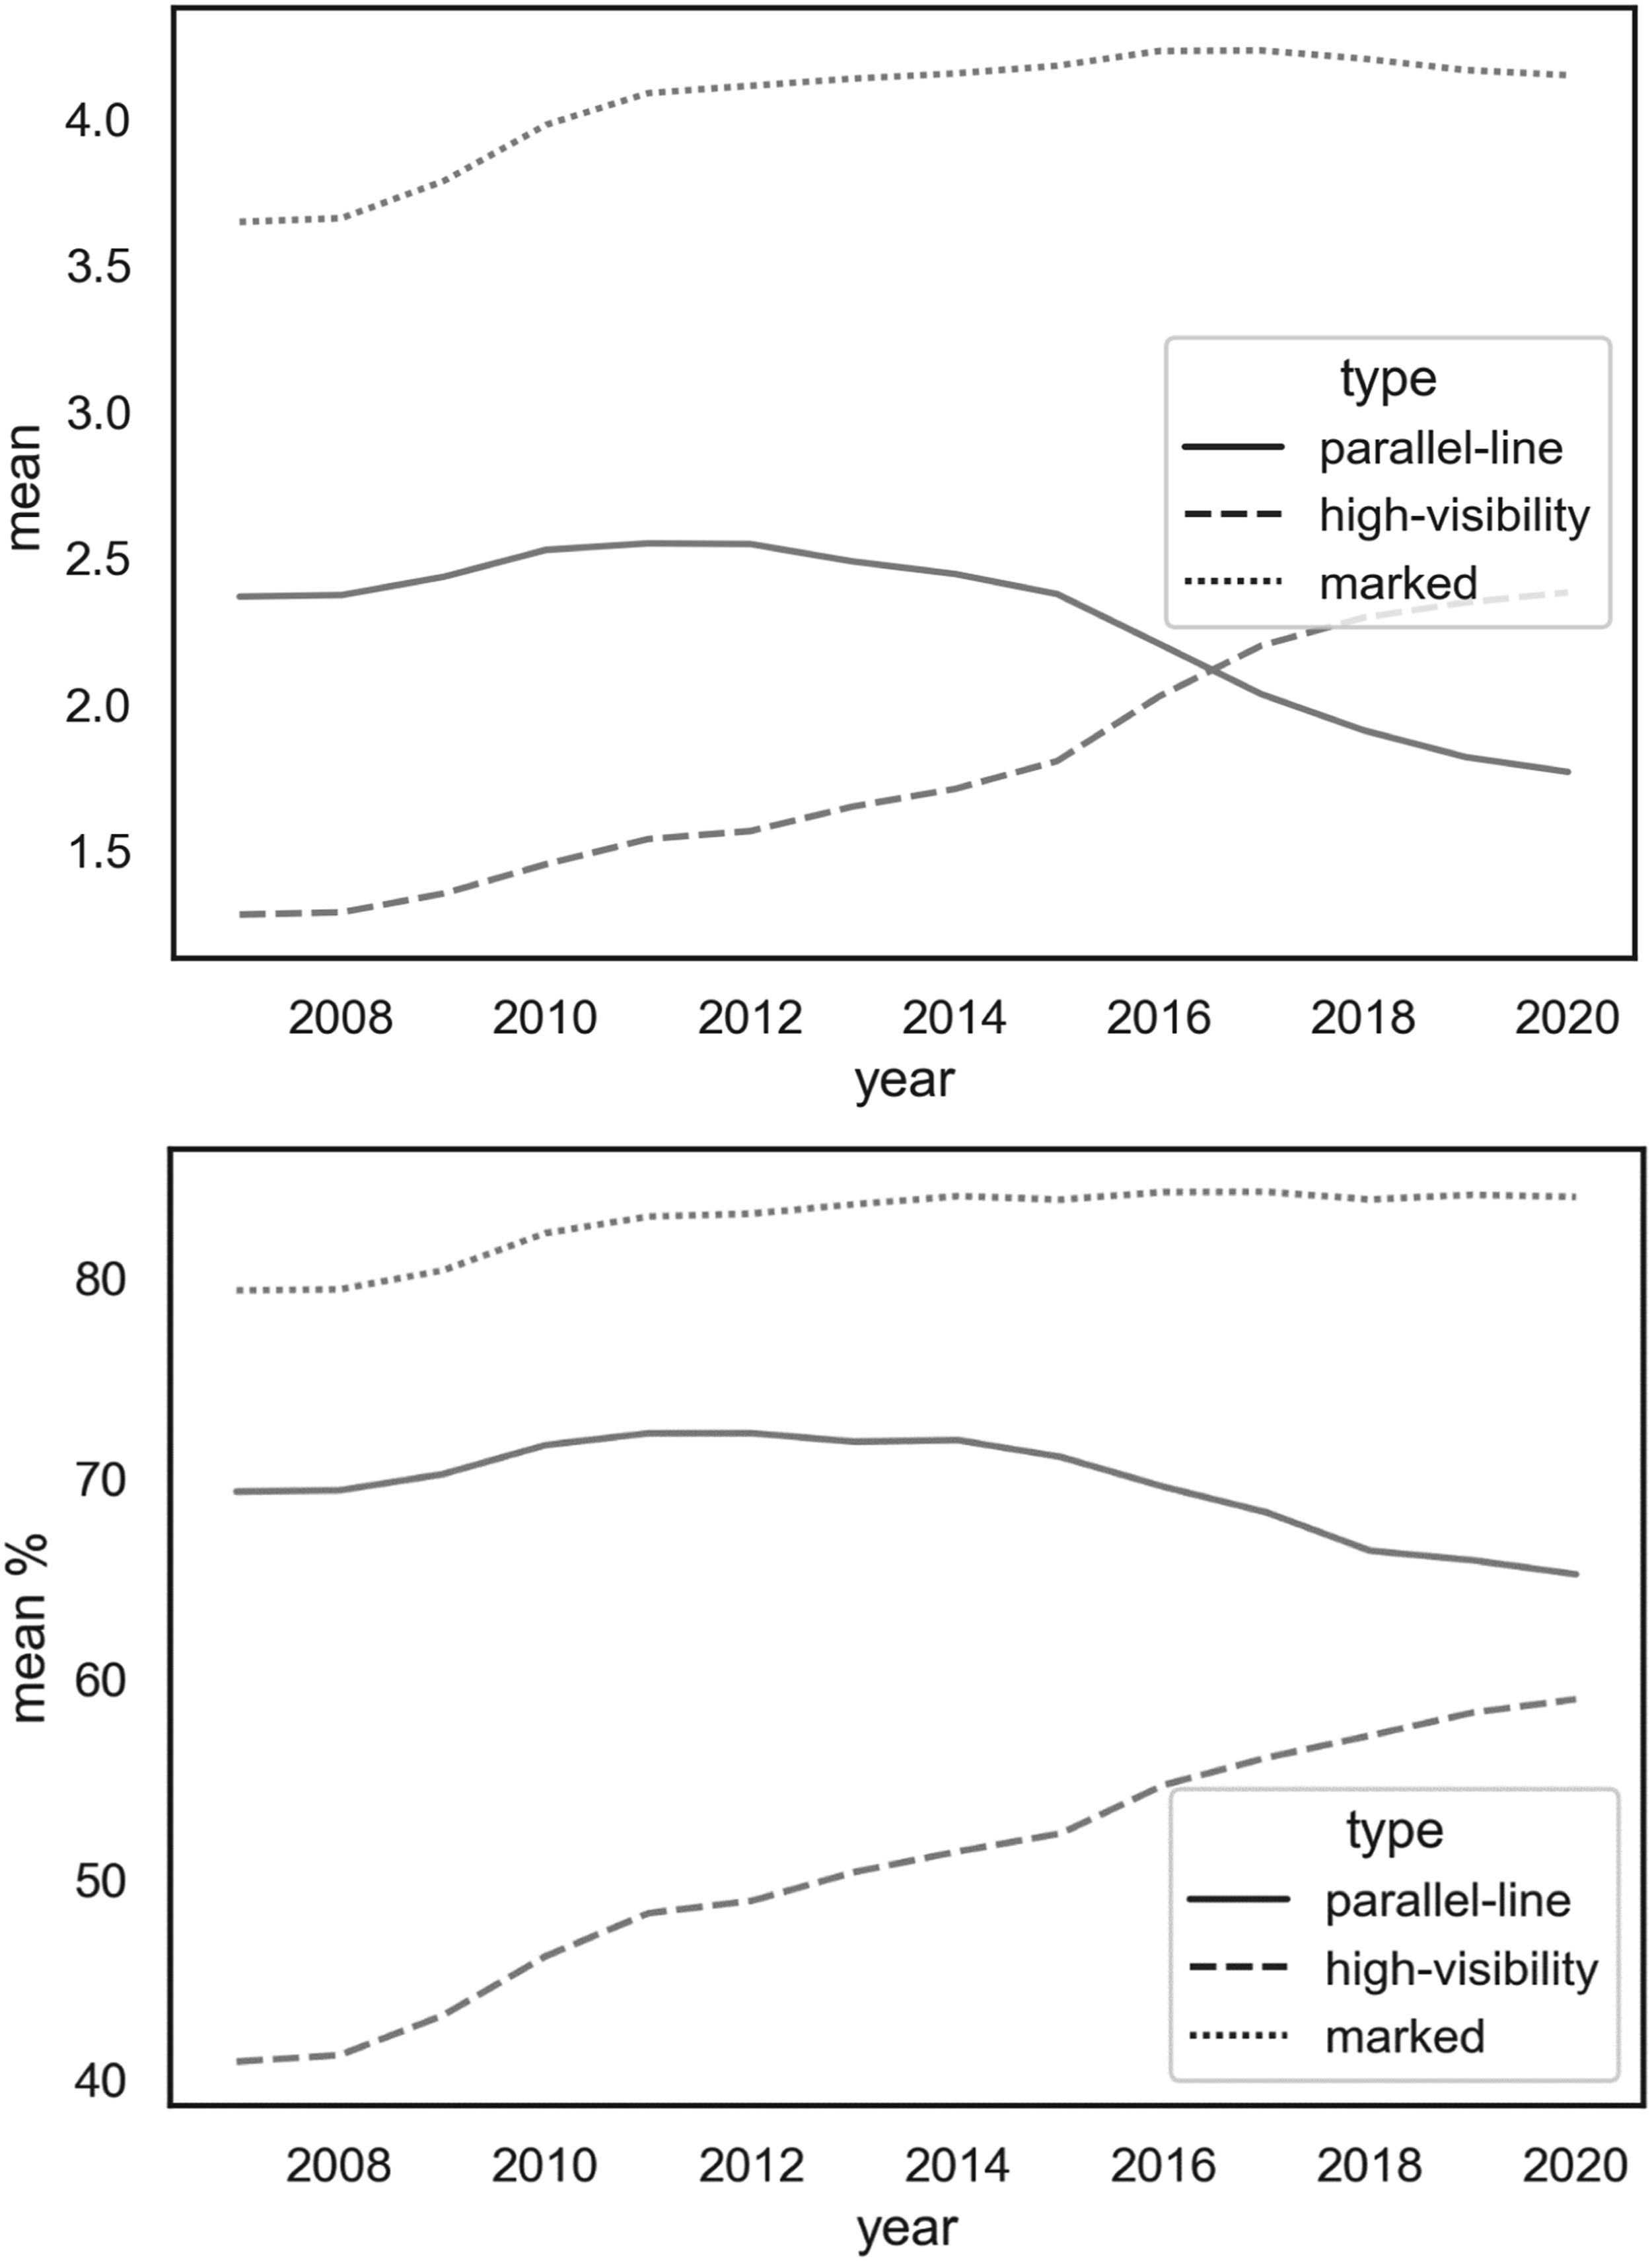
The pattern of upgrading to high-visibility crosswalks is consistent across the country. Figure 7 shows the growing trend of marked crosswalks and high-visibility crosswalks in station areas of 10 transit agencies with the highest service areas intersection density. However, regional variation exists among these dense transit service areas. In 2007, the percentage of intersections with marked crosswalks ranged from more than 95% in New York City (service area of MTA) to less than 80% in Boston, Long Island, and Chicago (service areas of MBTA, LIRR, and Metra). The areas starting with the lowest crosswalk coverage appear to have the fastest rate of growth, catching up with the other agencies by the end of the period. By 2020, all agencies have more than 80% coverage of marked crosswalks at service area intersections. Percentage of intersections with crosswalks at station areas of 10 major transit agencies, 2007–2020. Top: marked crosswalks (including parallel-line and high-visibility crosswalks); Bottom: high-visibility crosswalks.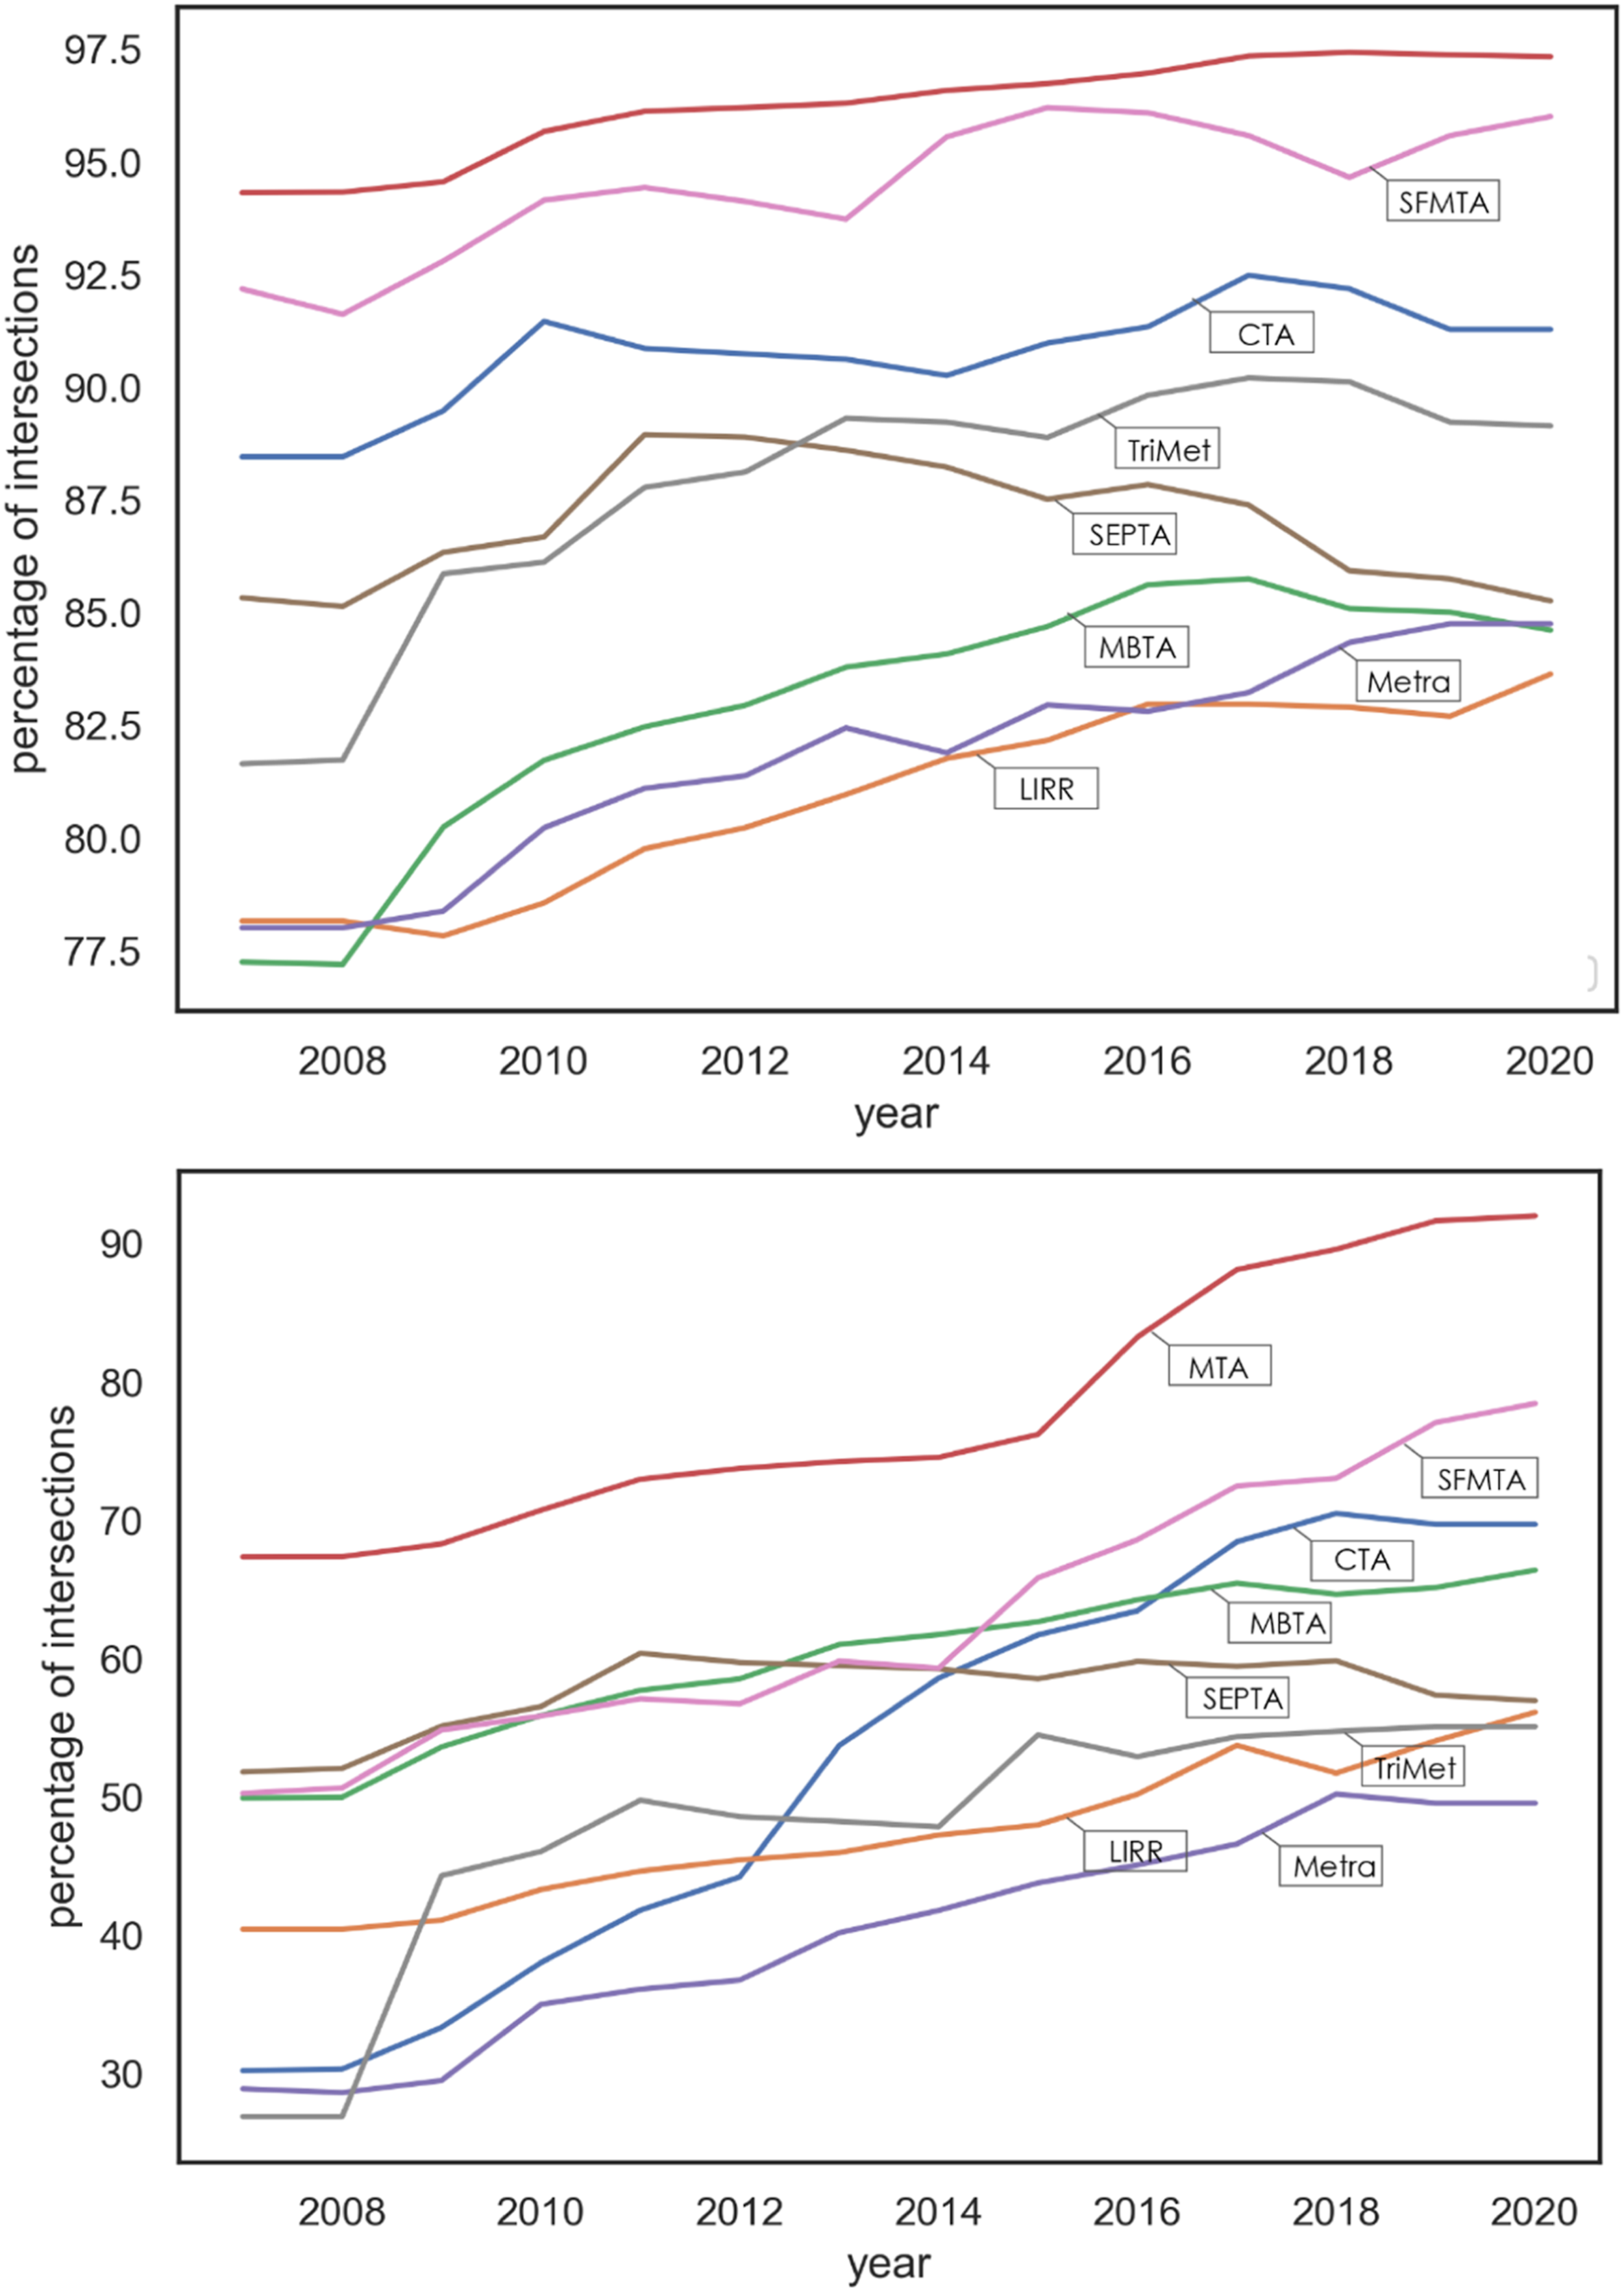
The growth of high-visibility crosswalks presents a similar pattern. The high-visibility crosswalk coverage in most agencies’ services areas was less than 50% and kept increasing over the years, all reaching 50% by 2020. Notably, transit service areas in New York City and San Francisco have seen the fastest increases in the coverage of high-visibility crosswalks since 2014, from 67.3% to 92.0% and from 50.2% to 78.4%, respectively. The only drop is observed in Philadelphia (service area of SEPTA), possibly due to less frequent maintenance and repaving.
3. Intersection-level crosswalk enhancements were implemented at most transit station areas, while gaps remain
We further examine the placement of intersectional-level crosswalk enhancements at stations of two transit agencies, MTA of New York City and SFMTA of San Francisco, which exhibit significant crosswalk visibility improvement over the years. Figure 8 maps the changes of intersections with high-visibility crosswalks between 2007 and 2020 along transit lines of MTA and SFMTA. For both cities, there has been a clear expansion of high-visibility crosswalks. In New York City, the number of intersections with high-visibility crosswalks grew from 4,950 to 6,762, a 36% increase over 13 years. In San Francisco, the number increased 56%, from 1,786 to 2,788. Changes of intersections with high-visibility crosswalks between 2007 and 2020 in transit service areas of MTA and SFMTA. Top: New York City; Bottom: San Francisco.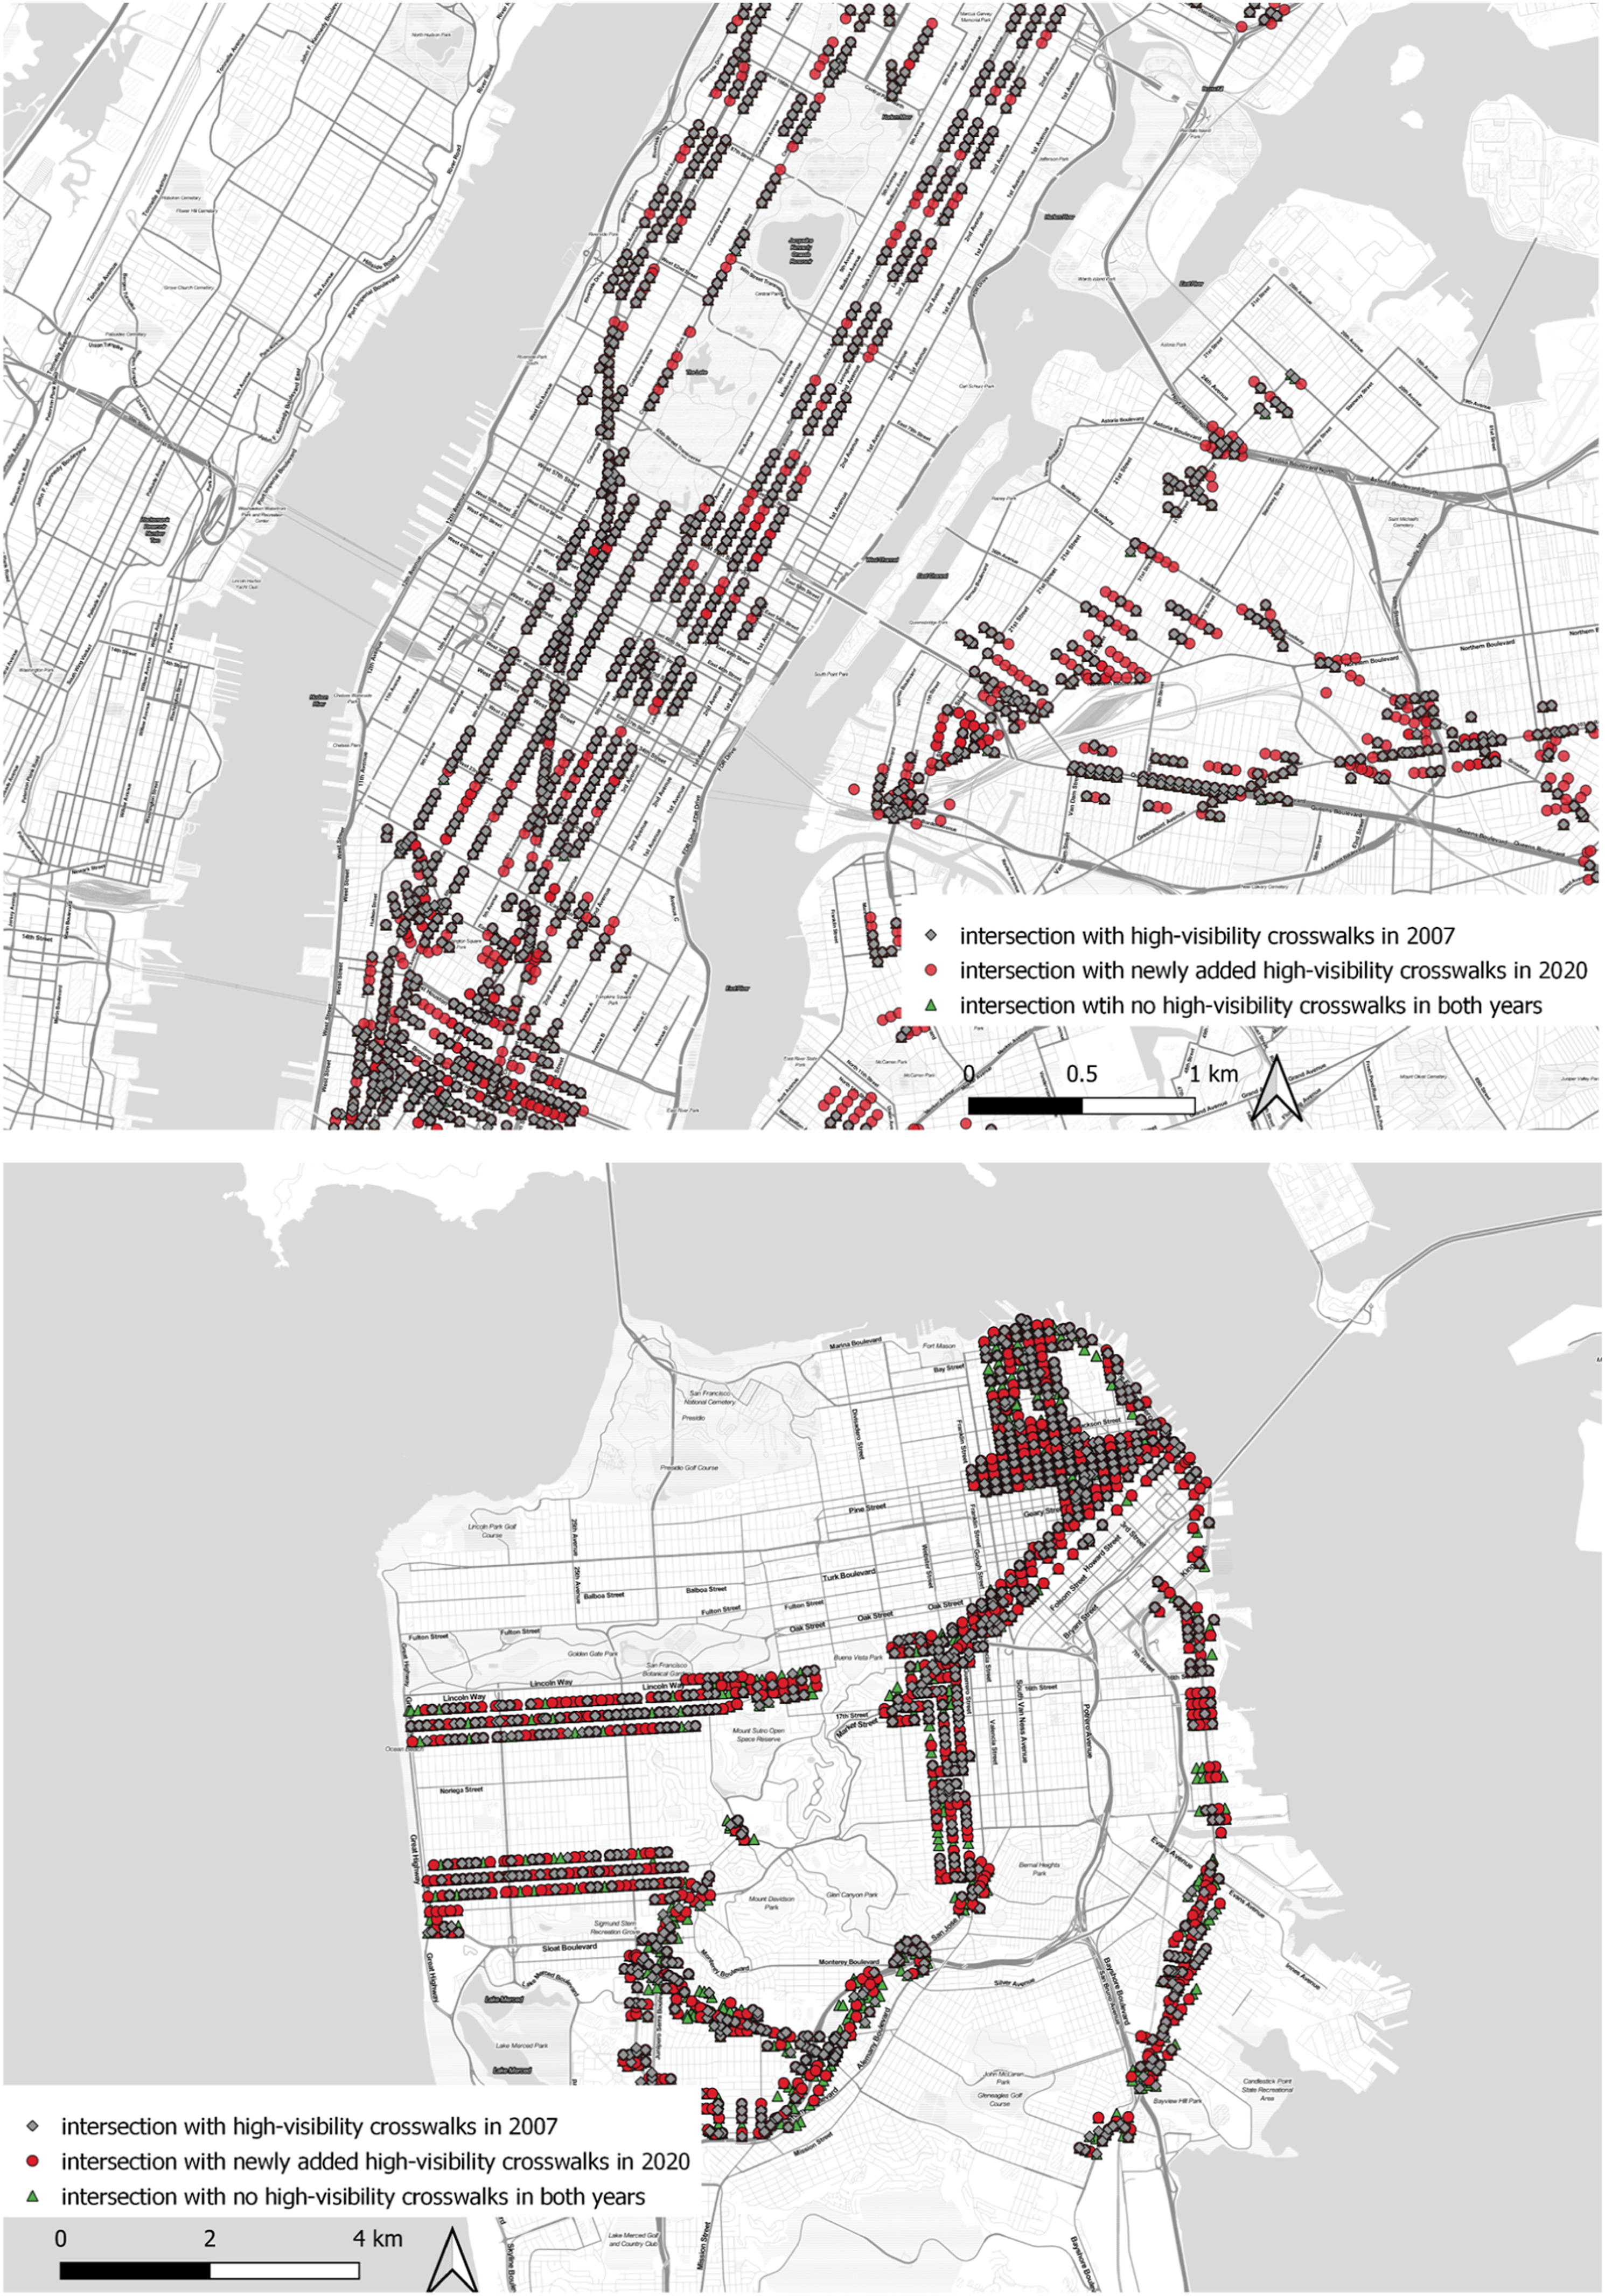
In both cities, crosswalk enhancements were implemented around stations in both urban and suburban areas with a balanced improvement across geographic areas. The enhancements tend to fill crosswalk gaps along major corridors (red dots), for example, Broadway and Lexington Avenue in New York City, and Market Street in San Francisco. By 2020, most intersections in New York City have been covered by high-visibility crosswalks, whereas there are still some gaps in San Francisco, as shown by green dots in Figure 8. These gaps are more prevalent outside the downtown area and major corridors.
Pearson’s correlation between station-area crosswalk coverage and built environment characteristics (2018).
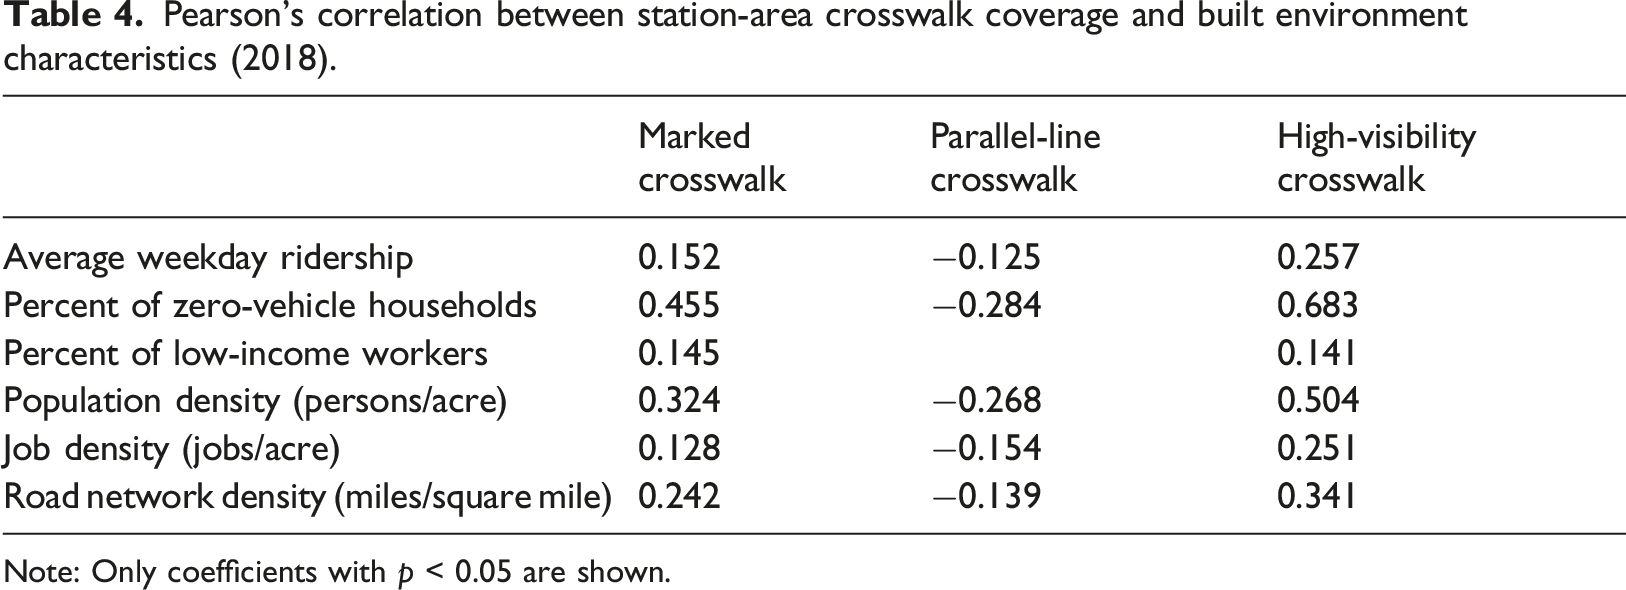
Note: Only coefficients with p < 0.05 are shown.
Pearson’s correlation between station-area crosswalk coverage change (2010–2018) and built environment characteristics (2018).
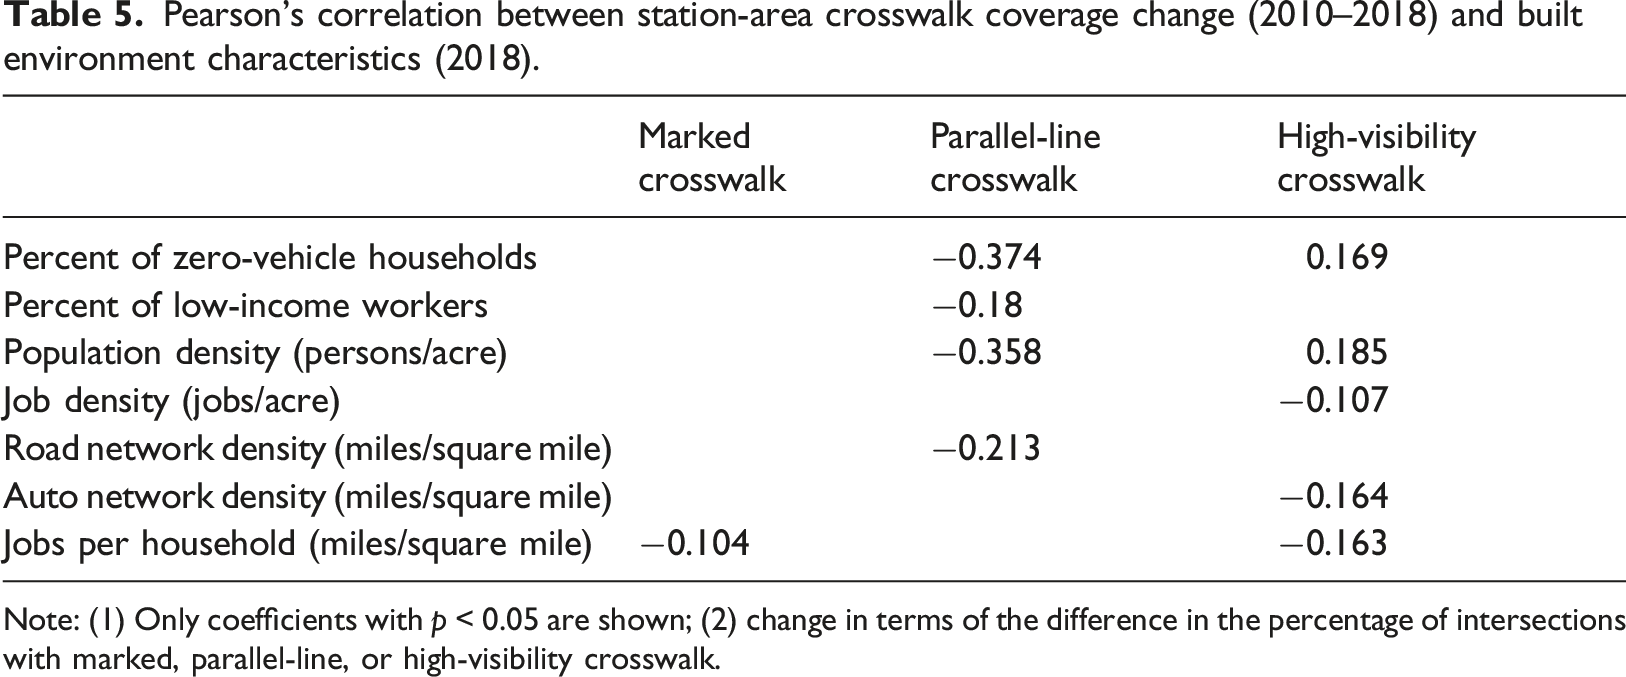
Note: (1) Only coefficients with p < 0.05 are shown; (2) change in terms of the difference in the percentage of intersections with marked, parallel-line, or high-visibility crosswalk.
Furthermore, we implement hotspot analysis to the SFMTA service areas in the City of San Francisco, to identify the spatial clustering of marked crosswalks and high-visibility crosswalks by intersection. We calculate local Moran’s I (Anselin, 1995) as the local indicator of spatial association (LISA) with 250-meter distance band, and applied row standardized spatial weights. Figure 9 maps clusters of high-values and low-value intersections in terms of the presence or absence of two types of crosswalks in 2020. It indicates that there is generally a high presence of marked and high-visibility crosswalks in downtown areas (northeast of the city), possibly due to enhancement prioritization and more frequent maintenance, while gaps in marked crosswalks are prevalent in lower density areas (south of the city) where crosswalk enhancement and maintenance are likely less frequent. Similar analysis can be applied to other cities or transit agencies using our national dataset (released in Supplemental Material) to evaluate the crosswalk enhancement programs at a local scale. Spatial clustering of marked crosswalks and high-visibility crosswalks in transit service areas of SFMTA. In Top: marked crosswalks; Bottom: high-visibility crosswalks.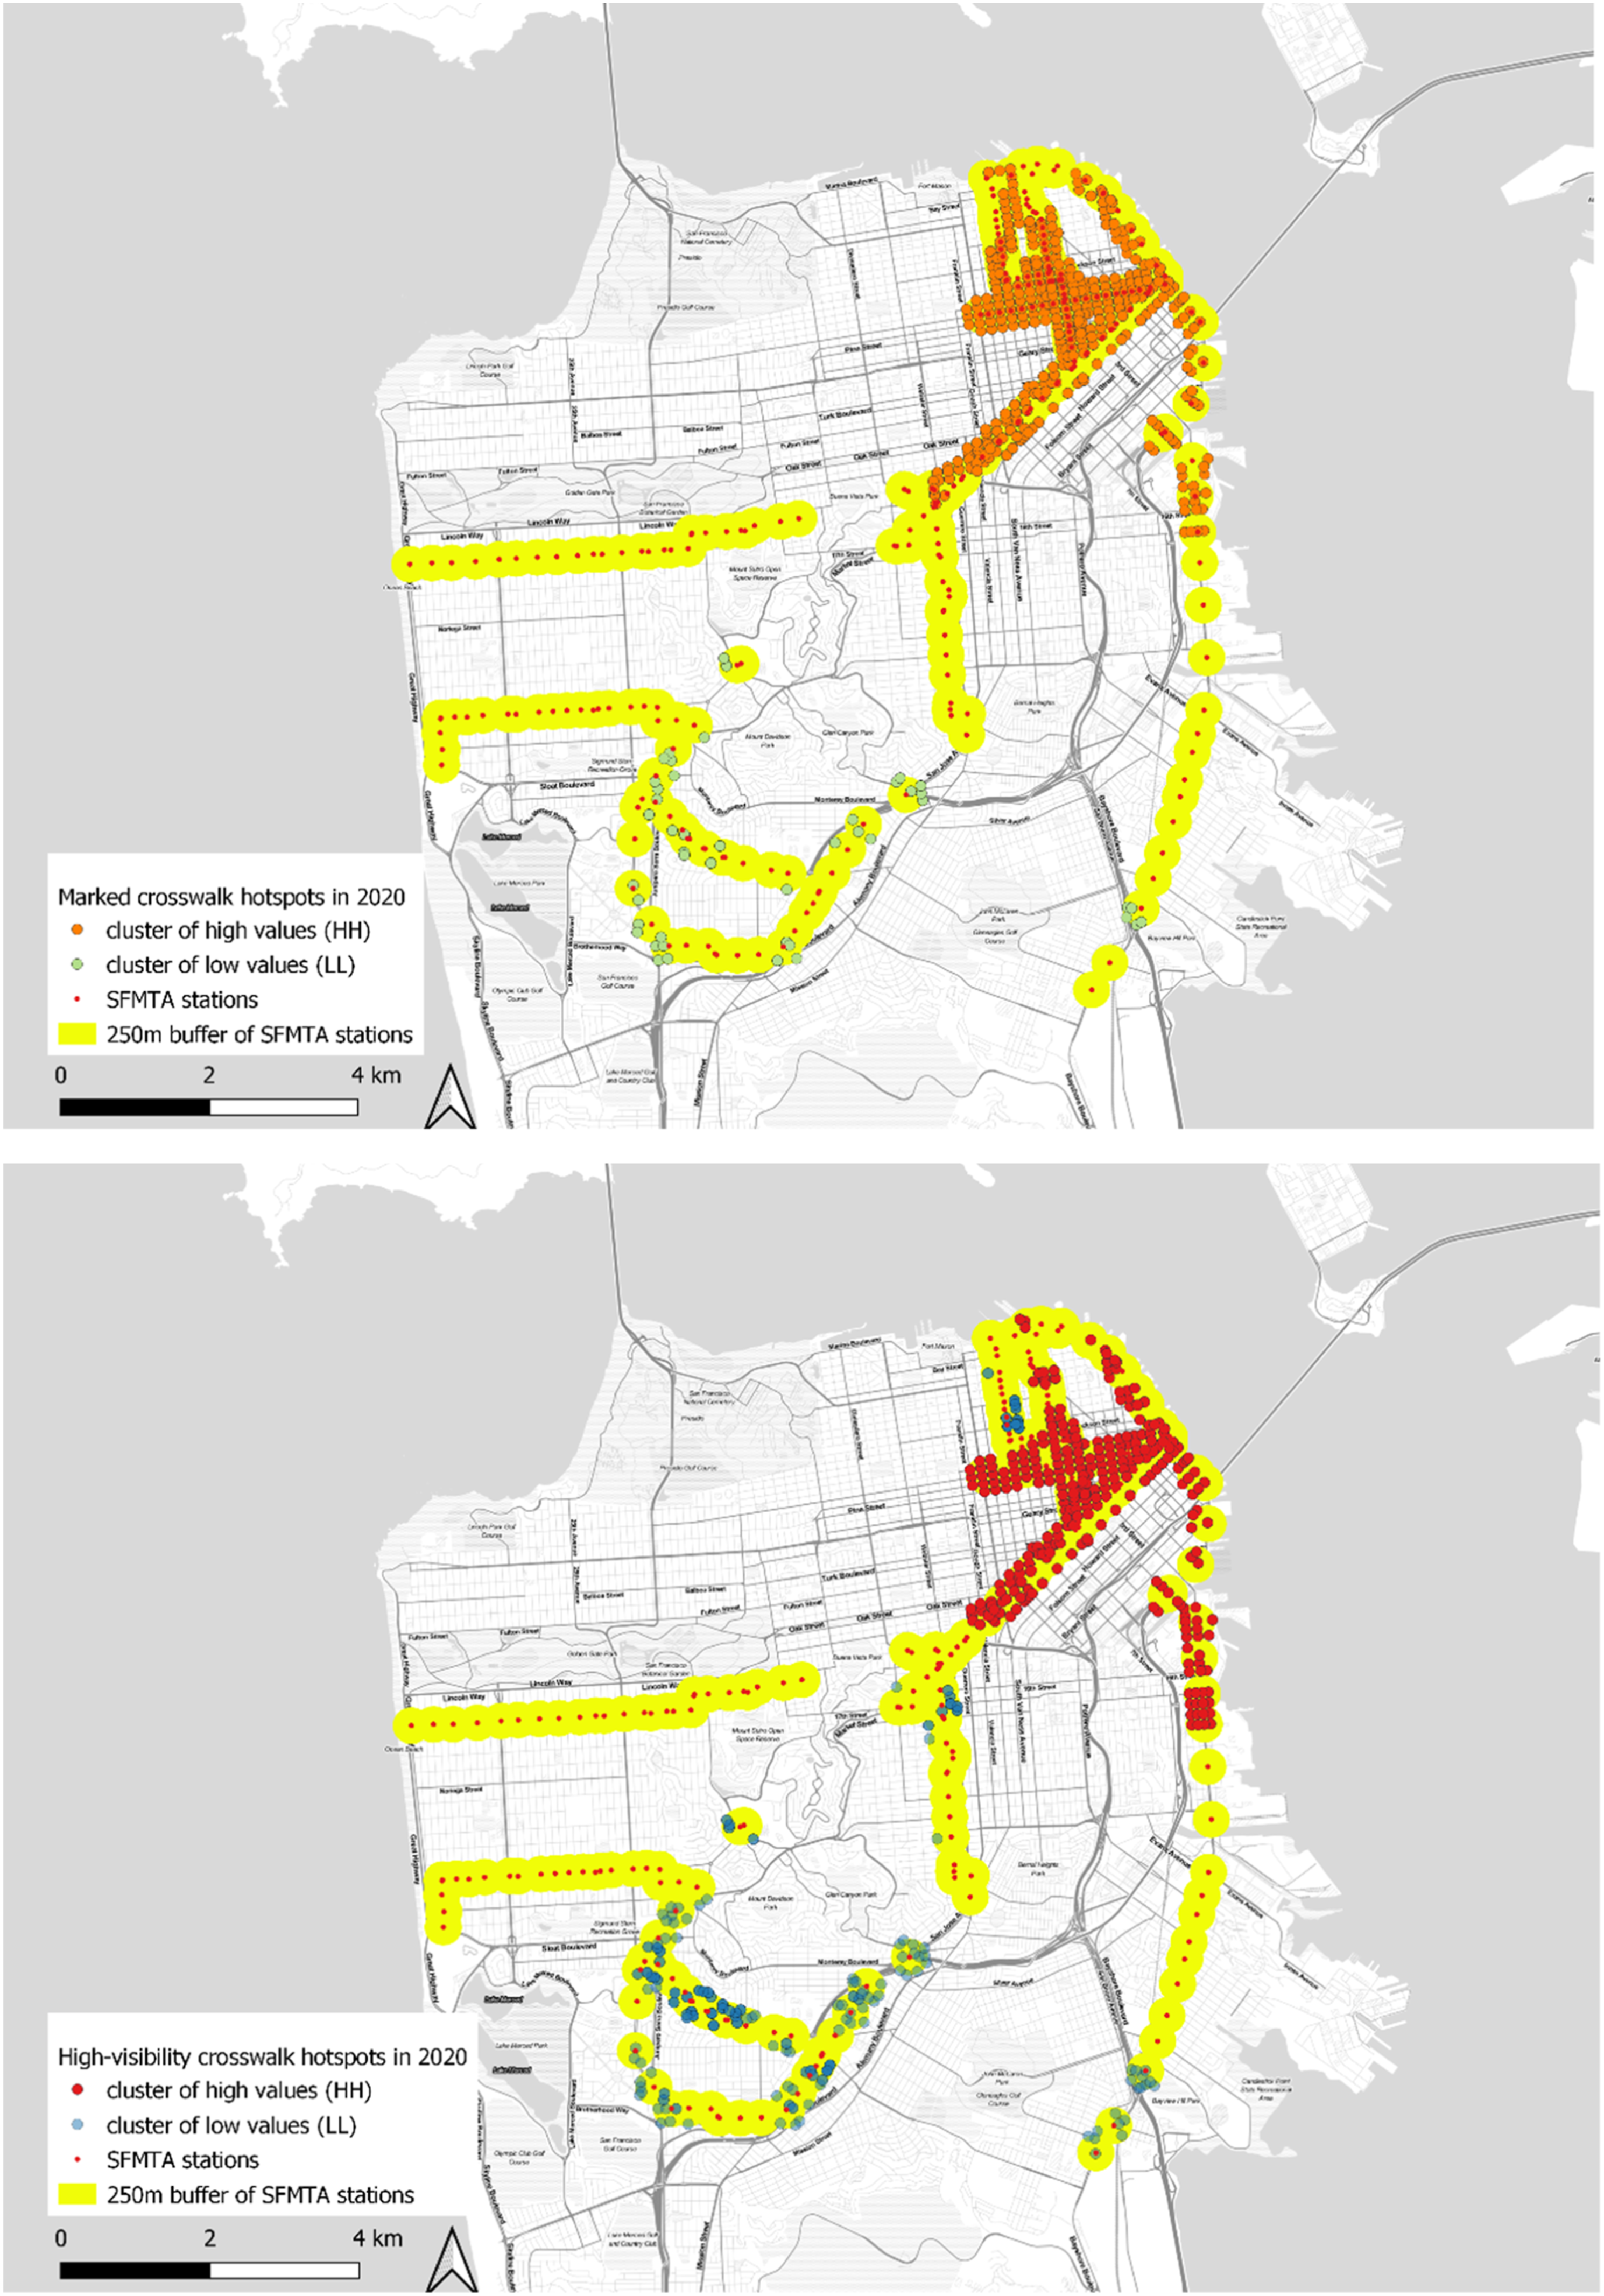
Discussion
We have developed a high-resolution, national-scale, longitudinal crosswalk dataset around transit stations. This dataset provides enormous potential for understanding the evolution of the pedestrian environment and transit access as cities across the United States implemented active transportation and road safety enhancement programs targeted at pedestrians. The interaction between walking and environmental design characteristics still lacks large-scale empirical analysis. So far, most studies discuss computer vision-based methods, but have not taken the step of deploying the model so as to generate a comprehensive dataset for empirical studies. Thus, this study provides an important input about the micro-level built environment that is often difficult to measure reliably, while covering multiple cities and time periods. It can serve as a critical input to strategies to monitor built environment changes in order to assess the qualities of the built environment in supporting active transportation and recreation. The focus on the environment around transit stops is particularly important because a significant percentage of transit users meets physical activity guidelines by getting to and from transit (Besser and Dannenberg, 2005). Thus, efforts to improve transit access by active transportation modes are likely to have significant population health impacts.
Empirically, we find an increasing trend in the coverage of intersections by marked crosswalks generally, and high-visibility crosswalks in particular. Despite this, we identify some cities in which overall coverage decreased, possibly as a result of repaving or poor maintenance of existing crosswalks. Furthermore, for some large cities such as Boston and Chicago, coverage was under 80% despite the fact that it is increasing. Clearly not every single intersection within close proximity of transit needs a marked crosswalk. Such crosswalks may be less critical for crossing alleys and narrow streets. This dataset fills the longitudinal data gap of transportation infrastructure, a huge obstacle to monitoring and systematically evaluating the impact of planning interventions on walking. Specifically, current and historical crosswalks information can be associated with numerous other socioeconomic, built environment and behavioral data, revisiting previous studies to inform sustainable and equitable transportation policy. For example, when coupled with pedestrian counts, road crashes, or traffic injury data, this longitudinal dataset can serve as a valuable data source to evaluate the safety impact of crosswalk visibility enhancements. Other than integrating into walkability assessment, or evaluating the environmental, health and safety benefits of pedestrian infrastructure, this dataset and the general workflow generating such data make valuable resources for testing autonomous driving, connected vehicles, and their interaction with pedestrians.
The approach to detecting crosswalks using deep learning-based computer vision technology can serve as a generalizable framework for identifying various other transportation infrastructures such as sidewalks or bike lanes from Street View imagery. This method can also be scaled up and extended to other geographic areas at a relatively lower cost compared with that of manual auditing.
Despite the opportunities provided by this generalizable approach and new dataset, future research can address some of the limitations of this study. First of all, the performance of our object detection model relies on the quality of training data. So far, there exist very few multi-category crosswalk annotations paired with Street Views images, not to mention temporal labels. We found few cities or public agencies keep a record of the historical inventories or upgrading of such transportation infrastructure. This limits our ability for model training and validation. Given ground truth data available in the future, it would be worthwhile to validate our change detection results with the change records from other sources. Moreover, the data gap by imputation could be more accurately addressed, given Street View coverage improves. Secondly, cropping into 90-degree images from the panorama may split one single crosswalk into multiple views, which results in missing or duplicated detections of the same crosswalk. Therefore, our estimation of crosswalk occurrence may systematically deviate from the exact number of different types of crosswalks. Nevertheless, the relative magnitude changes should capture the spatial and temporal trends of crosswalk changes. Third, given the availability of Street View imagery by month, it is possible to update the dataset to a monthly resolution that may more accurately capture the time of change. Lastly, there could be a fine-grained taxonomy of crosswalk types by considering the qualities of the marked crosswalks, such as “faded” or “not faded,” which may distinguish between intersections with no marked crosswalks and those poorly maintained.
In addition to the methodological improvement, future research could benefit from identifying a more comprehensive set of pedestrian safety countermeasures, including traffic signals, raised medians, and pedestrian warning signals, which are considered vital to be implemented together with high-visibility crosswalks (Zegeer et al., 2001). Moreover, midblock crosswalks turn out important in preventing a significant portion of pedestrian collisions. Detecting such features is feasible but requires image sampling along street segments.
Finally, this study exemplifies the potential of interdisciplinary collaboration between transportation planning and computer science, leveraging machine learning technologies to produce a valuable dataset for planning research. While the quantitative inspective offers an insight into the overall trend and effect of crosswalk enhancement programs at a national scale, such inspection should be followed up by qualitative assessment that accounts for the nuances of specific projects. The constantly changing built environment and transportation infrastructure also require timely updates to the dataset. It is critical to communicate the potential benefits to various stakeholders so as to maintain a high-quality archive of the built environment.
Conclusion
In this paper, we introduce an innovative method using computer vision to map intersection-level pedestrian marked crosswalks around more than four thousand transit stations in the United States in a 14-year period. To our knowledge, this is the first study applying computer vision techniques to detect key aspects of pedestrian infrastructure at a national scale. It is also the first national-scale longitudinal assessment of crosswalk visibility enhancement programs. The work advances the methods and application of built environment measures for planning research in not only spatial-temporal resolution but also scale of machine learning and computer vision applications for transportation and planning research.
Findings of the study suggest that crosswalk visibility enhancement programs at transit station areas have been generally effective since 2007 by increasing the overall number of marked crosswalks and replacing plain crosswalks with high-visibility crosswalks. However, geographic variations exist, and there remain some gaps in crosswalk visibility that need safety enhancement.
Moreover, the dataset generated by this study can serve as a valuable resource to investigate the implementation of pedestrian safety enhancement programs as reflected by the visibility improvement over the years and throughout the country. Moreover, it opens up a wide range of research opportunities examining patterns of built environment change and their impact on human behavior and environmental and social systems. The general computer vision-based approach can be applied to other transportation infrastructures such as active transportation facilities, ADA facilities, and street design elements. It can serve as a general framework to automatically detect and examine large-scale built environment changes at a relatively low cost.
Supplemental Material
Supplemental Material—Marked crosswalks in US transit-oriented station areas, 2007–2020: A computer vision approach using street view imagery
Supplemental Material for Marked crosswalks in US transit-oriented station areas, 2007–2020: A computer vision approach using street view imagery by Meiqing Li in Environment and Planning B: Urban Analytics and City Science
Footnotes
Declaration of conflicting interests
The author(s) declared no potential conflicts of interest with respect to the research, authorship, and/or publication of this article.
Funding
The author(s) disclosed receipt of the following financial support for the research, authorship, and/or publication of this article: This study is supported by the National Institute for Congestion Reduction (NICR).
Data accessibility statement
Supplemental Material
Supplemental material for this article is available online.
Note
Appendix
Average precision comparing object detection models. aNo pre-training was used for this experiment due to no available COCO–pre-trained checkpoint.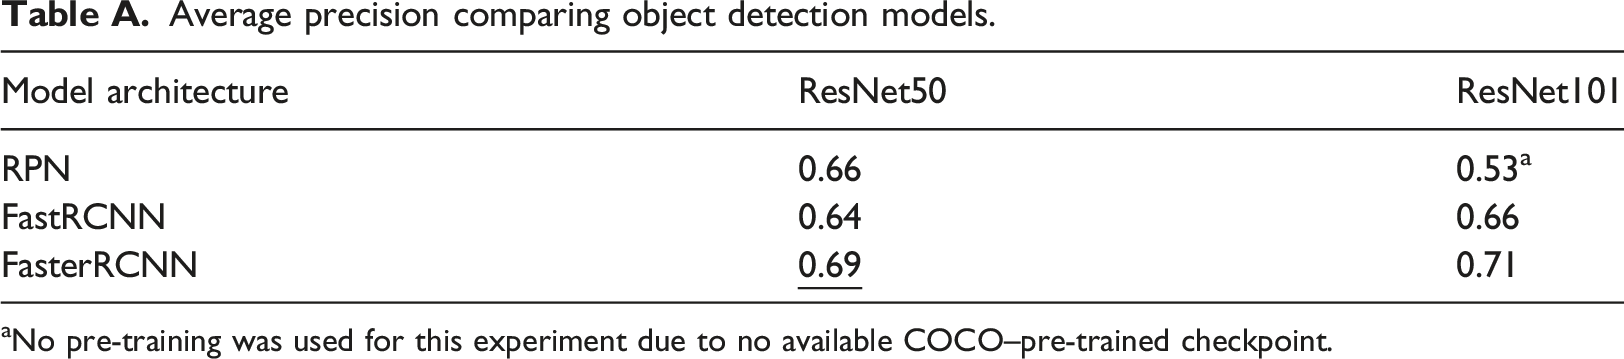
Model architecture
ResNet50
ResNet101
RPN
0.66
0.53
a
FastRCNN
0.64
0.66
FasterRCNN
0.71
![]() , Founder and CEO of Landing AI, General Partner at AI Fund, Chairman and Co-Founder of Coursera.
, Founder and CEO of Landing AI, General Partner at AI Fund, Chairman and Co-Founder of Coursera.
References
Supplementary Material
Please find the following supplemental material available below.
For Open Access articles published under a Creative Commons License, all supplemental material carries the same license as the article it is associated with.
For non-Open Access articles published, all supplemental material carries a non-exclusive license, and permission requests for re-use of supplemental material or any part of supplemental material shall be sent directly to the copyright owner as specified in the copyright notice associated with the article.