
Abstract
Cities are different worldwide, but does this fact have any relation to culture? The idea that urban form embodies idiosyncrasies related to cultural identities captures the imagination of many in urban studies, but it is an assumption yet to be carefully examined. At its heart, the question of whether cities can be seen as cultural artefacts is informational: whether or not cultural traces can be encoded in the physical configuration of cities. Approaching spatial configuration as a proxy of urban culture, we investigate this possibility by focussing on buildings as the primary components shaping cities. Looking into how buildings aggregate in combinations and complexes, we explore Shannon’s information theory to introduce an entropy measure and analyse frequencies of cellular configurations of built form. We apply this method to downtown areas of 45 cities from different regions around the world. Assessing differences and similarities in cellular configurations, we identify clusters of cities potentially consistent with specific spatial cultures. Our findings suggest a classification scheme that sheds light on the ‘cultural hypothesis’: the possibility that different cultures and regions find different ways of ordering space. We conclude our analysis by arguing that the endless combinatorial possibilities of building configurations, missing from street network approaches, add complexity to cities and prompt a renewed interest in built form systems.
Keywords
Introduction
Cities of different cultural types and different scales embody different spatial identities... human societies order their spatial milieu in order to construct a spatial culture, that is, a distinctive way of ordering space. (Hillier, 1989: 5–6)
The idea that urban form embodies idiosyncrasies that express cultural identities seems to be a frequent assumption in urban studies. It has to do with the contextual role of custom and institutional settings, from regional idiosyncrasies assimilated to traditional ways of building to the dichotomies of planned and unplanned cities, shaped through top-down agencies or as chance-grown arrangements (Kostof, 1991). However, can local cultures leave traces in urban space? Despite its persistence in the urban imagination, the problem of how built environments might embody specific cultural identities seems yet to be fully addressed in urban studies. There is an ‘evident lack of a quantitatively rigorous, comprehensive and systematic framework for the analysis of urban form’ (Venerandi et al., 2017). Historically and culturally informed quantitative methods are essential for uncovering forms and patterns resulting from city organisation processes (Boeing, 2019; Fleischmann et al., 2021).
This paper looks closely into that assumption and addresses whether cities take on physically specific forms under different cultural conditions (Hillier, 1989). This intention implies examining the existence of contextualised ways of shaping cities – and features that might transcend context. We shall approach the spatial configurations of the built environment as a proxy of urban culture, looking into the very constituents of urban form. Unlike emphases on street networks (Hillier et al., 1993; Porta et al., 2006), our approach focuses on the primary components shaping the physical spaces of cities: buildings and how they aggregate in complexes of built form. It also means considering a feature that seems to differentiate cities from non-urban settlements: the systems of built forms arranged in urban blocks. Closely related to streets and open spaces systems, the urban block uniquely defines the shape of cities in urban societies that emerged in regions and cultures seemingly with no contact with one another (Netto, 2017).
We will look into 45 cities worldwide and measure their spatial configurations to assess their differences and similarities. We shall lay down an approach based on Shannon’s (1948) theory of information and entropy. We will argue that Shannon’s measure is particularly suited for capturing amounts of information related to randomness and order in configurations of built form. Our approach takes the following steps: • Inquire into built form as ‘spatial culture’. • Propose a measure of the cellular configurations of built form based on Shannon entropy, as an ‘information signature’ potentially associated with specific regions or spatial cultures. • Apply this measure to examine cities in different regions of the world. • Finally, use the results as a similarity measure to compare and cluster the analysed cities.
Does culture leave traces in urban space?
One of the under-examined assumptions about the connections between society and urban form is that the latter may somehow express cultural identities that constitute the former. We understand ‘culture’ as an ongoing process involving practices and products of human activity situated in time and place, in material contexts and social frameworks, including meanings, codes and forms of coordination between agencies engaged in symbolic and material production. We approach urban form as an inherently physical expression and part of such cultural systems (see Supplemental Section 2.1 in the supplementary material to this article). Conzen (1960) was a pioneer in studying patterns of change in urban form concerning the economic, social, and technological milieu, proposing a cyclical nature of development (Rashid, 2017). Going a step further, Rossi (1982) argued that the material form of the city is intrinsic to its sociological and cultural reality. Later on, Hillier (1989) addressed the possibility of cities of different cultural types embodying different spatial identities. His topological approach allowed him to claim that human societies order their built environment to construct a ‘spatial culture’, a ‘distinctive way of ordering space’ as spatial arrangements shape the field of encounters that animate different social cultures.
Recent discussions have enriched this construct by approaching a spatial culture as ‘a fundamentally performative and temporal process’ (Griffiths and von Lünen, 2016: xxiv). Focussing on ‘questions of cultural specificity in the formation of space’, these works assess how culture affects spatial formation and the possibility of ‘encoding and transmitting social and cultural information’ in urban space (Koch, 2016). Contingencies are added by the possibility that ‘different cultures invest differently in space, be it in regards to what is manifested, or to what extent society is manifested through built form’ (Koch, 2016: i) (see Supplemental Section 2.2).
Some studies looked into spatial features, logic or organising principles in comparative studies of cities consistent with distinct regions. To be sure, most of these works deal with street networks rather than built form systems. Medeiros’s (2013) analysis of betweenness centrality and depth in the street networks of 164 cities in different parts of the world identified regional differences. For instance, American and Canadian cities appear prominently with the highest levels of accessibility, as opposed to Brazilian cities in South America, the most spatially segregated. Louf and Barthelemy (2014) searched for the ‘fingerprints’ of cities analysing the distribution of blocks extracted from street networks of 131 city centres. The method identifies that nearly two-thirds of American cities in their sample are structurally different from European cities (see Supplemental Section 2.3).
We argue that, at its heart, the question of whether cities can be seen as cultural artefacts is informational: whether or not cultural traces can be encoded in the physical configuration of cities. We address this problem unfolding the first dimension of a three-layered model of information in cities: environmental information in physical space, environmental information in semantic space, and the information enacted by interacting agents (see Netto et al., 2018). Our configurational approach focuses on buildings as the primary components shaping cities and how they aggregate in combinations and complexes. By looking into frequencies of cellular arrangements representing buildings in selected cities, we wish to understand if and to what extent their configurations can be seen as particular cultural features, regardless of whether these features are intentionally embodied in urban space. Recognising that urban structures are different worldwide and approaching spatial configuration as a proxy of urban culture, we attempt to analyse such configurations to assess their differences and similarities. We shall explore Shannon’s view of ‘information’ and ‘entropy’ to investigate whether spatial cultures entail ‘distinctive ways of ordering space’.
Information and entropy in physical spatial systems
Several works have explored information and entropy measures concerning urban systems, beginning with Wilson’s (2011) pioneering study of utility-maximising systems in 1970. The entropy-maximising paradigm was used to derive model formulations for spatial interactions and urban distributions, microeconomic behaviour and input–output analysis (Batten, 1981). Batty developed studies on entropy in spatial aggregations and interaction since the early 1970s (Batty, 1972, 1974, 1976). More recently, Batty et al. (2014) proposed a measure of complexity based on Shannon’s information able to grasp the complexity of cities as they vary in scale, size and spatial distribution of population. They dealt with spatial entropy related to the distribution of information and with information density related to city size. Other approaches used modifications of Shannon entropy and information-theoretical metrics as methods to capture, quantify and group similar two-dimensional spatial patterns in landscape ecology, including efforts towards a universal classification of configuration types in a linear sequence according to increasing values (Altieri et al., 2018; Claramunt, 2012; Nowosad and Stepinski, 2019).
Entropy measures have been frequently applied as diversity indexes, including urban morphological problems. Gudmundsson and Mohajeri (2013) developed a method based on Shannon entropy to measure angular variation between streets, applied to 41 British cities. Boeing (2019) explored such method to analyse 100 cities worldwide, focussing on street networks downloaded from Open Street Maps (OSM). However interesting as morphological approaches, these applications do not seek to uncover spatial information patterns, focussing instead on entropy as a measure of variation in street angles and lengths. The entropy measure of the distribution of crossing angles does not necessarily capture the global degree of order/disorder of street networks. Furthermore, entropy measures applied to street networks are not a comprehensive morphological approach since they do not consider entropy in built form. They ignore discrepancies between levels of order in street networks and built form systems. Cities can be physically disordered even if their street networks are perfectly ordered (Kostof, 1991). They can have low entropy in street orientation yet highly disordered morphological structures (see Supplemental Figure S1 in the supplementary material).
More comprehensively, Haken and Portugali (2003, 2014) focussed on how the built environment embodies information. They explored Shannon information quantitatively in connection with Haken’s synergetic qualitative approach to semantic information to empirically assess how basic cellular arrangements and categorisations of building facades convey different amounts of information. Finally, other approaches to spatial information have adopted measures of entropy, distribution of spatial co-occurrences or information density to assess redundancy and grouping related to cognitive efforts to extract task-relevant information from the built environment (e.g. Rosenholtz et al., 2007; Woodruff et al., 1998). In turn, our approach will explore Shannon entropy to measure levels of randomness and disorder in physical space, namely, in cellular arrangements of built form. We shall look into the possibility that consistent differences between cities can be perceived at this scale and that cultures and regions are loci for different ways of ordering such configurations, which this measure may capture.
Analysing built form systems
Our first procedure involves reducing urban form to two-dimensional arrangements based on building footprints. The Nolli map (or figure-ground diagram) provides a spatial data-driven method to analyse and study the urban form and circulation networks that structure human activities and social relations (Boeing, 2019) (see Supplemental Section 4.1). Our second procedure looks into different cellular arrangements and attempts to characterise their configurations. We do so by analysing the probability distribution of built form configurations and evaluating the Shannon entropy (Shannon, 1948) in building footprints maps of different cities. This has to do with randomness in the cellular arrangements of built form in cities. By analysing cellular arrangements, we capture the structures of urban blocks in relation to the open spaces of streets and public squares. Indeed, the three-dimensional form of the built environment encodes more information than two-dimensional configurations can express. However, we opted for an analytic approach to sufficiently describe differences in built form – hence the reduction of three-dimensions (3D) to two-dimensions (2D) maps, converting building footprints into grids or pixels of cellular aggregations (see Supplemental Figure S3).
We characterise the spatial information encoded in 2D configurations of buildings in the following terms. Information will be quantified by measuring Shannon entropy, operationally estimated by looking at the sequence of bits 1 representing built form cells (buildings) and 0 representing open space cells (e.g. streets, public squares or courtyards) within sections of cities. Theoretically, this corresponds to measuring the Shannon entropy of a 2D symbolic sequence of 1 and 0. In this context, information finds a precise meaning. The entropy of the sequence is a measure of the surprise the sequence causes in the observer (Shannon, 1948). High entropy is associated with physical arrangements characterised by higher randomness, uncertainty or unpredictability. In contrast, regularities and patterns correspond to higher predictability and lower entropy.
The next step involves preparing a set of empirical cases and the conversion of city maps into cellular maps. We selected cities for their importance in their region or country. The selection also had to consider the availability of built form information. Many cities, particularly in Latin America, Africa and Asia, have incomplete data regarding building footprints, like precise location, position and shape.
We selected areas within these cities for methodological reasons to apply our measure. This selection procedure follows two considerations. The first and most important one observes that it is interesting to decouple the analysis of urban structures between small-scale, detailed and denser urban areas and large-scale regional and peripheral urban areas. The two scales can be naturally described through different methodologies. Small-scale urban areas are defined by features such as buildings and urban blocks, introducing a characteristic scale at which patterns emerge. In other words, there are well-defined scales related to internal distances above which configurations may lose correlations. In our case, small scales define sub-systems characterised by typical local patterns (urban blocks, individual buildings and neighbourhoods) (see Supplemental Section 4.2).
The second consideration is that our method is well fitted for estimating entropy for dense and continuous urban areas. We considered occupation rates close to 50%, avoiding large empty areas or rarefied urbanisation patterns. In other words, case selection was based on identifying areas with high continuity in built form. Interestingly, fixing the density of built form cells allows us to obtain results independent from this parameter. The continuity of built form also allows us to use a specific extrapolation technique for estimating the entropy of 2D sequences.
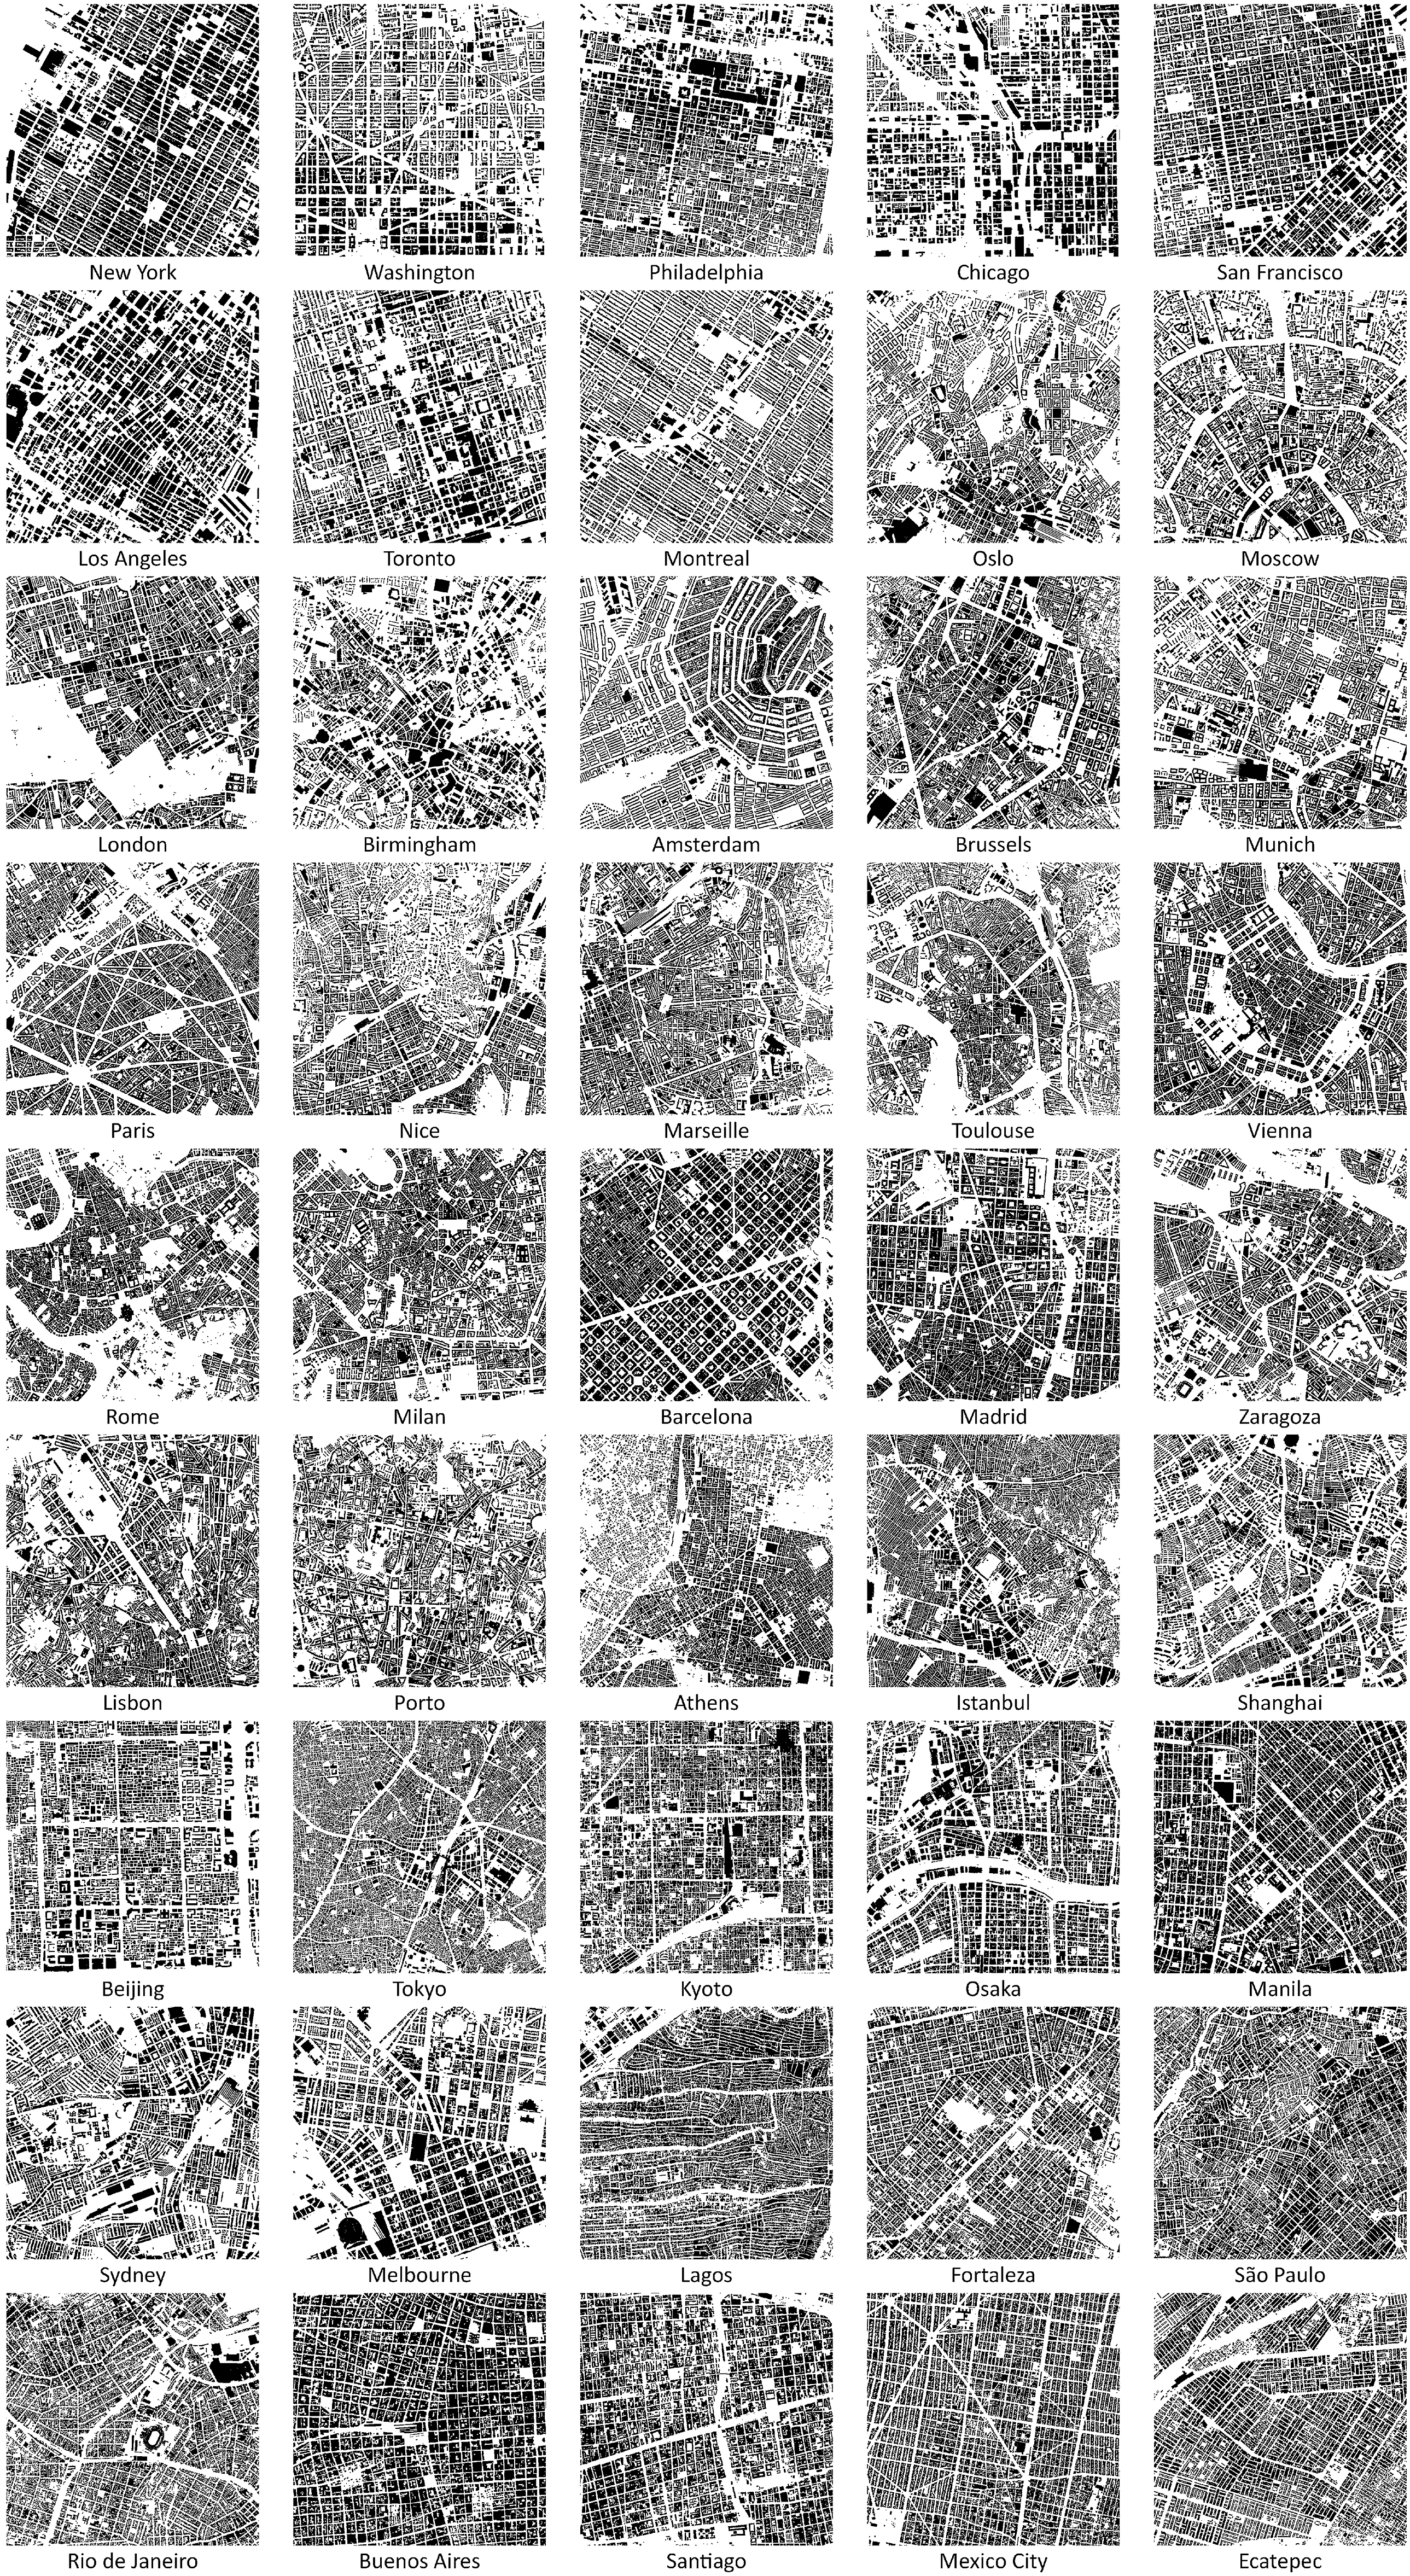
We prepared our sample extracting building footprints in sections of cities from the Google Maps service. Importantly, we tested trade-offs between resolution and data availability for distinct scales. Finer resolutions imply that for grasping correlations at sufficiently large scales, a necessary condition for correctly estimating entropy, we should find sufficiently large city sections with the desired properties. Moreover, finer resolutions increase statistical fluctuations and noise in entropy estimation. In contrast, very coarse-grained resolutions lose the relevant structures of urban morphologies. We chose geographic areas of 9,000,000 m2, which were considered sufficient to represent the general spatial characteristics of dense urban areas regarding the configuration of buildings, urban blocks, and open spaces of 45 cities worldwide (Figure 1). All cities were analysed following rigorously the same resolution and scale. Images underwent a re-sizing process for producing sections with 1,000,000 cells, each one representing a space of 3 × 3 metres, and were converted to a monochrome system and then into a matrix of size 1000 × 1000 cells with binary numerical values (0 for open space cells and 1 for built form cells) (Figure 2). Location of 45 cities in our sample. Colours show amounts of Shannon entropy found by our method in cellular configurations of built form, from blue (low entropy) to red (high entropy). Building footprint distributions in downtown areas of 45 analysed cities (9 km2 windows, 1,000,000 cells), extracted from Google Maps. Following rigorously the same resolution and scale, these sections are used to compute Shannon entropy. Rotation in grids and built form systems does not affect results (Brigatti et al., 2021).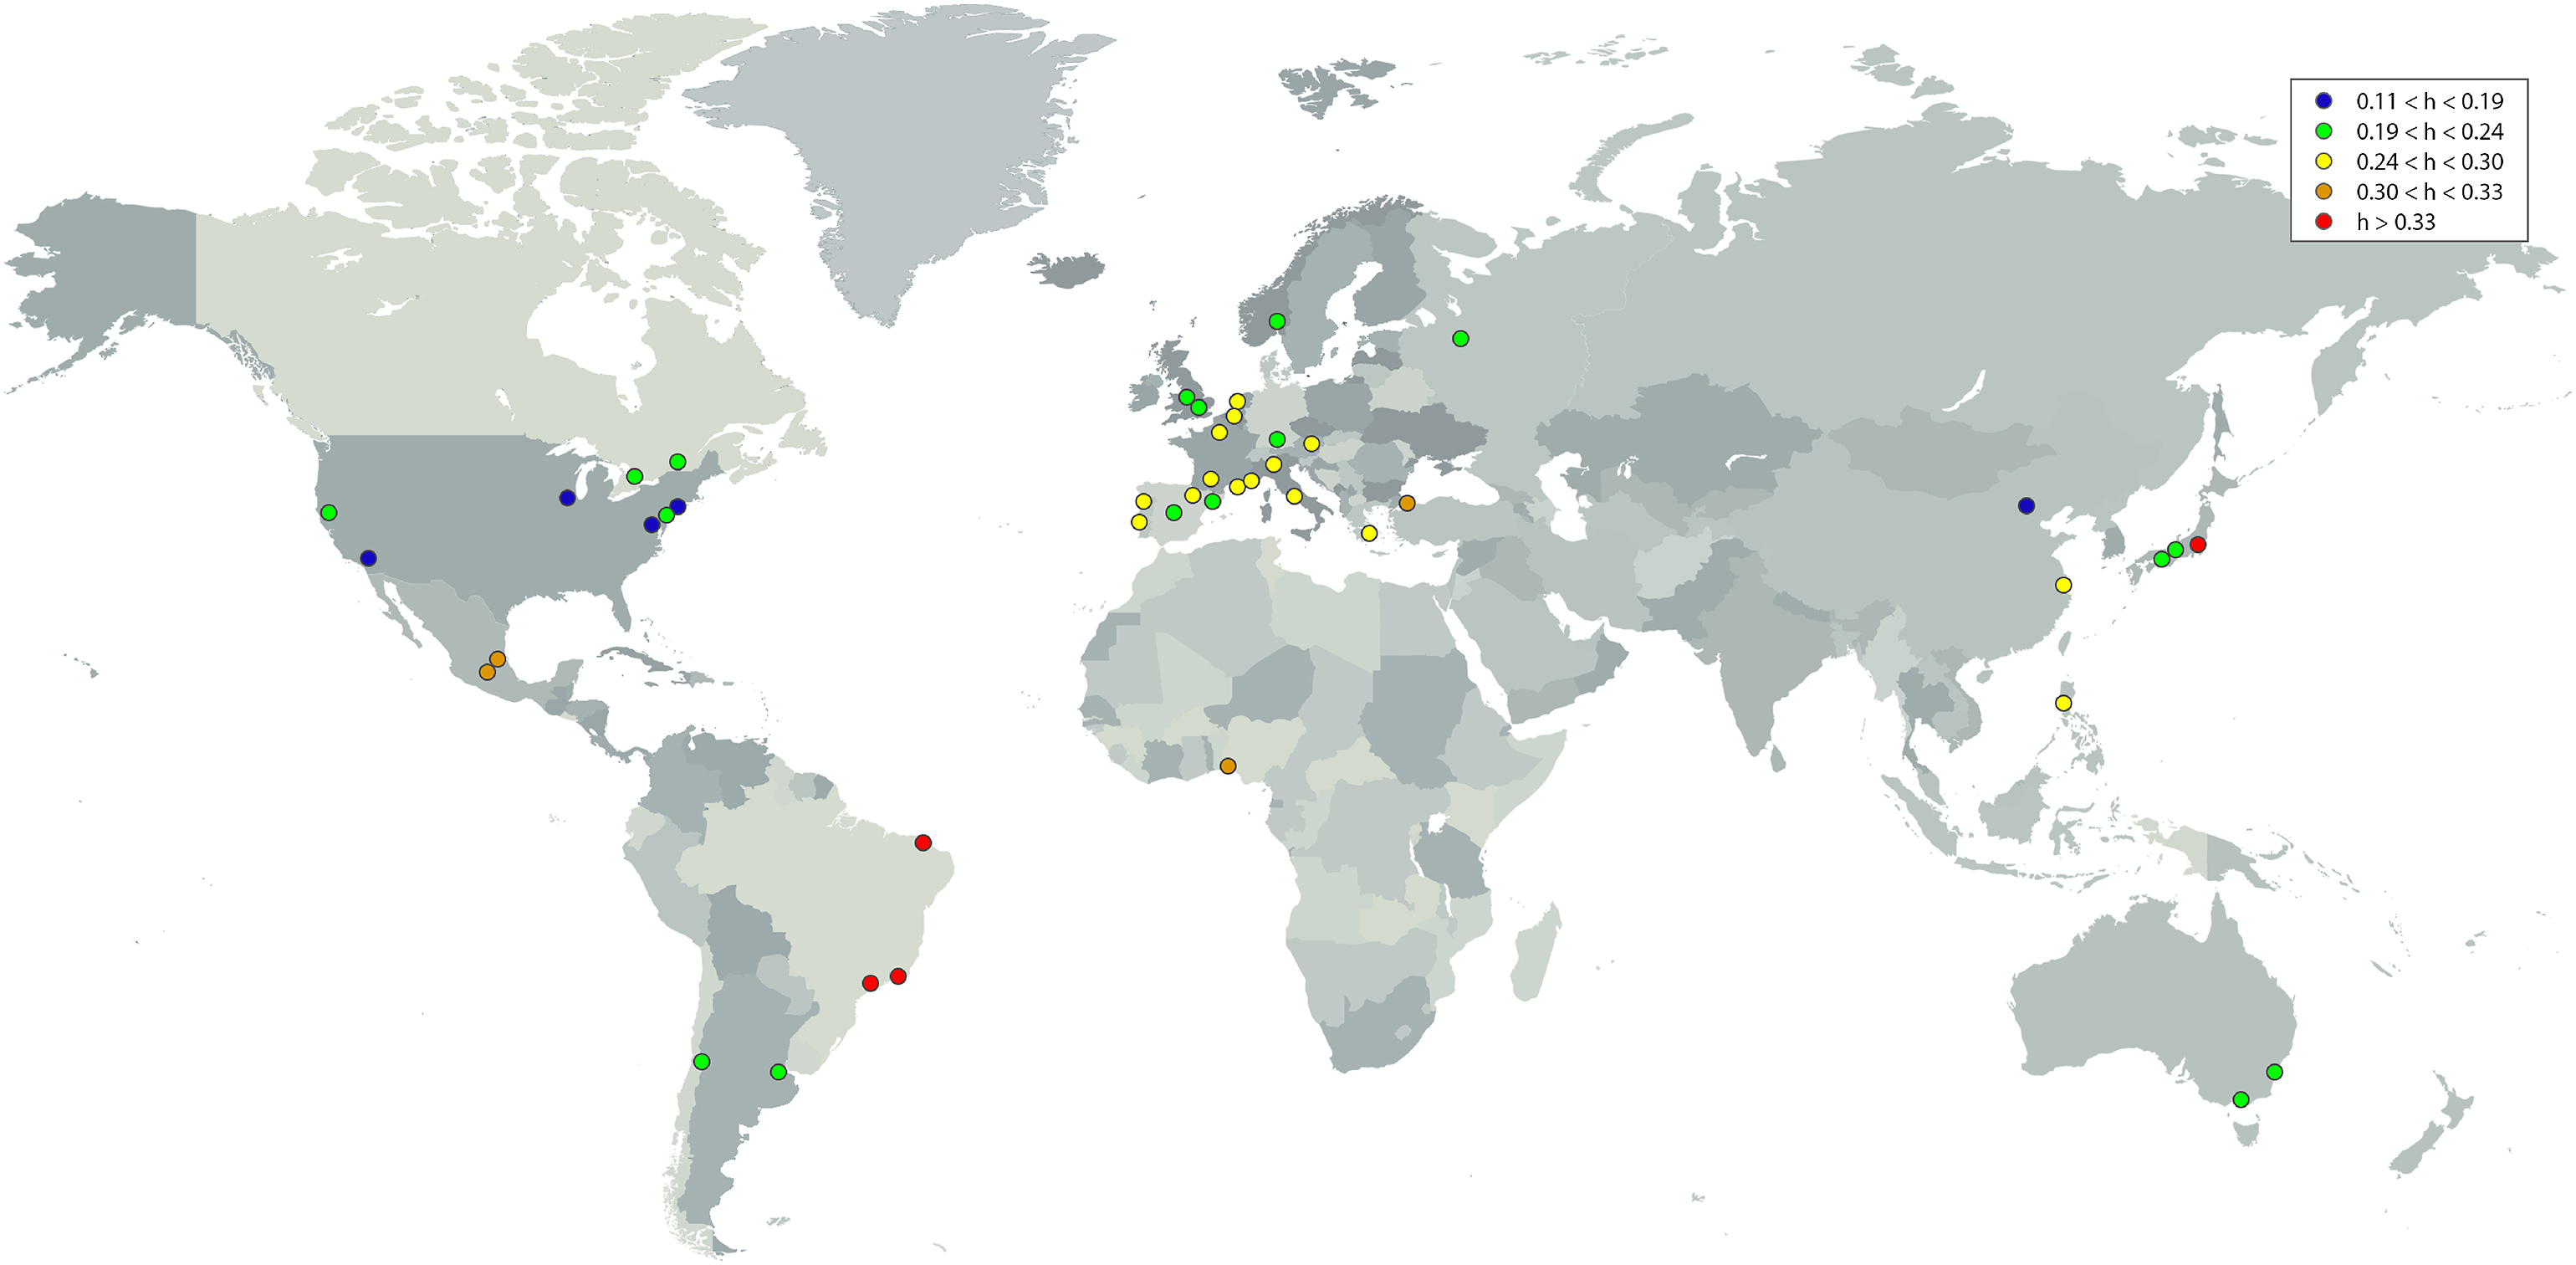
The estimation of the Shannon entropy of 2D matrixes described above uses a method commonly applied for estimating the entropy of sequences of symbols encoded in 1D strings (Schürmann and Grassberger, 1996). A sequence is an entire system considered: a string in 1D, a matrix in 2D. A block is a small section of the sequence, comprised of symbols in 1D or 2D. Blocks contain groups of cells whose possible binary configurations will be counted in actual cities.
Let us start with 1D sequences. The method consists of defining the block entropy of order n through

Equation (1) corresponds to the Shannon entropy of the probability distribution pn(k). The Shannon entropy of the considered system (a 1D string) (Lesne et al., 2009; Schürmann and Grassberger, 1996), which we indicate with h, is obtained from the following limit

This approach can be generalised to sequences of symbols in 2D, which correspond to our cellular sequences representing buildings and open spaces in urban areas. In this situation, we must define the n-blocks for a two-dimensional matrix (Brigatti et al., 2021; de Sousa Filho et al., 2022; Feldman and Crutchfield, 2003). The most intuitive idea is to consider a block of size n as a square that contains n cells. We also obtained the sequence of H
n
for n values that do not correspond to squares by considering blocks that interpolate perfect squares. Note that there is no unique natural way to scan a 2D matrix. We tested our approach for different reasonable forms of constructing the cell blocks. The use of different paths does not seem to significantly influence the estimation of H
n
for our urban data set (Figure 3). An illustration of the method applied to 9 km2 sections of Washington (US, top) and Lagos (Nigeria, bottom). The algorithm scans built form maps counting frequencies of cellular configurations for different block sizes (from n = 1 to n = 20). Amplified areas in red show two specific configurations (n = 9 and n = 16) and where they are found. Washington frequently shows regular arrangements, in contrast with the variety found in Lagos. On the far right, the scheme shows how blocks are constructed following a fixed path. Numbers indicate the order in which cells are added to blocks. The first block of size 1 corresponds to cell 1. Neighbouring cells are added in the corresponding order, as the method scans maps with this set of cell blocks.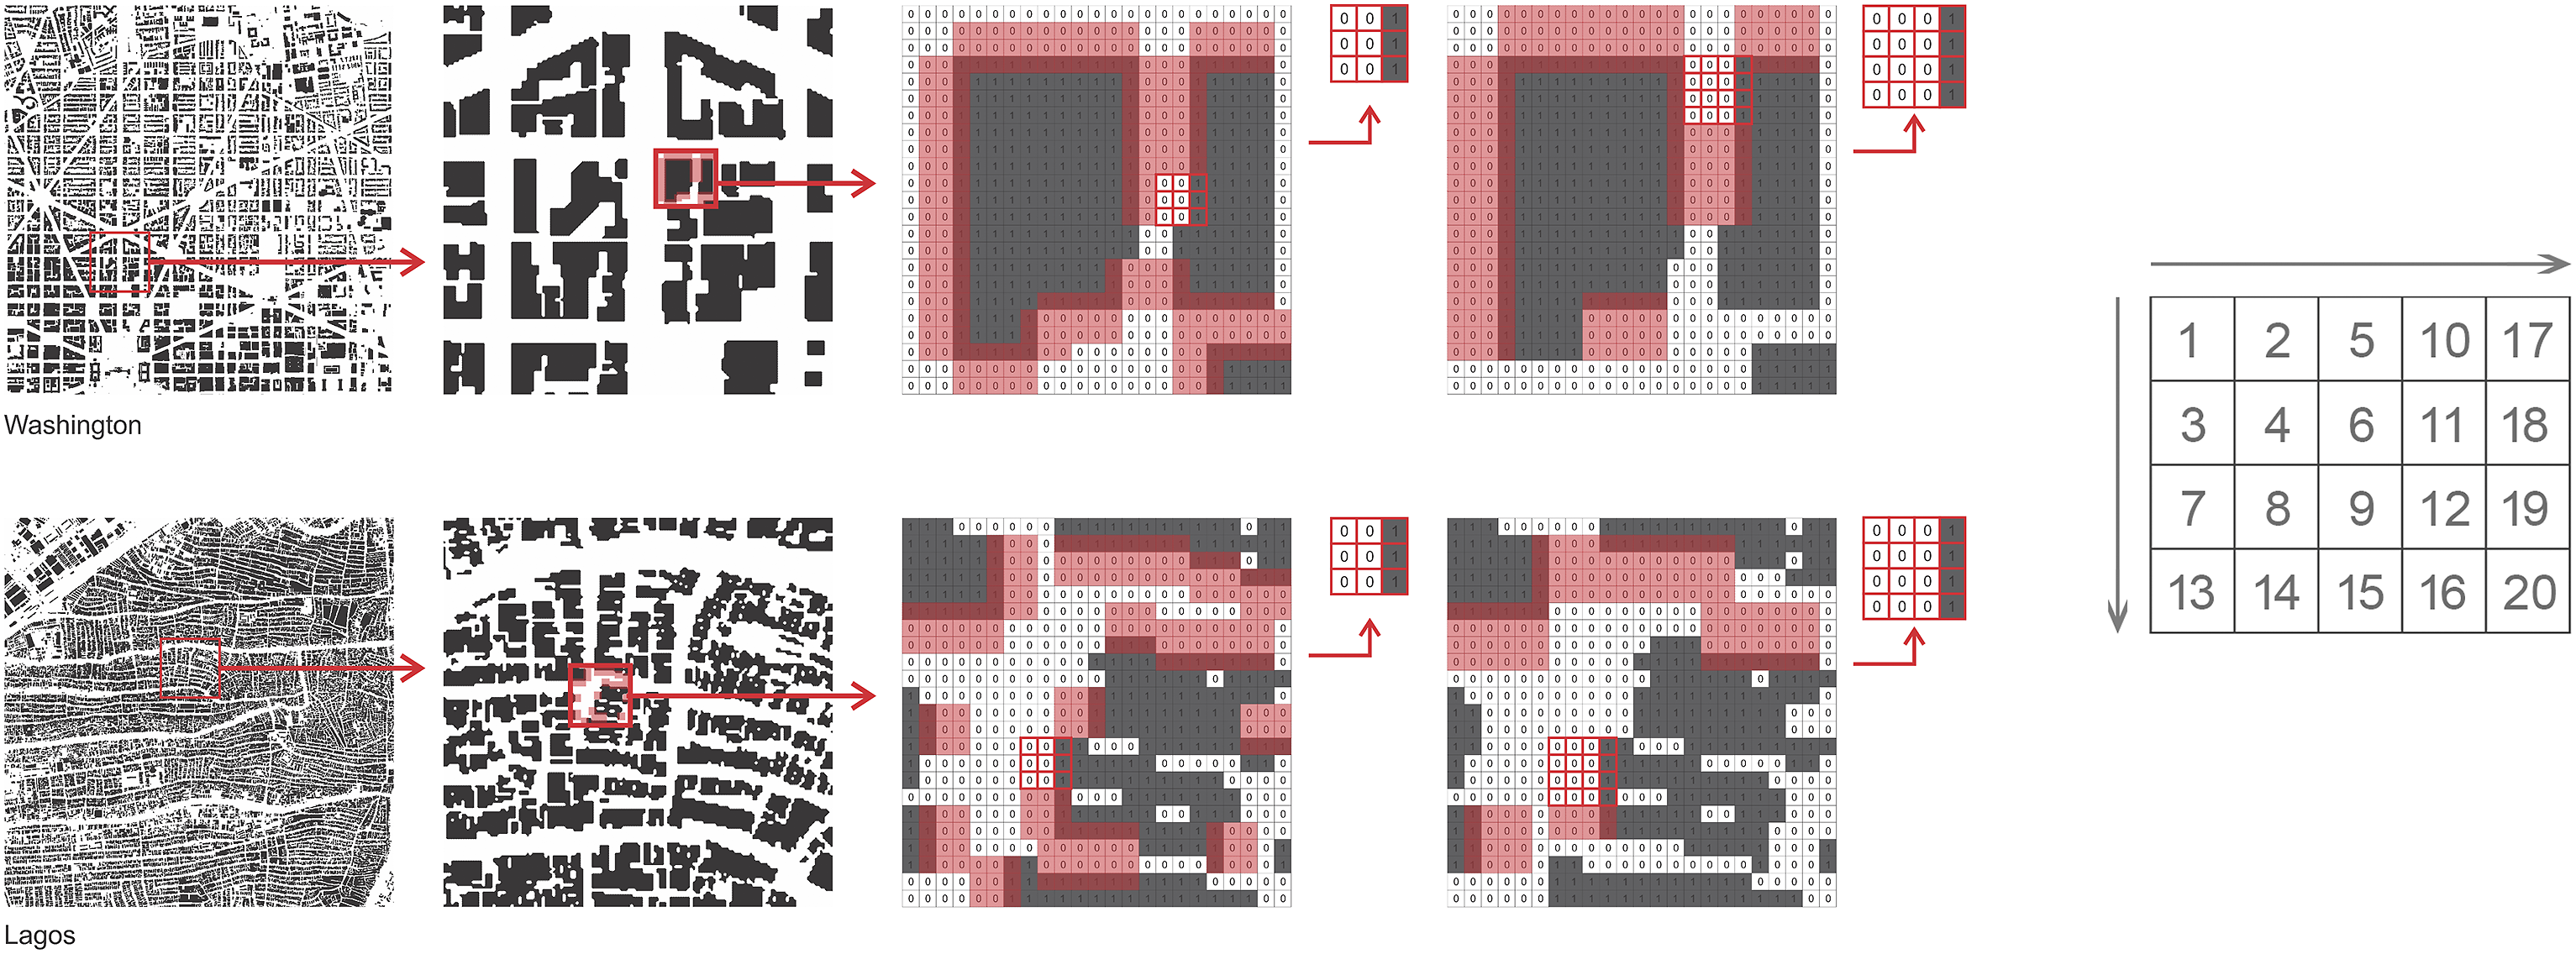
Equation (2) gives precisely the entropy for a theoretically infinite sequence. In real situations, where sequences are finite, our method estimates the probabilities of distinct arrangements of cells within blocks up to a certain size n, counting their frequencies. In short, it counts how many times every possible configuration of cells within blocks of different sizes appears in the selected section of cities under analysis. For example, for calculating H1 (i.e. using blocks of one single cell), it is sufficient to know the cellular distribution, which is approximated by the frequency of 0 and 1 in the sequence. It is important to note that it is common to find in the literature of urban studies, ecological landscapes and image processing approaches that perform some entropy-based analysis measuring our H1 or, at best, our H2. Unfortunately, sometimes these quantities are wrongly referred to as the Shannon entropy of the system, which, in contrast, is our h. However, to measure the Shannon entropy of the global system and not just grasp local properties, h must be quantified. Also, if a cell sequence is perfectly random, h will coincide with H1. The simple density of 1 and 0 would give us the whole system’s entropy only in a situation of absence of structures and patterns. This obviously could not be true for urban systems, where evident structures and strong long-range correlations are present. Estimating entropy is a difficult task, as taking correlations into account means computing Hn for a large n. The estimation of h is good when the spatial range of correlations is smaller than the maximum size of the block entropy we can compute. Nevertheless, such estimations can be rendered difficult because of the exponential increase in the number of distinct cell arrangements in blocks as n grows.
The limit taken in equation (2) can be empirically obtained by fitting the set of H
n
/n points with an appropriate function and then taking its limit for n → ∞. We found heuristically that the following ansatz provides an excellent fit in all studied cases

The fitted value of a gives a reasonable extrapolation of the Shannon Entropy h. Parameter b depends directly on the value of H1. Parameter c characterises how the block entropy estimates H n /n converge to the asymptotic value of h.
Considering our database of 45 cities from North America, Europe, Asia, Oceania, Africa and South America, our goal is to develop a classification scheme based on the similarities and differences between the estimated entropies of the sampled cities. This scheme may help us find entropy levels consistent with specific spatial cultures. To achieve this goal, we introduced a proximity network analysis based on the measured entropy values able to identify clusters or ‘communities’ of cities sharing similar values. Once we obtained the entropy h for all considered cities, we can quantify the levels of similarity defining a distance between cities i and j based on the values of h: d ij = |h i −h j |. We created a matrix of distances for the analysed cities and then defined a network where cities are nodes, and edges (links between nodes i and j) are present only if the value of d ij is smaller than a fixed threshold value. The detection of clusters in this proximity network is a straightforward task considering the relatively small size of our data set. We further developed the cluster analysis applying a method for constructing a dendrogram representation of the distance matrix. We used the unweighted pair group method with arithmetic mean (UPGMA). This method creates a dendrogram that reflects the structure present in the similarity matrix, building a hierarchy of clusters. The algorithm used in this analysis is part of the module Bio.Phylo in the Biopython package (Biopython, 2020).
Results: Entropy, proximity networks and hierarchical clustering
The use of the empirical functions of equation (3) provides an excellent fit for all the considered cities. The values of parameter c are contained in the interval (0.37, 0.68). It is interesting to note that these values are consistent with the values found in written texts, where c ranges from 0.4 to 0.6 (Ebeling and Pöschel, 1994; Ebeling et al., 1995), and with a result for a Beethoven sonata where an exponent of 0.75 was found (Anishchenko et al., 1994). These results seem typical of language-like systems, where the presence of long-range order is characterised by a slowly decaying contribution to the asymptotics of the entropy for large n.
Despite the relatively slow convergence, the fine quality of the fits allows a reasonable extrapolation of the parameter a, which gives the Shannon Entropy h. For example, the results for the estimation of H
n
/n and the corresponding fitting procedure for the city of Los Angeles are displayed in Figure 4(a). Results for the estimation of entropy h for the sampled cities can be seen on a vertical axis in Figure 4(c), showing how this measure introduces a clear sorting among our urban data. (a): An example of the estimated values of Hn/n for the city of Los Angeles. The continuous line represents the best fitting of our data using the function of equation (3). All of the analysed cities show very similar behaviour. (b): Proximity network displaying clusters potentially related to distinct regional emphases on spatial order and similarities in planning cultures. (c): Estimated values of h for the 45 cities under analysis. (d): Dendrogram of North American, European, Asian, Oceanian, African and South American cities under analysis. Colours highlight the relative position of cities regarding world regions. 1 km2 sub-sections show the morphologies of some of these cities, illustrating the method’s potential to grasp distinct spatial cultures.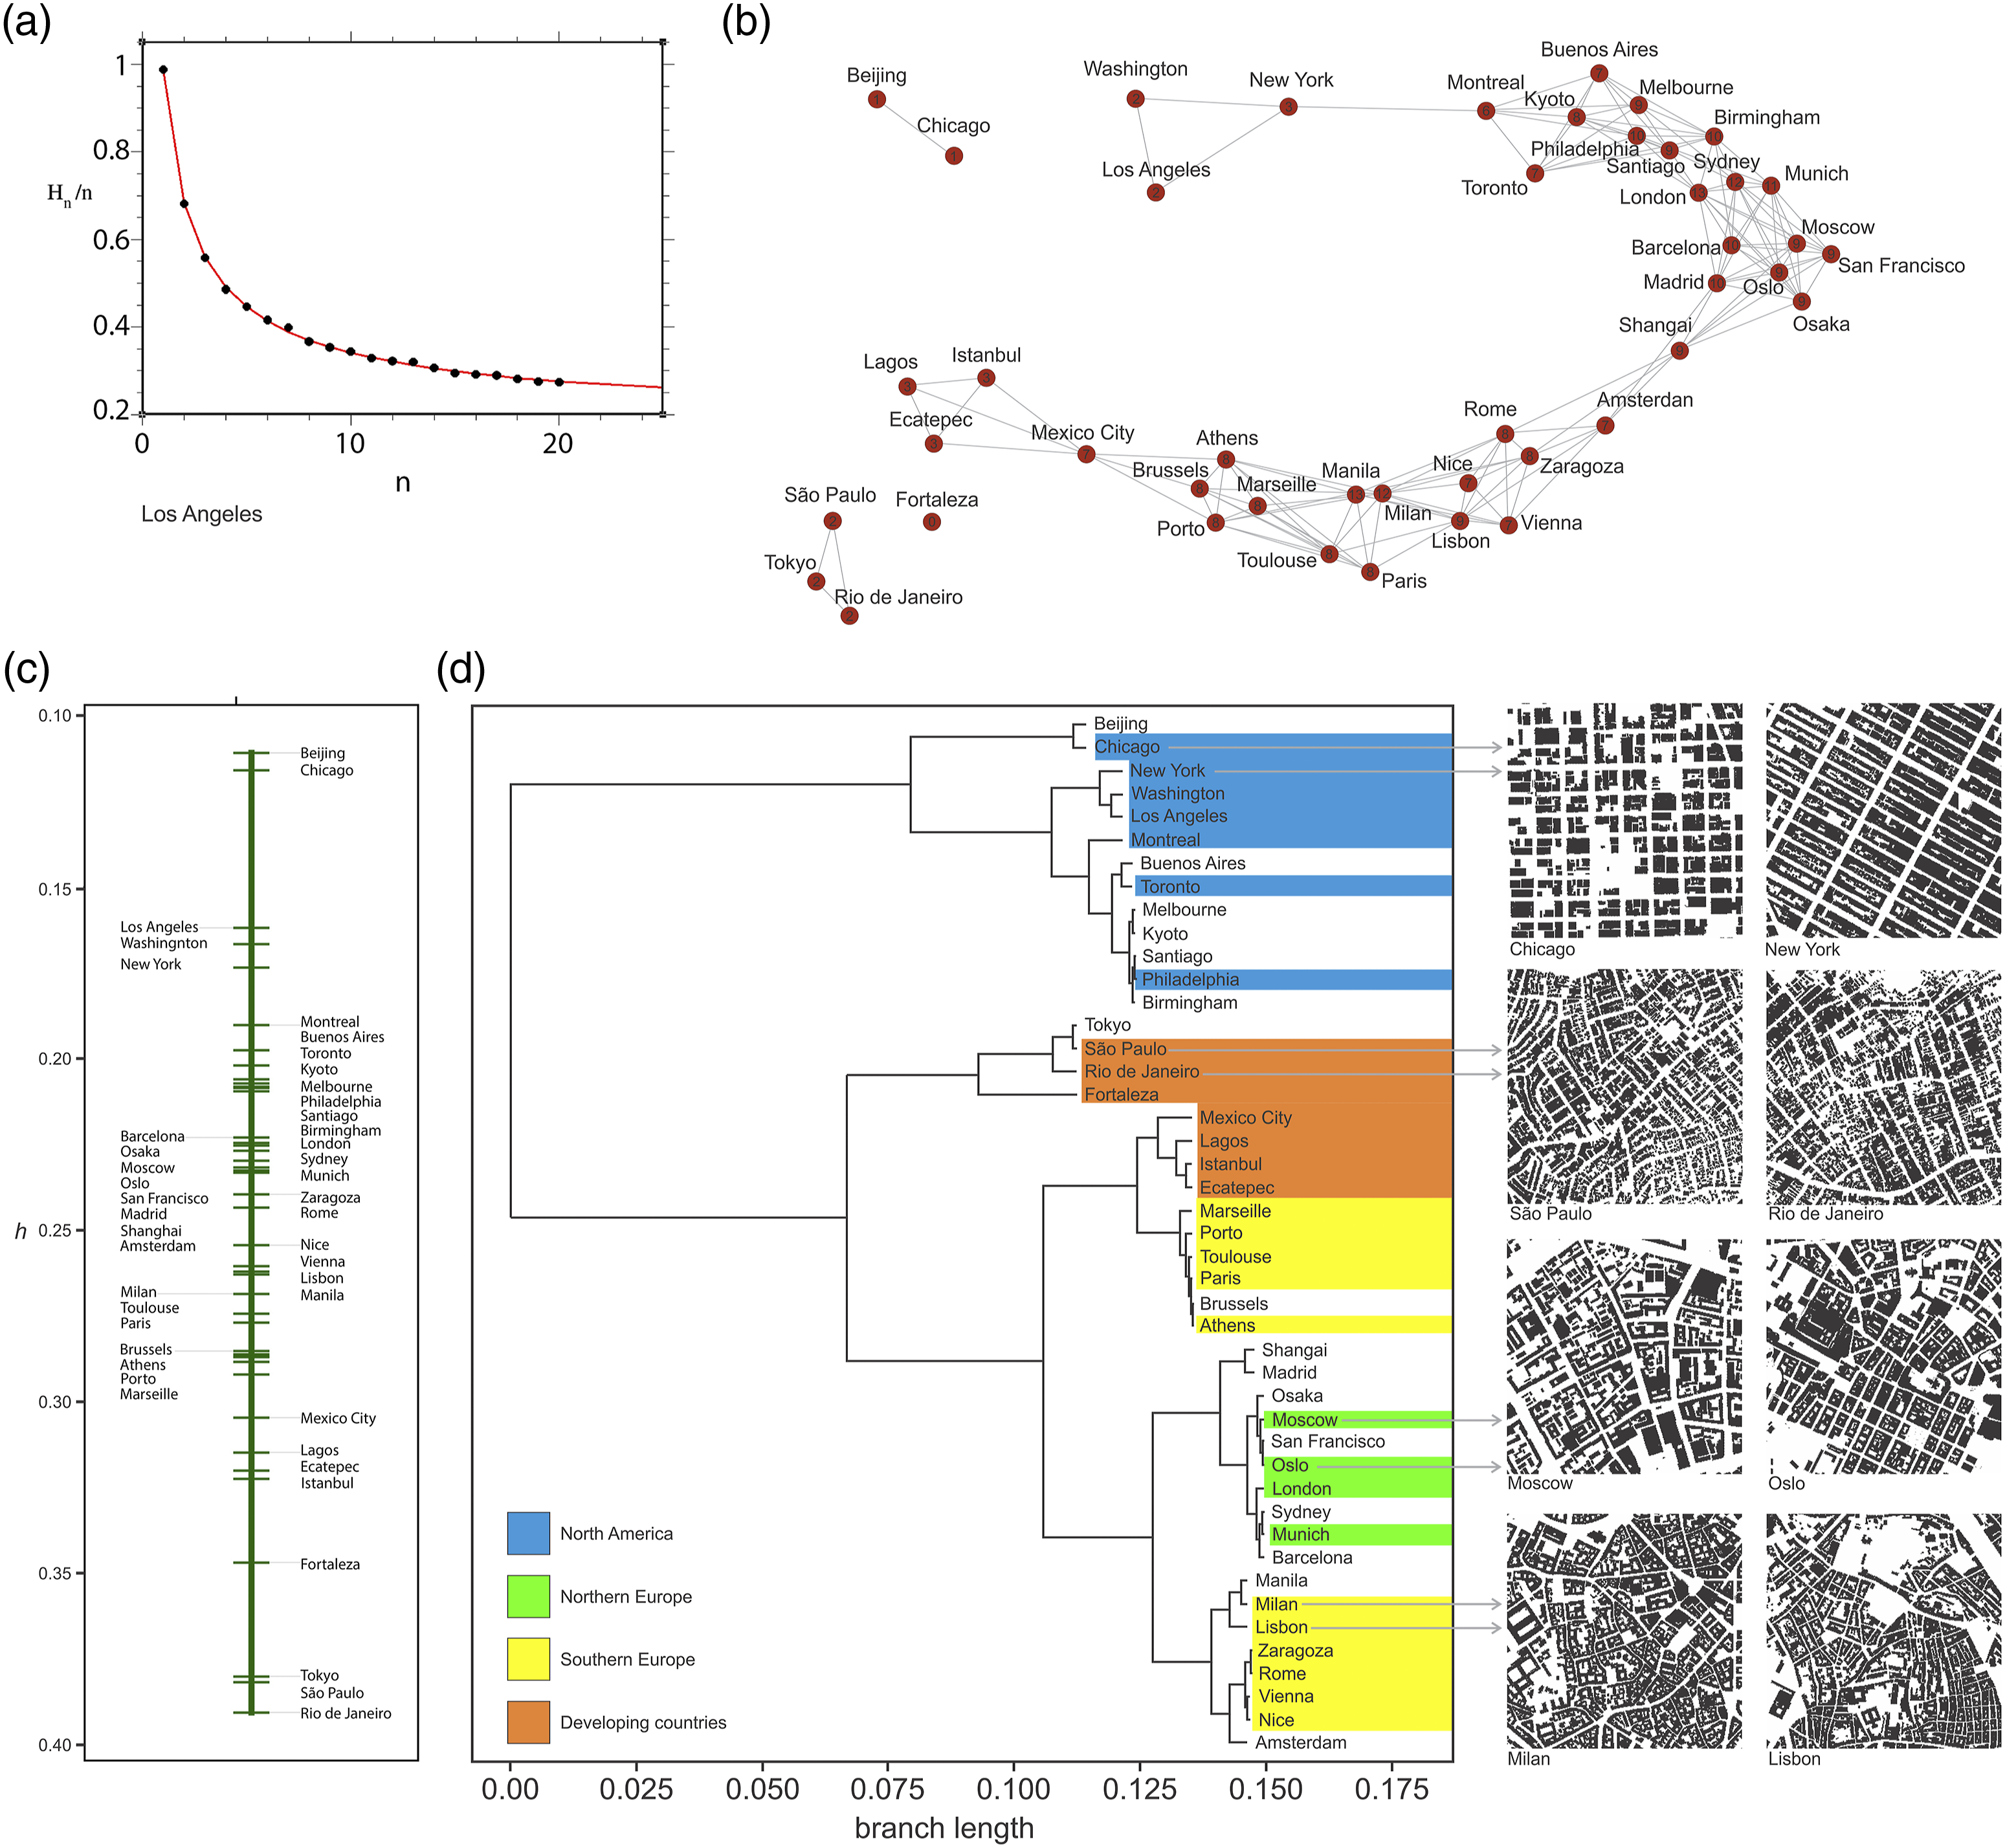
Proximity networks were created to identify potential clusters of cities sharing similar entropy levels. We fixed the threshold value to 0.018, which corresponds to the 90% confidence interval of the extrapolated values of h. The network that joins all analysed cities is displayed in Figure 4(b). The supplementary material (Supplemental Section 5.1) brings the clustering analysis of our pool of cities in growing subsets, starting within the same region. The dendrogram generated by the UPGMA method to the distance matrix of all our city sections can be seen in Figure 4(d).
Discussion
What can the proximity networks and hierarchical clusters based on entropy values tell us about the cultural hypothesis? That means examining the possibility that similarities in the ways of ordering built form can be explained either by (i) regional proximity, as cities from a geographically defined culture and identity (e.g. ‘American cities’, ‘Italian cities’ and ‘Islamic cities’) or by (ii) similarities in the form of producing patterns historically shaped by tradition in self-organised, bottom-up processes or by top-down agencies of self-regulation, allowing us to find elements in common even between different regions. Of course, our analysis brings no value judgement in the sense of pointing out a certain level of entropy as desirable. We may start by interpreting these differences in the light of the ‘planned versus unplanned’ dichotomy so persistent in the urban imagination (Kostof, 1991).
Beginning with the analysis of European cities, we found a subtle difference in entropy levels between Northern and Southern cities. Northern European (i.e. Anglo-Saxon, Germanic and Russian) cities in our sample displayed in general lower levels of entropy – from Birmingham (0.209) and Munich (0.225) to Amsterdam (0.254) and Vienna (0.263) – than Southern (i.e. Latin European) cities, from Rome (0.260) to Paris (0.286) and Marseille (0.292), except for Spanish cities Barcelona (0.227) and Madrid (0.240). While the analysed area of Madrid is composed as a patchwork, its parts are mostly regular in themselves. In turn, a large part of contemporary Barcelona was notoriously built according to Ildefonso Cerdà’s 1859 Eixample orthogonal plan. These features echo the Spanish tradition of regular grids deployed in colonised regions in Latin America, coupled with a strict alignment of buildings’ frontal facades, and contribute to setting them apart from other Southern European cities. Potential common traces in Northern cities include grids usually composed like a patchwork of partially regular areas (e.g. London, Munich and Amsterdam). This development pattern is frequently related to prior rural ownership and property boundaries. Regular grid sections relate to resources like land survey and delimitation based on measurement prior to subdivision into building plots (Kostof, 1991). These cities also display consistency in the building type adopted, leading to regularity in urban block surfaces. For instance, even though Munich’s historical core shows curved urban blocks, frontal and rear facades are predominantly aligned. That said, the position of rear facades may vary considerably, combined with frequently sinuous urban blocks (e.g. Moscow, Vienna and Brussels).
Curves in streets and block systems may follow medieval footpaths of previous open fields and rural field divisions related to landscape features (e.g. historic cores of Milan, Lisbon and Athens). Practical plot division and building modes closely relate to topography (e.g. Lisbon) and watercourses (e.g. Nice, Toulouse and Zaragoza). In these areas, buildings can be strung along topographic lines and watercourses. Despite such irregular features, there is considerable consistency in the position of frontal facades aligned along streets and open spaces (see Supplemental Section 6.1).
When we take the 45 cities into account, we notice three main branches in the hierarchical clusters (Figure 4(d), at a branch length of around 0.075). A first cluster emerges with the lowest entropy cases. It is further divided into three initial branches. Beijing (h = 0.111) and Chicago (0.116) have the lowest entropy levels and are in a branch of their own. Beijing is an exception among the Asian cases, which generally have higher entropy values, from Shanghai (0.243) and Kyoto (0.206) to Tokyo (0.380). Beijing is probably the most strictly planned city in China. Planning was implemented rigorously along cardinal directions following a tradition traced back to the early Ming dynasty (1368–1644 AD), in turn, based on ‘regulations of construction’ from the 15th Century BC, as expressions of both regal power and social order (Wainwright, 2016). Buildings and urban blocks frequently display regular forms and aligned facades. In turn, Chicago epitomises the US tradition of planning cities based on orthogonal grids – and it does so with great regularity and alignment in building frontages.
Other branches bifurcate into a group with major American cities New York (0.174), Washington (0.167) and Los Angeles (0.162), and configurations with the lowest entropy levels from other world regions, like Kyoto, Melbourne and Birmingham, along with other US/Canadian cities Montreal (0.190), Toronto (0.202) and Philadelphia (0.208). Interestingly, Buenos Aires (0.198) and Santiago (0.209) cluster here, quite apart from other cities in Latin America, with high entropy levels. This apparently surprising result runs counter the first aspect of the cultural hypothesis: a similarity in entropy levels for cities within the same culture or region. This has to do with the historic character of these cities, founded in the 16th century in a rigid orthogonal pattern, compared to others in Latin America (see Supplemental Section 6.2).
The second cluster highlights the highest entropy group in the sample, comprised of Brazilian cities Rio de Janeiro and São Paulo, in Latin America (h = 0.391 and 0.382, respectively), followed closely by Tokyo (0.380) and another Brazilian city, Fortaleza (0.347).
The third main cluster divides into communities from high to middle entropy. This cluster further bifurcates into a group with slightly lower entropy levels, Mexico City (0.303) and Ecatepec (0.320) in Mexico, Istanbul (0.322) in Turkey and Lagos in Africa (0.315). Another bifurcating branch between the opposing clusters comprises Southern European cities Marseilles, Porto, Toulouse, Athens and Paris and Brussels to the north. A final large branch of middle to lower entropy cities bifurcates into cities from diverse regions, like Manila (0.274) in the Philippines, Milan (0.277), Rome (0.260), Lisbon (0.268), Zaragoza (0.260) and Nice (0.262) in Southern Europe and Amsterdam and Vienna in Northern Europe; and into more diverse groups with lower entropy cities, like Shanghai and Madrid, Moscow (0.231) and San Francisco (0.233), Sydney (0.224) and Munich, London (0.223) and Barcelona.
These distinct clusters show that we cannot associate specific entropy levels exclusively with specific regions, a first possibility of verifying the cultural hypothesis. We have to ask ourselves what could have triggered similar entropy levels in distinct regions. The idea of a planned-unplanned dichotomy suggests that we look into the actual evolution and planning conditions existing (or not) in these different cities, many of them having faced considerable growth in the 20th century. We checked the existence of modern planning rules that act specifically upon built form, namely: (1) Land parcelling: how land divides into urban plots, and whether there are rules guiding the shape and regularity of plots. (2) The layout of urban blocks and streets: the rules for layouts – say, whether they impose orthogonal systems or ‘planned picturesque’ systems like intentionally curved and varied block shapes and street networks. (3) Regulations on building design and location: whether there are rules that specify the position of buildings in plots (e.g. frontal and lateral setbacks) and neighbouring buildings. We examined the legislation in cases in Turkey, Nigeria, China, Brazil, Mexico, the United States, England and The Netherlands. We found something that goes counter to the planned-unplanned account of ordered and disordered cities: some cities that have top-down planning may also exhibit high built form entropy. They have rules and government agencies that regulate building and urbanisation.
But how can high entropy in the built form be influenced by top-down rules? We found that cities from different regions – namely, Brazil, Nigeria, Mexico and Turkey – have certain aspects of planning in common, which allow significant variation in the built form to come into being. For instance, these cities share emphases on parcel-based, piecemeal developments. New urbanised areas are mostly exempt from requirements to keep connections to neighbouring areas, including street continuity and grid alignment. Another crucial instance is how individual buildings can be positioned in their plots. Some regulations may enforce frontal and lateral setbacks and define rules like increasing setbacks as buildings grow taller. Simple local rules focused exclusively on individual buildings rather than coordinated construction among nearest neighbours lead to a high level of fragmentation in built form. Going a step further, whole areas in these cities are urbanised and constructed by people’s own hands in informal settlements, hence apart from planning regulations. It was especially the case throughout the 20th century when cities in developing countries experienced fast growth. We are likely to find high entropy mostly associated with variation in the shape of urban blocks (related to angular variation in surrounding streets). In short, parcel-based, piecemeal developments, patchworks of different blocks and street networks, and fragmented built form are critical features of highly entropic urban landscapes.
All this shows that cities from distinct regions may have similar entropy levels as far as built form is concerned. Their typical cellular combinations might be different, and they might share neither geographical proximity nor common historical roots. However, they still can contain similar levels of disorder, as captured by our measure (Supplemental Figure S6). It suggests specific common traits between different regional cultures shaping how the built form in these cities is ordered.
Even though world regions do not have entropy values necessarily different from others, individual regions converge around specific values. This interesting pattern emerges once we visually distribute a classification of the 45 cities according to increasing entropy values on a global map (Figure 1). Some world regions show higher levels of regularity and predictability in built form systems than others. This finding suggests that our measure captures spatial information as different emphases on order. Such differences seem consistently associated with varying cultures of planning, the second aspect of the cultural hypothesis (see Supplemental Section 6.3).
Conclusion
This paper developed an approach to spatial information based on Shannon entropy. The approach was designed to measure the entropy characterising levels of disorder in built form systems analysed as cellular configurations. Cities and urban areas with regular arrangements will have specific configurations found much more frequently than others, increasing order and predictability. In turn, cities and urban areas with irregular arrangements will display a broader range of cellular configurations in their spatial fabric – and less predictability. Importantly, regular and irregular arrangements with similar densities will give substantially different entropy results. We applied this method to investigate the hypothesis of ‘spatial cultures’ as ways of ordering urban form in 45 cities worldwide. We verified whether the entropy measure could accurately grasp features and differences in built form systems. We looked for traces of ‘information signatures’ potentially consistent with specific regions or cultures. Our analysis brings the following findings: • Proximity networks and hierarchical clusters show similarities in cities from different regions (e.g. high entropy cities including São Paulo, Tokyo, Istanbul and Lagos), with close entropy values even if they have geometrically different arrangements. It suggests that the measure does not necessarily generate specific values as exclusive ‘information signatures’ for each region, a first possibility of verifying the cultural hypothesis. • Despite that fact, the measure captures something of these regions’ ‘planning cultures’. We found higher frequencies of specific regular arrangements in cities with top-down planning coupled with a strong focus on rules for coordinated construction, each building adjusting and aligning to those around, in ensembles of built form. • A high frequency of specific arrangements can also be found in cases of bottom-up processes potentially involving path dependence. Built form systems can lock into particular configurations reproduced in traditional modes of building – patterns that can be eventually institutionalised into formal planning rules, like the path from pre-modern to modern urbanisation of European cities. • On the other hand, we found plenty of variation in cellular aggregations in urban cultures that allow for the construction of buildings in uncoordinated actions between individual developers. This leads to less regularity and higher unpredictability in what surrounding built forms will be like as cities grow. • In both top-down and bottom-up form-making processes, local rules guiding buildings’ positions seem to trigger bifurcated developments as the built form system evolves in size and complexity, leading either to greater consistency or greater fragmentation. But that is not the whole story, of course. We may find many possibilities between those archetypal paths, or combinations in different parts of cities, like patchworks, or intermingled in layers of ordered and disordered aggregations. Think of the iconic case of Manhattan, based on the regularity of a gridiron street layout and planning rules that made room for enormous variation in three-dimensional built form. • Although they do not necessarily have exclusive values of built form entropy, world regions tend to converge to specific values individually. Cities within a country or region are likely to have remarkably similar built form entropies (e.g. American or Brazilian cities). Such similarity was identified by our method and strongly indicates that their physical form embodies similar levels of randomness. In short, they share ‘a way of ordering space’. This finding echoes Hillier’s (1989) idea that societies create their own spatial cultures. • These results suggest some form of cultural idiosyncrasy consistently inherent to the built form of cities within their countries and regions, captured by a probabilistic measure of entropy. Of course, such a finding invites further examination through a larger sample of cities and other approaches (see Supplemental Section 7.2). Historical conditions and local contingencies are likely at play and must be carefully considered. Indeed, the issue of time is essential and different cities are presumably in various stages of their evolution. We developed a synchronic analysis of current states as a basis for comparison. This approach can be applied diachronically, from formation to pattern emergence to maturity. The information signatures of the same city might even change over time. Such historical questions are subjects for further work.
Finally, we proposed a way of analysing cities at the scale of cellular configurations of built form. We applied it as a step towards a more precise understanding of spatial cultures as emergent patterns – that is, how typical configurations emerge from local aggregations (see Supplemental Section 7.1). Importantly, it is an alternative to methods centred on street networks or classic morphometric characteristics of built form such as shape and density. We focused on the very components of tangible urban form: the combinations of cells that make up cities and their spatial configuration. Differences between results obtained from street network-based entropy measures and our built form entropy measure shed light on potential dissociations between the morphology of streets and the morphology of built form systems in every city. The endless combinatorial possibilities of configurations of buildings, missing from street network approaches, add complexity to urban phenomena and suggest the need for a renewed interest in built form systems.
Supplemental Material
Supplemental Material - From urban form to information: Cellular configurations in different spatial cultures
Supplemental Material for From urban form to information: Cellular configurations in different spatial cultures by Vinicius M Netto, Edgardo Brigatti, and Caio Cacholas in Environment and Planning B: Urban Analytics and City Science
Footnotes
Acknowledgements
VMN thanks CITTA (FEUP, University of Porto, Portugal), and the Foundation for Research Support FAPERJ (Brazil) for financial support. VMN and EB thank the National Council for Scientific and Technological Development (CNPq for financial support. The authors would like to thank the following researchers for their support in the analysis of planning regulations in several cities around the world: Cynthia Adeokun (Lagos and London), Ilgi Toprak (Istanbul), Mayra Gamboa Gonzáles, Juan Ángel Demerutis Arenas and Claudia Ortiz-Chao (Mexico City and Ecatepec), Tatiana Rivera Pabón (Buenos Aires and Santiago), Akkie Van Ness (Oslo and Amsterdam) and Chaogui Kang (Chinese cities). We also thank Lilian Laranja for discussions on culture and built form entropy. Any errors in interpretation are the authors’ responsibility.
Declaration of Conflicting Interests
The author(s) declared no potential conflicts of interest with respect to the research, authorship, and/or publication of this article.
Funding
The author(s) disclosed receipt of the following financial support for the research, authorship, and/or publication of this article: This work was supported by the National Council for Scientific and Technological Development (Conselho Nacional de Desenvolvimento Científico e Tecnológico | CNPq, Brazil), grant numbers 315086/2020-3 (VMN) and 305008/2021-8 (EB), and the Foundation for Research Support (Fundacao de Amparo a Pesquisa do Rio de Janeiro | FAPERJ).
Supplemental Material
Supplemental material for this article is available online.
References
Supplementary Material
Please find the following supplemental material available below.
For Open Access articles published under a Creative Commons License, all supplemental material carries the same license as the article it is associated with.
For non-Open Access articles published, all supplemental material carries a non-exclusive license, and permission requests for re-use of supplemental material or any part of supplemental material shall be sent directly to the copyright owner as specified in the copyright notice associated with the article.