
Abstract
Complex planning processes bear the hallmarks of evolution, in that actors seek to obtain the results that serve their needs best. That is, seek to increase their fitness. As in biological evolution, there are multiple pathways toward fitness. With the rise of adaptive planning approaches, the question how such pathways can be identified in strategic planning processes becomes pivotal. To answer this question, we adapt the fitness landscape model from biology and analyze several strategic planning processes. The analysis demonstrates that one can trace how different pathways to fitness emerge, and which pathways are more successful given the circumstances. We then synthesize these pathways into six strategic archetypes of actor behavior and of interactions between actors.
Introduction
Adaptive approaches to strategic planning may be regarded as a way to deal with the complexity spatial systems (Rauws and De Roo, 2016). Various innovations to strengthen the adaptive capacity of actors and processes in the face of that complexity have been proposed. Some argue for a renewed appreciation of urban codes to re-establish legal frameworks for urban self-organization (Alfasi and Portugali, 2007; Moroni, 2010; Rauws, 2017), others propose alternative models for making decision-making and planning policies more prepared for, and responsive to, unforeseen change (Marchau et al., 2019; Teisman et al., 2009), and again others emphasize the need for experimentation and learning (Evans, 2011). These proposals emphasize the prescriptive dimension of planning but pay less attention to the question how one may analyze such strategies for their success (but with some exceptions, see e.g., Hopkins and Schaeffer, 1985). A better understanding of the pertinent relationships between strategic actor behavior vis-à-vis planning success and failures is pivotal in the face of spatial complexity (Batty, 2010). This requires the development of analytical models that identify, structure and analyze this relationship.
This paper takes on the challenge by adapting and deploying a fitness landscape model from evolutionary biology for the analysis of strategic actor behavior in complex planning processes. The fitness landscape model is a syntactic model that is empirically empty and that lacks teleological assumptions. It assumes that “… the connections between the elements in the system under scrutiny to have as much explanatory power in the analysis of its dynamics as the characteristics of those elements themselves” (Hovhannisian, 2004: 2). The model derives from Wright’s adaptive fields (Bacaër, 2010; Wright, 1931, 1932, 1968) and has ever since been central in analyzing various evolutionary dynamics (Altenberg, 1997; Dobzhansky, 1982; Gavrilets, 2003, 2004, 2014). We argue that this class of models can be used for the purpose mentioned above. Planning processes typically unfold slowly and across sequences of stages (e.g., Assche et al., 2014; Bertolini, 2010; Boons et al., 2009; Gerrits, 2011; Moroni, 2010; Teisman et al., 2009), and are also developmentally open with only temporal moments of closure (e.g., Faludi, 2000; Mastop and Faludi, 1997; Norgaard, 1994, 1995). Think of how actors engage in planning processes to define, for example, a strategic spatial plan for brownfield redevelopment. When coordinating, they seek to reach their own goals. Exactly how they do this depends on how others behave and on other circumstances. In some cases, cooperation may be the best way. In other instances, it may be useful to exercise power to force others to follow. Strategies are conditional and actors deploy various strategies in the belief that these will bring them closer to their goals given the circumstances. As many planners may recognize: there are multiple ways in which one may reach goals.
The struggle for goal attainment in the face of changing circumstances means that planning processes have all the hallmarks of evolution (Allen, 1983, 1998). Goal attainment increases the chance of long-term survival. Strategies that make such goal attainment more likely are selected by actors. Goal attainment can be understood as fitness. Given the fact that actors are different and operate in different contexts, there must multiple pathways to fitness (e.g., Kerr and Tindale, 2004; Siggelkow, 2002). Fitness landscape models can be used to track those different strategies and relate them to the fitness of actors. As such, they can be used to identify the best planning strategy in a given situation. The goal of this paper is to introduce a modified fitness landscape model as an analytical tool for the analysis of complex planning processes. We will first discuss the background of this class of models, and discuss how we converted the original model for the present purpose. By means of an in-depth case study, we demonstrate how the model works. Next, by drawing from a larger dataset, we present six archetypes of actor behaviors and interactions patterns. We conclude the paper with an overview of the ways in which the model can be expanded to incorporate theories of behavior and strategy in complex planning processes.
A fitness landscape to analyze strategic planning processes
A brief introduction about the origins of the fitness landscape model is necessary before discussing the way in which we tailored it for the present purpose. In its most basic form, Wright’s original model (1931) features a set of genes that occurs in combination with other genes (i.e., a genotype). Assigning values to each genotype enabled Wright to represent the distribution of adaptive values under a set of conditions (both genetic and environmental) over the space of genotypes in a two-dimensional field of gene combinations. The location of gene combinations in the adaptive surface is associated with fitness. Fitness expresses the extent to which a genotype fits in a niche and may be mapped and visualized in a third dimension. In this adaptive surface, or “landscape” as it became more commonly known, genes cluster around peaks because gene combinations cannot sustain low fitness owing to selection pressure (but: see Gavrilets, 1998, for a more refined version).
Over time, Wright’s fitness landscape model was extended and modified, such as in the work of Kauffman (1993) and Gavrilets (2014). It has also been deployed in the social sciences, in particular within the niche of the complexity sciences (see Gerrits and Marks, 2014, 2017, 2015; Marks et al., 2019 for overviews and applications). We adapt the version proposed by Kauffman (1993); the so-called NK-model. The NK-model pitches N genes against K interactions. A set of genes (N) contain the information necessary for the materialization of the phenotype of a given organism. However, the information itself, while necessary, is not sufficient in determining the phenotype. The expression in the phenotype of any given gene depends on the interactions (K) it has with other genes. Various combinations of NK may cause an increase or loss of fitness f in each generation.
Kauffman and others have implied that the NK-version of the fitness landscape can be used to analyze any kind of interaction between any kind of agent in relationship to fitness where the adaptive movements or strategies of one agent may influence the success of strategies adopted by other agents (Haslett et al., 2000; Weber and Depew, 1996). It is a small step from this reasoning to the use of the model in those instances where human actors interact to establish fitness, that is, reach their goals. The key point is that this extends to strategic planning as the way in which actors manage to seize opportunities and reach their goals does not only depend on their own capacities but also on interactions with other actors involved in the planning process. There is considerable reciprocity as the movements of one actor influence the possibilities of another. A modified NK-model may be used analytically to map and explain which interactions between various types of actors are more likely to improve fitness than others. The NK model also has at its advantage that all empirical information can be quantified and visualized, as such showing the results in one coherent overview.
The use of the model requires an adaptation from biology to the study of strategic planning processes. We consider N to represent problem definitions and solution definitions (see 2.1), K to represent the interactions between actors (see 2.2) and f to represent fitness (see 2.3). Time is added to the model (see 2.4).
Problem and solution definitions (N)
In the original model, N carries substantive information. Strategic planning processes feature a substantive or content dimension that is defined through the frames that actors hold and modify during the process, as is generally accepted in planning literature (Fischer, 1998; Fischer and Forester, 1993; Healey, 2009; Healey et al., 1997; Rein and Schön, 1996; Servillo & Van Den Broeck, 2012). These frames can be subdivided into two categories: problem definitions (frames about the root causes and definition of the spatial issue, e.g., that a city suffers from excessive car use because alternative transportation is lacking), and solution definitions (frames about the most fitting spatial solutions, e.g., the construction of an urban railway network). These frames often come in combinations where problem and solution definitions are made to match. The abbreviation “PSD i ”—Problem-and-Solution Definitions—denotes that each actor involved in the strategic planning process has her own set of problems and solution definitions regarding the planning issue at hand. In the transformation from the original model to the one for strategic planning, N becomes PSD.
Planning processes are populated by multiple actors. The ones having an actual influence on the planning process should be the focus. Such actors may hold multiple problem and solution definitions so this must be accounted for. The narrowest PSD consists of only one problem definition without a solution definition, and vice versa. At the other end of the scale, the broadest PSD is the set that contains all problem and solution definitions present empirically in the strategic planning process. The number of definitions in the different actor PSDs ranges from one definition to the maximum number of definitions observed at a given point in time. For the present purpose, these numbers are scaled to fractions, ranging from 0 to 1 (but not including 0), where 1 represents the highest number of issues in a definition coded for a certain actor in that specific period, and all other PSDs are fractions of that maximum

Connectedness (K)
Actors in strategic planning processes are usually connected through their interdependence, for instance, due to differences in knowledge, financial means, legitimacy, and formal responsibilities. An example of this may be that a planning authority needs the capital and knowledge of developers to build real estate while the same developers need legal permission from the planning authority to build. The extent to which an actor is connected matters because it is within networks that resources can be activated and distributed, and that support for certain spatial solutions can be activated and pooled (e.g., Hajer and Wagenaar, 2003; Heeg et al., 2003; Hillier, 2007; Klijn & Koppenjan, 2015; Koppenjan and Klijn, 2004; Mason and Watts, 2011; Shrestha and Feiock, 2009). As such, it is necessary to account for the (changes in the) relationship(s) between the actors involved in the strategic planning process. The degree of connectedness, that is, the extent to which an actor is connected to others, is the number of actual links in a network as rate of the number of possible links, that is, network density (Tichy et al., 1979). In the original model, this is expressed as K; in our model, it is denoted as c_score. No planning process starts from a green-field situation so the history of the participating actors (e.g., sense of belonging and history of cooperation in other strategic planning processes) has to accounted for (Marks, 2002; Peyton-Young, 1998). At the start of the planning process being researched, every actor i is connected to some of the other actors, as determined by the researcher

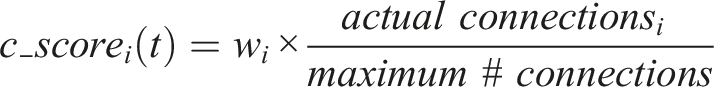
The real world of strategic planning sees a strong relationship between content and the ways in which actors relate to each other (e.g., Elander and Gustavsson, 2019; Henry et al., 2011; Servillo & Van Den Broeck, 2012; Ubels et al., 2019), with the latter being a consequence of the collaboration, coalition forming, beliefs, and friendships. Actors will decide with whom to cooperate or align, or, conversely, whom to avoid or even to contravene, based on their perceptions, strategies, and motives of those other actors (e.g., March, 1994). For example, it is likely that an NGO promoting greener public spaces is better connected to green political parties than to actors lobbying for more highways. As such, there is no independence between the contents of the planning process and the relationships between actors. The strategic planning process is limited to a certain bandwidth that is determined by the configuration of substantive and relational aspects. During the planning process, actors will find out (often gradually) which elements of their PSD are similar to elements of PSD held by other actors, as such informing alignment or, conversely, leading to more distance if the PSDs do not match completely. This reciprocal informing means that a qualitative adjustment based the similarity of PSD needs to be accounted for. We, therefore, attribute weight (w) to the c_score for every actor. The change brought about by the similarity of elements in PSD means that every actor i is now connected as follows

Certain actors will be more isolated, while others will have a more central position. It is also possible that certain actors become more closely linked to each other than they are to the rest of the network, thus forming a subcluster within the network. This basic set-up allows mapping the actors involved in a certain issue relative to each other.
Fitness (F)
Not every interaction or combination of PSDs will be successful. In the original model, success of a genotype is expressed in the attaining and sustaining of fitness. In our model, it means that actors that are closer to reaching their goals are characterized by a higher fitness than those that are further away from reaching their goals. There are a number of aspects to take into account. Individual actors may obtain fitness and lose it later, or the other way around, without coalitions of actors losing overall fitness. Actors may also undertake actions without any direct gains. Fitness in strategic planning processes is therefore of the inclusive kind. It denotes the effect of an actors’ actions on one’s own fitness and that of others directly related to this actor (Grafen, 2006; Hamilton, 1964; West et al., 2011), or conversely that others can have an impact on the fitness of that particular actor, that is, neighbor-modulated fitness. The probability of an actor getting closer to its goals depends on its position relative to other actors and on other circumstances, and not just on its own intentions or deliberate planning. The value (v) fitness (f) is attributed in hindsight by the researcher’s assessment about the probability of actors achieving their goals

The model does not feature a priori assumptions about the combinations of PSD and c_score that lead to higher fitness. This means that researchers have to assign fitness values in hindsight in order to identify patterns before predictions can be made. Alternatively, the model allows for theory testing by pre-loading it with expectations (from existing theories) about what combinations of PSD and c_score are associated with improved fitness.
Time (t)
Strategic planning processes play out over time. In our model, time is captured by recasting processes as series or lineages of connected events, for example, the drawing of a strategic plan, the assessing of the cost–benefit ratio, the development of concrete designs, the political and administrative processes that need to be followed, etc. Within one such lineage certain (external) events may occur that have a significant impact the PSD set, connectedness, and fitness. It may create the possibility of bifurcation, for example, when new actors become involved or a certain planning option is no longer considered. Each period between such demarcating events forms a fitness field. A fitness field is thus the series of related events between the event that starts, alters the field significantly, or ends the lineage. It is up to the researcher to select and connect those events that are plausibly connected during the reconstruction (Abbott, 1992, 2001). Putting each field together reconstructs the entire strategic planning process under study. In turn, depending on the complexity of the planning process, the analysis can cover one or more lineages, each of them defined by the specific issue or project they seek to address.
In-depth case study: planning a new urban district
This section demonstrates how the main properties of the model can be used analytically. To this end, we present a case study regarding the planning of a new, sports-centered, urban district in the city of Rotterdam, the Netherlands. This is a suitable case in the light of the adaptive planning debate, as it is a long-term urban development involving many different types of actors and a plethora of problem and solution definitions. Such projects typically come with uncertainties, related to limitations in the information available for decision-making, ambiguity among actors, and uncertainties about unforeseen future change (Gerrits, 2012; Teisman et al., 2009).
The period researched runs from early 2008 until March 2015; the process is ongoing at the time of writing. The reconstruction derives from various data sources. First, 412 newspaper articles were selected and used to identify the lineages of events. The findings were triangulated using multiple outlets. Further, three policy documents of the municipality Rotterdam, several evaluation reports and 10 interviews with stakeholders were used to substantiated the events, disclosing how actors interacted, as well as identifying their motives for doing things in a certain way. All data were processed in the application built for this purpose.
The area concerned is a somewhat unstructured and under-developed urban district in the south of Rotterdam. It features warehouses, big stores, and the aging Feyenoord football stadium that its owners wish to replace. The municipal authorities and the Feyenoord-family (as the owners call themselves) believe that aligning their interests should enable them to attract funds and to engage in a comprehensive planning effort. We first give a brief description of the six main fitness fields, focused on the relevant bifurcation events creating those fields. The ways in which actors aligned in search for better fitness is shown in the fields across lineage (a visualization is given in Figure S1).
Field 1: 18 December 2008–13 February 2010
The plans for a so-called Stadium Park are presented by the municipal executive on 18 December 2008. It consists of a sports campus with a wide variety of facilities and many new public transportation connections. A new stadium with 80.000 seats should be made ready before 2018. It is proposed that the stadium will host the opening and final match if the Netherlands are selected to host the World Championship Football 2018. The entire Stadium Park should be finished before 2028, in time for the Olympic Games if they are granted to the Netherlands. The planning process is approved and initiated in a council meeting.
Field 2: 13 February–2 December 2010
The bid for the World Championship Football 2018 confirms that Rotterdam will be assigned the opening and final match in a new stadium with 85,000 seats. All discussions are halted when the FIFA appoints the World Championship to Russia instead of the Netherlands on 2 December. There is now considerably less pressure to build a new stadium. The national government also withdraws its financial support because national interest is no longer needed.
Field 3: 21 December 2010–16 June 2011
The largest coalition party in the municipal council proposes to build a new stadium at a different. Other coalition partners agree with the search for cheaper alternatives. The municipal executive announces that the decisions for new stadium will be postponed but that the building of the Stadium Park will continue.
Field 4: 1 July 2011–29 August 2012
The postponement causes actors to search for alternatives: a new location, a new building at the current location, or renovation of the existing stadium. The Feyenoord family grants the building consortium BAM and VolkerWessels the task to develop a cheaper stadium carrying little financial risk for the city. They offer three options, all costing around 300 million euro: (i) rebuilding the old stadium, (ii) a new stadium at the Varkenoord site and the old stadium for other activities, (iii) a new stadium at a new location. A new protest group Reddekuip (Save the Kuip, named after the old stadium) is formed.
Field 5: 29 August 2012–11 July 2013
August, 2012, Reddekuip presents its plan. It argues in favor of renovation. In response, The Feyenoord-family present their plan for a new stadium at Varkenoord (63.000 seats) at an estimated cost of 313–350 million Euros. The political party D66 announces that it will not support the plan for the new stadium. As such the largest opposition party, LR, has the deciding vote. All 14 LR party members will likely vote against the plan for the new stadium. Subsequently the municipal executive withdraws the proposal prior to council meeting and voting. The municipal council agrees with the other parts of the Stadium Park plan, which are then forwarded to the planning department for design and the administrative and legal processes.
Field 6: 12 July 2013–1 May 2014
Several new plans are presented, of which four are deemed realistic: (i) Reddekuip rebuilding the stadium at 70.000, (ii) BAM building a new stadium at the current location, partly using the existing construction at 65.000 seats, (iii) VolkerWessels renovating the current stadium at 63.000 seats, (iv) ZwartsJansma changing the existing stadium by lowering the pitch and extending the second ring, creating the possibility of 70.000 seats. The plans of Reddekuip and BAM are deemed the best and are submitted to the municipal council for a decision. Ultimately the plan of BAM is chosen, owing to their exploitation plan of the new stadium.
Conclusion: 1 May 2014–10 March 2015
BAM hit financial troubles and the price of the plan was raised drastically in response. The final negotiations commenced but all actors agree that a reasonable deal unreachable (9 March 2015). The supervisory board of Feyenoord declined the proposal as it was 16 million Euros over the limit. Negotiations cease.
Outcome
The overall visualization (Figure S1) across the six fitness fields shows a dynamic “dance” of the actors as they attempt to align of diverge, depending on their understanding of the situation and the reciprocal moves of others.
The actor movements follow from the search for fitness. In this search, actors may align when they feel that such alignment can further their cause, or they go alone if they feel that this is better. Continuous feedback informs them about the fit of the strategy. The first field is highlighted as an example. Although no plan is implemented during this episode, certain problem, and solution definitions can be attributed fitness scores. The municipal executive holds the biggest set PSD, that is, 3 problem definitions and 4 solution definitions. The municipal executive is also connected to all other parties, that is, their c_score is 1. All other actors hold smaller PSDs and have lower c_scores. The most successful actor at this stage is also the least connected, that is, the Feyenoord family with an attributed fitness of 0.9. The coalition parties all have been relatively successful (0.7) because they agree with some of the items the municipal executive also desires but are divided about the ways in which the plans should be realized. The municipal executive also seems to realize most of its goals (including a more sports-oriented redevelopment of the area, and a housing upgrade, but no new stadium), that is, fitness is 0.8, at this stage. Its fitness will fluctuate during the entire strategic planning process as captured by the different, subsequent fields. The opposition achieves a low fitness of 0.3 in this stage, because they seem unable to achieve goal at this stage.
In Figure S1, one can observe how actors move across the fields over time. For example, consider the political and populist party LR. Being an opposition party initially, it was against any proposal. However, a successful election campaign saw them becoming a coalition party after the 2014 elections (t5). In order to obtain that position, it had to adopt the set of PSDs as held by the municipal executive. In the meantime, the solution space had also altered considerably (the change from opposition to co-optation is shown in Supplementary Figure 2).
A core feature of the model is that it can show the adaptive pathways of actors: how positions of actors change relative to the movements of other actors in the field. The mutual adjustments over subsequent fields between the municipal executive and the Feyenoord family can serve as an example here (see Figure S4). Popular press depicted them as being diametrically opposed. The model highlights the evidence that this was not the case. The Feyenoord family lost fitness each time it tries to follow a different course from the municipal executive. This is because the Feyenoord family does not gain anything from compromises with other parties and its fate is therefore tightly coupled to that of the municipal executive instead of being diametrically opposed as said in the press. The municipal executive becomes increasingly connected with other parties and broadens its PSD set as it tries to garner support from opposing parties. This brings the executive closer to its goals but at a price: it also must let go of some its original goals because they stood in the way of gaining support. As such, the model demonstrates how two different but closely connected actors had to follow entirely different strategies to increase their fitness in the same planning process (Supplementary Figure 3 visualizes their movements).
Archetypes: formalizing actors' roles and relationships across fields
The example above demonstrated some of the (evolutionary) dynamics characterizing a strategic planning process. The fitness landscape model may be instrumental in identifying the adaptive moves of various actors in response to changing circumstances (of any kind). It also highlights potential interdependencies between pathways to fitness.
The model was used in an earlier study (Gerrits and Marks, 2017) for the analysis of three strategic planning processes. These concerned railway-driven spatial redevelopment programs featuring a wide diversity of actors including public authorities, developers, builders, interest groups, and political parties. Combined with the study presented above, it was confirmed that there are various pathways towards improved fitness, but also—most importantly—that fitness gains (or losses) can be temporal as other actors move, too. Those findings point to a more finely grained understanding of the effects of actor behavior and relationships on the overall fitness of the actor’s coalition. In the remainder of this paper, the six archetypes as derived from this larger study and applied our model will be discussed. First, three actor archetypes are described (see 4.1), followed by three interactional archetypes (see 4.2).
Actor archetypes
The buoy
This archetype represents those actors that remain relative stable across fitness fields, are central to the network (c_score between 0.7 and 1) and hold a large PSD set (between 0.7 and 1). The buoy mutates PSDs or picks up PSDs from other actors in the field and integrates them into its own PSD. This is a reinforcing mechanism, as it is expected by the actors that the buoy will pick up these elements, and the buoy expects that the other actors will expect that the buoy will do so (i.e., conventions, see Llewelyn and Lewis, 1970). Centrality does not mean that buoys can get everything they want. They are often unable to attain and retain a constantly high fitness throughout (hovering around 0.7). However, their central position allows them to influence the PSD sets of others. In many ways, buoys are powerful actors in planning processes, for example, a municipal executive. Its broader view—keeping multiple PSDs in sight and being connected with many others—means that it has the capacity to support actor coalitions and to be responsive to wide range of possible developments. Having said that, it can also lock down the entire strategic planning process because of its potential to dominate.
The jumper
This archetype represents pragmatic actors that are in search of short-term fitness gains. It is expressed in sudden and considerable changes in the PSD set (showing strong changes between 0.1 and 1), as well as in the connectedness (showing strong changes of the c_score between 0 and 1). These changes happen because the jumper attempts to align with actors it perceives as successful at any given point in time, for example, small political parties that try to have some influence by aligning opportunistically. A change in the field can mean that a promising position changes to a disadvantaged one. As such, the jumper has fitness values ranging between 0 and 1, with the median around 0.5 in a normal distribution. A jumper may both amplify and disrupt certain planning processes. Owing to their opportunistic and volatile nature, they can be of help to other actors by giving more weight to the goals these actors aim to achieve. Conversely, some other actors that aim for different goals might be frustrated by the adaptive behavior of the jumper.
The inflexible
This archetype represents actors that hold on to their original position, that is, the PSD set (between 0.1 and 1) changes little throughout the planning process, even if it leads to a decrease of fitness. This is not always a deliberate choice but may stem from the movement of other actors selecting a different PSD set. Holding on to a PSD means the actor will disconnect with those that allow their PSD set to change in the face of changing circumstances. Conversely, it could reconnect with other actors if the changes in the PSD set of those other actors align with the one held by the inflexible. The resulting fitness value for the inflexible ranges between 0 and 1, with the median around 0.35 in a right-skewed distribution. The strategy is associated with a generally low fitness value. This archetype represents actors that have difficulties in adapting to changing circumstances, for example, property developers with high sunk costs. As such, they are at risk of being left aside when the planning process takes a different course. It might be that their PSDs are outdated, or, conversely, too far-fetched for the other actors to relate to. A key question for the other actors to explore is whether the inflexible does not want to adapt or whether this actor cannot adapt. That is: whether they are capable of searching for improved fitness. In the latter case, this may be a matter of inclusivity in the strategic planning process.
Interactional archetypes
The dataset also produced three archetypes that do not center on actors but on the typical interaction behaviors between actors.
Force-to-fit
The archetype “force-to-fit” concerns those deadlock situations from which actors try to move away by collectively raising their connectivity, as expressed in an overall higher c_score. There are three basic options here: (a) to connect with actors in other lineages within the same strategic planning process; (b) to connect with actors in other, unrelated, strategic planning processes in order to create a package deal (i.e., aligning of PSD sets elsewhere); (c) connecting with actors previously not-involved. Successful force-to-fit is seen in an increase of c_score and, consequently, fitness. As a strategy, it is also known as forum-shopping, which can be successful in cracking deadlocks in current planning processes. Naturally, better connected actors may find it easier to engage in such an interaction than more isolated ones.
Self-organized entrapment
This archetype represents a situation in which a central actor, not necessarily a buoy, by its very position will cause other actors scattered across the field to copy its PSD set in the expectation that this will lead to fitness gains. Subsequently, a change in the PSD set and/or c_score by the leading actor causes changes in PSD set and the c_score of the connected actors. The whole field changes but the leading actor remains central. The attempts of other actors to align with the central actor will cause them to (involuntary) move towards each other and cluster near and with the central actor, that is, self-organized entrapment. Fitness gains or losses are likely to be mixed. Importantly, this archetype may suggest that actors are held hostage to a certain situation but in reality, it is a situation they have created themselves by aligning too closely to the central actor that starts to function as a gatekeeper (different from the function in “force-to-fit”). This potentially reduces the ability to change ideas and strategies in the face of changing circumstances.
Diversity breeds diversity
This archetype represents a situation where the introduction of diversity in either the PSD sets and/or the c_scores generates more diversity. The (voluntary or coopted) involvement of other, more diverse, actors (e.g., associations and civil interest groups) raises the number of similar PSDs and related c_score for many actors. Diversity may also grow as a result of actors getting informed by the way other involved actors look at the situation, that is, expanding the variety of elements in their PSD sets as actors discover novel ways to understand and solve the planning task. The expansion of relatively dissimilar definitions means a self-reinforcing rise in c_score, and vice versa. In other words: diversity breeds diversity. The increase can stop because of various causes, for example, saturation of the solution space, or the conclusion of the administrative planning procedure. Although the introduction of more diversity offers a way out of stalled planning processes, there is no clear relationship between diversity and fitness gains or losses. Enlarging PSD sets increases the chance that certain elements of that set will be realized, but also that compromises must be made to make that happen. This is mainly beneficial in situations where there is readiness to accept the uncertainty inherent about change. Informative for planning interventions is that this archetype can be stimulated by increasing connectivity between actors as well as mutual understanding for each other’s position. It emphasizes the importance for planners and decision-makers to keep various pathways open during a planning process, allowing for a shift from one pathway to another when changing circumstances result in a deadlock.
Conclusions and discussion
We modified a fitness landscape to analyze the evolutionary dynamics of strategic planning processes and to assess which strategies lead to increased fitness given certain conditions. Based on an empirical study, we demonstrated the model’s main functions. We presented three actor archetypes and three interaction archetypes. We consider fitness landscape models of this kind as a substantial progression beyond mere descriptive accounts of planning processes because it offers a formalized and actor-centered analytical approach that is grounded in empirical research.
There may be more archetypes to be discovered through further research and expansion of the dataset. The model may also be used to focus on other dynamics than the ones we highlighted. On top of that, the model itself may be further extended and refined. The current version is somewhat insensitive to territory, place and scale (e.g., Jessop et al., 2008), all of which would need to be added. Although networks are considered by means of the c_score, politics of scale and governance rescaling processes could contribute to a further refinement of the c_score. Politics of scale tie in with politics of space (Cox, 2010), in particular with the definition and representation of territory and places, and the panorama of territorial governance dynamics (Schmitt and Van Well, 2016; Stead, 2014). As such, the incorporation of scale into the model would enable the researcher to discern different types of lineages and the actions of actors within and between those lineages.
Another extension of the model would be to make the c_score more realistic when it comes to the relationships between actors. This is where items such as power, hierarchy, and influence come to the fore. This extension of the model can be fueled using theories from the political and administrative sciences. For planning studies, it is also important to include the differences (and similarities) between top-down and bottom-up processes by looking at the moves performed by civil society (e.g., García, Eizaguirre and Pradel, 2015). As the model offers measures of actors' connectivity and interactional archetypes can be recognized, we acknowledge a potential synergy with social network analysis (SNA; see e.g., Marin and Wellman, 2011). Interactional archetypes can be types of ties where, for instance, self-organized entrapment could be linked to actors performing the role of gatekeepers, and diversity-breeds-diversity could be linked to networks involving brokers. Hence, the current version of the model offers an unrestricted template to accommodate such extensions.
Earlier, we noted that the model has no prior assumptions about the relationships between PSD, c_score and fitness. The use of theories about strategic behavior in planning processes (e.g., Fischler, 2000; Hopkins, 2001; Hopkins and Schaeffer, 1985; Scharpf, 1997; Stevenson and Greenberg, 2000) may be used to substantiate the structural relationships between these three dimensions and to test them for their predictive strength. Likewise, the researcher may pre-load the model with expectations about actor behavior in complexity and uncertainty (Fischhoff, 1975; Kahneman and Tversky, 1979), for example, to investigate how preferences and attitudes (e.g., Zajonc, 1980) shape PSD and c_score. In addition, we would like to point out that the model, while empty empirically, is likely to capture dynamics such as the ones expressed in the garbage can model (Cohen et al., 1972) and the streams model (Kingdon, 2004). As such, it embodies the complexity of planning processes. We believe that more empirical applications of the model to a variety of empirical cases, as well as its further reinforcement and connection with existing planning theories, can help expand the analytical power of the model to explain the complex evolutionary dynamics of planning processes.
Supplemental Material
Supplemental Material - Strategic archetypes of planning processes: Model and evidence
Supplemental Material for Strategic archetypes of planning processes: Model and evidence by Lasse Gerrits, Peter K Marks, Sofia Pagliarin and Ward Rauws in Environment and Planning B: Urban Analytics and City Science
Footnotes
Declaration of conflicting interests
The author(s) declared no potential conflicts of interest with respect to the research, authorship, and/or publication of this article.
Funding
The author(s) received no financial support for the research, authorship, and/or publication of this article.
Supplemental material
Supplemental material for this article is available online.
Author Biographies
References
Supplementary Material
Please find the following supplemental material available below.
For Open Access articles published under a Creative Commons License, all supplemental material carries the same license as the article it is associated with.
For non-Open Access articles published, all supplemental material carries a non-exclusive license, and permission requests for re-use of supplemental material or any part of supplemental material shall be sent directly to the copyright owner as specified in the copyright notice associated with the article.