
Abstract
Accessibility and affordability are critical challenges for household water consumption in urban India. While the previous research on affordability and water tariff setting is substantial, the interplay of water access equity and its impact on household water expenditure is less understood due to the absence of granular household level data in India. This research draws upon the NSSO’s 76th round of data collected across the country to explore the differences in water access and expenditure amongst various income categories. Using regression analysis, this paper investigates the association between the socio-economic, tenurial status, sources of water, sufficiency, and access related factors and the household expenditure on water. Results show that water is a scarce commodity for lower sections of society and that they are incurring higher costs, making the water relatively unaffordable. The research findings indicate that the policymakers and project proponents need to develop more targeted metrics for measuring the disparities and configure interventions that mitigate the inequalities in urban water provision.
Introduction
The provision of adequate drinking water has been the primary policy goal for many governments worldwide and has been one of the main policy agendas for a few decades (Adams, 2018). However, the world’s situation in providing safe and adequate water is sub-optimal, as recorded by numerous agencies. Nearly 771 million people do not have clean drinking water access and nearly a quarter do not have access to sufficient drinking water (WHO/UNICEF JMP, 2021). Besides drinking, households also need water for cooking, cleaning, and other household uses, further extenuating the situation. The precarious situation of water demand and supply poses a challenge for India’s water future as well. The current projections of demand for water by the Water Resources Group indicate that half of the demand would be unmet by 2030 (Tiwari and Pandey, 2011). Water is essential for life and this is reiterated in the principles of the Conference on Water and Environment held in Dublin in 1992 and the Sustainable Development Goal Target 6.1 “achieve universal and equitable access to safe and affordable drinking water for all” (United Nations, 2015).
The availability of safe and adequate water for household consumption, particularly to the urban population in India, is below expectations (Chandran et al., 2021), even though the access infrastructure for water has increased substantially and has reached 90% of the population (Ministry of Statistics and Programme Implementation, 2018). Increased urban population due to migration from rural areas, industrialization, and the associated living styles have resulted in substantial water stress (Swamy et al., 2018). Over-reliance on ground water, misuse of the surface water sources have disturbed the natural cycle of water availability (Chatterjee and Roy, 2021). No Indian city can claim 24/7, 365 days a year access to piped water systems from their civic water provider (Dharmapuri Tirumala et al., 2020).
The impacts of sub-optimal access to drinking water are well documented (Amit and Sasidharan, 2019; Boakye-Ansah et al., 2016; Cassivi et al., 2021; Dos Santos et al., 2017; Swamy et al., 2018; Tambe et al., 2015), which lead to diseases such as diarrhea, cholera, etc. (Fink et al., 2011; WHO UNICEF, 2012). Adequacy, affordability, and accessibility of good quality water and in sufficient quantity for urban households have a significant positive impact on the socio-economic development of countries (Boakye-Ansah et al., 2016). Water managers and governments across the world have used policy instruments relating to tariff and income support mechanisms to manage water demand and mitigate water poverty (Pinto and Marques, 2016). Indian urban drinking water system management continues to face challenges both on the supply side (focused on providing piped water systems) and demand-side (targeted towards tariff setting improving economic, environmental, and social efficiencies) (Amit and Sasidharan, 2019; Dharmapuri Tirumala et al., 2020).
However, the critical constraint in India, as is the case in other developing countries, is the lack of reliable data and opacity in the urban water sector (Gopakumar, 2010; Swamy et al., 2018; WSP, 2011) for making appropriate policy interventions. There are only a few national or sub-national household level information surveys. Without access to information from a large household sample, it is difficult to differentiate equity, access, and affordability concerns across urban India and different parts of the country.
This research investigates the access, adequacy, and consumer expenditure on water by using information from the 76th survey of the National Sample Survey Office across various categories of households. Using data from a large sample survey of 174,316 urban households across the country, this research analyses household demand for water and its determinants. The household demand for water is met through various sources. Inadequacy of piped water leads to meeting requirements for water through sources such as groundwater or open water sources (ponds, rivers, etc.) or even commercial bottled water with varying implications on demand, time spent on procuring water, and health. These raise questions related to accessibility and affordability, and the role of public programs in meeting the water needs of households.
The rest of this article is organized as follows. The following section presents a literature review relating to the affordability and accessibility of drinking water in urban settings. Next, the Indian urban drinking water context is described, setting out the broad institutional practices. The empirical method employed, and the data used for the analysis are presented in further sections. Subsequently, the results from the regression model are discussed, followed by policy implications and conclusions.
Literature review
Water policy-related themes are some of the most widely researched topics, yet there are very few universally accepted definitions of affordability and accessibility of water (Adams, 2018; Adams et al., 2016). The most commonly accepted metric of accessibility from the United Nations and the World Health Organization includes the proportion of the population with water coverage (WHO/UNICEF JMP, 2021). Previous research measures these aspects in terms of source improvements (Mahama et al., 2014; Osei-Kyei and Chan, 2015), physical attributes such as the time taken for water collection, distance from the source, type of source (Devi and Bostoen, 2009; Majuru et al., 2016), availability and reliability (Smiley, 2017), and societal and financial groupings with access to water (Flores et al., 2013). The discourse on the accessibility and affordability of drinking water became a mainstream item following the UN’s resolution in 2010, which had set out the right to water in terms of sufficiency, safety, acceptability, within physical reach, and affordability (Cassivi et al., 2021). The socio-economic status of households has also attracted considerable attention while studying the accessibility and affordability (Adams et al., 2016; Larson et al., 2006; Rahut et al., 2015).
Water demand management constitutes addressing the availability of water and needs to ensure equity and affordability (García-Rubio et al., 2015; Lopez-Nicolas et al., 2018). Access to water is increasingly constrained in urban areas due to the rapidly increasing population, depleting water sources, and increasing cost to supply piped water (Lee et al., 2016). Water providers have grappled with balancing household expenditure on water relative to their income and the recovery of cost to supply water (Amit and Sasidharan, 2019; Burt et al., 2018). The policy design to enable addressing the social concerns of equity, adequacy, and affordability requires information about consumption levels of households, which is often not available (Lee et al., 2016; Pinto and Marques, 2016).
Water tariffs play an essential role in water policy, particularly in the urban population (Silva Pinto and Cuhna Marques, 2015). OECD’s initial study in 1999 setting out the linkage between pricing usage of water and the development of water resources for efficient management of water saw too many countries setting their tariffs for urban drinking water to meet a significant proportion of their costs. Their subsequent study in 2010 reiterated the actions taken by various countries. However, the challenge of providing water equitably and affordably has continued to dominate the discourse over pricing-related research. For instance, Australian cities chose to impose supply restrictions to mitigate the impact of the drought that ended in 2010 instead of using pricing to affect the demand (Barker et al., 2021; Wilkinson and Gibbs, 2021). The impact of such a strategy is widely debated, with arguments on either side of demand and supply management having a more significant impact on providing wider access to water for household consumption (Colloff et al., 2021). Countries like India and Spain have used either a flat tariff or volumetric-based water pricing models that lower the cost of water used for low-income families (García-Rubio et al., 2015; Lee et al., 2016). Some other countries like Chile provide direct water subsidies to low-income households (Lopez-Nicolas et al., 2018).
The measures of accessibility and affordability typically have used drinking water-related expenditure either directly or in relation to the total household income, provisioning costs, or economic costs (Hutton, 2012). The availability of information (ease of capturing the information, comprehensiveness, and reliability) often determines how the policy managers use different metrics and base their interventions (Hutton, 2012). Typically, expenditure data are collected and used by many countries, even though the same may not fully reflect the real economic cost of water consumption (Mack and Wrase, 2017). Researchers, however, argue that expenditure-related analysis provides a better perspective as the information regarding household income is also incomplete, particularly in countries with substantial informal economic activities (Adams, 2018; Hutton, 2012). A notable limitation of the expenditure-based analysis is that larger households with average incomes may be categorized as facing water poverty due to their conspicuous consumption of water. This contrasts with households with smaller household sizes and with limited expenditure capacities who consume water mainly for essential uses (Mack and Wrase, 2017).
This paper attempts to examine the interrelation between household water expenditure and water source accessibility, availability, and living conditions. The efficiency of government programs is also examined.
Indian urban drinking water context
Household water supply in India consists of both formal (piped water) and informal (surface, ground, and private) supply, where the latter is less regulated (Swamy et al., 2018). Less than half of the Indian urban population has access to a piped water supply (Ministry of Statistics and Programme Implementation, 2018). After the 74th Constitutional Amendment Act in 1992, the provision of urban water supply is considered a municipal function and has been progressively transferred to local government bodies (Kundu, 2014). The process of transfer and the institutional structures that have been adopted vary substantially across the states in the country (Tiwari et al., 2015). In larger cities, the city corporations manage the water supply, including the sewerage systems. A state-level parastatal agency (a state owned undertaking set up for a specific purpose, carrying out the sector specific activities except policy formulation and governance), usually a Water and Sewerage Board or a department of public health and engineering, undertakes the construction of the capital works. The larger metropolitan cities such as Delhi, Hyderabad, Chennai and Bangalore have their respective Water and Sewerage Boards. The smaller cities typically have a department under their municipal body that operates and maintains the water supply systems.
The water sector is a state subject in India, and the role of the central government is limited to a few items mentioned in the concurrent list of the Constitution of India. Hence, the role of the central government has been mainly in setting the standards for managing the system and providing finance to states and local bodies to augment infrastructure for supply of water (Sugam and Ghosh, 2013). The government of India has launched many initiatives that provide finance for the development of the urban water sector (together with sewerage and sanitation services), which the states can access (Amit and Sasidharan, 2019). The major financing initiatives include (i) Jawaharlal Nehru National Urban Renewal Mission (JnNURM), a scheme that focussed on urban infrastructure development; (ii) Swachh Bharat Mission, which focussed on sanitation for select cities; and (iii) AMRUT, that provided access to funding across a broader group of cities across various urban services. The Government of India has recently announced the Jal Jeevan Mission (Urban), which envisages universal water supply to 4378 urban local bodies with approximately 28.6 million household tap connections. This scheme is expected to be implemented over 5 years with an estimated outlay of approximately USD 40 billion (Ministry of Jal Shakti, 2021). For the financial year 2020-21, an estimated 21.4 million functional household tap connections (FHTC) were provided in India, with 26 districts achieving 100% coverage with FHTC. It is anticipated that the focus of policy going forward would shift towards sustainability, emanating from changes in behavioral patterns from the current objective of achieving a physical target of tap connections (India Water Portal, 2021).
The water tariffs in India have multiple formats. Most of the smaller cities levy fixed, flat monthly tariffs while in cities with access to metering, volumetric or incremental block tariff methods are used (Singh et al., 2005). The tariffs in India are low, which usually are not adequate to recoup the cost of providing urban drinking water services (Dharmapuri Tirumala et al., 2020).
The private sector participation has been a mixed bag in the Indian urban drinking water sector (Swamy et al., 2018). They were numerous public private partnership arrangements that have been formulated across the country, typically in medium to large cities, with substantially different risk transfer mechanisms. One of the more common PPP arrangements has been the management contract with the capital expenditure of supplying water being borne by the public sector project proponent while operational cost is borne by the private sector who then have a claim on the tariff revenue. The number of private players has reduced substantially in the last few years as the PPP space across all infrastructure sectors in the country has considerably slowed down (Dharmapuri Tirumala et al., 2020).
The consequence of the precarious supply of piped water and rising demand has been that households attempt to meet their water requirements through various means—formal and informal depending on their income, and availability and accessibility to these sources (Amit and Sasidharan, 2019). Higher-income allows households to source water from private and public suppliers of bottled water at a higher cost. Lower income households meet their unmet demand through informal sources such as groundwater and water collection from lakes and other water bodies at a considerable time cost.
Method and data
This paper estimates demand for water as a function of household characteristics, household income (annual consumption expenditure), price, water source accessibility, availability, and living conditions. Demand is measured as expenditure on water. Expenditure on water (EXP) in a year is the product of the number of units of water consumed by a household and the price paid per unit of water. To estimate the water consumption demand function, the actual expenditure on water (EXP) is used rather than the quantity of water demanded and consumed
The price elasticity of demand (EP) and income elasticity of demand (EY) are calculated as follows:

Or,

Or,

The data for the research has been taken from the 76th round of survey conducted by the National Sample Survey Office (NSSO), Ministry of Statistics and Programme Implementation, India, in 2018–19. Drinking water, sanitation, hygiene, and housing condition are the focus area for this survey round. 174,316 urban households have been surveyed from all the states and union territories. The NSSO survey captures various demographic, socio-economic, tenurial status, water-related sources, accessibility, and sufficiency data. However, the NSSO did not capture the price of water for each household in its survey. For estimating the price of water in the demand function, the instrumental variable approach is typically used in the housing literature (Cheshire and Sheppard, 1998; Murray and Sun, 2017). Water prices and expenditure in a neighborhood are correlated with each other and can be considered as instruments. The average water expenditure for all households in the district is used as the instrumental variable for the price of water consumed (Pw).
The demand function is estimated for the entire urban household in India. Three different consumption expenditure groups were also analyzed (as a proxy for income, which correspond to the conventional groupings of economically weaker households, low-income households and middle- and high-income households). The three groups correspond to annual expenditure less than Rs 240,000; expenditure between Rs 240,001 and 480,000; and expenditure more than Rs 480,000. Assuming these to be 80% of annual income, these correspond to income classes of less than Rs 300,000 economically weaker households), Rs 300,001 to Rs 600,000 (low-income households), and above Rs 600,000 (middle- and high-income households).
Description of the predictor variables.
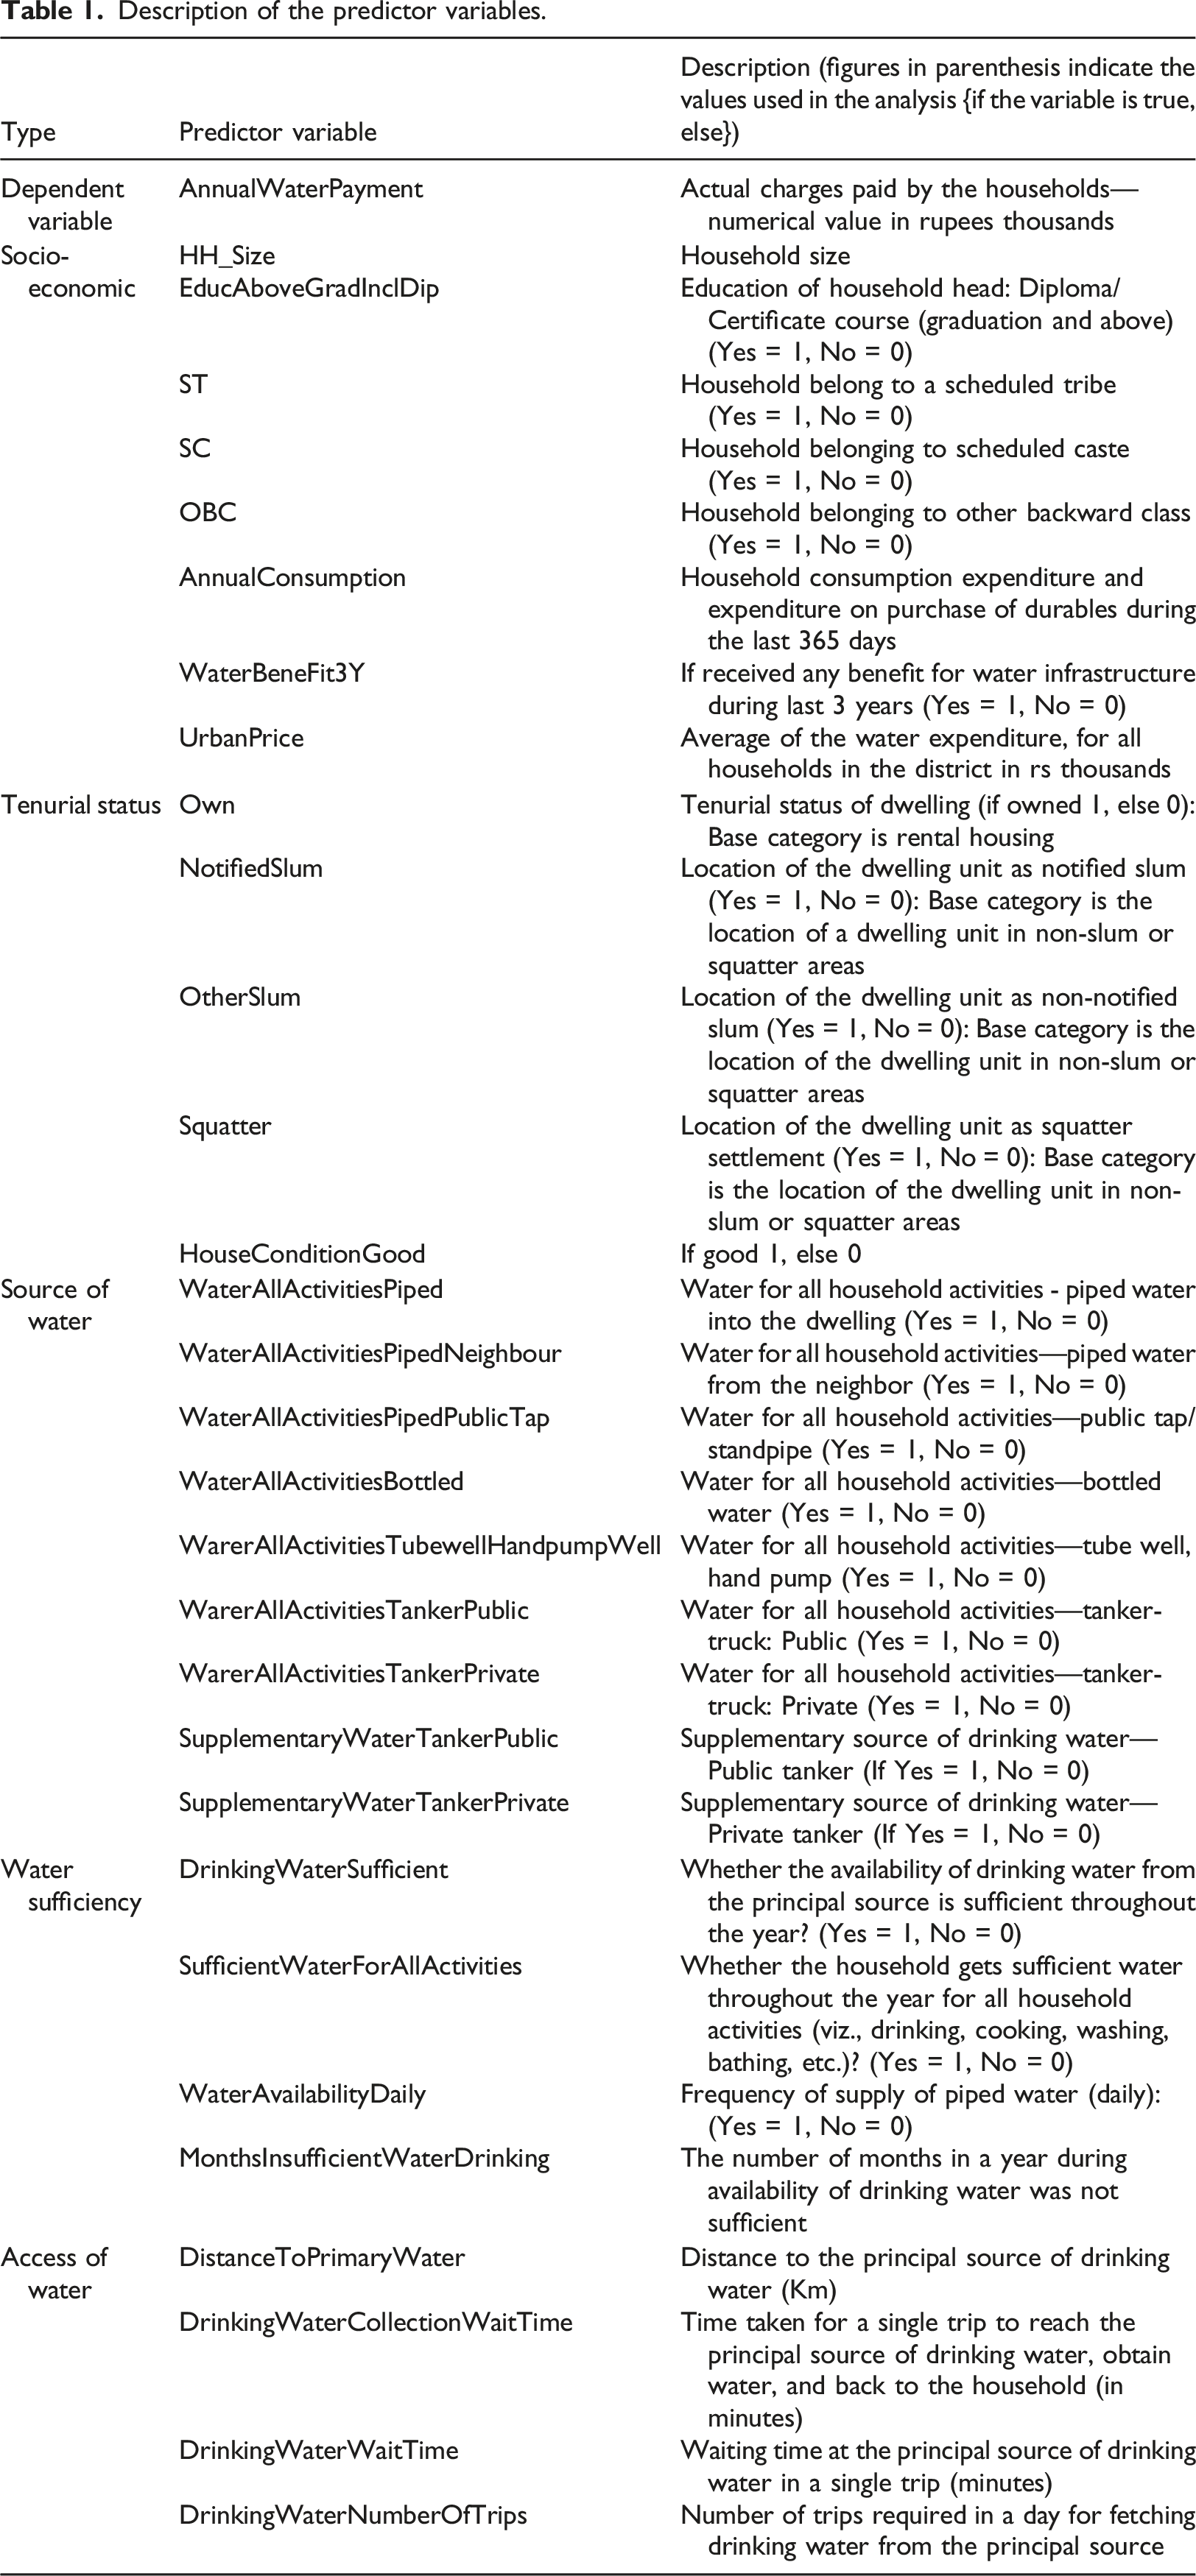
The predictor variables reflect a range of characteristics. Socio-economic variables (seven) include household size, highest education level of the head of the family, societal class (scheduled caste SC, scheduled tribe ST, and other backward class OBC), annual household consumption expenditure and expenditure on purchase of durable goods (as a proxy for annual household income), and receipt of water-related benefits from the government in the last 3 years. The housing and tenurial status variables include the ownership status of the dwelling, the house condition, residing in notified slums, other slums, or squatters. The variables that relate to the source of water for various activities include piped water for all activities from the dwelling, piped water from the neighbor, piped water from a public tap, bottled water for all activities, water from a tube well/hand pump/well (groundwater), water from public tankers, water from private tankers, supplementary water from a public tanker, and supplementary water from a private tanker. The water sufficiency variables include having sufficient drinking water, sufficient water for all activities, daily availability of water, and water availability in different months. Distance to the primary source, time taken for water collection trips, wait time for water collection, and the number of trips required per day indicates the variables relating to access to water.
Descriptive statistics (Number of observations = 174,316).
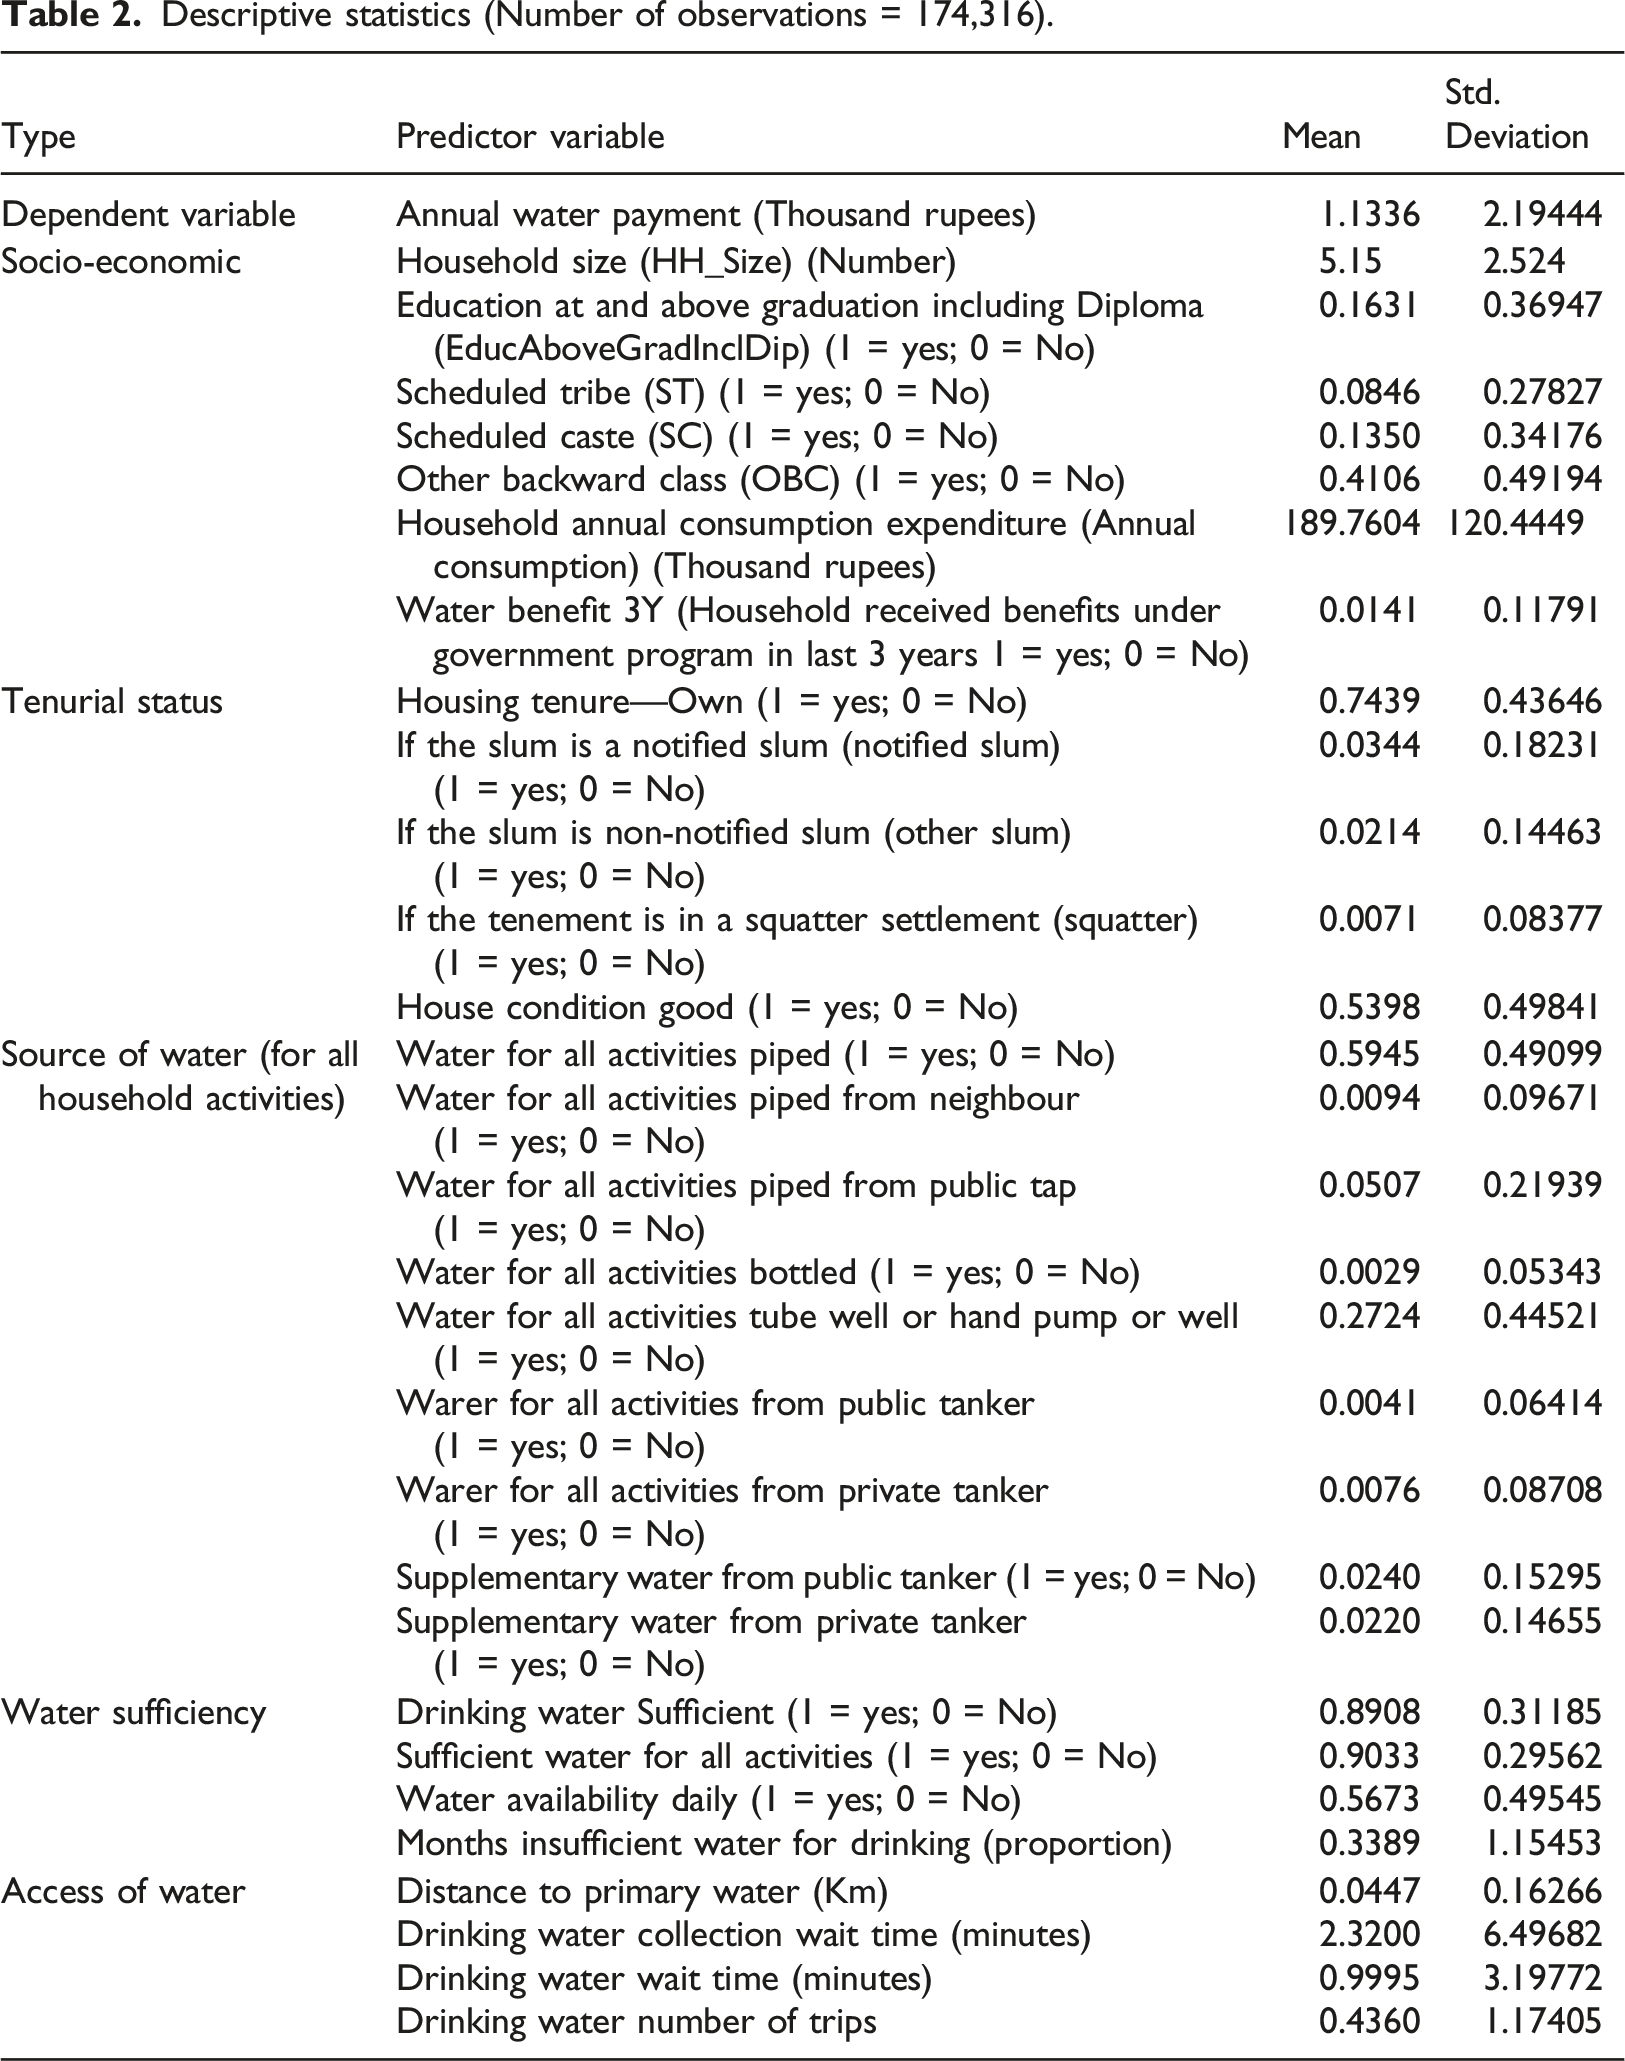
Seventeen different types of principal sources of drinking water have been surveyed as part of the NSSO survey. Piped water into the dwelling and yard is the primary source of drinking water for nearly 57% of Indian urban households. Bottled water and tube well are the following two prominent sources. Approximately 57.5% of urban areas have exclusive access to the principal source of drinking water. Nearly 91% of the households had sufficient drinking water from the primary source. More than 80% have drinking water sources within their premises. Approximately 64% of the households reported no requirement for a supplementary source of drinking water. Approximately 94% of the households have their principal source of drinking water within 30 min for a round trip collection. Approximately half of the urban population treat their drinking water before consumption. The mean annual water expenditure is Rs 1133 (Ministry of Statistics and Programme Implementation, 2018).
Results
Results of water demand estimate for Urban Households.
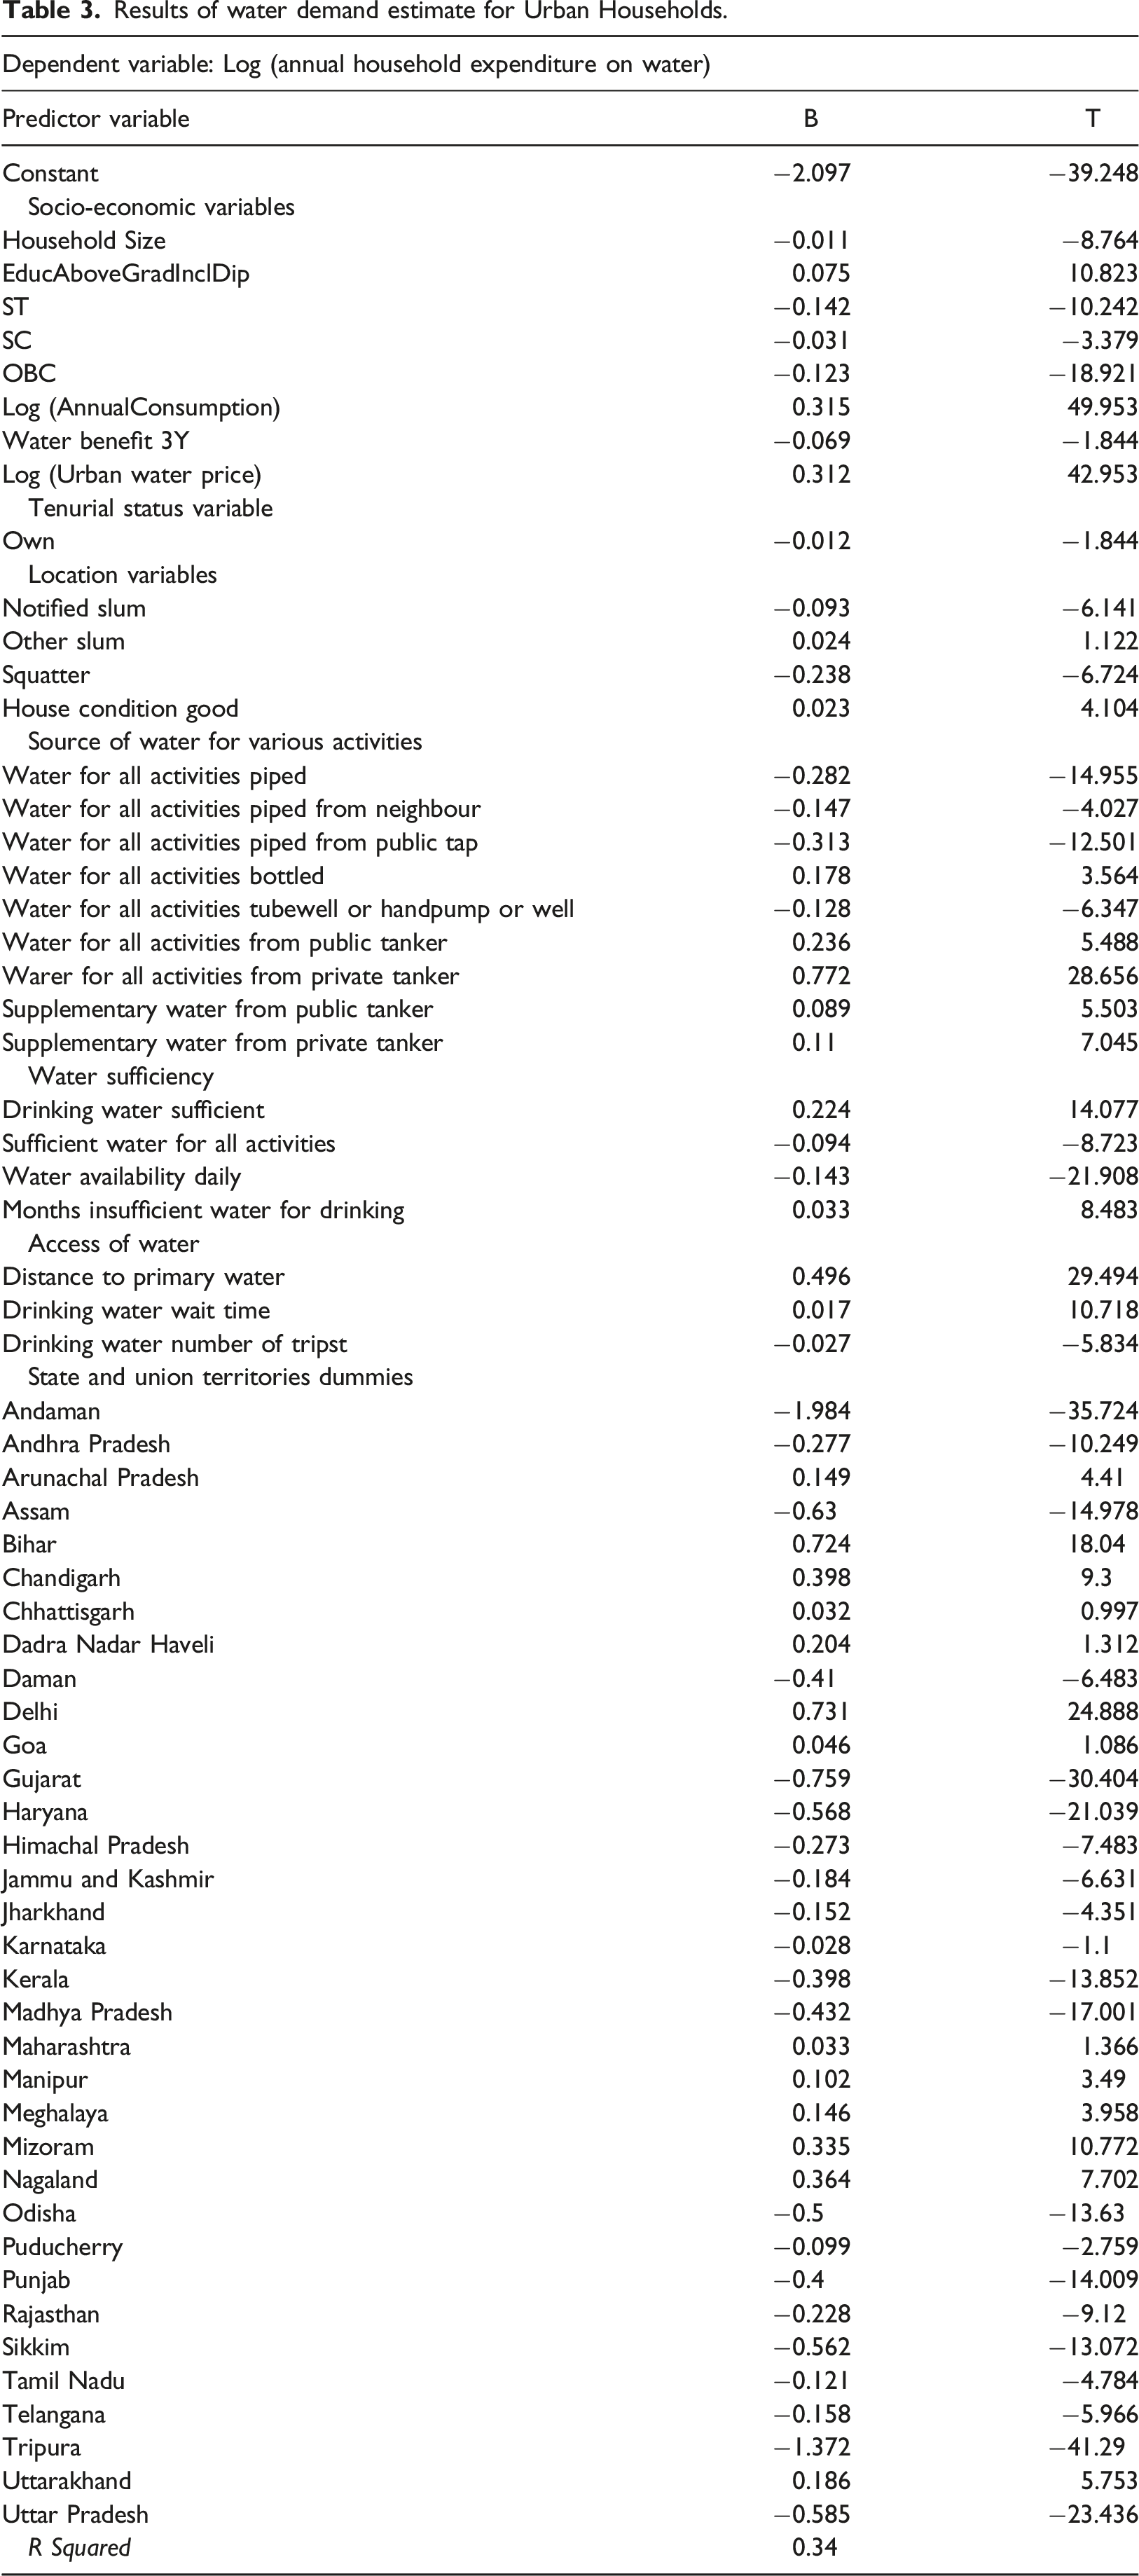
The size of the household has a negative impact on the water expenditure, indicating that for larger households, expenditure on some of the non-essential use of water is crowded out by other necessities such as food. The education level has a positive coefficient implying that the spend on water is higher for people employed in the skilled sector (a reflection of more affluent lifestyles/employability in higher-skilled jobs than those who do not have education benefits) (Adams, 2018). The water expenditure for marginalized societal classes is lower than those in dominant social classes. This may be due to the lack of connectivity of locations where marginalized classes live with formal sources of water supply, ceteris paribus, resulting in their reliance on non-formal sources of water to meet their requirements (Adams et al., 2016). Households who have availed of a water-related benefit (subsidy) from a government program to improve their water facility have lower expenditure than those who have not. A formal system of water supply (connected to piped water supplies) reduces reliance on procurement of water from expensive private sources. The coefficient of urban water price is positive and significant. Given that the estimated function is expenditure function, the price elasticity of demand for water is one minus coefficient, which is −0.688. An increase in water price by 1% reduces the water consumption by 0.69%. The income elasticity is 0.315. Water, being an essential good, is income and price inelastic.
The housing and tenurial variables indicate that those who own their dwellings tend to have lower water expenditure relative to tenants. This might be due to greater access of owners to groundwater, which is not charged. The dwellings with tenants might have greater access to piped systems, and tenants are charged for access through a piped supply. The households who do not have a formal dwelling (staying in slums or squatters) have lower water expenditure, as they might be getting crowded out of the formal systems, which increases reliance on sources such as water ponds or rivers or public taps (Tambe et al., 2015). The dwelling condition has a strong positive association with the water expenditure, indicating a more significant spend with better dwelling quality (Cassivi et al., 2021).
The expenditure on the water is negatively associated when the sources of water are piped or groundwater, whereas it is positively associated for tanker or bottled supply. It implies that when households have access to water through a piped supply or from the ground through a hand pump, well, or tube well, the total expenditure on the water is lesser. This is consistent with the Indian situation where the groundwater extraction is not charged, whereas all other sources of water are charged (Chatterjee and Roy, 2021). The piped water connections reduce the water expenditure (in relation to the non-piped alternatives such as the tanker or bottled water). This finding is consistent with the debate on tariffs in India, which are set at levels that do not recoup the actual costs incurred (García-Rubio et al., 2015; Lee et al., 2016). Accessing water for all activities through a private tanker is the most expensive and is followed by accessing water for all activities through a public tanker. This points to access on a regular basis having a bearing on the costs incurred (Lee et al., 2016).
Households indicating water sufficiency for drinking incur higher water expenditure. When the water is sufficient for drinking purposes through the year from the primary source, the higher water expenditure implies that households spend more on the water to meet the overall water requirements, ceteris paribus. However, when water availability is adequate to meet all the activities, the expenditure is negatively associated. Water expenditure of households who can access adequate quantities of water for all activities reduces the need to spend on water (Singh et al., 2005). Also, when the water is available on a daily basis (generally through a piped water system), the expenditure comes down as they do not need to buy water from other sources, which are expensive. The annual expenditure tends to increase when the water is not available throughout the year (in certain months).
The greater the distance to the primary source of water, the expenditure increases accordingly. Similarly, the longer the overall time to collect water, the higher the expenditure on water. The number of trips required every day is negatively associated with the water expenditure implying that households who do not have access to tap water at home make more trips to sources of water with a lower cost.
An analysis has also been carried out to understand if the households in different states in India have similar characteristics. The analysis has been carried out with the state of West Bengal being the omitted variable. The positive sign of the coefficient indicates that the expenditure for the respective state’s urban household is higher than that of West Bengal and a negative coefficient indicates that the expenditure of the respective state’s urban household is lower than that of West Bengal. Similarly, the value of the coefficient of a particular state can be interpreted against the other states. The significance levels of most states are acceptable, and there are substantial regional variations. Urban households in the Union Territories in India, which are under the purview of the Government of India and with lower populations, have higher expenditure levels. Delhi has the highest coefficient of urban household water expenditure. This could be due its traditionally higher water tariffs, and numerous initiatives of private sector partnerships. However, there have been attempts in recent years to rationalize the tariffs and to provide free/subsidized water to the economically weaker sections in the state by the new Government. The household water expenditures in the northern part of the country (states of Haryana, Punjab, Uttar Pradesh) have substantially lower coefficients than the rest of the country. This could be due to their higher reliance on groundwater, lesser coverage of piped water connections due to geographical distributions. The states are also agriculture-based economies that rely on availability of water through the year. All the southern states of India (Andhra Pradesh, Karnataka, Kerala, Tamil Nadu, and Telangana) have relatively lower urban household water expenditure. This could be due to higher development indices in the region, substantially higher institutional and governance reforms in the urban water sector, greater public investments made in the sector and the role of multilateral and bilateral agencies in financing the water sector. Among the states with lower development indices, the states of Odisha, Madhya Pradesh, Rajasthan and Assam have substantially lower urban household water expenditures. This could be due to the various initiatives by the respective state governments to provide better piped water access and reforms to improve the service delivery.
Regression results—income categories.
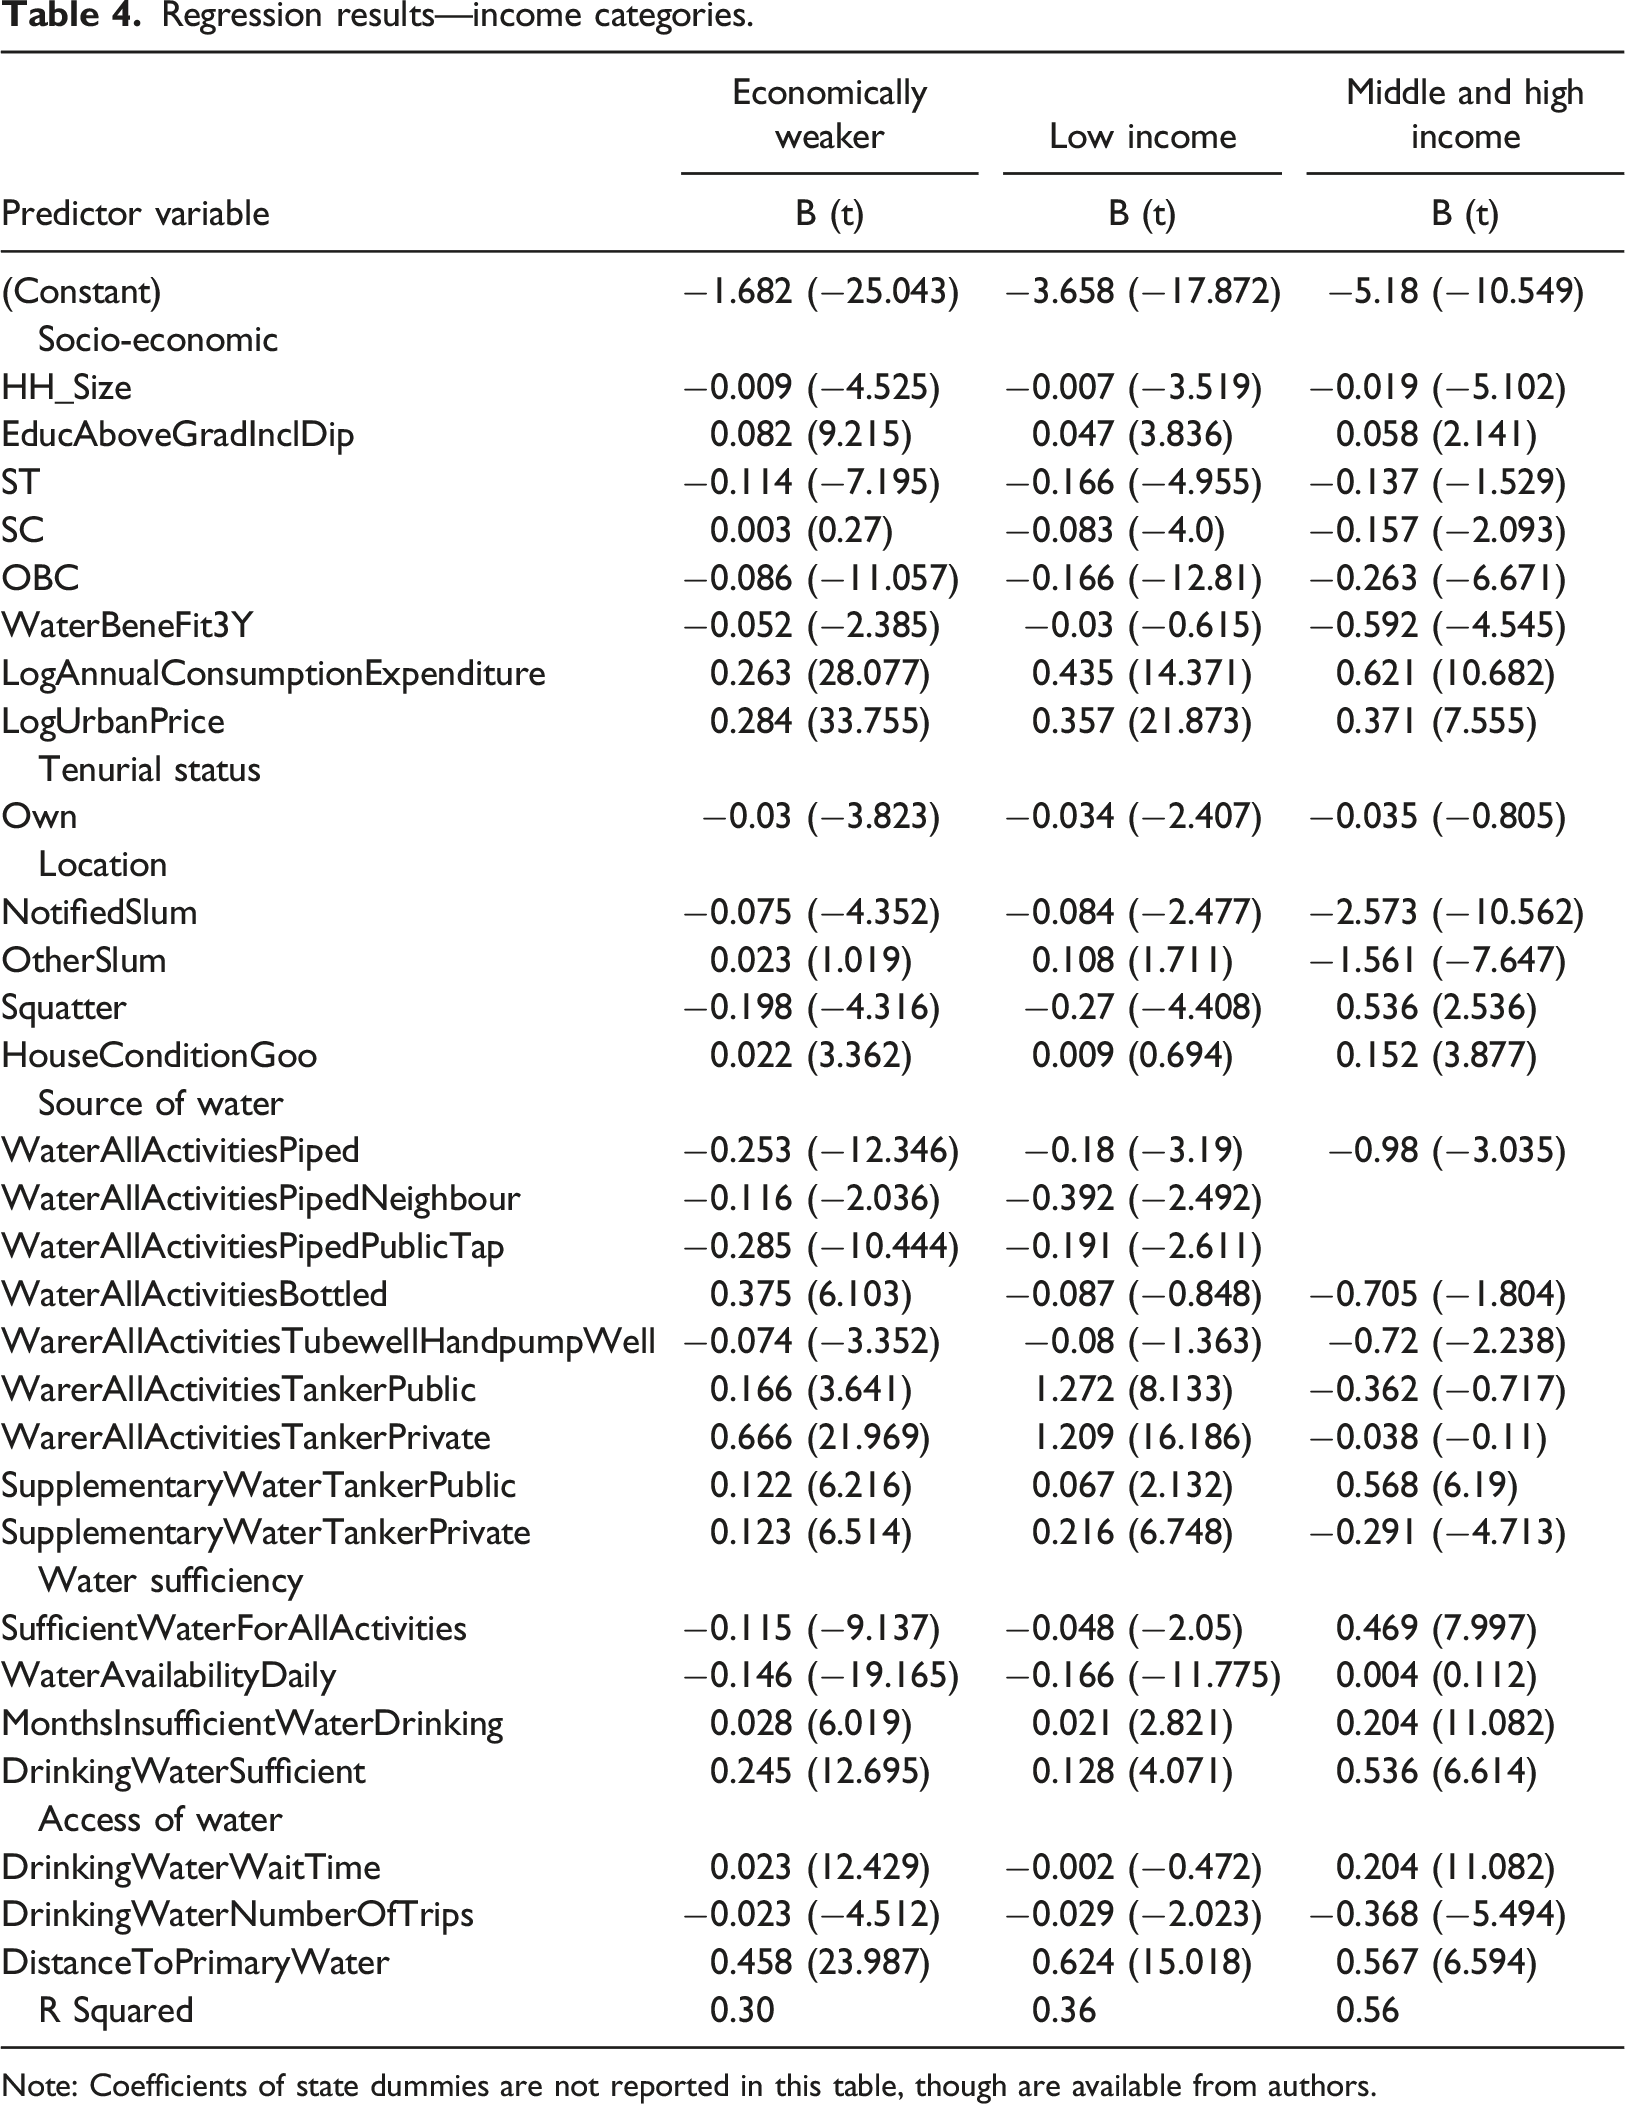
Note: Coefficients of state dummies are not reported in this table, though are available from authors.
Estimated coefficients for social class dummies present an interesting picture. As the income for marginalized households increases, their expenditure on water reduces. This is because with an increase in income, they are able to access formal sources of water, in particular, the piped water system. Demand for water is price inelastic. The price elasticity for the economically weaker section of households is −0.737, for lower-income households, it is −0.565, and for the middle- and higher-income group, it is −0.38. These elasticity estimates indicate that the benefits of price-based subsidies are much more for economically weaker sections than higher-income households. A better targeting of public subsidies or progressive water tariffs rather than a flat tariff structure would be better for water management. As income increases, the households increase their overall expenditure on water. The income elasticity of water for the economically weaker section is 0.26, for the lower-income group, it is 0.43, and for the middle- and higher-income group, it is 0.62.
Households who have received water benefits in the form of subsidies from public programs have lower water expenditure, but what is interesting is that the coefficient is much larger for higher-income households. This indicates that the benefit from such programs has accrued to higher-income households much more than to lower-income households. House ownership is negatively associated at all the income categories, and the house condition is positively associated. The coefficient is higher for the middle- and higher-income groups. House condition is also associated with affluence, which impacts water expenditure. Better housing condition is positively associated with the household water expenditure, and the ability to pay increases as income increases (Adams et al., 2016).
The access to piped water is negatively associated with household water expenditure in all three cases, implying that access to piped water can reduce the overall expenditure across all income categories. What is interesting though is that the coefficient is much larger for higher-income groups. This implies that they can meet higher demand for water at a lower cost if piped water is available. The access to ground water is negatively associated across all three categories (Chatterjee and Roy, 2021). Water sufficiency has a different interpretation for economically weaker sections and low-income households than middle- and higher-income households. The coefficient for this variable is negative for low-income households while positive for higher-income groups. Lower-income households do not have conspicuous demand for water, and sufficiency substitutes for expensive sources of water. Higher-income households increase their demand, and this increases their expenditure either because the marginal cost of pipe water increases, or they buy water from other expensive sources. For the households who have sufficient drinking water, the coefficient increases as the income increases. As income increases, the households are spending more on bottled water. This could be a reflection of the changing urban lifestyles in India (Tiwari et al., 2015).
Similarly, the higher-income groups are spending more on public water tankers in relation to the other income groups. As income increases, the reliance on public tanker water for supplementary activities increases while that on private tankers decreases. Across all the three income groups, if water is available daily, the amount paid for water consumption is lesser and decreases with an increase in income. Across all the three income categories, the households pay more when the water is insufficient during certain months of the year.
Discussions and policy implications
The predictors of better socio-economic status such as owning a house, improved dwelling conditions, higher education levels, and higher annual expenditure on all goods are positively associated with higher water expenditure. It appears that wealth or affluence is a good predictor for higher-order water accessibility and affordability in urban India (Adams, 2018; Adams et al., 2016). The households in these categories can afford more water than those not so endowed (accordingly have lower living conditions and work in roles that do not pay well). The households with poor socio-economic indicators seem to suffer from poorer access and affordability, which is consistent with the previous work in the sector (Adams, 2018).
The expenditure of urban households on water varies across different geographical regions. In Delhi and some other states like Maharashtra, the expenditure is high due to higher water tariffs and public private partnerships. In contrast, the southern states with a higher development index have lower expenditure levels on water. This can be attributed to a shift towards piped water systems, reform interventions, greater financing for water supply projects and the involvement of multilateral and bilateral institutions. Even among regions with lower development indices, there are some states with lower expenditure on water, largely due to a shift to piped water systems and greater emphasis on service delivery. Though the northern states also have lower expenditure levels on water, this is largely due to a higher reliance on ground water supply as the primary source of water supply.
Piped water, in general, results in lower household expenditure on water (Singh et al., 2005). This aspect would need to be seen in the context of the accessibility, health impacts, and pricing for water. India has evolved from a traditional ground water-based society to a more centralized water utility/provider based system in the last three decades, with the civic governments assuming the role for water provision. The overall ecosystem of service standards in the urban drinking water system is low, but the expectations in society for piped water systems have grown (Chatterjee and Roy, 2021). The Government of India’s latest scheme also aims to provide piped water systems to a multitude of cities and dwellers (Ministry of Jal Shakti, 2021). As an instrument to substantially increase access to households, this supply mode appears to have enough empirical basis. The policymakers can direct their efforts to ramp up their initiatives to increase access to piped water (Swamy et al., 2018). The potential for water-related diseases is a challenge in India and has been associated with improper water supply systems (Burt et al., 2018). The network infrastructure across most of the country needs replacement, and the recent initiatives have attempted to encourage the strengthening of the same.
From a portfolio of water sources through which households meet their water needs, expenditure increases substantially as demand is met through tankers or bottled. Access to water through these sources is related to availability in adequate quantum on a daily or a seasonal basis. In addition, the access through the public water system (with most of urban India not having a continuous water supply, but available only for a few hours every day) is constrained, and most households resort to augmentation of their water supply through additional sources such as bottled water or tankers (Amit and Sasidharan, 2019).
The pricing of publicly supplied piped water has been a contested theme in the country. While the move towards piped systems has a favorable impact across all the different income categories, as the empirical evidence suggests, the pricing aspects would need more investigation (Lee et al., 2016; Singh et al., 2005). The improvement of the piped water system in the country is mostly being implemented by the Water and Sewerage Boards and with the assistance of private developers through a bouquet of PPP mechanisms. The adequacy of the tariffs to meet the increasing costs, both for the public sector entities and the private sector, have been debated (Wu et al., 2016). The policymakers and project proponents would need to demarcate the funding mechanisms the projects faced with a need to involve the private sector in providing this service.
The results suggest that as household size increases, it crowds out water expenditure for low-income households as affordability becomes a concern. It may be because larger households might be poorer and cannot afford the water-related expenditure similar to smaller households. Households from the scheduled caste and other backward classes consume less paid water. The disparities in access to water, affordability across the various income categories, and the socio-economic sections indicate that the policies need to be more tailored for providing water appropriately to the weaker sections of society (Adams, 2018; Adams et al., 2016). This is particularly important as the metrics that capture inequalities across the different sections of society are not well defined, and information is not collected or published. It would be helpful for policymakers to develop a mechanism of measurement that presents the disparities within various sections in order to eliminate the same in due course through suitable interventions.
The results indicate that those who accessed government subsidies spend less on water consumption. States that have better development indices, backed by significant investments and supported by multilateral and bilateral institutions in strengthening reforms, have lower expenditure levels on water by households. However, these have benefitted higher-income households more than the lower-income households. The policymakers could focus on accelerated shift towards piped water systems (with adequate investments) and adopt a tariff structure that combines household size based consumption and affordability to ensure more equitable access to water.
Distance to water source or wait time required in collecting water increases expenses as households avoid time spent on collecting water, resulting in opting for expensive solutions. Households mitigate the cost by making more trips to the water source. The costs associated with accessing piped water from neighbors tend to be more than from the own dwelling. The policy direction to mitigate such scenarios is to provide water as close as possible to the household.
Income elasticity is low for economically weaker sections compared to other income classes. This implies that with the rise in income, their expenditure does not increase as water is a necessity good, and their need for other consumption is low (Amit and Sasidharan, 2019). The values of coefficients are different for the middle-income groups than the other two categories across most of the predictor variables. This could be explained by differences in the behavior of the households who have come out of the economically weaker category but have not yet reached the middle- and high-income groups.
Conclusions
This paper explores the relationship of various socio-economic, tenurial status, water source accessibility, and sufficiency factors with the household expenditure on water using a regression analysis with the data from the 76th round survey of NSSO for urban India. The paper also attempts to investigate the differences between various income groups to identify the commonalities and disparities that are prevalent. The results of the empirical analysis indicate that the overall direction of providing urban water in India is consistent with the Government’s push to promote piped water to households. However, there are differences, particularly at the lower end of the income spectrum, and in regions that have not witnessed substantial water service improvement efforts. The low-income households are getting crowded out on pricing, accessibility, and affordability of water (Adams, 2018; Adams et al., 2016).
The association of various predictor variables indicates that the wealthier and smaller households have greater affordability than the poorer and larger households (Majuru et al., 2016). The findings suggest that the policy interventions need to be more targeted by the income and socio-economic classification to ensure equity and inclusiveness of the urban population (García-Rubio et al., 2015; Lee et al., 2016). This would also provide avenues for more research on water access and affordability that could result in developing metrics that could aid in reducing water inequality across the entire nation. The benefits that the state intends to provide need to be targeted at the desired group (by the socio-economic parameters) as the results indicate that higher-income households benefitted more than lower-income ones. A price-based subsidy appears to be beneficial but the mechanism of such an incentive also needs to be targeted at the right audience. A progressive tariff structure that combines household size based consumption and affordability would be better for water management.
The access and affordability of urban households across the world depend on a combination of numerous factors. This research, taking many such factors into account, demonstrates that a comprehensive analysis provides a set of consistent pointers for policymakers and water sector project proponents to formulate their interventions (Adams, 2018; Lopez-Nicolas et al., 2018). This research suggests that policymakers should delve into multiple facets of providing piped water access to urban households, including targeted pricing, incentives to the economically and socially weaker sections of society, and incorporate provisions that promote equity in implementation mechanisms (such as PPPs). The characteristics of urban drinking water supply in developing countries are similar to that of India, and a substantial knowledge sharing happens on the practices across the countries, through the efforts of the United Nations and multilateral/bilateral agencies. The results obtained for India provide pointers to other nations on their initiatives to provide safe and affordable drinking water to their urban households.
Footnotes
Declaration of conflicting interests
The author(s) declared no potential conflicts of interest with respect to the research, authorship, and/or publication of this article.
Funding
The author(s) received no financial support for the research, authorship, and/or publication of this article.