
Abstract
Tourism is one of the largest growing industries worldwide. As the number of tourists is rapidly increasing, so too are tourist safety concerns. The increasing frequency of natural disasters along with the growth of urban areas makes it even more complex to address the resilience of tourists during such events. This article proposes a framework for collecting information about tourist locations and flows within urban areas and how to use this information for more efficient and safe evacuation routing. We define population behavior models that can be obtained from gathering empirical data and categorize them into three groups. We review the different evacuation scenarios (divided into sudden and predictable scenarios) and the types of information needed in each case. Further, we discuss the complexity of monitoring and forecasting tourists’ movements in the long term and for short-term predictions including the available data sources for doing so. The data gathering and tourist behavior are explained with examples from Kyoto, Japan, a major tourist attraction and a location that is prone to disasters. Finally, technological solutions for better guidance during the evacuation process of the population are discussed, including low-tech ones and advanced options such as websites, apps and Bluetooth Low Energy sensors, where the last one is demonstrated by a navigation experiment in a 3D environment.
Introduction
As the number of tourists is continuously increasing worldwide, so too are tourist safety concerns. This is due to increasingly frequent and severe natural hazards as well as terrorism, where large crowds of tourists can be easily targeted. In cases such as earthquakes or terrorist attacks, fast evacuation is often needed. In other cases, such as extreme weather conditions, evacuation might be less urgent as the danger is known for a while before the event; however, it might still be required. When tourist evacuation is needed, it is essential to take into consideration that tourists are often less informed and prepared and therefore, more vulnerable to becoming trapped in chaotic situations (see for instance the articles by Villegas et al. (2013) and more recently, Aliperti et al. (2020) that deal with the lack of information supplied to tourists about risks and warning systems and its influence on tourists’ preparedness to hazards).
The motivation behind this article lays in the fact that in many countries for dealing with tourists, there are protocols and schemes for evacuation from safe zones (shelters, city centers, etc.) but no solutions for the first step of the evacuation itself, i.e., to get to the safe zone. In addition, technological innovations in recent years have brought about new options for designing such methods and protocols more efficiently.
Tourism research as well as evacuation research are both well established in the scientific community. Many interesting articles such as, for example, Murray-Tuite and Wolshon (2013), Sadri et al. (2014) and more recently Ukkusuri et al. (2017) that developed a simulation tool combining household behavior and traffic assignment issues, deal with the evacuation process in general, but without application to the specific problem of tourists. As we focus on evacuation route choice, a good example is that of Sadri et al. (2015), who showed how, in the case of a hurricane, the specific characteristics of the disaster as well as those of the decision maker influenced their evacuation route choice. Among others, evacuation and living experience influence the route choice. For a diverse population group such as tourists, predicting route choice is, hence, an even more complex task than for residents. Robinson and Khattak (2010, 2012) showed how “advanced traveler information systems” (ATIS) can be used to influence evacuation route choices. In their 2010 article they show the importance of information based on a survey and in their 2012 article they simulate scenarios and discuss that testing of such information is required for decision makers to be able to integrate them in the planning process. As we will discuss in this article, for tourists, different types of ATIS are needed and are becoming feasible with emerging technologies.
Among the existing contributions, tourist evacuation research deals mostly with understanding tourist behavior, specifically based on surveys related to particular events, such as hurricanes and tsunamis. Cahyanto and Pennington-Gray (2015) discuss how the role of gender, residence, and past experience with hurricanes affects tourists’ voluntary evacuation in such events. Tourist behavior is assessed based on surveys and stated preferences models in Goeldner-Gianella et al. (2017) and Matyas et al. (2011), which show that tourists behave differently than residents. As an example, a review of the literature on evacuation from natural disasters was conducted by Thompson et al. (2017), who identified about 80 independent articles, some of them regarding tourist behavior during disasters.
In addition, it is necessary to obtain flow patterns in order to identify the concentration of evacuees, to construct evacuation routes and locate shelters (Li et al., 2012; Murali et al., 2012; Sherali et al., 1991; Stepanov and Smith, 2009). Resident flow pattern modeling is well-documented, as it is being used for transportation planning, specifically with the estimation of origin-destination flows. Data collection is conducted based on surveys, cellphone signals, public transport smart cards, loop detectors, Bluetooth signals, etc. (Barcelö et al., 2010; Zhao et al., 2007). Manca et al. (2017) refer partially to local and tourist behavior in their survey and case study of Barcelona, Spain, when exploring the use of social media to characterize urban mobility patterns.
Behavioral insights have been used for assessing tourist evacuation in simulation models such as Emori et al. (2016) and Kinugasa et al. (2012), who developed a support system for tourist evacuation guidance for evaluating the effectiveness of various evacuation guidance methods; however, the feedback of information to the tourists is missing.
As will be further discussed herein, this feedback can be achieved by low-cost, low-energy, small form-factor communication beacons, such as Bluetooth and LoRa (Ben Moshe et al., 2014; Bensky, 2016; Mirowski et al., 2013; Yoshimura et al., 2014). This will allow tourists to be informed electronically when they deviate from the evacuation route.
We can also obtain dynamic network data such as shelters available capacities, congestion on routes, and potential risks on the way, personalized data and population data. That is, the online information not only covers network data but also the population itself. The possibility to locate people (at least for most of the population) gives the decision maker the ability to optimally assign the most efficient route to each person, and the population then benefits. Furthermore, even if such technology is not yet available, research on tourist and resident movements provides valuable insights to build an efficient evacuation model. Clearly, such a range of newly available data sources can be a good basis for predictions of and insights into tourists and therefore, for the construction of efficient evacuation protocols.
Therefore, the purpose of this article is to propose a passive data collection scheme to be used for dynamic evacuation without the need for cellular networks or Wi-Fi for the planning of city tourist evacuation routes. Such a framework is illustrated in Figure 1 and has three main components, as follows: (1) estimation of evacuation route choice; (2) prediction and determination of tourist location and flows; and (3) improvement of tourist guidance and evacuation. The structure of the article follows that framework, as described below.
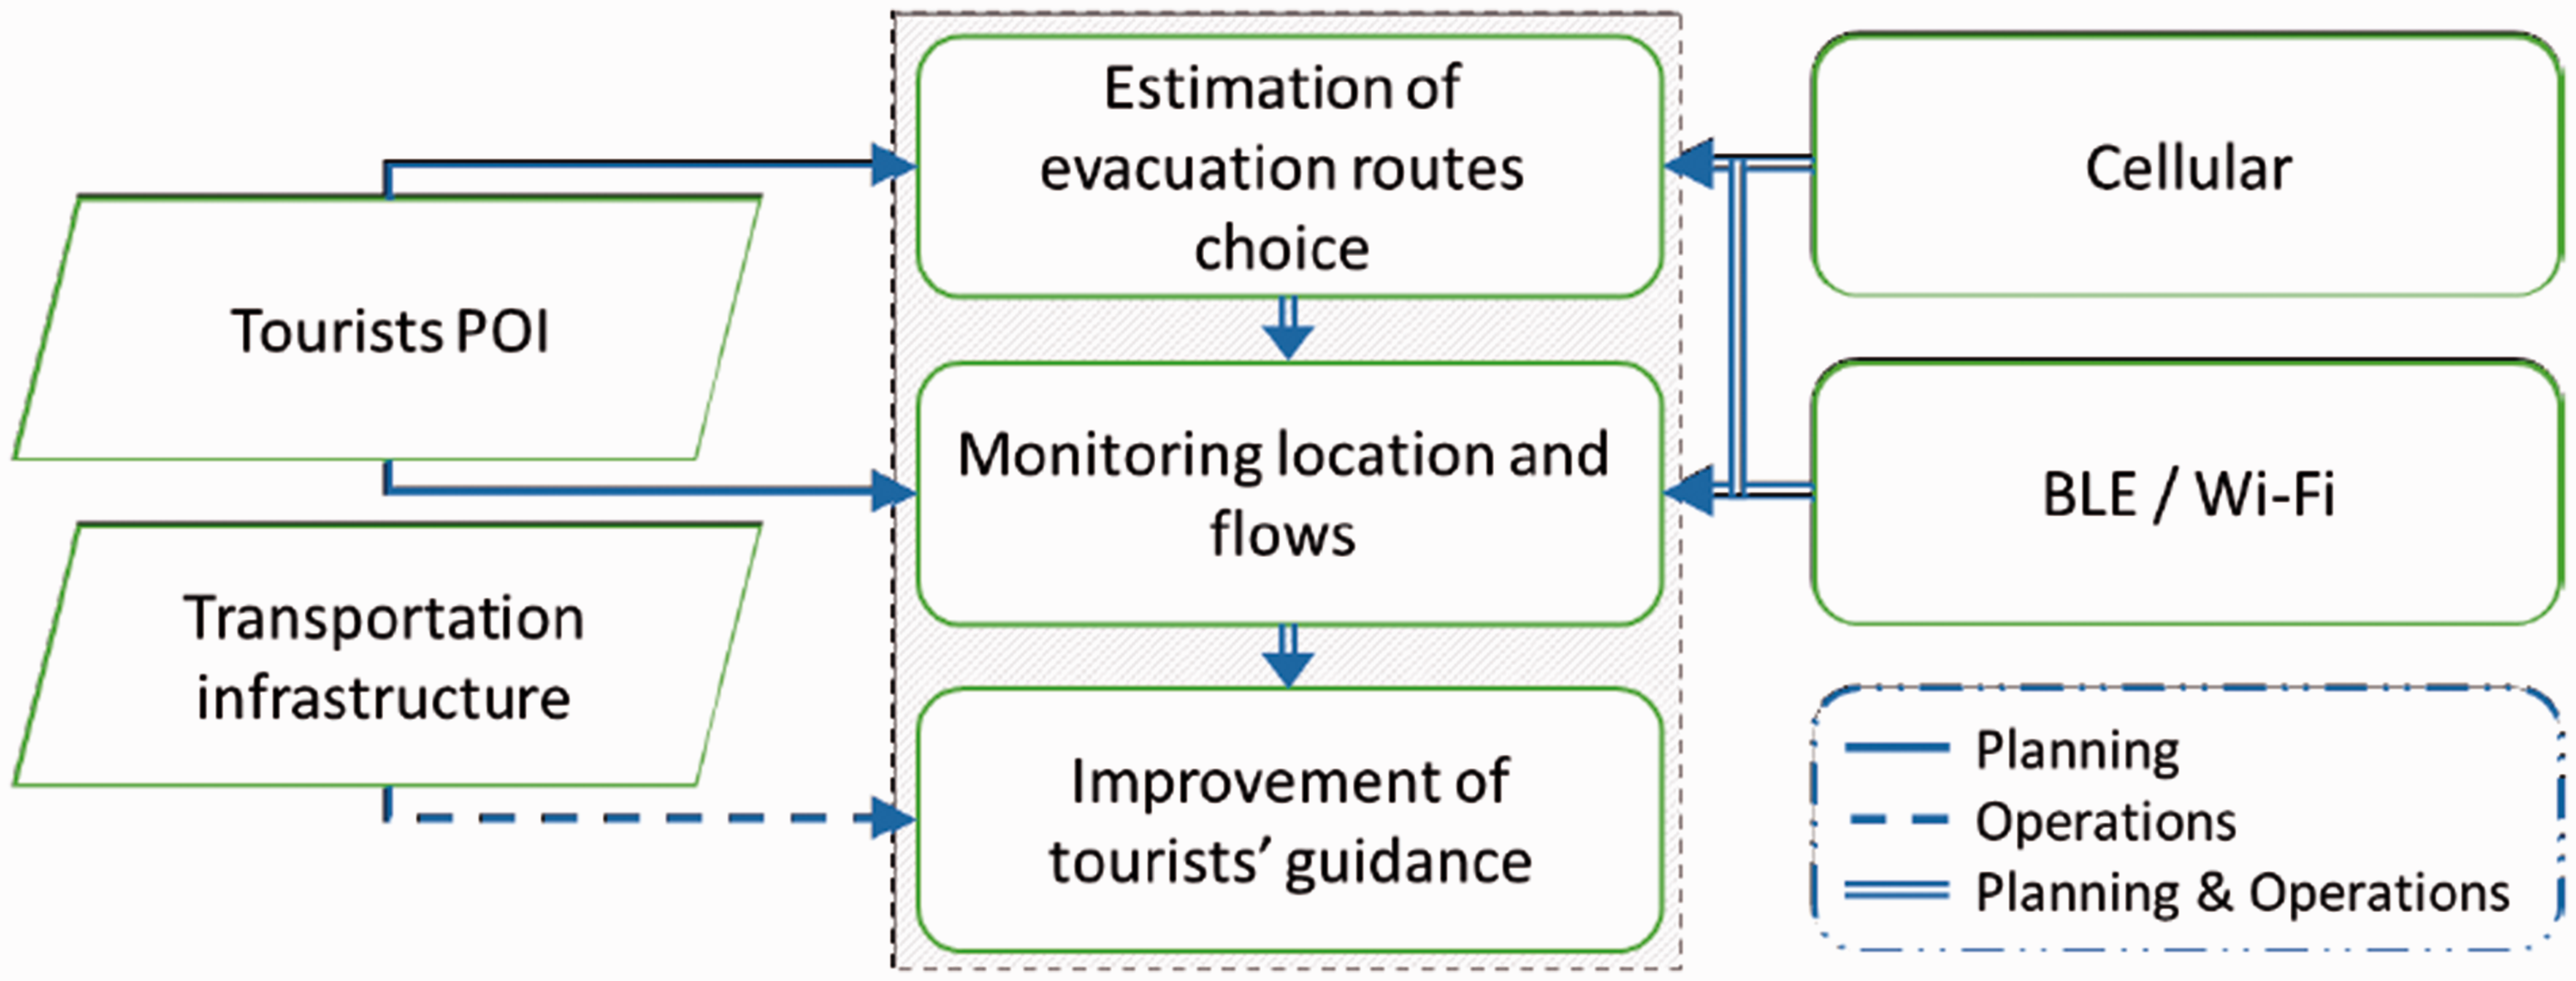
Framework for the planning of tourist urban evacuation routes and guidance: Evacuation route choice estimation and monitoring the locations and flows of tourists are done based on sensors, cellular data, and tourist POI (points of interest). These, together with the transportation infrastructure, may be used for improved guidance for the evacuation process during the time of need.
In the second section, we discuss the route choice of tourists during evacuation, giving a demonstration using a simulation-based model that we have developed for evaluating tourist decision making. The simulation is based on the Higashiyama area of Kyoto, Japan. Then in the third section, we discuss the information that can be gathered and analyzed for understanding tourist locations and flows. In “Complexity of predicting flows” section, we discuss the complexity of predicting such flows, following discussions of the prediction types in “Flow prediction types” section and of the different evacuation scenarios and their settings in “Discussion on evacuation scenarios and information needs” section. This discussion ends in “The data sources, analysis and fusion approaches” section with a review of the data sources, analysis, and fusion approaches. To demonstrate the content of the third section, we use an example of the data gathering and analysis also carried out in the Higashiyama area in Kyoto. In the fourth section, we present, in detail, the available methods to guide tourists and finally propose a novel approach for improving the navigation methods and tourist location accuracy at the time of the crisis. Such an improvement is illustrated by an experiment on movement data acquisition in a highly frequented 3D building that is covered by Bluetooth Low Energy (BLE) tags. The conclusions of the article are given in the final section.
Estimation of evacuation route choice
The use of empirical data obtained from BLE and Wi-Fi sensors and cellular devices can help to identify different types of tourist movements. A movement is defined as the way a tourist selects an evacuation route, based on their orientation level, language skills, etc. Such movements should be considered when planning evacuation routes. Clustering different streams of tourists by their behavior can be highly effective while designing the routes and the distribution of guidance resources (Lau and McKercher, 2006). In the preparation stage, it is important to learn and analyze these movements in order to be able to give the best services to the different populations in the actual time of need. Different populations will have various characteristic attributes of motion that influence how they should be treated (Reisinger and Turner, 1997).
When aiming for a safe zone, the differences in knowledge and mentality of the various populations can be formulated, considering the risk of taking the wrong turn at intersections and the likely reaction of persons when they understand that they took the wrong path. In this section, we define and illustrate “deterministic evacuation” as well as alternatives that consider such mistakes.
It is to be noted that similar ideas and concepts have been previously studied in the literature but not in the context of routing mistakes. Ukkusuri et al. (2017), for example, addressed different navigation strategies that occur at each intersection/node. At each node, the evacuee calculates the shortest path by using different strategies that vary for different evacuees and are based on network knowledge. Our definition is different (as will be expanded in the next sections) as it assumes that the tourist has no information regarding the network situation, and the mistake is random and not strategy-based, so it may cause a decision that is the complete opposite of the tourist objective (i.e., walking on the shortest/safest path).
Deterministic evacuation
Deterministic evacuation is the case when the whereabouts of the tourists are known, and all can be assumed to follow guidance. Then optimal evacuation routes can be constructed easily (as shown in Supplemental Figure S1 on a theoretical graph and in Supplemental Figure S2 on the map of Higashiyama). By taking into account safety issues (i.e., after an earthquake, the population should avoid routes with fragile buildings or bridges) and routing issues (i.e., available roads with sufficient capacity), we can solve this problem aiming for, for example, a minimum evacuation time for all evacuees in the area. Evacuation planning strategies during earthquake disasters should consider road disruptions due to collapsed buildings and road destruction when analyzing evacuation routes (No et al., 2020). Yoshitsugu et al. (2020) present a method for simultaneously deriving multiple evacuation route candidates when considering disaster risk. They also quantitatively evaluate the safety of the obtained routes to improve the evacuation process during disasters.
If changes in the network condition occur, adjusting the routes might be required. Under deterministic assumptions, such routes can be calculated using time-dependent shortest path algorithms based on the decision maker’s objectives (for example, reducing time and risks). Lindell (2008) discusses this problem in more detail with a simulation to minimize the clearance time of a large city for a hurricane scenario. The article uses data from Texas, USA, to show how the evacuation route capacity can influence the evacuation time estimate. Sadri et al. (2015) elaborated a model allowing the distribution of resident evacuation over six bridges during a hurricane in Florida.
The risk of making a mistake
As noted above, major differences between tourists and citizens, such as the familiarity with the area and the available paths, will affect routing capabilities. A resident knows where the destination point is so the risk of making a routing mistake is relatively small compared to a tourist that only has a general idea of the evacuation route, and for whom that risk is relatively higher. For example, in dense monotone areas, the probability of making routing mistakes and losing directions is higher compared to a village with low density, visible sky, and varied townscape. Also, tourists have mostly little or no knowledge of the native language so that using direction signs or streets names for routing become impossible.
When we refer to mistakes, we assume that at every intersection in the network, the tourist needs to decide where to go. To the best of our knowledge, this stochastic mistake probability in the nodes has not been used in evacuation planning and transportation, but we suggest it should be considered especially for tourist evacuation. To elaborate, when aiming for the fastest path, travelers who are unfamiliar with the area will consider how certain they are about the path and the direction, what the risks are and if they should go back or reassess the decisions so far. Using this observation, combined with collected empirical data and that available in the literature (Nguyen et al., 2012; Oh et al., 2012), a decision maker can forecast such tourist behavior. To demonstrate such patterns, we present a simple simulation of some of them in the next sections. Our aim here is to assist decision makers in the understanding of patterns and further potential risks during the evacuation process when designing tourist-specific evacuation routes.
The cautious tourist behavior
We define a “cautious tourist” as someone who returns to the last verified node on the correct path once they become aware of being on a wrong path in order to avoid the risk of getting lost (the deterministic evacuation route, as shown in Figure 2). The cautious tourists can still be differentiated by the knowledge they have about the area; see in Figure 3(a) simulation of this behavior on the route on the Higashiyama map. The size and color of the nodes represent the number of times tourists visited them: small, dark nodes are nodes with a low number of visits, while larger, yellow nodes are visited more often. In the figure, 1000 tourists are simulated, all with a probability of 10% to take a wrong turn at each intersection. At some nodes, we can observe flows larger than the number of tourists due to persons returning to a node after a mistake.
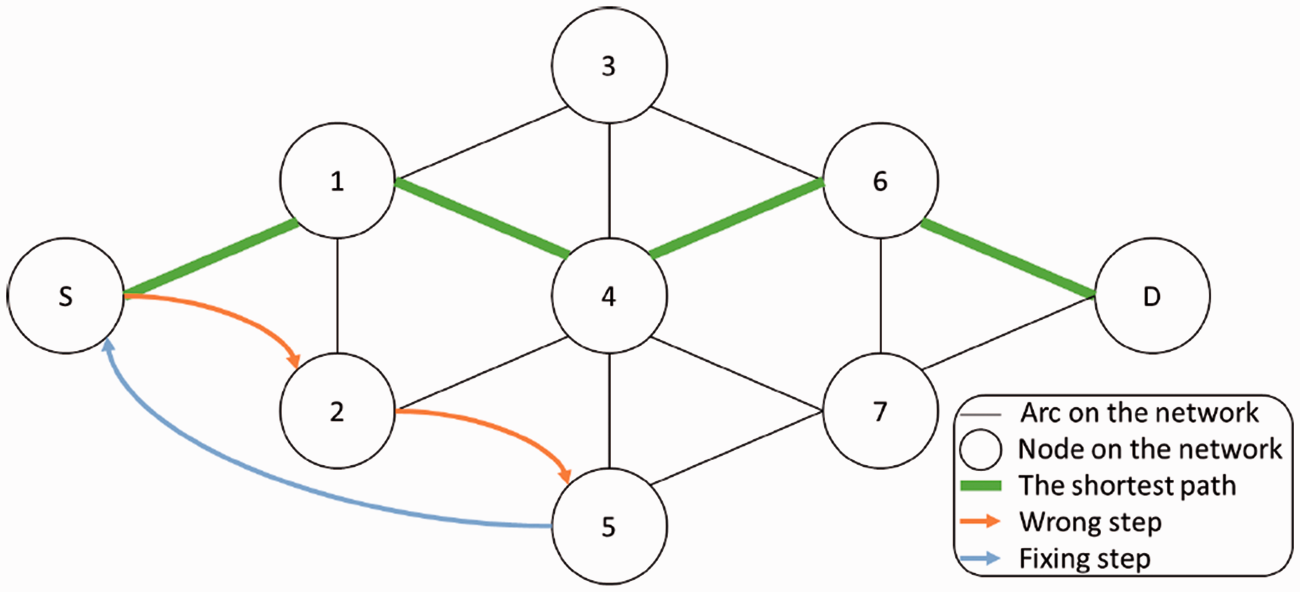
Example of the cautious behavior: The pedestrian starts with a wrong step to node 2, realizes at node 5 that they have made a mistake and returns to the start node S, the last node of the shortest path that they visited.
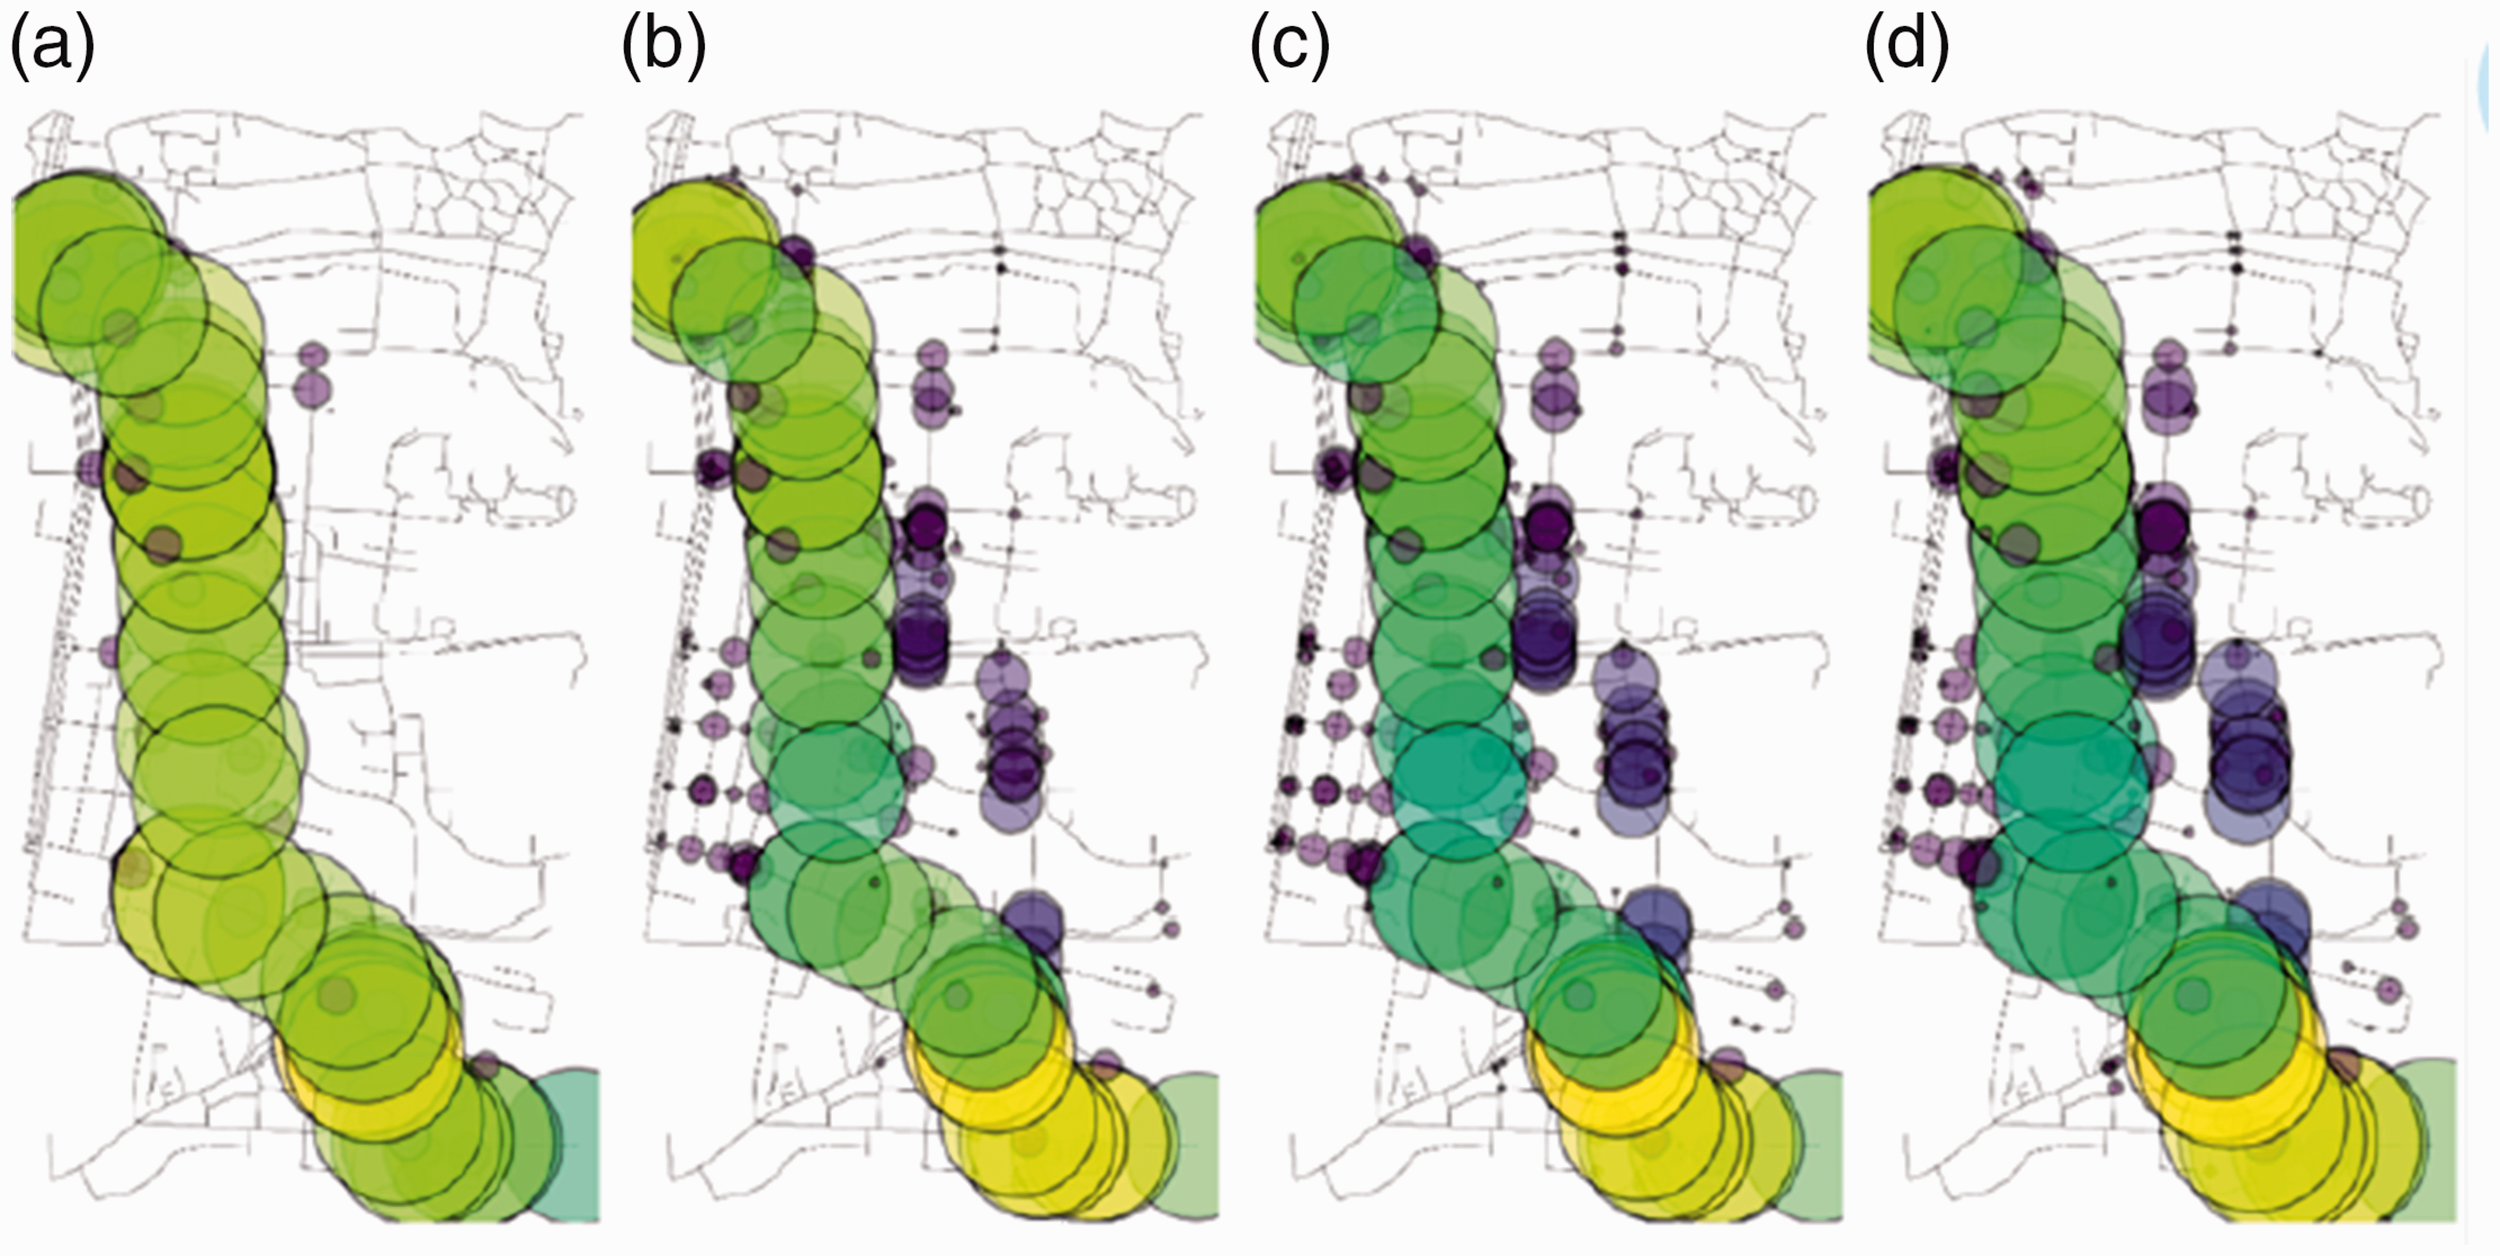
Simulation of the cautious behavior: (a) familiar with the area, (b) good knowledge about the area, (c) some knowledge, (d) knowledge only of general direction.
The risky tourist behavior
The tourist with risky behavior corrects mistakes by reevaluating the path from the current node to the evacuation node, as shown in Supplemental Figure S3. The basis for this re-evaluation could be due to some limited local knowledge or new information received while walking. This type of behavior causes more noise to the system, since these kinds of tourists take new routes that the decision maker did not intend them to (Supplemental Figure S4).
The cautious unaware tourist behavior
Between cautious and risky behaviors, there is an additional type of behavior where the tourist, when figuring that a routing mistake was made, will go back to the previous node, and then try to make the best routing decision, not knowing if this node is on the original evacuation route or not. This behavior also is shown in Supplemental Figures S5 and S6.
Information on tourist locations and flows
Complexity of predicting flows
Another major issue for designing tourist evacuation routes is to first predict tourist locations at the beginning and during a disaster. Although major tourist spots in a city usually attract a great number of visitors, dispersion of tourists to more places may be observed (Miguéns et al., 2008). Furthermore, the increasing information availability and “feedback” from other travelers lead to rapid changes in destinations of interest. In Kyoto, for example, tourist attractions in the southern part (Fushimi-Inari) have grown in attractiveness among foreign travelers in recent years. Especially among domestic tourists, trends, such as particular shops or restaurants that become very popular at some point for a short period of time, can be observed.
Besides these increasingly fast, longer-scale dynamics, tourist travel patterns are clearly related to seasonality. Again, in Kyoto, tourist numbers are sharply increasing during the “cherry blossom” season and the “autumn leaves” season. The dates at which these occur depend on temperature and other weather conditions during the early spring and late summer months. To help people plan their travel and also to be able to predict tourist flows, the Japanese meteorological agency publishes a “cherry blossom forecast” for the whole country.
Tourist numbers will, furthermore, depend on national holidays in the specific region as well as other parts of the country or even other countries. In Kyoto, tourist numbers notably rise during Chinese holidays as it is a popular destination for Chinese travelers. Events in the city itself as well as neighboring cities, such as the Tokyo Olympics to be held in 2021, will be considered to forecast increasing tourist numbers; on the other hand, issues such as the ongoing Corona Virus outbreak cause uncertainty and might reduce these numbers significantly.
Compared to resident travel, tourist travel is further clearly more influenced by “small events” such as (sudden) rainfall. Unexpected rain might not deter tourists who planned their journey and made bookings of flights and hotels to come to the city but will influence the sights they visit and/or their activity pattern.
Flow prediction types
For evacuation planning, both a good knowledge of the long-term, aggregate dynamics in tourist numbers and the general activity chains inside a city as well as that of the current (short-term) whereabouts of tourists and their likely plans are needed.
The long-term dimension is needed for general planning of evacuation facilities as well as “static” information about the required tourist destinations amid a disaster. Short-term, individual-level predictions will be of particular importance: (a) in case there is a potential for significant congestion that could either slow down evacuation or cause capacity problems at shelters and other designated locations; and (b) to understand the number of persons at less travelled places who might need special attention during a disaster. Furthermore, if “likely next destinations” and expected duration of stay at a location are known, one can provide specific warnings to travelers if for example, heavy rainfall, flooding, etc. are expected but not perceived as dangerous by tourists. In Kyoto, for example, often the danger of arriving typhoons is underestimated. Similarly, if likely destinations of a person are known, warnings for sudden flooding caused by heavy rain can be issued at river locations.
Discussion on evacuation scenarios and information needs
The above-mentioned complexities are amplified when considering information flow during times of evacuation. For that, we can differentiate between input and output, the former referring to what the planner needs to know and the latter being the guidance information supplied to the evacuees. Both sets of information are clearly scenario dependent. Information about network data, such as available roads and capacity of roads and shelters, etc., are necessary for evacuation purposes, and that regarding population and tourist movements and locations are needed to assist and evacuate those populations in need. Regarding other data, we can separate scenarios into two groups according to the notification time and that available for the response: (i) sudden scenarios such as earthquakes or terror attacks; and (ii) predictable scenarios such as tsunamis, floods or typhoons. However, some hazards, such as wild fires or the leakage of hazardous materials may belong to both groups and should be addressed as part of a combination of them. For sudden scenarios, information as to how to behave after the main hazard/disaster is required, whereas for predictable ones, the prime concern is safe evacuation until the disaster occurs.
Sudden scenarios limit the possibilities to prepare for evacuation. In such cases, there is often a lack of ability to fully plan the evacuation routes in advance due to possible sudden disruptions on the ways to gathering points. Therefore, one of the main tasks in such scenarios is to acquire accurate and relevant data quickly and to assign it to the best possible evacuation model in order to give an efficient service to the population in need.
When dealing with predictable scenarios, a planner can forecast their occurrence time. Tsunamis, typhoons/hurricanes, and floods can be predicted in advance, but their characteristics prevent planning one single evacuation route. The time available for planning also differs significantly. For storms, these are often days, whereas for tsunamis, the time ranges from zero to several hours. The necessary arrangements are, therefore, very different between the two types. We focus on short-notice events, as in such cases, tourists need most likely to be evacuated on their own.
Short-time predictable scenarios demand a fast response. Hazard maps that highlight the vulnerable areas are often available, and the planner can often supply the population with information regarding safe zones, assistance available in time of need, additional instructions regarding leaving their homes and the evacuation process, and communication with services and authorities, etc. The area influenced by such scenarios varies. For tsunamis, it is the whole coastal strip, and for wildfires, often all the nature surrounding the urban area. Thus, municipal and national cooperation levels are needed, and one needs to know in advance the “soft points” of the network, where there is a higher risk for disaster and where population in need is located.
Regarding the “output”, information about the network and scenario-dependent information can be distinguished. Both sets of information should be personalized for tourists, for example, in the language being used or where and how to be evacuated. Regarding the latter, tourists from a far country with a different mentality will act differently and might be better gathered in a common area to be evacuated from, while persons from a neighboring city/country will be evacuated to the border, as they have better knowledge of the area than the tourists from faraway places. The network information is commonly addressed in evacuation models, and concerns the available paths for the evacuation, congestion situation, risks on the way, etc. The information regarding the scenario can give additional data for the evacuees such as special instructions (what to take or leave behind, clothing, safety issues to handle before leaving the house, etc.) along with medical information, communication ways to relevant services and authorities, and other relevant information.
The data sources, analysis, and fusion approaches
Following the above described complexities, the availability and analysis of suitable data sources are essential for successful tourist evacuation. Regularly conducted household surveys are mostly targeted at resident travel patterns. Tourist travel needs within a touristic area are rarely observed by surveys, and obtaining representative outcomes is difficult. Cameras and isolated sensors can help to obtain aggregate information and longer-term trends, but do not reveal good information on movement patterns. However, this may be done by increasingly available passive data collection, as described below.
First, mobile phone data collected from operators can provide data on persons being in certain meshes of a city. Furthermore, movements between mesh areas might be available by analyzing “handovers” of mobile phones from one service area to another. However, in many cases, including for Kyoto, one can only obtain aggregate data. These aggregate data consist of period-specific information regarding the number of persons in a specific mesh as well as time series matrices showing movements between meshes. Such data are even available, which allows persons to be distinguished according to their country of residence, as the information can be further provided by matrices according to the country where the mobile phone is registered (Ahas et al., 2008).
Another data source is tracking tourists directly through their mobile phone locations with explicit agreement but without user involvement. Wi-Fi sensors can be installed near tourist locations that may allow the re-identification of tourists at different locations. The detection is based on the search signals that the Wi-Fi enabled devices are sending out to find networks. If Media Access Control (MAC) addresses are not randomized by the mobile phone, one can use a hashed version of them to understand flows. It was demonstrated in Kyoto that this technology enables the routes of tourists within a specific tourist area to be reconstructed (Gao and Schmöcker, 2019).
A third version of obtaining tourist flows is by using applications that record the Global Positioning System (GPS) location of users, or BLE. In contrast to Wi-Fi sensors, this requires “recruitment” of respondents by asking them to download and enable the application. The tracking itself can be done by transmission of the users’ GPS records or via BLE tags that are distributed in the area and can record users that are in the BLE range. The latter technology is useful for more precise indoor tracking (Anastasi et al., 2003). To increase willingness to participate, it is clearly an advantage when the application already contains additional functions in use by the traveler.
Another stream of data that has been explored is the data collected by social media networks such as Facebook, Instagram, Twitter, and Flicker. Geotagged photographs taken by tourists make it possible to identify flow patterns and the spatial distribution of crowds around tourist attractions (García-Palomares et al., 2015). Recently, Hasnat and Hasan (2018) collected data from around 67,000 users from Twitter using its search interface for Florida and presented a framework on how to use location-based data from social media to gather and analyze the travel behavior of the tourists. Such insights are highly important for strategic planning of the tourism industry (Vu et al., 2015, 2018).
This short review illustrated the growing possibilities to obtain tourist flow information. We conclude by noting the importance of combining data from different data sources. While the aggregate mobile phone data give a complete picture for long-term planning, details about tours, and detailed location of tourists are difficult to obtain. The Wi-Fi sensor data and app data are more detailed but are likely to be subject to significant biases, even if a sufficiently large sample can be obtained. For example, the “Walking City Kyoto” mobile phone application provides information on bus routes in the city and will hence be installed by travelers willing to take public transport but not by those travelling in large groups or those relying on their own car.
Kyoto Higashiyama example
The use of the above sensors and data is illustrated in the following example where 20 Wi-Fi packet sensors are distributed in the Higashiyama Ward in the city of Kyoto, Japan (Figure 4). The area is highly visited by tourists as it contains, among others, the world heritage “Kiyomizu-dera” temple. The sensors record: (1) the MAC address (hash-encrypted); (2) the timestamp; (3) the packet sensor ID; (4) the Received Signal Strength Indication (RSSI); and (5) the device’s Vendor ID. The sequence of destinations visited can be extracted by multiple records from the same devices. The data collection experiment was conducted from November 2017 to March 2018. The sensors were installed in street blocks of this area (Figure 4). Around 300,000 anonymized MAC addresses were recorded at least twice each day, and these records are supposed to be held by either a pedestrian or driver.
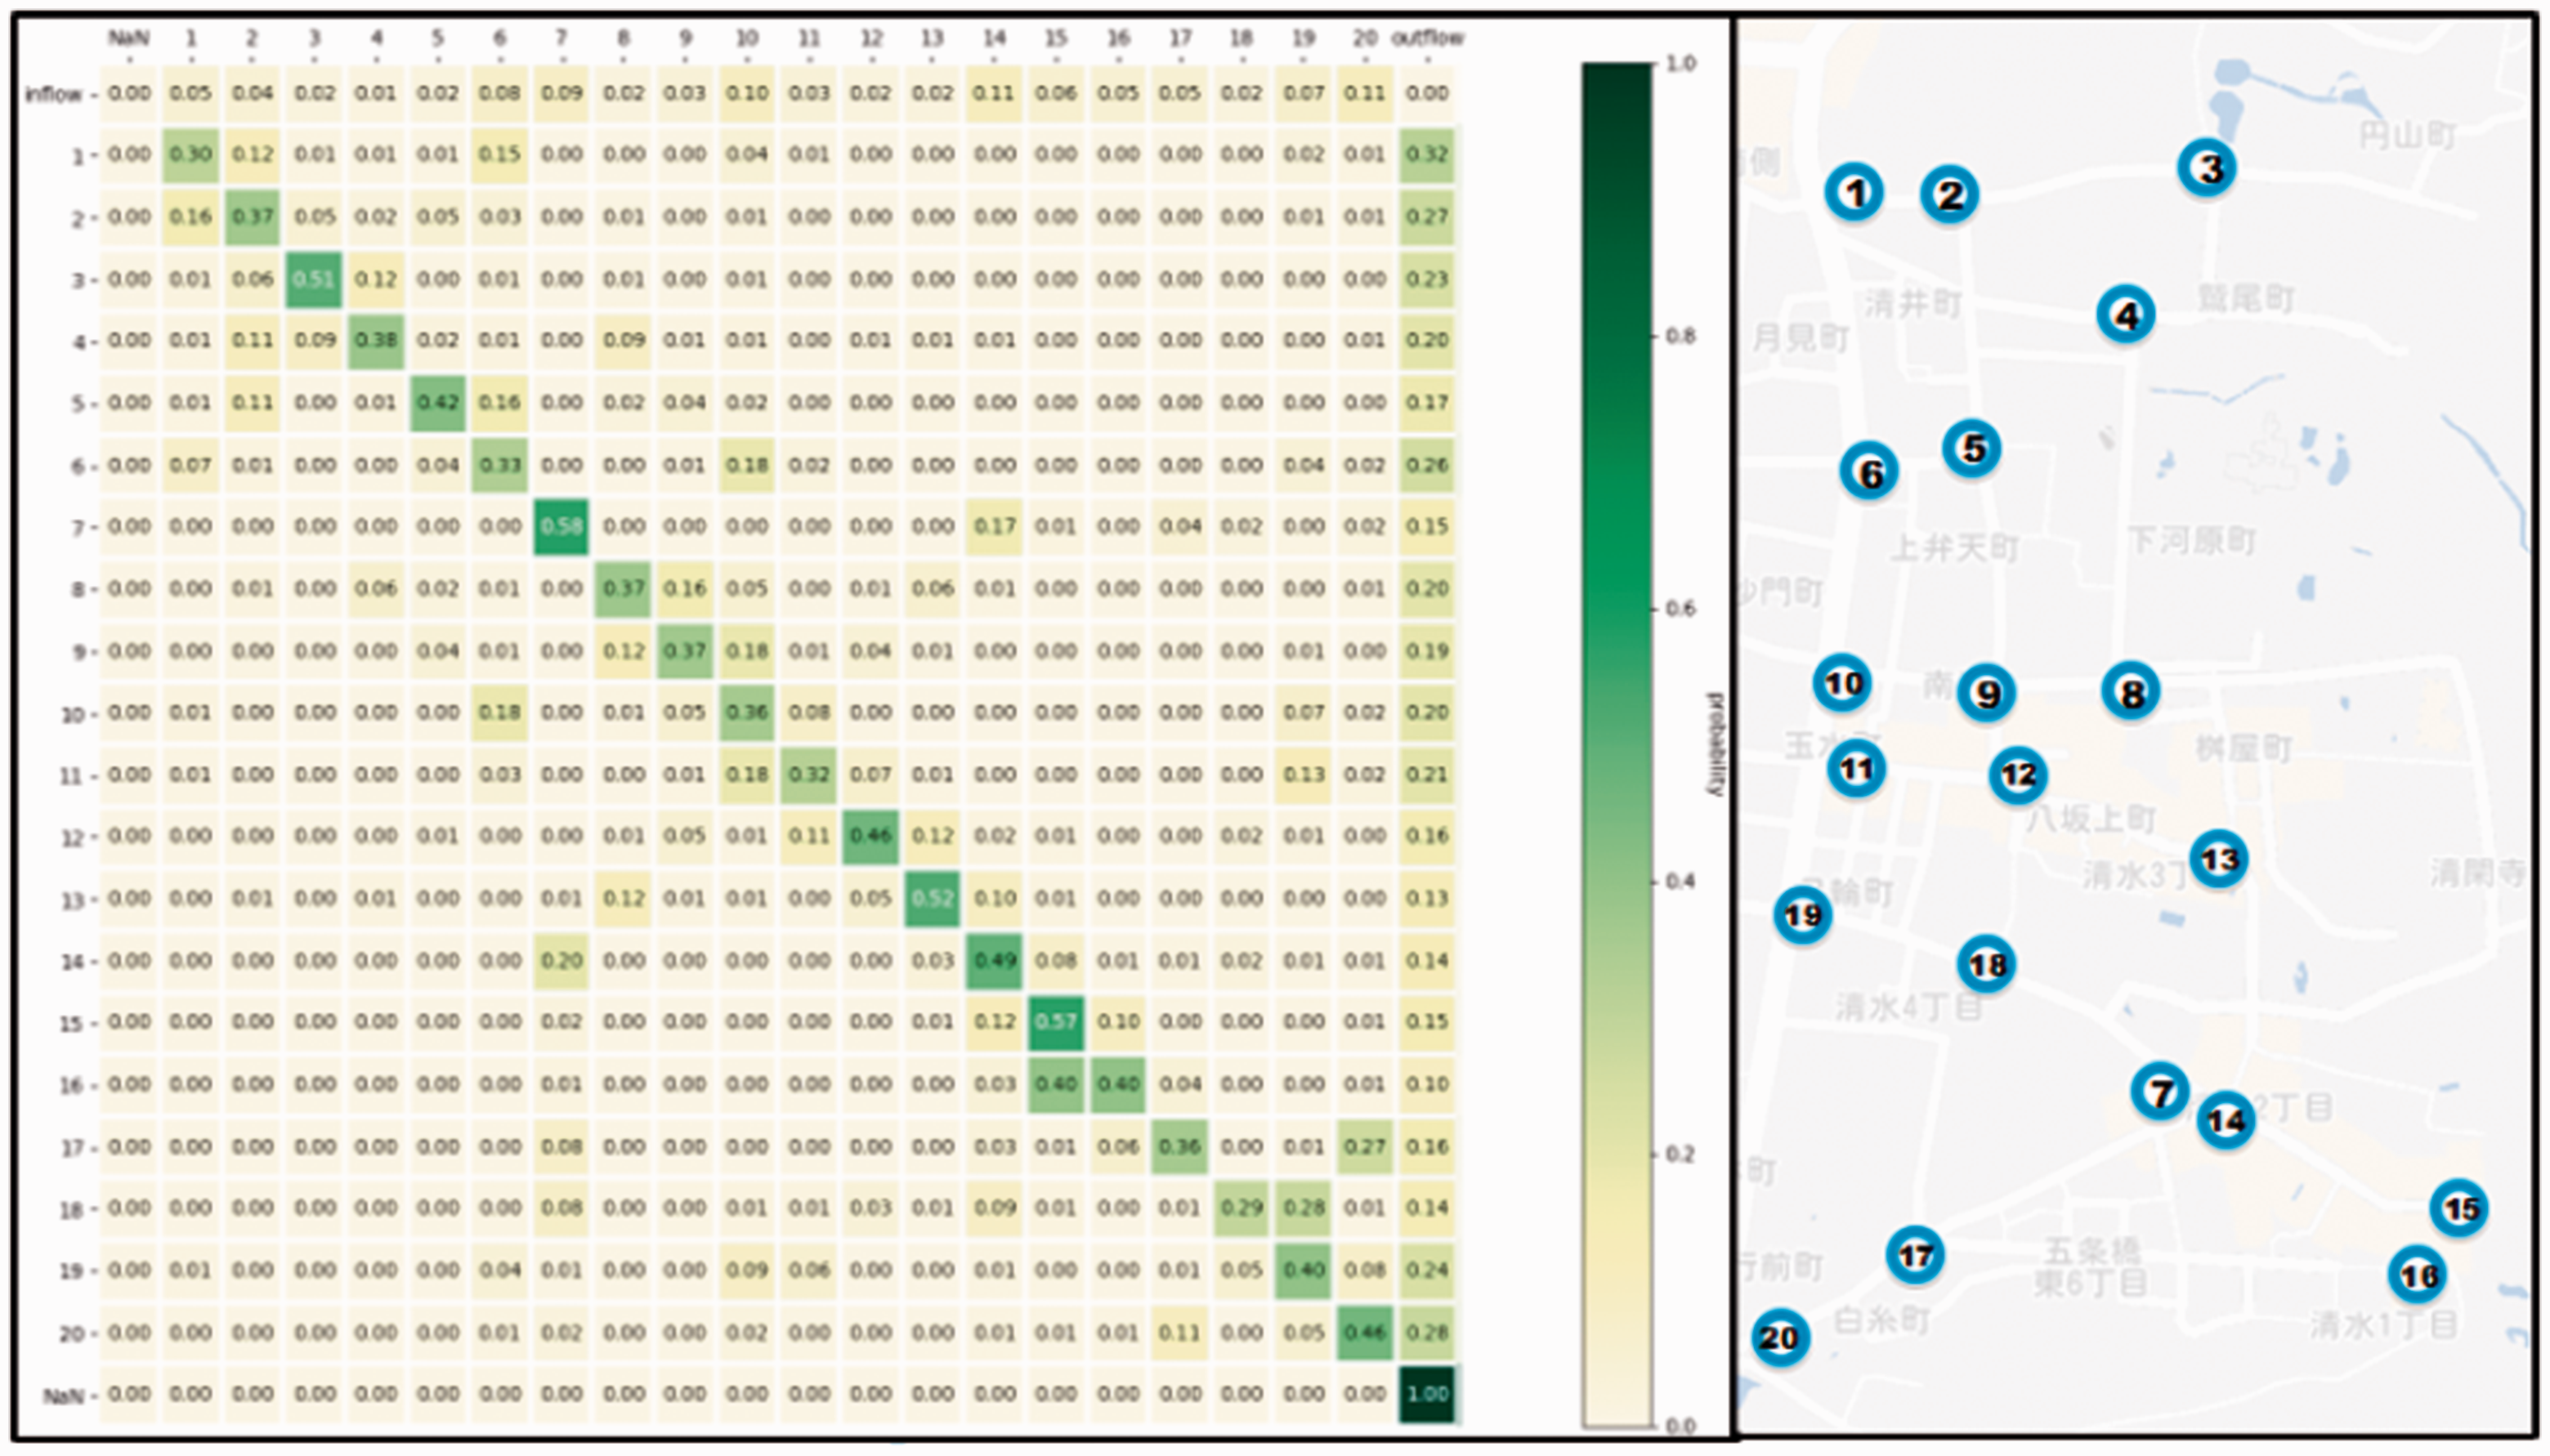
Sensor map and inflow and outflow matrix for each one.
We observe in Figure 4 that in addition to the neighbors of each node, nodes along the road on the west side of Figure 4 dominate the subsequent detection (sensor No.1, 6, 10, 19 and 20). A reason for this is that this road is one of the main roads in Higashiyama Ward as well as almost the only way to enter or exit the survey area (the east side of the area is surrounded by mountains).
Figure 5 shows the daily aggregated counts during a week versus time of the day for each sensor. We observe for each sensor that the flow begins to increase rapidly around 8 a.m. and reaches a peak around midday. Specifically, we found that the counts from the sensors at the tourist bus parking area of Kiyomizu Temple, at the path connecting the parking and the temple and at the main entrance of the temple, are far higher than other sensor counts. Looking at the sensors along the main road, their counts are in the second-highest group after sensors related to the Kiyomizu temple. Also, we observed that the counts along the main road do not drop (rather even slightly increase) in the early evening.
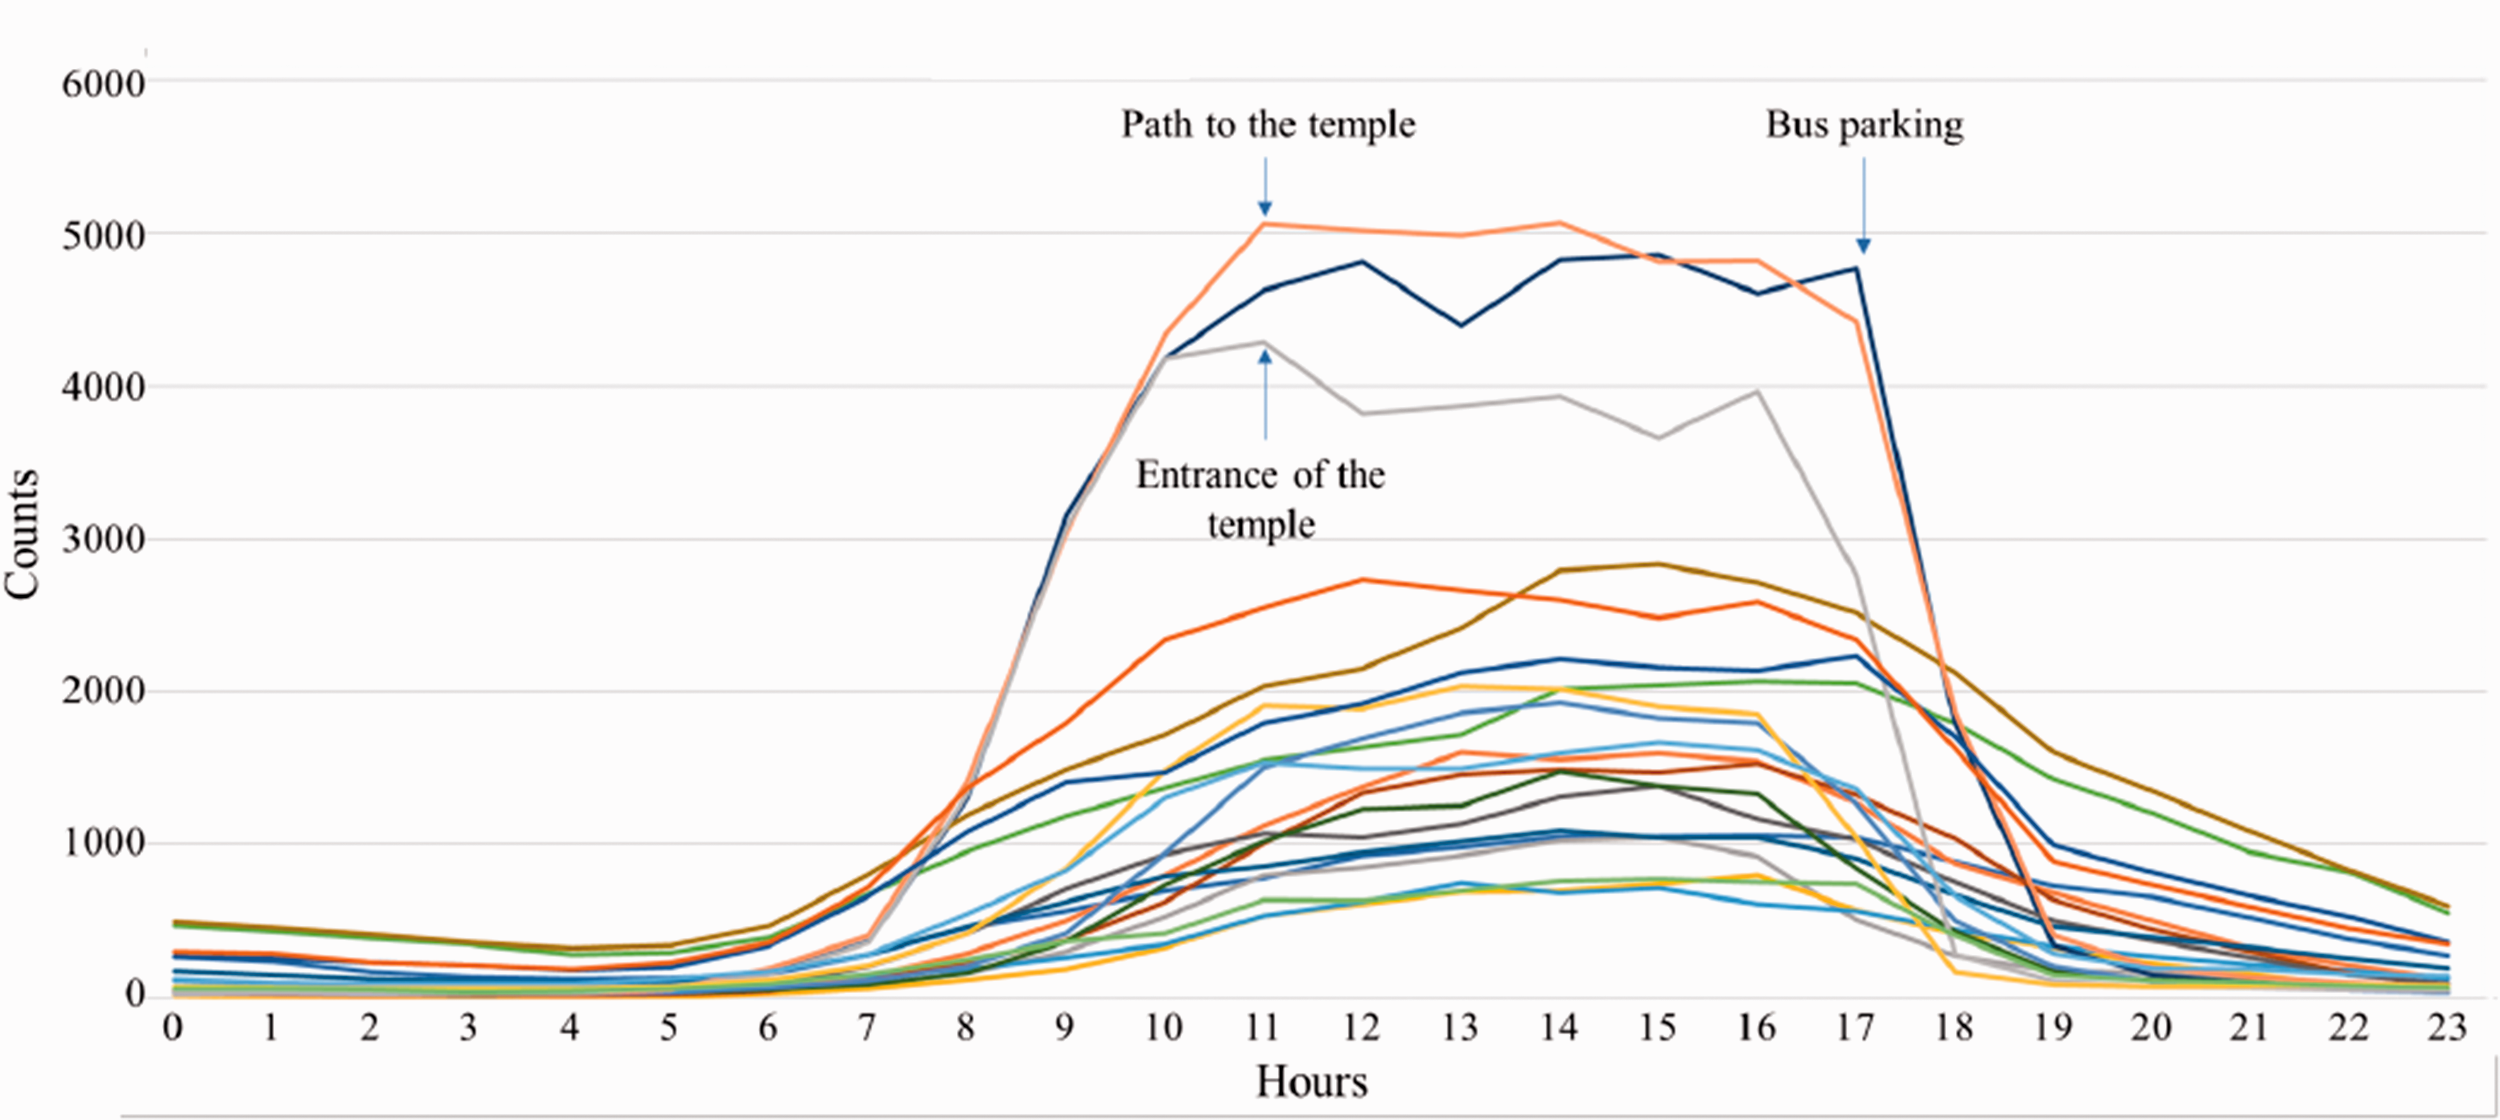
Aggregated counts in a day vs. time for each sensor.
Using data such as that gathered above in the Higashiyama experiment gives the evacuation planners important insights. Knowing at each node in the network what the preferable route for tourists to take is and at what times of the day or of the year the existing routes are used, can change the route design. Another important insight is the highlighting of the weak spots in the network, where tourists are more vulnerable to losing their way and being exposed to danger during the time of crisis; any unnecessary waste of time and difficulty in finding the right route back may, thus, be prevented. In the next section, we discuss the available methods to guide tourists during a crisis and propose a novel approach for improving guidance and evacuation processes.
Improvement of tourist guidance and evacuation
Improvement of available resource use
Resources as mentioned above can now be better assigned due to the availability of network user categorization, by MAC address, etc., as tourists and locals, a tool that allows the evacuation route to be constructed and controlled more efficiently. For example, the use of traditional route guidance methods such as signs (tsunami evacuation routes, guidance to landmarks, etc.) and human resources (police officers and volunteers assisting and directing the population to the right way) can be modified to fit the specific audience better. If planners know about any tourists from a specific country visiting the area, they can address them better with the desired language.
Usage of signs and human resources are very efficient when dealing with predictable scenarios. Another low-tech information provision resource consists of physical landmarks that allow the population to be directed more efficiently. For example, assume the use of a high landmark as a gathering point or directional instruction for mass evacuation (e.g., “go towards Kyoto tower”). We can also assume the use of subway stations as shelters and gathering points. Nevertheless, the use of such landmarks is not always available or safe (i.e., in case of earthquakes), but the authorities can still use other creative ideas such as a hot air balloons to point out gathering points in the urban area. Utilizing human resources can also be efficient in less predictable evacuation scenarios, as signs that are not placed correctly or do not clearly indicate that the exact direction will have limited efficiency.
As noted, new options arose with the development of the Internet, Wi-Fi, GPS, and BLE, giving the authorities innovative ways of monitoring scenarios and communicating with the population. The simplest way to provide data is to send short message service (SMS) messages or push-notifications directly to the mobile phones, alerting users to hazards, giving instructions and using communication methods that are available in many countries. Another method that is common in some nations and cities is the use of apps and websites that can give instructions to the population in advance and during crisis times, and can be designed for such occasions (e.g., the HFC Home Front Command app in Israel) or already have a suitable function in it (such as “Kyoto Trip+” and Google Maps). The data are continuously updated in these applications, so they can give online information to the population, such as blocked roads and hazards, along with instructions for how to act during the given evacuation scenario. Further development may be to communicate with the authorities using apps to gain data and instructions. This is, for example, available in the HFC app.
As in most cities (mainly those known as more vulnerable for disasters), there are already evacuations routes so it may not be necessary to completely redesign them. As noted before, an extensive literature exists on the design of evacuation routes, and only minimal effort is required to adjust them for tourist needs. Adding signs in locations that attract tourists to direct them during the evacuation process is a good option. Another one (to be analyzed further in the next section) is to give the tourist personalized information addressing both the scenario and the specific tourist characteristics, providing them with guidance in the most suitable language. A proper application of this may be to guide the tourist to their embassy if the scenario demands this.
We conclude this section by noting that the guidance should not only consider the tourist numbers and locations observed from “usual” behavior but also the previously discussed potential routing errors. For further discussion, we refer to Nahum et al. (2020), who addressed the evacuation of tourists considering that a limited amount of costly guidance can minimize navigation errors, and Hadas et al. (2020), who addressed the navigation error characteristics of residents and tourists during an evacuation, using a combined simulation and virtual reality approach.
Localized & personalized guidance at the time of disaster occurrence
Having reviewed well-known route guidance methodologies in previous sections, we now want to highlight the options arising from BLE tags and mobile phone applications. These enable us to design apps that provide data to the evacuees directly with no need for them to initiate communication. Some apps today, such as Google Maps, Tabiko, and “Kyoto Trip+”, have functions that can assist tourists and residents during a time of crisis, obtaining information on required behaviors, locations and data about hazards, safe areas and evacuation routes. The data given to the evacuees can now be modified to fit their own characteristics. For example, handicapped people in wheelchairs should be given an evacuation route avoiding stairs as much as possible, and pregnant women and the population at risk should avoid areas with high rates of pollution. This type of modification of the routes, based on the characteristics of the user, has already been applied in some navigation apps, which can be triggered by the various sensors to provide information about the evacuation area, directions, and instructions.
When designing a localization and navigation service for “worst case scenarios”, we must assume that large portions of the existing infrastructure will not be available. In particular, the Global Navigation Satellite Systems (GNSS) services such as GPS may be considered as “blocked”. Jamming GNSS services are becoming a major threat as has been applied recently in several cases, e.g., Glomsvoll and Bonenberg (2017) and Ziebold et al. (2018). Moreover, advanced cyber security attacks on the GNSS services may include spoofing, which is significantly harder to cope with, e.g., Capua et al. (2018). In fact, major GNSS jamming may lead to a 4G/5G network failure due to the need for more accurate timing (given by the GNSS services); such wireless networks are vulnerable to many natural and man-made disasters. Even if both GNSS and 4G/5G services are available, their expected accuracy in dense urban regions might not suffice (mainly in indoor scenarios).
Therefore, a navigation system based on BLE tags and independent of any existing infrastructure is preferable. Such battery-operated tags can work continuously for years, and as the scenarios discussed here must be treated quickly and efficiently, these tags are considered to be reliable. The BLE localization method is based on analyzing the RSSI values of the mobile phone signals. The closer the client is to the BLE tag, the stronger the signal is, and if the location of each tag is known (or simply transmitted by the tag), the location of the user can be estimated. This method is also very efficient for gaining the locations in a 3D structure, such as shopping malls, parking lots, and any multi-level building that can be extremely dangerous during a disaster. Note that in such cases, there might be a need for continuous coverage by the BLE tags, while in outdoor scenarios, we might use partial coverage and locate tags only at important “intersections” of landmarks (e.g., intersections, bus stops).
The effectiveness of such a method for evacuation purposes was demonstrated by us as follows: BLE sensors were scattered over a large number of locations within a building at Bar-Ilan University, Ramat-Gan, Israel. We illustrated the monitoring of visitor movement within this 3D space in a way that allowed us to give them specific instructions such as directing them to diverse operations and walking paths, as well as to provide decision makers with relevant information. As every BLE sensor has an independent power-supply with a long lifetime, the information gathered in that way may be of great help, for instance to aid rescuers in locating survivors in such a building or in any largely visited tourist site after collapse. Another potential application is to track the movement of the rescue team members themselves, allowing them to know the location of the others. In Figure 6, we present the monitoring of a walking path in the above 3D building that has been covered by BLE tags. Such results illustrate the fact that using BLE and further innovative technologies can assist the evacuees, the rescue and guidance teams and the authorities in their mission to bring everyone home with maximum safety.
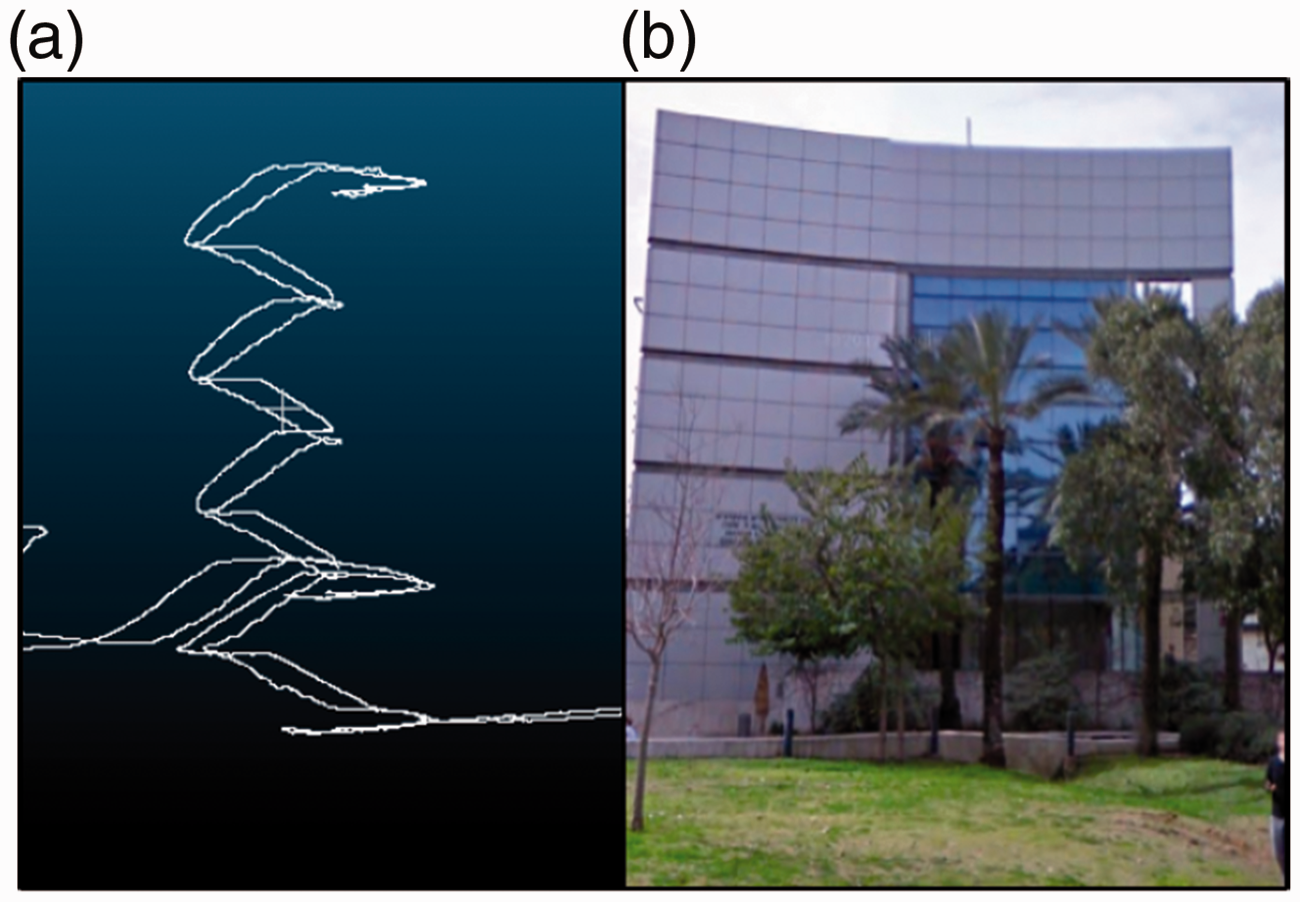
Three-dimensional representation of a walking path: (a) recorded using an Android Tango-Phone running real-time SLAM (b) of the building.
Conclusions
In this study, we presented a framework and discussed data and technologies that contribute to the planning of city tourist evacuation routes. Lack of protocols and schemes for evacuation to the first safe zones at the occurrence of disaster is an opportunity to combine innovation and new state-of-the-art models with the availability of online data, to assist in the first step of the evacuation.
We further discussed part of the many movement models of tourists during an evacuation, regarding their tendency to make more mistakes than residents of the area due to lack of familiarity, orientation, language barriers, etc., and presented some insights into three types of tourists: cautious, risk-taking and “unaware” travelers. Throughout the article, we referred to Kyoto as an example, and these insights were further illustrated using simulations in the Higashiyama area of Kyoto.
We discussed the complexity of predicting tourist flows compared with their key role in the task of planning evacuation routes. We noted that, in recent years, the availability and rapid change of online information (such as “trip advisor”) and social media have resulted in more dispersion of tourists in the city area and less concentration in major tourist spots than previously. Moreover, seasonality, weather, holidays of different nationalities, etc., also have a vast influence on tourist flows.
While long-term predictions are of importance in economics (for example, when tourist presence occurs in a specific month/day of the week/hour), the ability to give short-term, individual-level predictions is also critical for evacuation planning. We discussed the data sources, fusion, and analysis approaches, from bespoke surveys, cameras and isolated sensors (that have limitations regarding movement patterns of tourists) to mobile phone data (taken from operators or by sensors distributed in the area) and applications asking for permission to gain full or partial data of the tourist movements (using a mobile phone alone with an app or with the aid of sensors). We also noted the potential use of data from social media, which can be helpful for gaining insights into tourist movements. Also, using empirical data gathered in a highly visited area by tourists in Japan, we demonstrated how to obtain long-term as well as short-term predictions.
A major discussion in the article concerns the information provided to tourists during disasters. For that purpose, we classified disasters into sudden scenarios (limited in the way we can prepare tourists and evacuation routes for them) and predictable scenarios where we know in advance that they will occur. The characteristics of the predictable scenarios make it possible to supply tourists with information about safe zones, assistance available in time of need, additional instructions regarding the evacuation process, and communication with services and authorities, etc.
Finally, we discussed ways to guide tourists to evacuation routes: traditional methods such as signs, the use of human resources and guidance using landmarks, and high-tech resources such as SMS and push-notifications sent directly to a mobile phone with instructions as well as websites and apps providing information. The improvement brought about by modern technologies was illustrated by an experiment on movement data acquisition in a highly frequented 3D building that was covered by BLE tags. The most novel approach in this field is the personalized guidance; now we can provide tourists (and pedestrians in general) with data and instructions that fit not only the scenario itself, but also the characteristics of the evacuees themselves.
Recommendations for future research are as follows. First we suggest to deepen the analysis of the diverse parts of the framework as shown in Figure 1, and eventually improve the combination of components as it can highly improve the evacuation process, mainly in places that tend to be affected by sudden scenarios. Also, regarding the various emerging data and novel technologies, their potential has been thoroughly discussed here but their actual performance during a disaster is not fully known and further investigation is required.
In addition, as tourists belong to diverse population groups with potentially different behaviors and acceptance of the various forms of guidance, we recommend to further investigate the definition and classification of pedestrian and tourist movement patterns, mistakes and routing strategies. In this topic, we suggest to further focus on the evacuee routing process (for instance, when they lose their way), as this is not yet fully addressed in the existing literature.
Supplemental Material
sj-pdf-1-epb-10.1177_2399808321994575 - Supplemental material for Planning for tourist urban evacuation routes: A framework for improving the data collection and evacuation processes
Supplemental material, sj-pdf-1-epb-10.1177_2399808321994575 for Planning for tourist urban evacuation routes: A framework for improving the data collection and evacuation processes by Guy Wachtel, Jan-Dirk Schmöcker, Yuval Hadas, Yuhan Gao, Oren E Nahum and Boaz Ben-Moshe in Environment and Planning B: Urban Analytics and City Science
Footnotes
Declaration of conflicting interests
The author(s) declared no potential conflicts of interest with respect to the research, authorship, and/or publication of this article.
Funding
The author(s) disclosed receipt of the following financial support for the research, authorship, and/or publication of this article:This research was supported by a grant from the Ministry of Science & Technology, Israel & the Japan Science and Technology Agency (herein referred to as “JST”).
Supplemental material
Supplemental material for this article is available online.
References
Supplementary Material
Please find the following supplemental material available below.
For Open Access articles published under a Creative Commons License, all supplemental material carries the same license as the article it is associated with.
For non-Open Access articles published, all supplemental material carries a non-exclusive license, and permission requests for re-use of supplemental material or any part of supplemental material shall be sent directly to the copyright owner as specified in the copyright notice associated with the article.