
Abstract
The global urban population is expected to grow by 2.5 billion over the next three decades, and 90% of this growth will occur in African and Asian countries. Urban expansion in these regions is often characterised by ‘informal urbanization’ whereby households self-build without planning permission in contexts of ambiguous, insecure or disputed property rights. Despite the scale of informal urbanization, it has received little attention from scholars working in the domains of urban analytics and city science. Towards addressing this gap, we introduce TI-City, an urban growth model designed to predict the locations, legal status and socio-economic status of future residential developments in an African city. In a bottom-up approach, we use agent-based and cellular automata modelling techniques to predict the geospatial behaviour of key urban development actors, including households, real estate developers and government. We apply the model to the city-region of Accra, Ghana, drawing on local data collection, including a household survey, to parameterise the model. Using a multi-spatial-scale validation technique, we compare TI-City’s ability to simulate historically observed built-up patterns with SLEUTH, a highly popular urban growth model. Results show that TI-City outperforms SLEUTH at each scale, suggesting the model could offer a valuable decision support tool in similar city contexts.
Keywords
Introduction
The global urban population is projected grow by 2.5 billion over the next three decades, and 90 percent of this growth is expected to occur in Africa and Asia (United Nations, 2018). Managing this growth effectively is a daunting challenge due to rapid demographic change, widespread poverty, critical infrastructure gaps and resource constraints. Urban modelling with open, accessible software could provide important decision support tools to improve planning and resource allocation. However, many of the existing urban growth models are not well-suited to low- and middle-income country contexts, which are often characterised by ‘informal urbanization’.
Informal urbanization refers to the processes of urban growth and expansion whereby developments occur without formal planning permission (Angel et al., 2016; Burra, 2004) and households self-build in a context of ambiguous, insecure or disputed property rights (Bredenoord and van Lindert, 2010; Soliman, 2012; United Nations Human Settlements Programme (UN-HABITAT), 2011; United Nations Human Settlements Programme (UN-HABITAT), 2009). Informal urbanization is common across countries in Sub-Saharan Africa (SSA), such as Ghana (Bangdome-Dery et al., 2014; Boamah et al., 2012), Nigeria (Lloyd-Jones et al., 2014; Ogu and Ogbuozobe, 2001), Kenya (Kamau et al., 2006), South Africa (Landman and Napier, 2010), Tanzania (Ramadhani, 2007), Malawi and Zambia (Kihato et al., 2013).
The few attempts at modelling this phenomenon in SSA reflect the evolution of urban modelling more broadly. Since Lee’s ‘Requiem for large-scale models’ (Lee, 1973) there has been a shift from large-scale, top-down, homogenous and static techniques that required rigid assumptions of equilibrium, to more dynamic and bottom-up approaches that better capture the complexity and heterogeneity that characterize cities (Batty et al., 2012; Dietzel and Clarke, 2004; Goldstein et al., 2004; Guan et al., 2005). For example, Cellular Automata (CA) has been used to model various forms of informal urbanization in SSA (Hofmann et al., 2015; Roy et al., 2014). The most popular CA model for predicting patterns of urban expansion has been SLEUTH (slope, land use, exclusion, urban, transport and hill shade) by Clarke et al. (1997).
In Africa, SLEUTH has been applied in urban growth or land use changes in Accra (Agyemang and Silva, 2019), Nairobi (Mubea and Menz, 2014), Cape Town (Watkiss, 2008) and Yaoundé (Sietchiping (2004). Badmos et al. (2019) go a step further and integrate a Logistic Regression (LR) model into SLEUTH to model slum development in Lagos. However, while the authors examine the fitness of the regression model, they do not assess the spatio-temporal performance of the integrated LR-SLEUTH model. Thus, it is unclear as to whether this approach improves the accuracy of prediction.
The attraction of applying CA to urban growth modelling is clear: local interactions governed by simple transition rules can simulate emergent order (Dietzel and Clarke, 2004; Goldstein et al., 2004; Wagner, 1997). However, CA does not model the underlying social processes that generate the spatial patterns we observe (Benenson and Torrens, 2004; Dahal and Chow, 2014; Parker et al., 2003; Zhang et al., 2010) as they do not incorporate decision-making agents. If we want to improve our ability to predict informal urbanization, we need to model the behaviour of the autonomous decision-making agents that underly the phenomenon.
Another technique applied to modelling urban land use changes and residential choices is agent-based modelling (ABM), which provides the flexibility of modelling the behaviour of diverse actors responsible for change in a system (Filatova et al., 2013; Huang et al., 2014; Wu and Silva, 2010). Agent-based modellings have drawn on classical urban theories on urban forms, for example, Alonso-Muth-Mills’ monocentric cities (Alonso, 1964; Muth, 1969; Mills, 1972) and its modifications, and Schelling’s residential segregation to simulate urban land use changes (Benenson and Torrens, 2004; Crooks et al., 2008). One of the attractions of ABM is the ability to model urban land market processes, such as preferences, competition, relocation, and resource constraints that underpin residential choices (Jackson et al., 2008). The capacity to model heterogenous agents is another strength of the technique (Ettema, et al., 2007; Ligtenberg et al., 2004). There have been few applications of ABM to informal urbanization (see Roy et al., 2014).
In one of the few attempts to apply ABM to informal urbanization in SSA, Augustijn-Beckers et al. (2011) combined the approach with three growth rules (infilling, extension, and enlargement) to model housing growth in a slum area in Dar es Salaam. While innovative, the model is more applicable to simulating expansion of an existing slum area than modelling the emergence of new informal urban clusters/settlements, or expansion at the city or city-region scale. Inkoom et al. (2017) used ABM to simulate spatial growth patterns of a neighbourhood in Shama, a small town in Ghana. Despite making room for households to self-build, which is a key feature of informal urbanization, the model is not validated beyond visual inspection, and is yet to be applied to a city context. In another application, Patel et al. (2012) used ABM to model informal urbanization and simulate slum emergence. However, this was done in a stylized environment; the utility of the model in a SSA context has not been explored.
Building on these efforts, we present a model that integrates CA with ABA to predict urban expansion patterns at the city-region scale in a context of informal urbanization. The model – TI City – is designed to predict the locations, legal status, and socio-economic status of future residential developments in a Sub-Saharan African city. We demonstrate its utility by applying it to the city-region of Accra, Ghana, drawing on local data to parameterise the model. The model is validated at different spatial scales and its performance is compared with that of SLEUTH. The rest of the paper is organised into two main parts: the first part is Model Structure, which describes the structure of the model, and the second part is Case Study: Accra city-region, Ghana, Results and Conclusion, which discuss the case study application, parameterization (including local data collection in 3.1.1), results and validation of the model.
Model structure
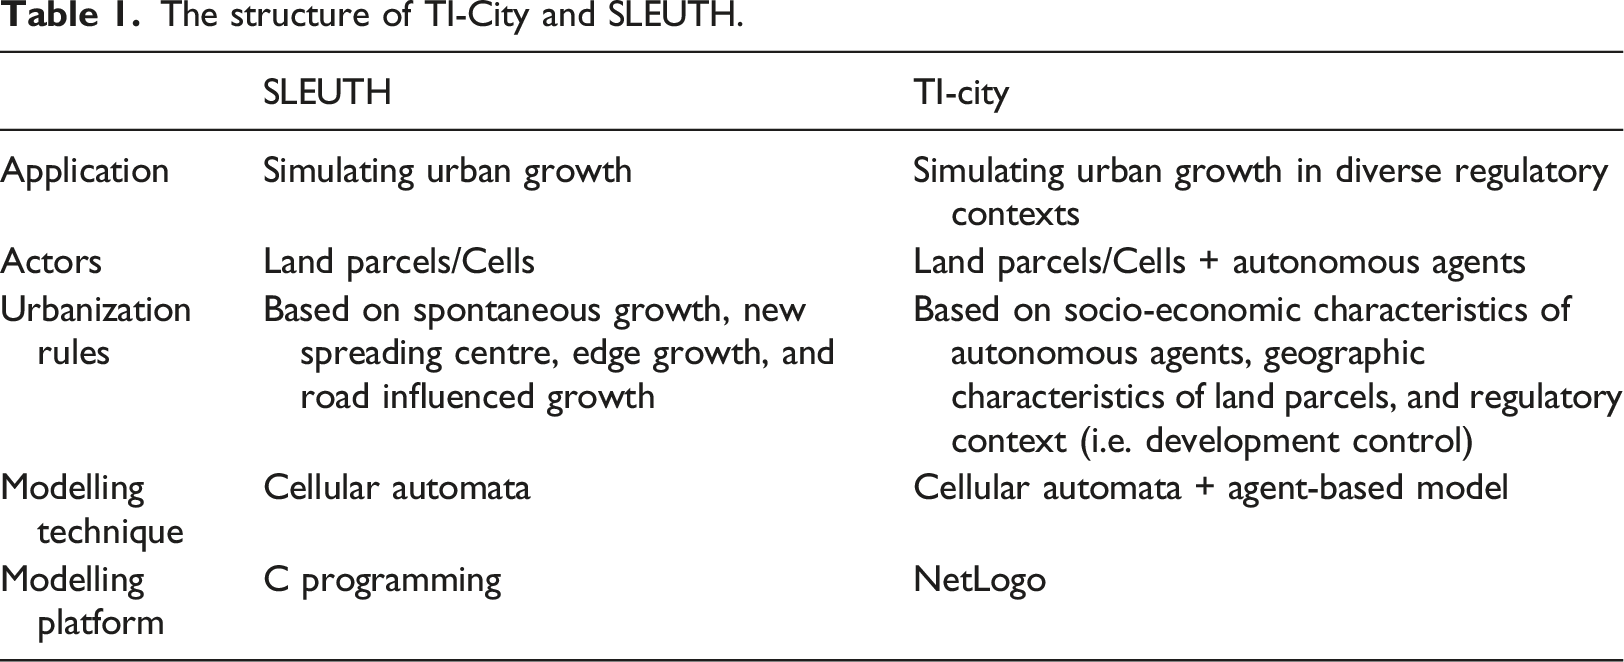
TI-City, derived from the phrase ‘the informal city’, was developed using the free and openly accessible NetLogo modelling platform. Like RePast, Swarm and several other ABA platforms, NetLogo has the capacity to simulate dynamic social systems, and has the additional attraction of being simpler to use (Abar et al., 2017). Figure 1 shows the conceptual framework of the model. There are three main agents responsible for how development occurs in the model: households, real estate developers (RED), and government. These agents operate within a spatial environment represented by land parcels, which have geographical characteristics, including land values, proximity to infrastructure and amenities, slope/elevation and land use zoning. Household agents who are further stratified into low, middle- and high-income groups can select parcels and undertake development. This reflects the self-build processes that characterizes informal urbanization in many cities in SSA (see Boamah et al., 2012; Kihato, 2013; Soliman, 2012, United Nations Human Settlements Programme (UN-HABITAT), 2011). RED agents can also select parcels and undertake development to meet the demand of a segment of household agents. They are classified into (1) those targeting the middle-end market, and (2) those targeting the high-end market. The government agent performs development control functions by enforcing laws and regulations that govern physical development. The structure of TI-City is contrasted with that of SLEUTH in Table 1. Conceptual framework of TI-City. The structure of TI-City and SLEUTH.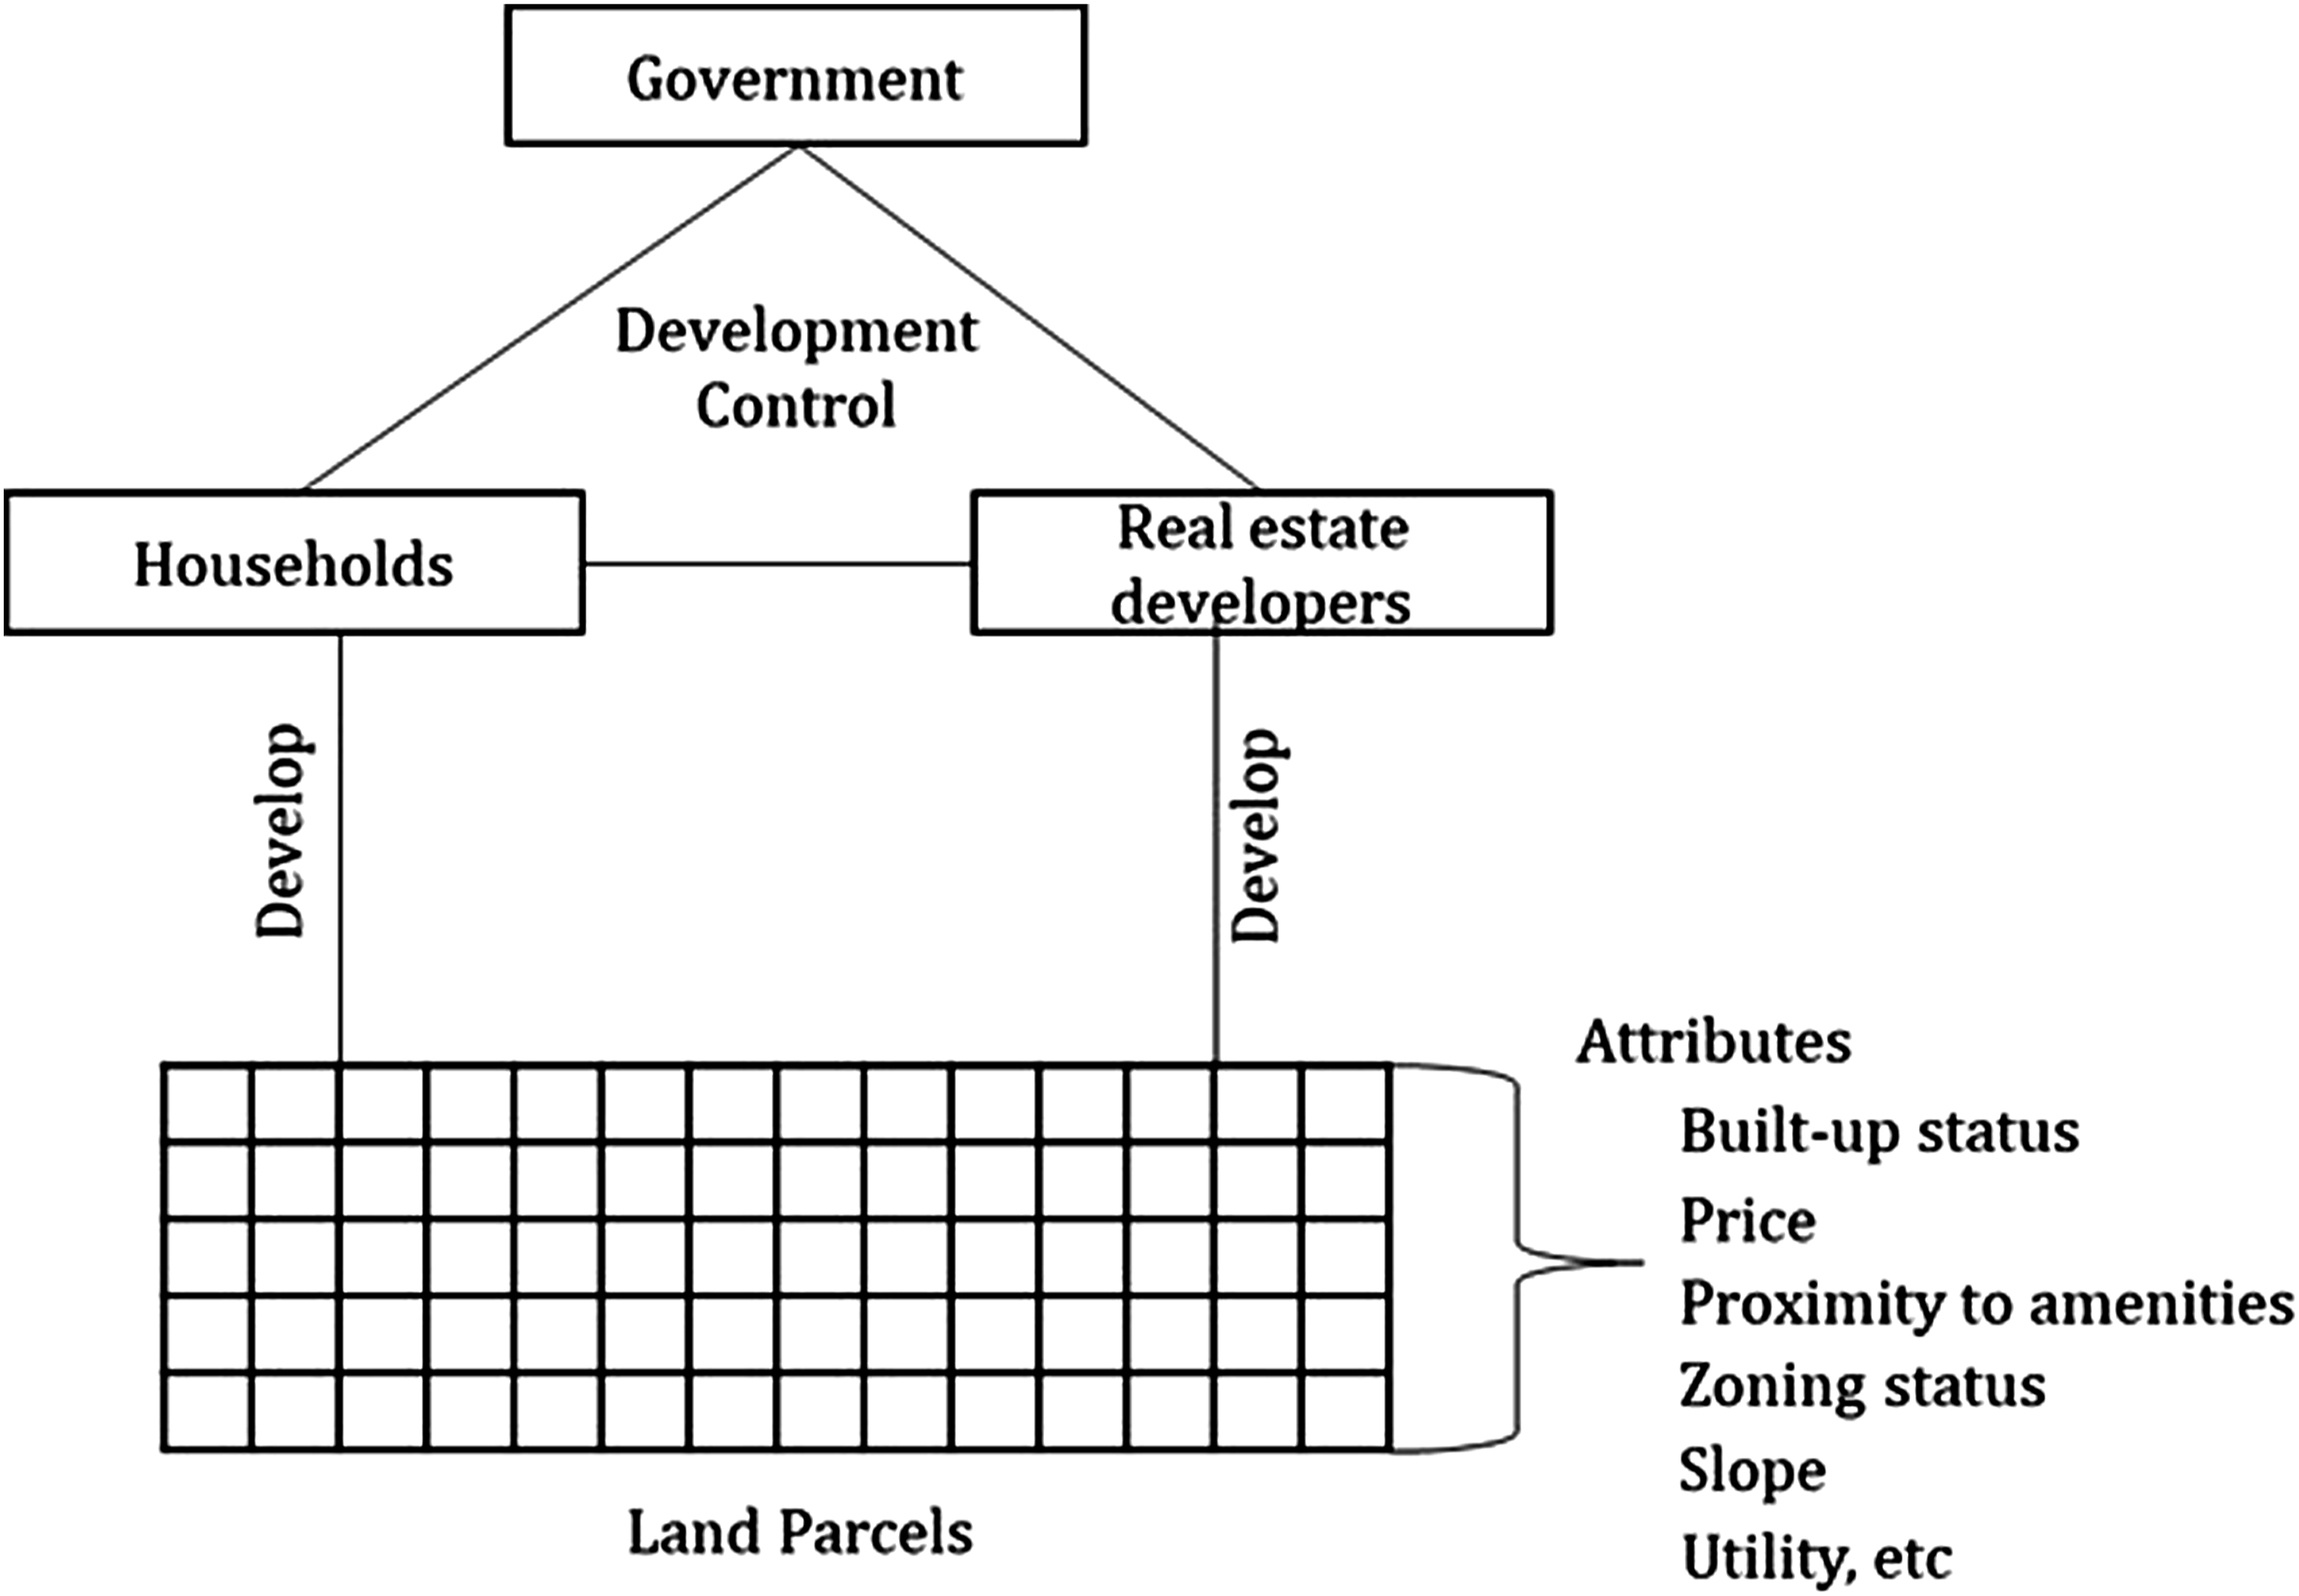
Conditions for the development of a parcel
The selection of a parcel for development by an agent, including both households that self-build and RED, depends on several conditions expressed in equation (1)
Agent decision-making
The dominant decision-making criteria employed in ABMs applied to urban systems include utility maximizing and utility satisficing (Huang et al., 2014). Whilst agents under utility maximizing criteria select the location with the highest utility, the latter only requires agents to locate a space with a generally high utility, not necessarily the highest. In TI-City, agents are assumed to be boundedly rational with limited information; hence, the utility satisficing criterion is used to regulate their behaviour. The agents go through a process in selecting a place to develop. We use a decision tree technique, shown in Figure 2, to implement this process. A developer agent first checks the built-up status of a parcel. If the parcel is already built, the agent considers another parcel, and if it is vacant, the agent proceeds to the next step, which is to check the affordability of the parcel. This continues till the agent gets to the last step by checking whether the utility of the parcel is satisficing. If it is satisficing, the agent selects the parcel for development. Agent decision-making process.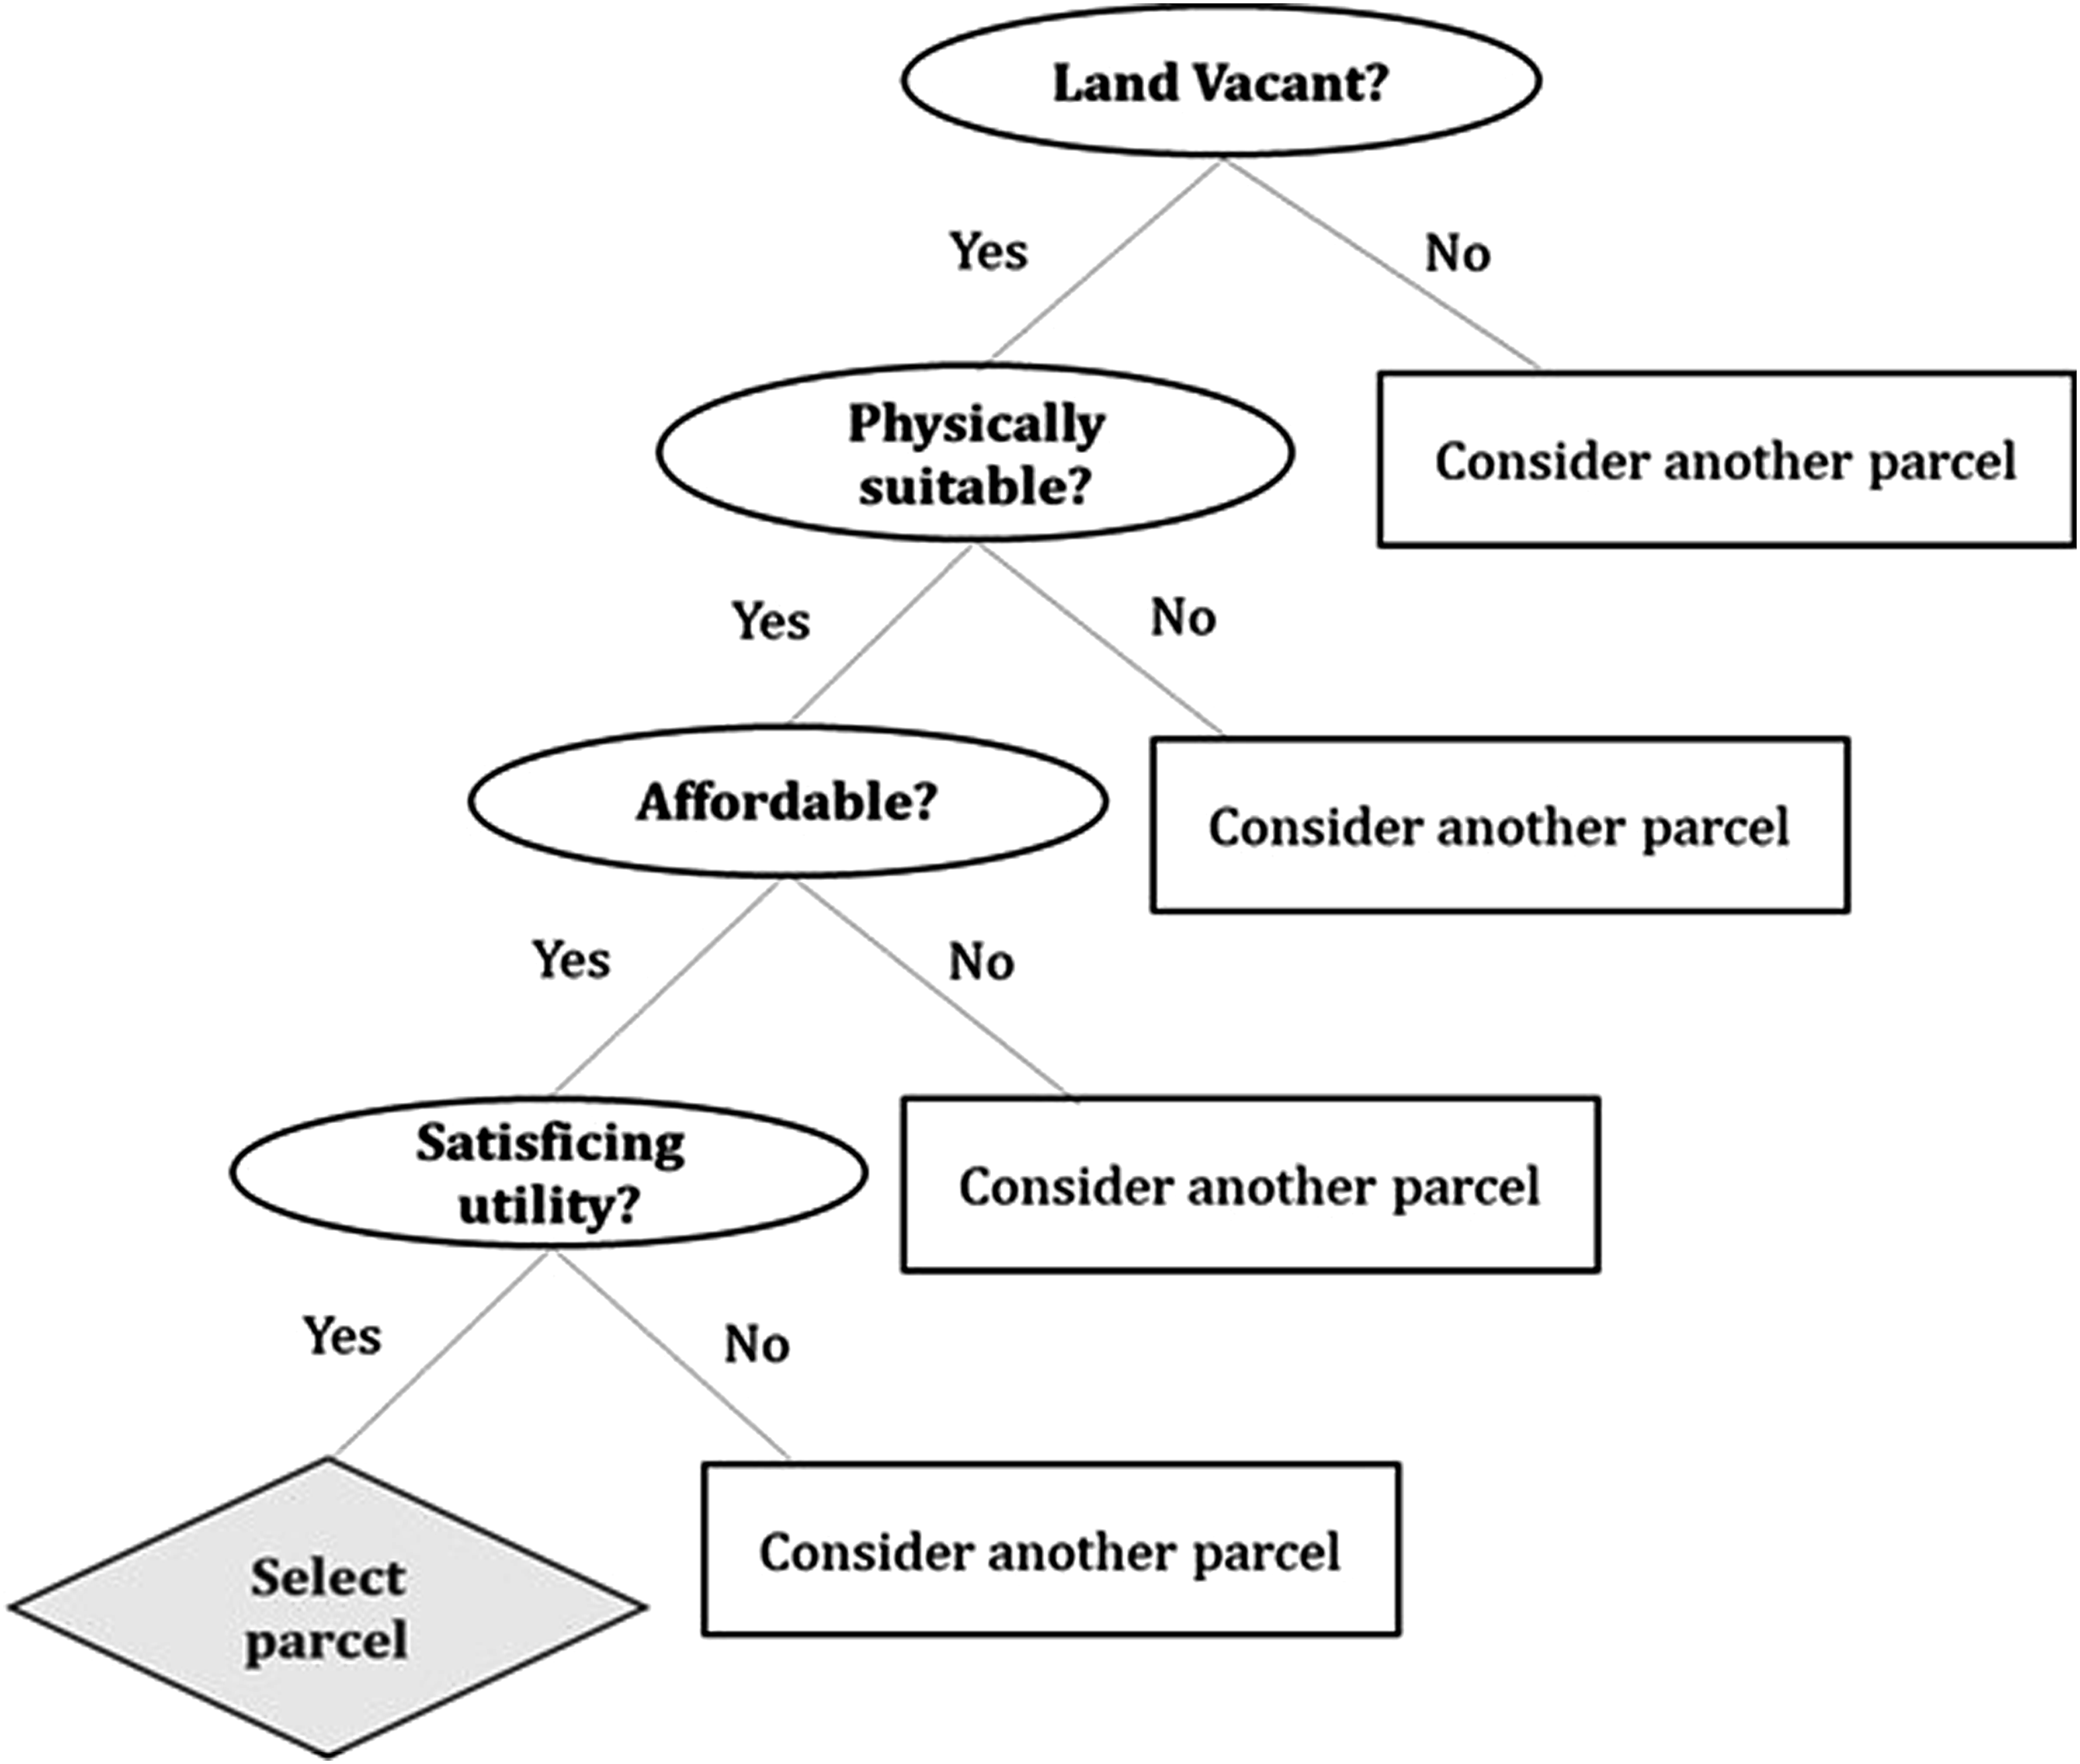
Dynamic treatment of utility
As indicated above, the last stage in the DT involves the agent inspecting the utility of a parcel. Utility in the model is calculated using equation (2).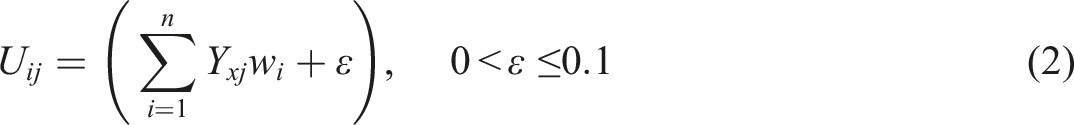
As in most cities, households in SSA cluster spatially by income (David et al., 2018; K’akumu and Olima, 2007; Poku-Boansi et al., 2020). Following this, utility in TI-City is not held static, but rather modelled dynamically to mimic the neighbourhood effects that occur in the real-world. Using a CA technique, parcels update their utility based on activities that take place in their neighbourhood. As illustrated with Figure 3, parcel q changes its low-income utility from low in time 1 to high in time 2 as three neighbours are selected for development by low-income households. Thus, parcel q becomes more attractive to low-income households, increasing its likelihood of being selected by agents with similar characteristics. This dynamic effect also applies to middle- and high-income household agents. Dynamic modelling of utility.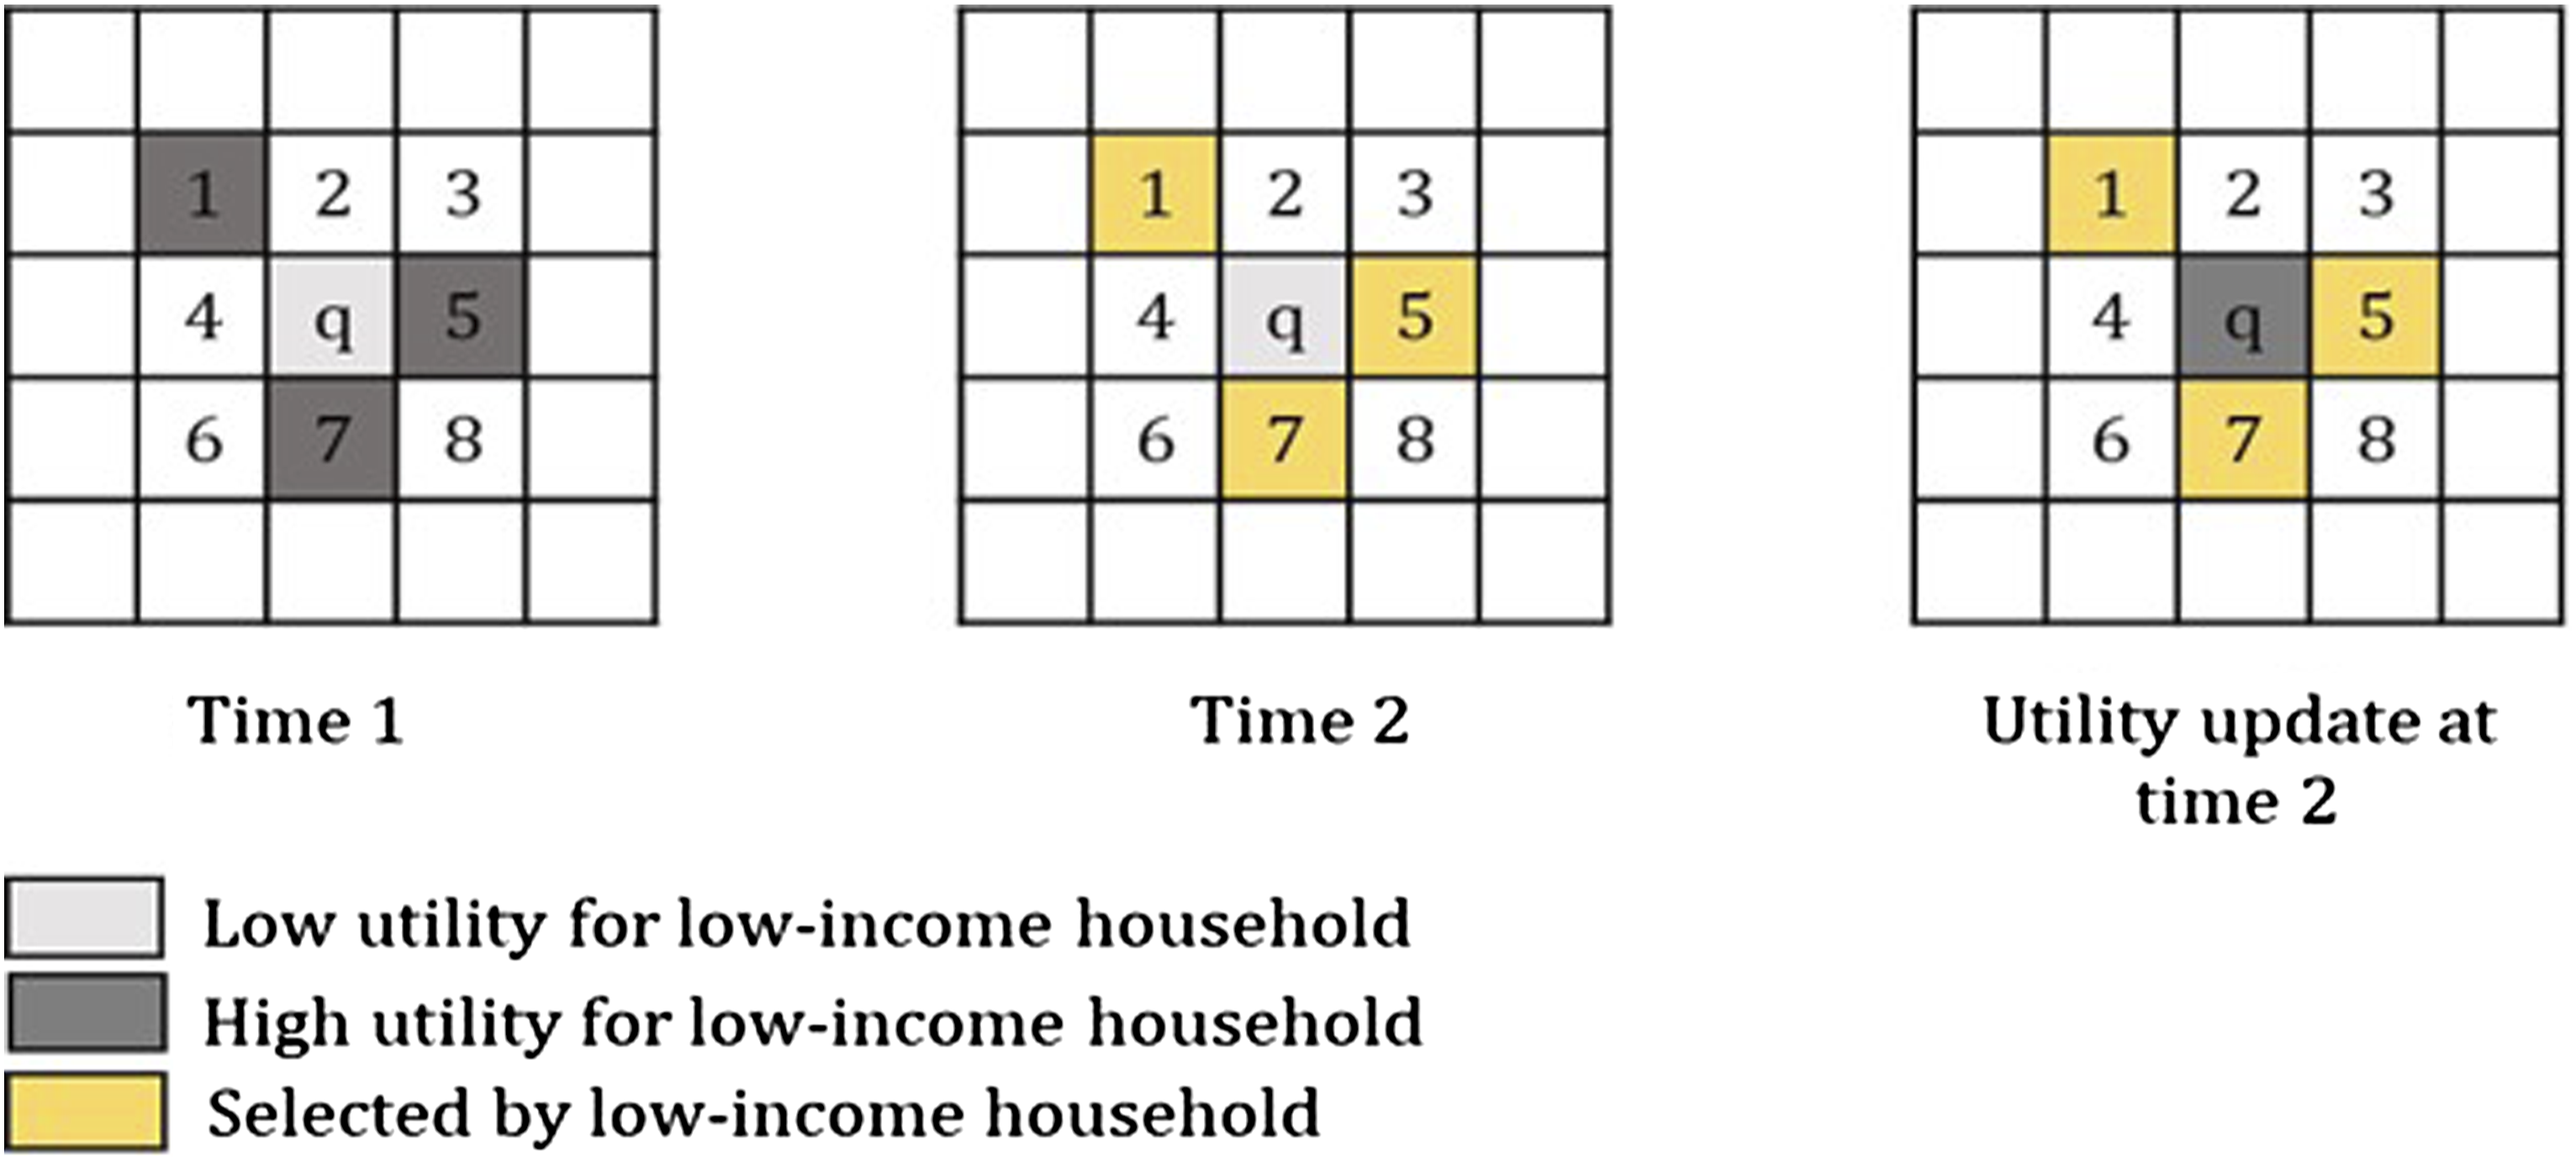
Development control and informality
Development control is a key parameter of the model as it accounts for the role of government in residential location choices. The parameter determines the extent to which laws governing development influence the decisions of agents. For instance, it determines the degree to which developer agents abide by land use plans, zoning plans and other permit requirements such as proof of land ownership. Development control varies with context. While some governments are strict in their enforcement of laws, others are more flexible or lack enforcement capacity.
To account for varying degree of enforcements, the model uses a development control parameter/slider, which ranges from 0 to 100. A value of 0 means there is no development control: agents are not restricted in any way by the laws and regulations governing development. For instance, lands that are unplanned, not zoned for residential development, or untitled will still be available in the market for agents to consider and potentially select for development. Conversely, a value of 100 connotes total enforcement of development laws; hence, lands with all or any of the three features above will be excluded from the market. A value of 30 means a random 70 percent of lands with the above characteristics will be available in the market, whereas 70 means 30 percent of these lands will be randomly available in the market.
The parameter also has a bearing on how much informal development takes place in the model. As earlier outlined, a key feature of informal urbanization in many cities in SSA is the phenomenon whereby development occurs without planning permits. In TI-City, if development takes place on a parcel with all or any of the three features noted above, it is classified as informal. This means that lower values of the development control parameter are associated with a higher likelihood of informal developments, and vice versa.
Model output metrics
The model uses eight metrics to further characterise simulated outputs. These include: percent informal, which quantifies the proportion of all new developments that are informal; contribution to informality, which measures the contribution of each income group towards new informal developments; informality by income type, the proportion of new developments that is informal, which computes for each income group; percent edge growth, which quantifies the proportion of new developments that occur on the edges of existing built-up parcels; new spreading centre, which generates the rate at which new centres emerge from new developments; linear growth, which computes the rate at which new developments occur in the neighbourhood of transport networks; percent spontaneous, which calculates the proportion of new developments that are dispersed; and percent urbanized, which quantifies the proportion of land area developed.
The code and data required to replicate the model is openly accessible at: https://github.com/skfagyemang/TI-City-Model.git
Case study: Accra city-region, Ghana
We demonstrate the model’s utility by applying it to Accra city-region (ACR), the capital of Ghana and one of the largest cities in West Africa. The ACR covers roughly 8100 km2 of land and had an estimated population of 5.5 million in 2010, representing 22 percent of the national population (Ghana Statistical Service, 2013). It is urbanizing rapidly; between 2000 and 2010 the urban population grew by 3.2 percent annually and the share of the population living in urban settlements in the region increased from 77 to 81 percent during the period. Based on projections by the Town and Country Planning Department of Ghana, the population of the area could reach 10 million by 2035 (Town and Country Planning Department, 2015). Despite holding less than 4 percent of Ghana’s landmass, the city-region contributes more than a quarter (28 percent) of the national GDP.
Data Sources
Data and sources.
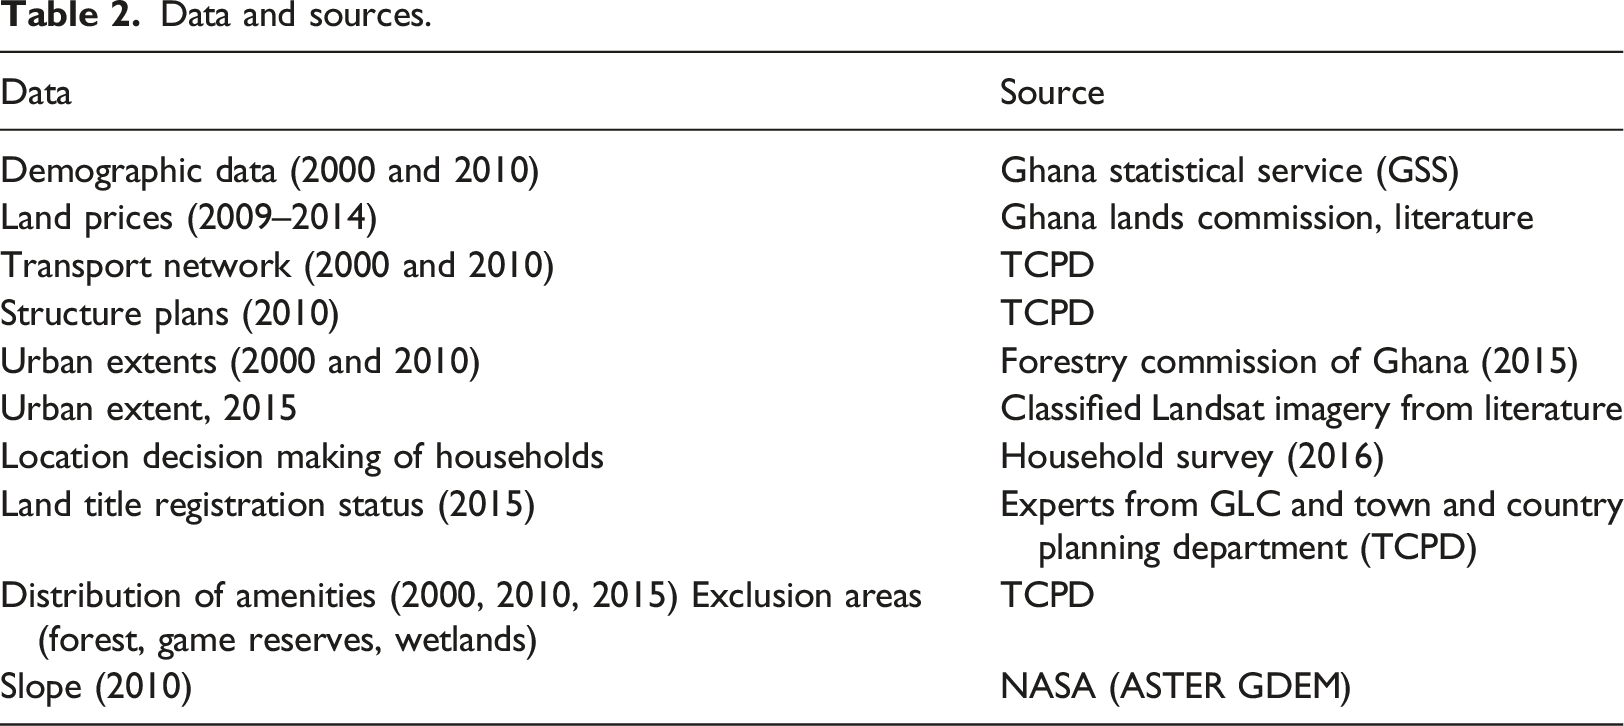
On development control, we obtained information on land use zoning from structure plans, and information on the title registration status of land parcels through expert consultation. The laws governing physical development in Ghana, specifically the Local Governance Act, 2016 (Act 936), requires every development to be authorized through the issuance of a planning permit by the Government. In applying for a permit, the applicant is required to prove ownership of land to be developed by providing evidence of an officially registered title. Another key requirement for obtaining a permit is that the proposed development must conform to the land use zoning of the area. For example, if a residential development is proposed for an area not zoned for residential use, the law requires the application to be rejected. Unlike data on structure plans, which was acquired from the TCPD, data on land title registration status was extremely difficult to access. We therefore assembled a team of experts from the GLC and Town and Country Planning Head Offices to generate a sketch of registered and un-registered lands in the study area.
Local data collection
To understand how household agents prioritize various location choice factors, a survey was conducted. Through a combination of cluster and stratified sampling, we surveyed 800 households in ACR. We stratified the sample across three classes: low, middle- and high-income. In the absence of data on income distribution, we relied on our local knowledge and that of planning officers at the TCPD head office to select various income clusters. For instance, Nima and Ashaiman are known to be predominantly low-income and were therefore included in the clusters. Similarly, known middle-income areas, such as Achimota and Adenta; and high-income areas, including Airport residential and East Legon, were part of the selected clusters. Given the absence of an accurate sampling frame and the limited sample size, we do not claim that the sample is truly representative, but rather indicative of how location preferences may vary across households from different classes. The sample size was constrained by project resources. We distributed the 800 surveys across 25 clusters selected from both long-established and newly developed areas of the city. The number of households interviewed in a cluster ranged from 11 in Dzorwulu to 60 in Tema.
House addressing is variable in Accra. For clusters with a good address system, we randomly selected a house, interviewed one household in the house and then proceeded to the 10th house. This procedure was repeated until the sample size of the cluster was reached. For areas with poor address systems, for example, slum areas like Nima, we loosely segmented the clusters into blocks, and a household was randomly selected from each block. Household heads were asked preliminary questions as to whether they have either moved houses recently or are in the process of doing so. Only those who had made such location decisions were interviewed.
Finally, we interviewed two representatives from the Ghana Real Estate Developers Association (GREDA) to understand how developer agents weigh various location characteristics. The representatives were given a number of factors to score on a scale of 1–10, where 1 is least influential and 10 is highly influential. The average score of the factors generally agreed as important by the two were used as weights. GREDA has hundreds of members each with their own unique considerations when selecting a place to develop. As with the survey, the scores from the participants in this exercise are not necessarily representative of the population of developers in the city, but rather provide some indicative information on location preferences within this community.
Results
Model comparison and validation
We evaluate the model’s performance with a two-stage validation process encompassing (1) visual inspection and comparison, and (2) quantitative analysis of the locational accuracy of predictions. Both stages are anchored on predictions of historical urban growth between 2000 and 2010 by TI-City, and with SLEUTH. Full details of TI model parameterisation can be found in the online supplemental material, while that of SLEUTH is drawn from Agyemang and Silva (2019), who calibrated the model for the same area over a similar period. In their brute-force calibration, Agyemang et al. reported the following coefficients: dispersion (76); breed (83); spread (95), slope (11); and road gravity (10). The authors also used a critical slope value of 25, which is the same value applied in TI-City.
In addition to predicting the locations of new developments, TI-City offers information on the income and legal status of predictions. However, these predictions could not be validated due to the absence of necessary data. The results are summarised in the online supplementary matters (Figures S2-S4).
Validation of TI-City and SLEUTH predictions
We assess the model’s performance statistically at multiple spatial scales. The rationale is that planning and regulatory interventions in the real world are implemented at different spatial scales, hence the approach could provide useful information to policy makers at various levels/scales. In implementing this approach, we first overlay grids of different resolutions on the city-region, ranging from 0.5 km to 6.5 km. We started with 0.5 km, which is slightly bigger than the original resolution of 0.2 km, because we are interested in capturing neighbourhood accuracy. At each resolution and for each cell within a grid, we calculate (1) the percentage of the cell area predicted as built-up by TI-City, (2) the percentage of cell area predicted as built-up by SLEUTH, and (3) the percentage of cell area observed as developed. We analyse the variance between predicted and observed developments for each model by calculating the R-squared at each resolution.
Figure 4 illustrates the model fit at a 5 km2 resolution and compares the model fit of TI-City and SLEUTH at each scale, from 0.5 km2 to 6.5 km2 resolutions. At all scales, TI-City considerably outperforms SLEUTH, with R-squared values ranging from 0.27 to 0.65 compared with R-squared values ranging from 0.09 to 0.2 for SLEUTH. The strength of the fit generally increases with grid size for both models. The exception though is with SLEUTH, which declines slightly after a resolution of 5.5 km2. The extent to which TI-City outperforms SLEUTH also increases as the grid size increases. Comparison of TI-City and SLEUTH performance.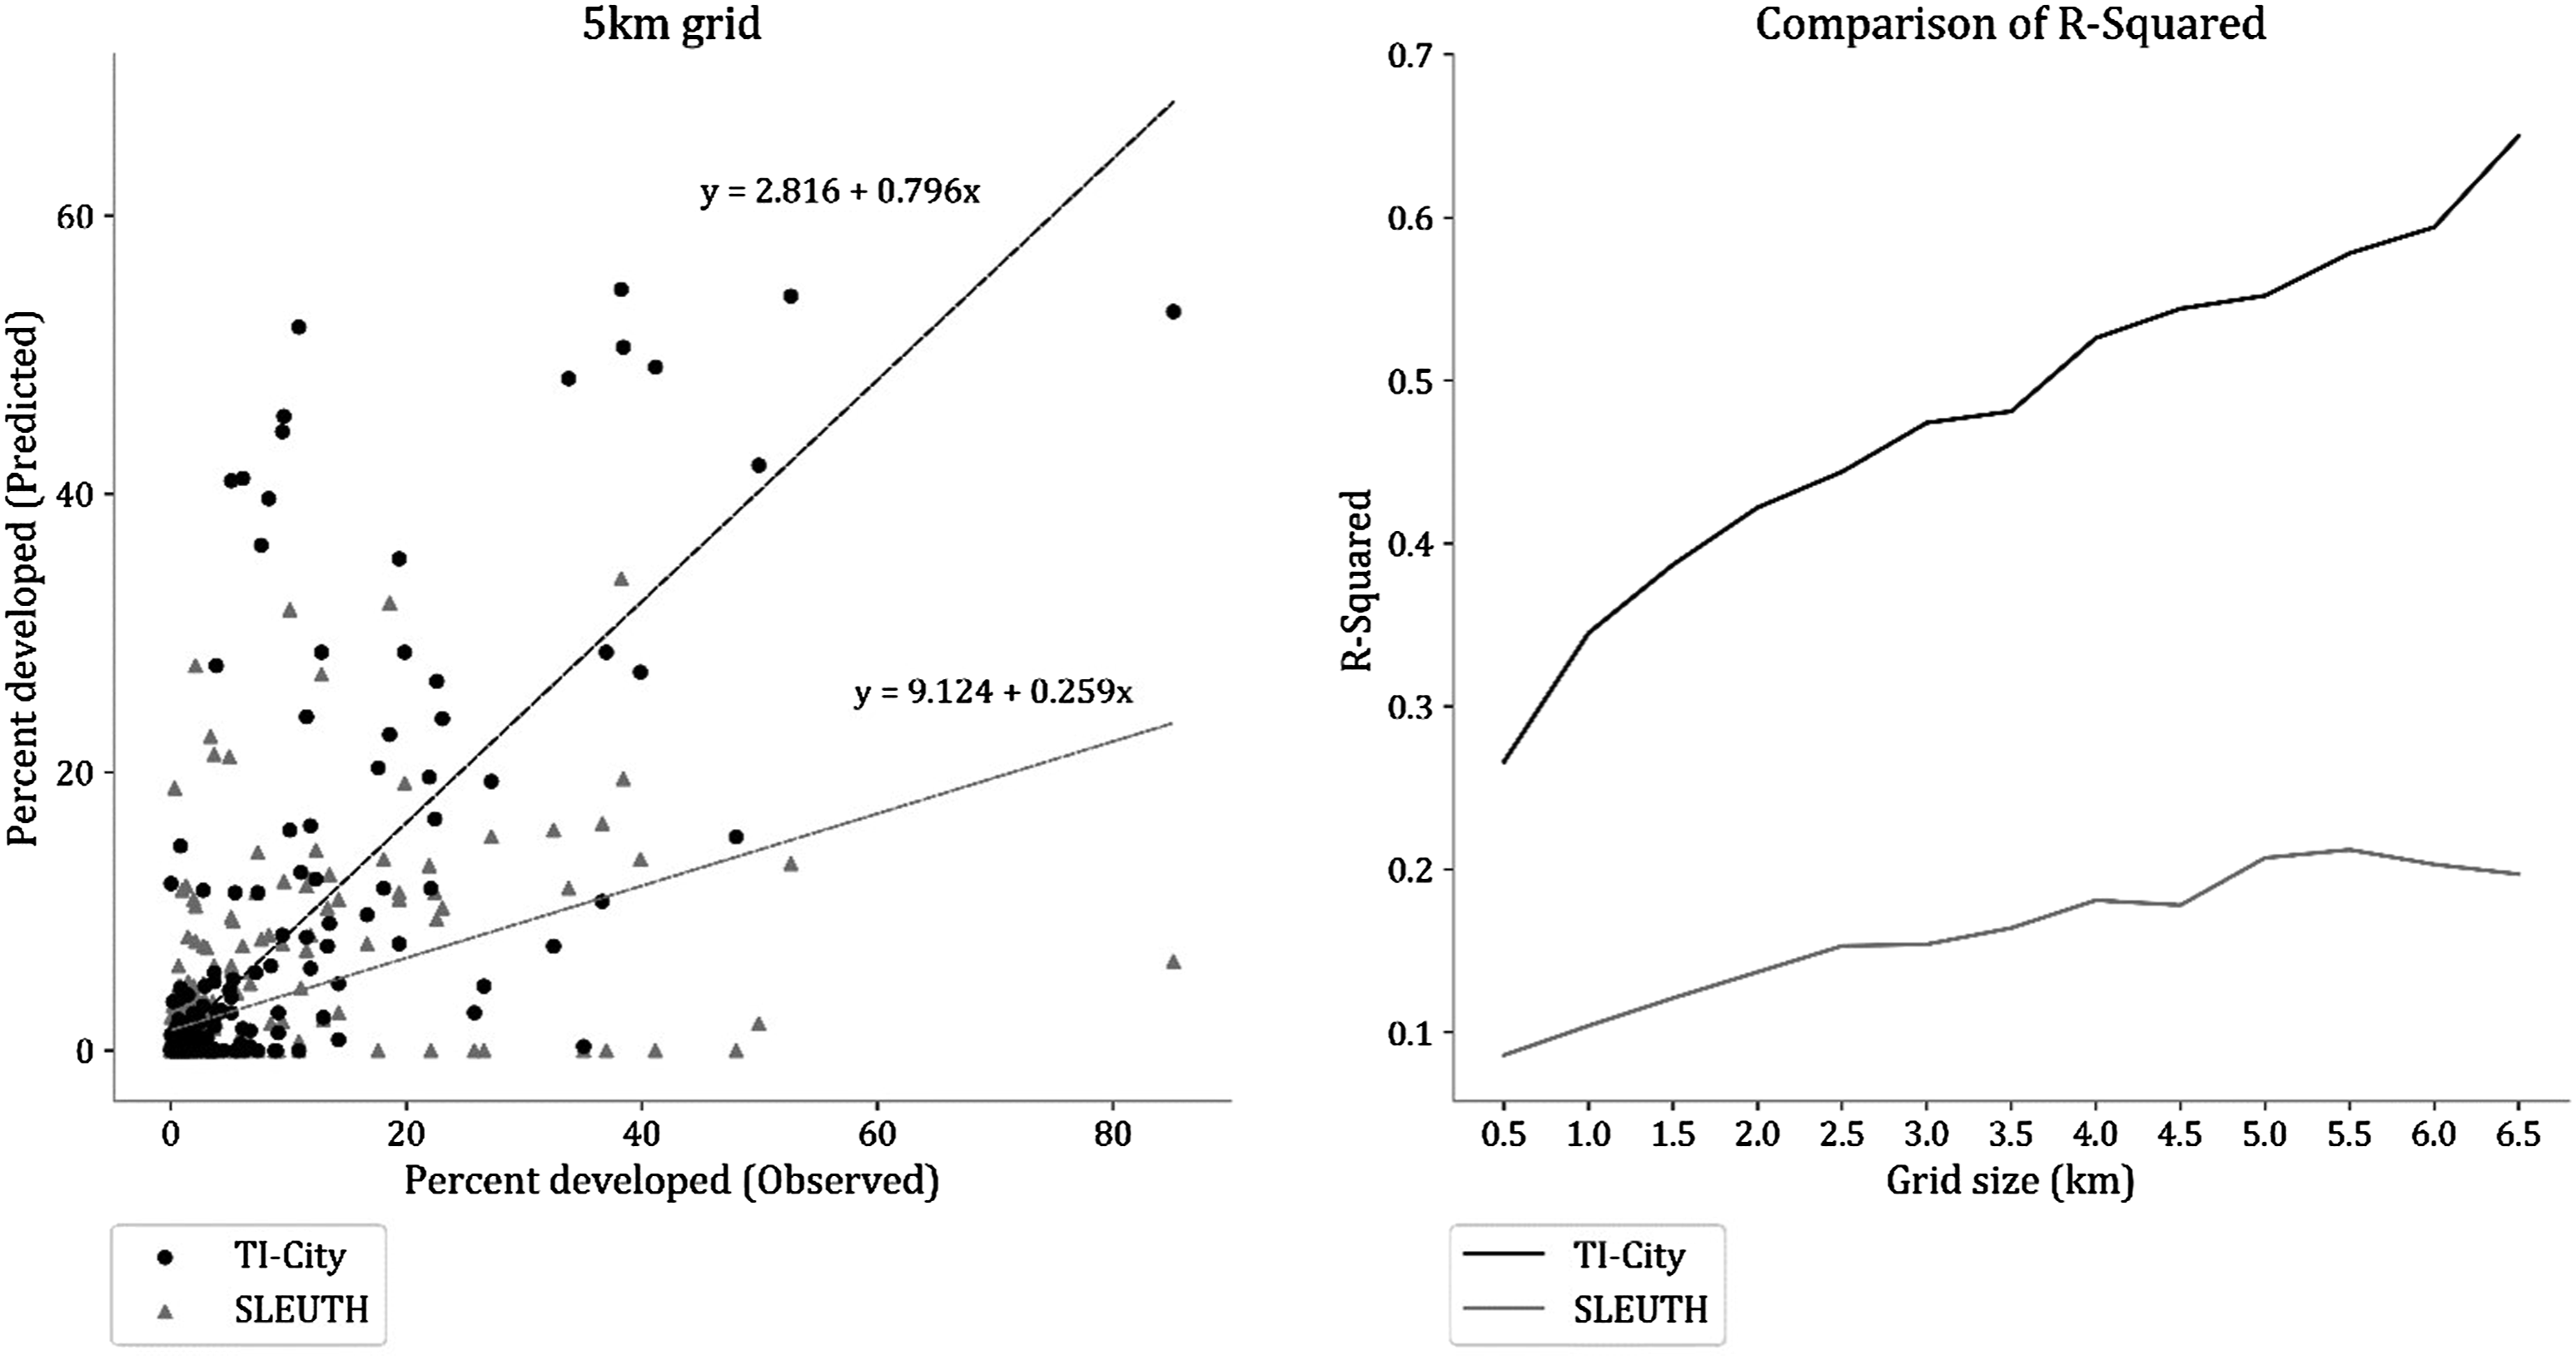
Figure 5 juxtaposes the predictions from TI-City and SLEUTH, which shows both models perform well in predicting inner city developments. However, when it comes to suburban expansion, TI-City appears to perform significantly better than SLEUTH. Two reasons potentially account for this difference in the performances of the models. First, TI-City’s dynamic treatment of utility illustrated in Dynamic Treatment of Utility section provides room for the phenomenon whereby households with similar characteristics cluster in suburban areas that serve their interests. Second, unlike SLEUTH, TI-City accounts for how proximity to suburban centres influences the location decisions of developer agents. It can also be observed that while TI-City correctly predicted most of the suburban developments that occurred over the period, it also overpredicted in some areas, especially the Western and North-eastern suburban clusters. A further inspection of high-resolution historical Google Earth images shows that the overpredicted areas were indeed not developed as of 2010. However, these areas were subsequently developed between 2012 and 2015, suggesting the predictions were only off by two to five years. Predictions by TI-City and SLEUTH, 2000–2010.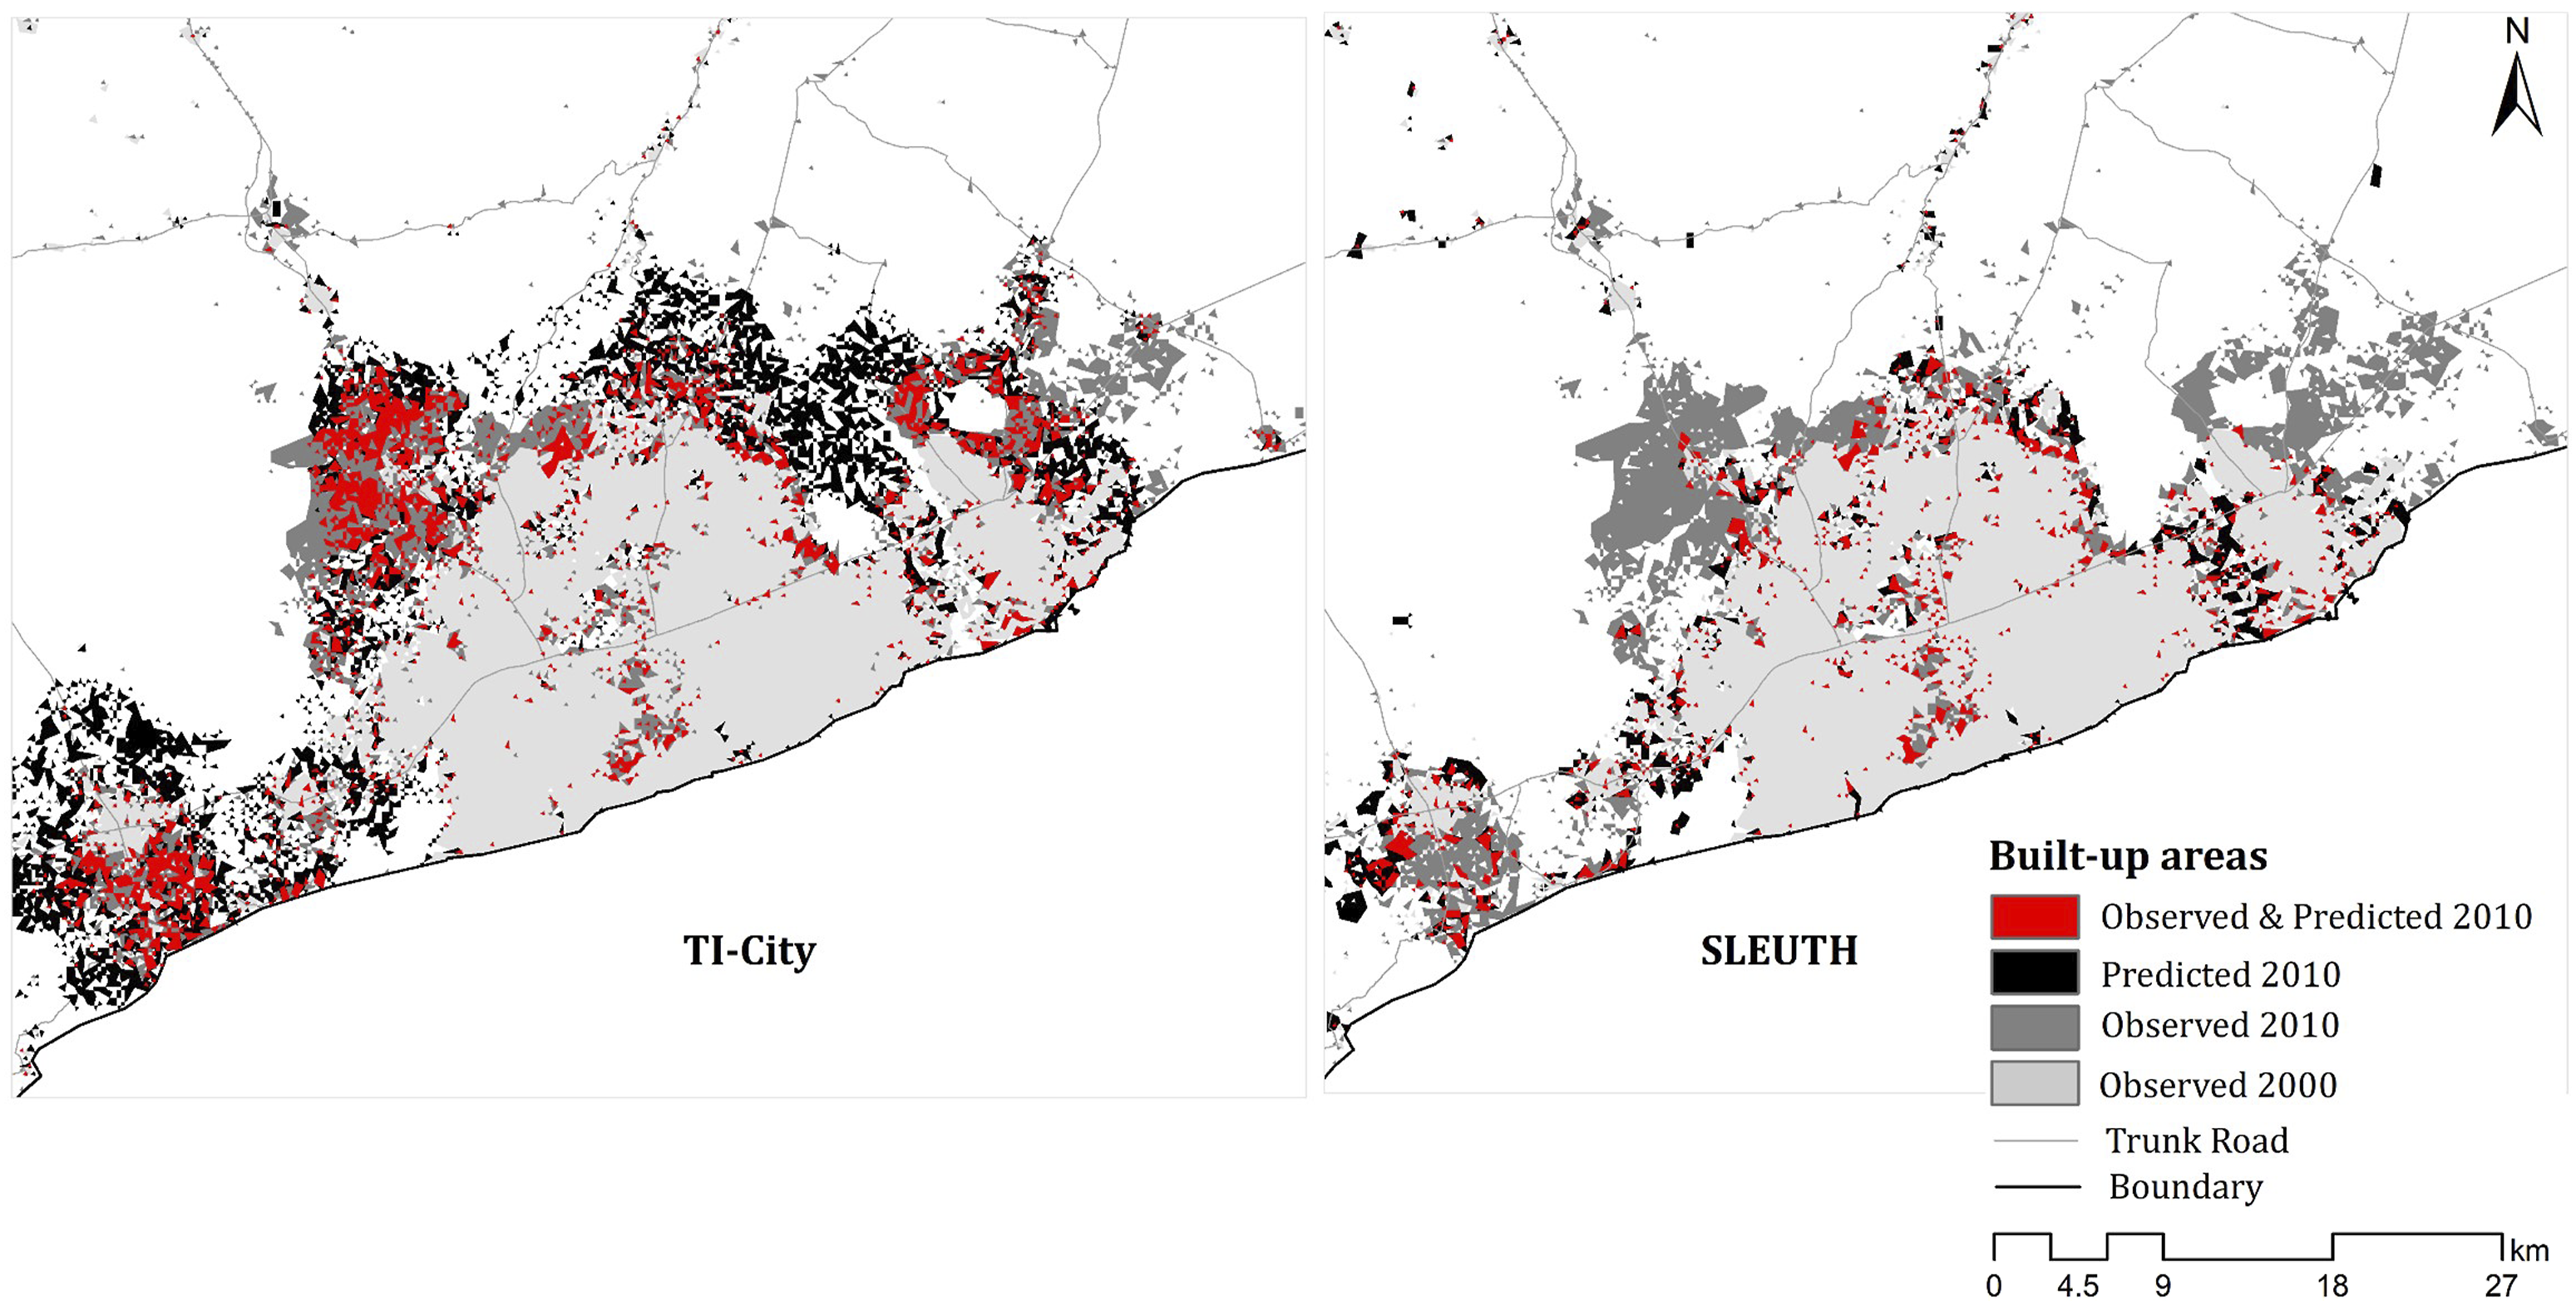
Sensitivity of development control parameter
Figure 6 shows the performance of TI-City under three development control scenarios: one, strong enforcement set a with a parameter value of 90; two, average enforcement with a value of 50; and three, weak enforcement based on a value of 10. The predictions from these scenarios are also mapped in Figure S5 in the supplementary material. Strong development control yields the weakest results, explaining only between 14 and 42 percent of development observed in 2010. This is consistent with existing literature as well as facts on the ground: the majority of urban development in SSA cities takes place without a planning permit (see Burra, 2004; Lall et al., 2021; United Nations Human Settlements Programme (UN-HABITAT), 2011). At 0.5 and 6.5 km resolutions, a weak enforcement value returns the best performance, with R-squared = 0.27 and 0.65, respectively. However, in between those resolutions, an average enforcement produces the best performance, suggesting that the best fit development control value likely lies between 10 (weak) and 50 (average). These results show that urban models developed in Western contexts, where development control is strong, are not particularly well-suited to developing cities which are highly informal. The model’s strong performance suggests that simulating the behaviour of the agents responsible for urban development, as well as the context of informal urbanisation that influences these behaviours, can significantly improve our predictive capacity. A summary of the unvalidated predictions concerning the income and legal status of settlements in 2010 as well as model predictions up to 2030 can be found in the online supplementary material. Sensitivity of development control parameter.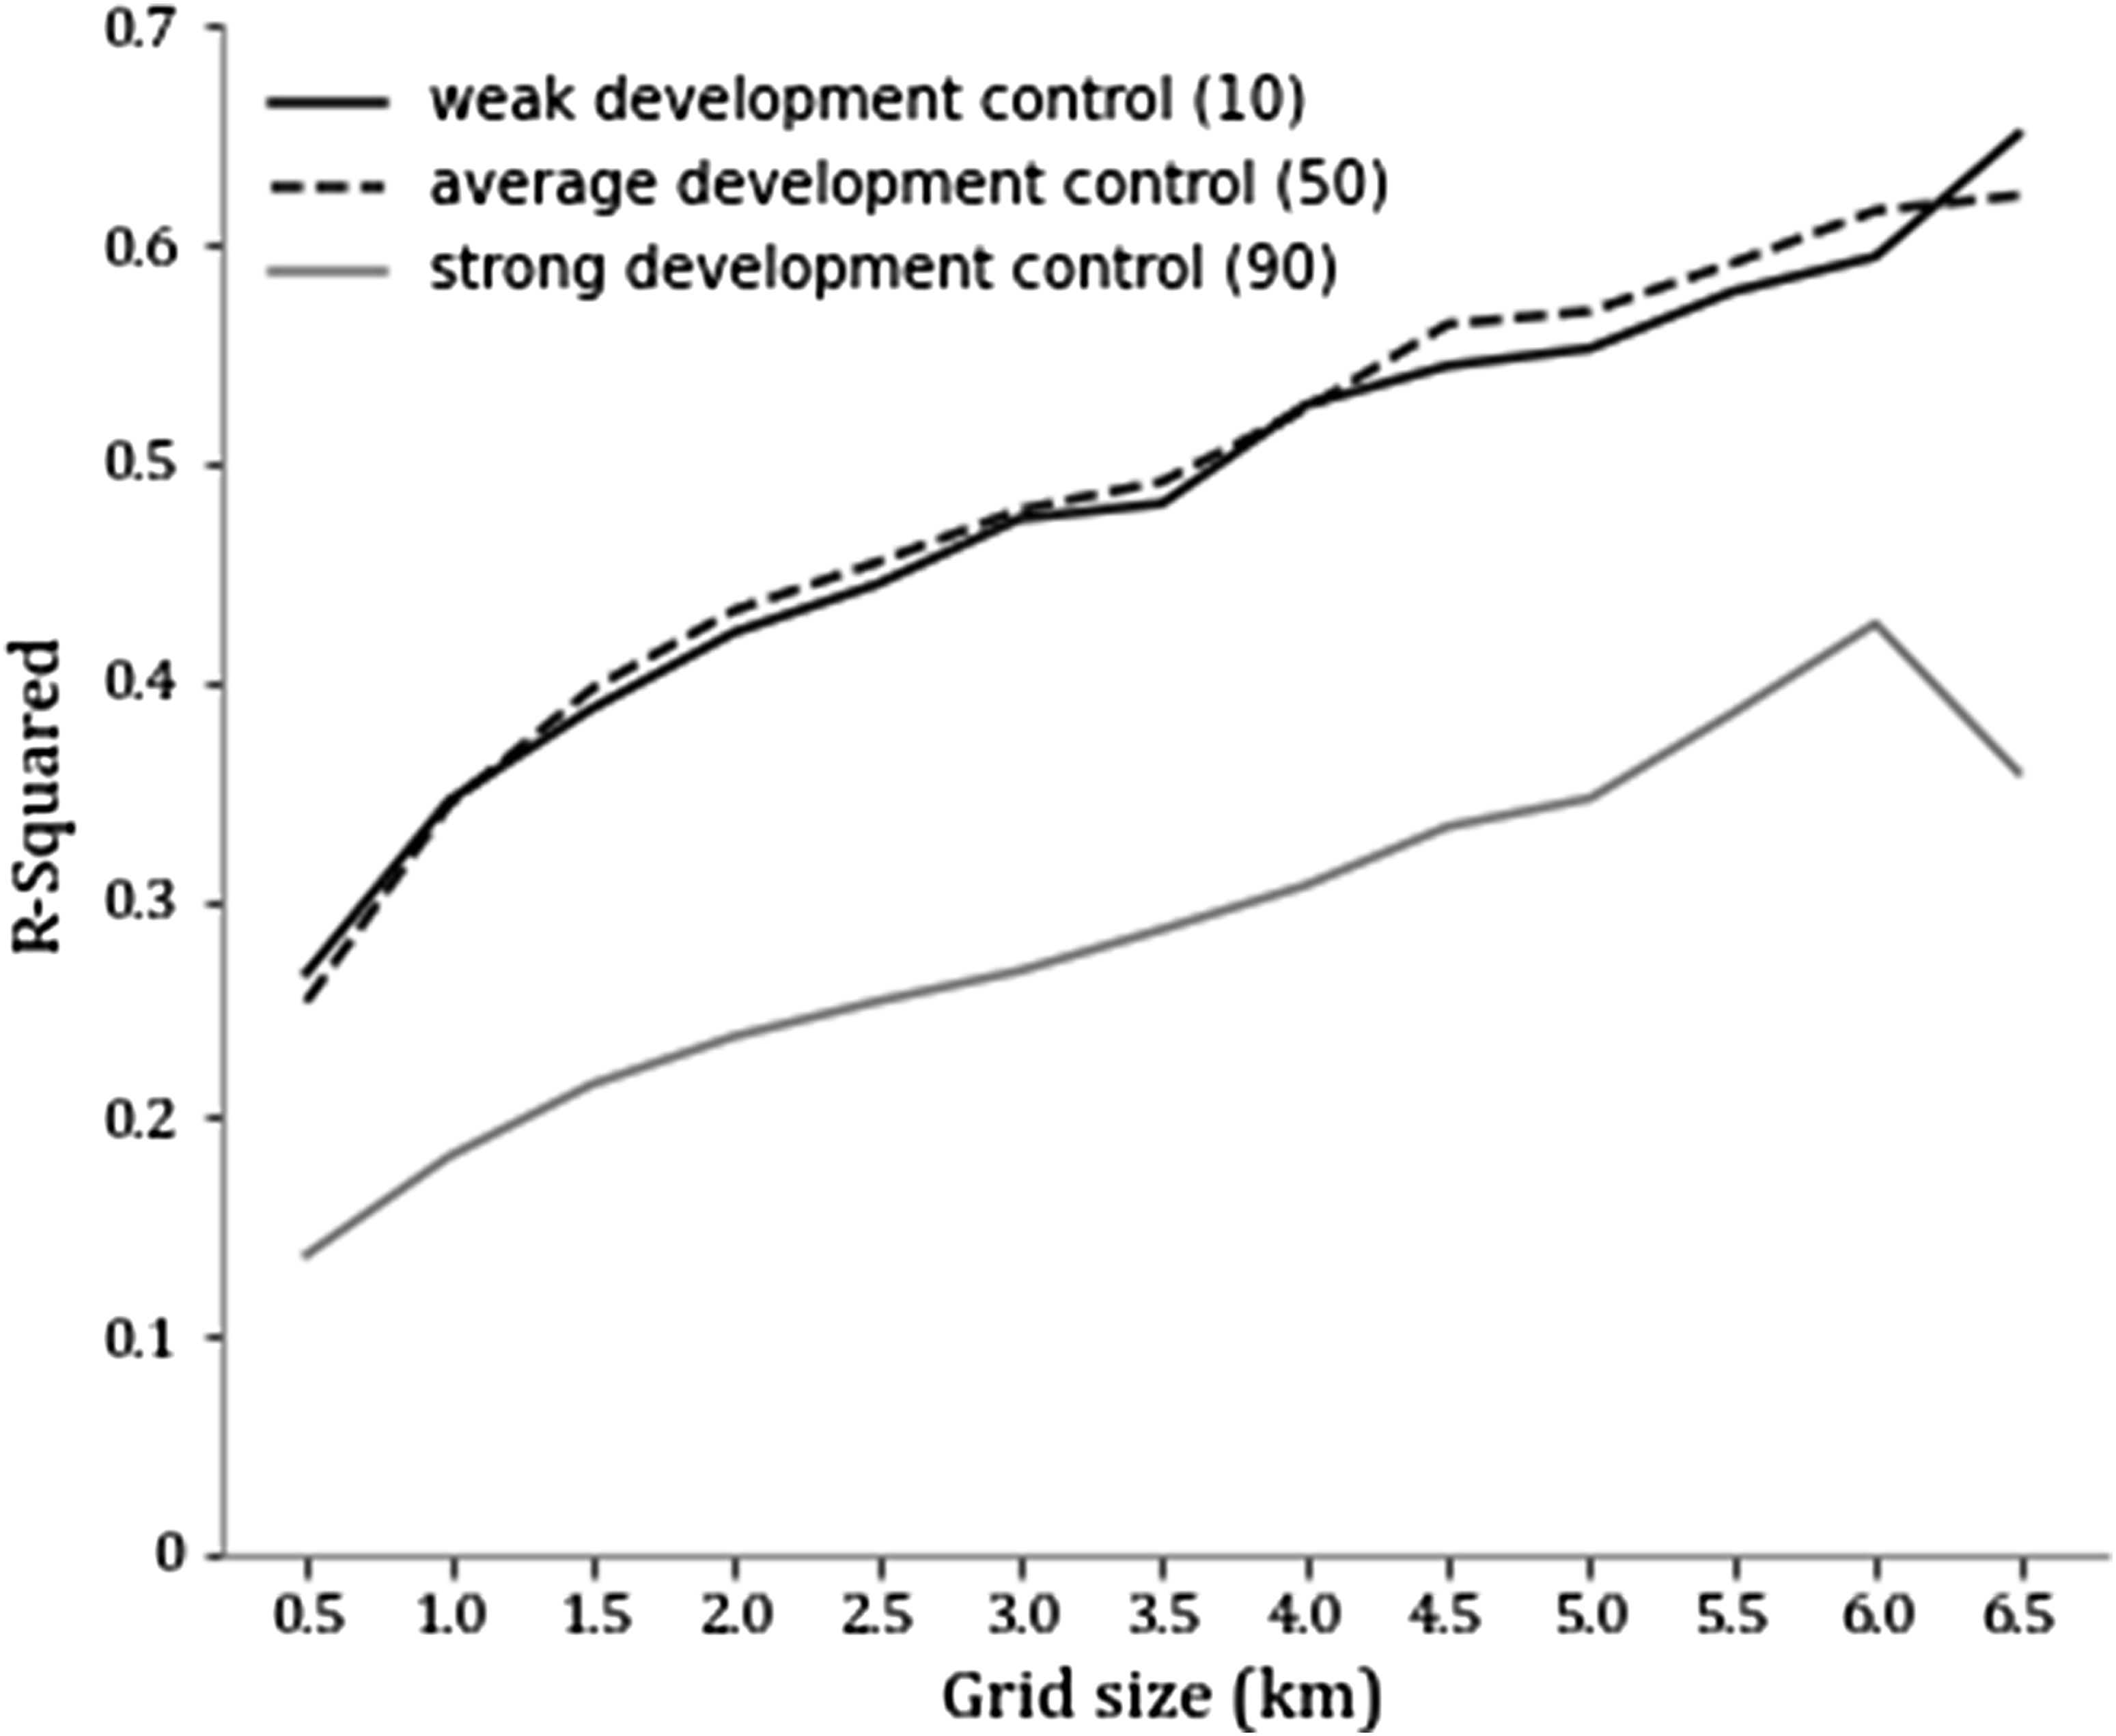
Model Limitations
While TI-City generates considerably more accurate predictions than SLEUTH, it does not model some urban growth phenomenon, including residential relocation and densification. The latter refers to vertical developments that occur through extension of the height of an existing building. In such instances, the built-up area is not necessarily expanded. These two were not modelled as we do not have sufficient information from the context about how they occur. However, in places where teardown and redevelopment rates can be calculated, this could be incorporated into future modelling (see Henderson et al., 2021). Similarly, due to inadequate data, TI-City does not account for the consumption of multiple parcels by some households in the city-region.
Again, while we recognize that demographic factors such as age, household size, presence of children, ethnicity and religion potentially affect the location choices of households, we do not have adequate information to model them. Also, we do not model instances whereby informal developments occur on formal lands due to political patronage or corruption. Lastly, while the location predictions of the model have been subjected to robust validation at multiple scales, the same has not be done for the income and legal status predictions due to a lack of geolocated data on the incomes and legal statuses of households in the city-region.
Finally, the slope coefficient used in the model is derived from the calibration of SLEUTH, which has been shown to underperform in the city-region. This coupled with the tendency for informal cities to exhibit greater tolerance for slopes means the slope coefficient and critical slope value could be higher. An approach that connects the extent of development control to slope tolerance could be explored in future research.
Conclusion
Existing urban growth models, such as SLEUTH, are not well-suited to the informal urbanization dynamics in Sub-Saharan Africa. Building on the strengths of CA and ABM, as well as a nuanced understanding of informal urbanization dynamics, we have developed TI-City – an urban growth model designed to predict the location, income, and legal status of residential development in an African city. We applied the model to Accra, Ghana using local data for parameterization and compared the results of historical growth predictions with outputs from SLEUTH, a popular urban growth model which has been applied to many informal cities.
The results from a multi-scale validation process show that TI-City outperforms SLEUTH by a considerable margin, both in predicting the scale and geographic patterns of urban growth in the city. This suggests that an approach which directly models the behaviour of actors responsible for urban development in such a context can significantly improve the predictive power of urban growth models. TI-City’s prediction for Accra up to 2030 indicates the majority of new all developments will be informal. Income inequality expressed in tenure security is observed in the predicted patterns as low-income households become increasingly insecure while high-income households increasingly occupy secure lands. The results underscore TI-City’s potential role as a decision support tool, especially in similar contexts. More research, however, is needed to explore the transferability of the model and its underlying approach to other contexts.
Supplemental Material
sj-pdf-1-epb-10.1177_23998083211068843 – Supplemental Material for Modelling and simulating ‘informal urbanization’: An integrated agent-based and cellular automata model of urban residential growth in Ghana.
Supplemental Material, sj-pdf-1-epb-10.1177_23998083211068843 for Modelling and simulating ‘informal urbanization’: An integrated agent-based and cellular automata model of urban residential growth in Ghana by Felix SK Agyemang, Elisabete Silva and Sean Fox in Environment and Planning B: Urban Analytics and City Science.
Footnotes
Declaration of conflicting interests
The author(s) declared no potential conflicts of interest with respect to the research, authorship, and/or publication of this article.
Funding
The author(s) disclosed receipt of the following financial support for the research, authorship, and/or publication of this article: This research was supported by the UK Economic and Social Research Council (ES/R009848/1).
Supplemental Material
Supplemental material for this article is available online.
References
Supplementary Material
Please find the following supplemental material available below.
For Open Access articles published under a Creative Commons License, all supplemental material carries the same license as the article it is associated with.
For non-Open Access articles published, all supplemental material carries a non-exclusive license, and permission requests for re-use of supplemental material or any part of supplemental material shall be sent directly to the copyright owner as specified in the copyright notice associated with the article.