
Abstract
Why do some neighborhoods thrive, and others do not? While the importance of the local amenity mix has been established as a key determinant of local livability, its link to urban transport infrastructure remains understudied, partially due to a lack of data. Using spatiotemporal social media data from Foursquare, we analyze the impact of metro stations which opened between 2014 and 2017 on the amenity mix of surrounding neighborhoods in nine European cities: Rome, Milan, Barcelona, Budapest, Warsaw, Sofia, Vienna, Helsinki, and Stuttgart. Thereby, we study three properties of the local amenity mix: its density, multifunctionality, and the heterogeneity between amenity types. For this purpose, we propose a new measurement of multifunctionality, which calculates the entropy of the locally present amenity set incorporating the degree of similarity between amenity types. For causal inference, we use Difference-in-Difference Regression based on Propensity Score Matching and Entropy Balancing. Our findings show that in most cities, subway expansion had a significant positive impact on the local amenity density and multifunctionality and that especially the social amenities—Arts & Entertainment, Restaurants and Nightlife—responded strongly. Moreover, considerable agglomeration forces seem to prevail, causing existing subcenters to benefit most from new metro stations.
Keywords
“When distance and convenience set in; the small, the various and the personal wither away.” (Jane Jacobs, 1961)
Introduction
Only recently consumer amenities and the cultural life they nurture have been recognized as a crucial mechanism of urban growth and human capital attraction, extending the traditional focus on the availability of jobs as the determinant of the success of cities (Clark, 2004; Florida, 2002). On the neighborhood level, the amenity mix of a neighborhood is considered a core component of its livability already since Jane Jacobs’ (1961) observation that “only diverse surroundings have the practical power of inducing a natural, continuing flow of life and use” (p. 101). It is the mixture of work, cultural, residential, and commercial activity that produces vibrant environments with safety guaranteed through “Eyes on the Streets.” Since then, studies showed that the colocation of different public and private amenities in residential areas reduces the amount of crime in a neighborhood (Humphrey et al., 2020), incentivizes walking (Forsyth et al., 2008), decreases overall energy use (Zegras, 2005) and generates Marshallian agglomeration benefits for consumer amenities such as labor sharing, value chain linkages and knowledge spillovers (Duranton and Puga, 2004).
Transit-Oriented Development (TOD) projects combine this prioritization of walkable, mixed-use design with an effort to reverse the accelerating trend of motorized transport polluting and congesting our cities (Littman, 2017; UN, 2016). They aim at concentrating residential, work, and commercial spaces around a decentralized network of mass transit stations. Thereby, TOD projects tackle the spatial mismatch between job opportunities and potential workers, between quality-of-life amenities and people that demand them (Gobillon et al., 2007). To adjust to growing cities and improve public transit coverage, a core TOD policy is public transport expansion. A new transit station can have a substantial impact on neighborhoods. However, can it help developing the other element of TOD—mixed land use—by attracting jobs and consumer amenities? In other words, do transit stations and amenity centrality go hand in hand? There are a considerable number of studies showing how transport expansion impacts population growth, housing markets and job distributions as well as a large branch of literature studying the location decisions of different industry types. However, the relationship between urban transport infrastructure and neighborhood consumer amenity developments has been only sparsely addressed.
Spatial proximity or spatial accessibility has long been established as a key determinant of both human and physical interaction (Tobler, 1970). Taking away barriers to mobility should increase the number of people willing to travel the respective route and consequently, increase the number of consumer amenities that move to the origin or destination mostly due to increased market size. One of the fastest and therefore most popular modes of intracity public transport across distance is subway transit, which connects places in a sparse network structure. While cities are growing the fastest in Africa and Asia, European cities are interesting cases to study because they have a historically strong public transport culture, demonstrated by the continent having the oldest metro systems and the most subway stations per 100.000 residents on Earth (Gonzalez-Navarro and Turner, 2018). There has not been a large expansion project in any European big city during the last decade. However, together the small expansion projects happening mostly on the fringes of Europe’s diverse cities are ideal cases for testing the relation between subway expansion—as part of TOD—and the local amenity mix in a cross-comparative study.
In this article, we analyze the impact of metro stations that opened between 2014 and 2017 on the amenity mix of surrounding neighborhoods in nine European cities. Rome, Milan, Barcelona, Budapest, Warsaw, Sofia, Vienna, Helsinki, and Stuttgart opened together 84 new metro stations. To measure the amenity mix, we exploit user-generated, location-based social media data. The place-based social media platform Foursquare offers high resolution, georeferenced data on consumer amenity openings differentiating by amenity type (Foursquare, 2020). This allows us to assess the mixture of amenities in a neighborhood along three dimensions: density, multifunctionality, and specialization on specific amenity types. To this end, we propose a new measurement of multifunctionality, which calculates the entropy of the amenity set incorporating the degree of similarity between amenity types. To examine the heterogeneity between amenity types, Foursquare’s venue meta-categories, Shops & Consumer Services, Gastronomy, Nightlife, Arts & Entertainment, Professional Services, and Recreation are used. To test our hypotheses, we use Difference-in-Difference Regression based on Propensity Score Matching and Entropy Balancing.
We find that in most cities new subway stations positively impact the local amenity mix in terms of both, density and multifunctionality. Moreover, social amenities—such as Arts & Entertainment, Food venues, and Nightlife—respond most strongly, which could indicate both a flourishing of local economic life or a gentrification process. Furthermore, previous amenity subcenters benefit most of new metro stations due to the predominance of strong agglomeration forces that appear to affect consumer amenities. In the next chapter, we discuss related theories and derive three hypotheses to be tested. We then describe the operationalization of the research questions in terms of data and methods. Afterward, the results are discussed, followed by some concluding remarks.
Literature review and hypotheses
Consumer amenities as a development machine?
The relevance of consumer amenities for economic development has been vigorously discussed in the last decades. One core thinker who sparked the debate in 2002 was Richard Florida, who started arguing that our economies are increasingly driven by creativity, which gave rise to a new social group: The Creative Class, consisting of entrepreneurs, technologists, artists, and innovators, who make our economies flourish. These “talents,” Florida believed, would be attracted by urban amenities, such as tolerance but also consumer amenities, particularly informal, almost bohemian types of amenities like Nightlife or Restaurants. Clark et al. joined the argument stating that “the city increasingly becomes an Entertainment Machine, leveraging culture to enhance its economic well-being” (2004: 292). Instead of a traditional focus on production, consumption to fulfill quality-of-life demands had become the central economic process of post-industrial cities. While Social and Entertainment amenities are the focal point of the Creative Class thesis, it is also the mere density and diversity of amenities of cities that is attractive. According to Glaeser (2012), the prism of lifestyles and interests they represent enables us to foster the kinds of collaborations that make cities the places of creativity and innovation
Due to the popularity of the Creative Class thesis, policies have been adapted to focus on attracting the creative workers with lifestyle and consumption opportunities. However, while some studies find that amenities are successful in attracting human capital (Wenting et al., 2011), not in all cases this led to job creation, especially not in peripheral places (Argent et al., 2013). What is more, the people-centered policies have been criticized for contributing to regional economic polarization, making central places even more central (Storper, 2018). Also within cities, the focus on attracting high-skill labor has tilted many neighborhoods toward the interests of the affluent, which gave rise to the phenomenon of gentrification and consequent displacement (Smith, 1996).
While these problems are real, their prevalence differs depending on the types of amenities (local or chain store) and the process of amenity creation (through bottom-up emergence or top-down planning). Consumer amenities do not only influence the economic geography through the human capital it attracts, but also through local value chains. Large shares of revenues of especially small, locally owned stores “reverberate back into the local economy via subcontracting from local providers, payments to local employees, and improvements made in the public infrastructure around stores, as well as through indirect investments into employee health and retirement benefits” (Sevtsuk, 2020: 4). Consumer amenities also benefit a neighborhood in many non-economic ways by increasing its livability (Jacobs, 1961) through, for example, a reduction of crime (Humphrey et al., 2020), improved walkability (Forsyth et al., 2008), or promoting the formation of social ties (Small and Adler, 2019). Hereby, small, local stores and restaurants again have a much more positive impact compared to large chains. Based on observational data from social media, this study tests whether subway expansion can trigger such an emergence of small, social, informal amenities, perhaps even in the rather struggling outskirt areas.
Transport systems and location theory
The impact of transport regimes on urban form and spatial dynamics could be studied in the past decades based on more data and better methods. Innumerable studies have investigated the impact of transport infrastructure on the built environment, population density and employment. The underlying rationale is that changes in transportation costs or accessibility shift incentives to move for both people and economic activities. In their comprehensive meta-study, Kasraian et al. (2016) showed that proximity to rail investments seems to induce population growth in surrounding areas. However, the few studies that investigate the impact of rail expansion on employment growth show contradictory results (Cervero and Landis, 1997; McMillen and Lester, 2003), revealing the need for a cross-comparative study of the consequences of transport systems for economic activities. However, it is important to keep in mind that the reversed causality might also apply. There is soft evidence for a possible selection bias of subway stations being placed in already amenity-rich areas (Schuetz, 2015).
For understanding what impacts amenity formations, Netz and Taylor’s (2002) application of location theory to retail stores becomes relevant. Their study concludes that consumer service providers must deal with offsetting incentives with regard to agglomeration and dispersion. Consumer services can take advantage of the market size effect of agglomeration and meanwhile avoid the price competition associated with the market share effect by sufficiently differentiating the quality of their services. Their theory hints at the possible correlation between density and diversity of amenities in space. Moreover, it shows that consumer amenities are driven mainly by consumer patronage.
To analyze how customers spatially choose shops they visit, a series of gravitation models have been developed (Huff and Jenks, 1968; Reilly, 1931). Studying the breaking points of retail influence, Reilly (1931) found that more populous cities attract more outside retail trade than smaller ones, and cities attract more trade from close by than from further away. The lineage of studies building upon his Law of Retail Gravitation found “that customers do not necessarily shop at the closest store, but patronize locations in proportion to the attractiveness of the retail centers and in inverse proportion to their distance” (Joseph and Kuby, 2011: p. 423). Sevtsuk and Kalvo (2017) prove that these models are still quite accurate in predicting retail patronage. Combined these theories give rise to Hypothesis 1:
Hypothesis 1: New subway stations increase the density of consumer amenities in surrounding neighborhoods, whereby areas that had many amenities before the station opened react stronger. Based on the literature on travel and consumption, we propose to extend the concept of area attractiveness to incorporate multifunctionality. In his trip-chaining model of consumer shopping, Anas (2007) claims that “travel is intimately related to both consumption and the allocation of time among discretionary activities” (p. 163), whereby urbanites tend to choose their destinations among alternative substitutes by chaining stops so that it suits their income, time constraints and consumption demand. If people can take care of many things at the same place through diverse amenities, it provides them with an efficient and stimulating way of shopping. Taking moreover into account that the market share effect forces amenities to diversify (Netz and Taylor, 2002), the second hypothesis becomes:
Hypothesis 2: New subway stations increase the multifunctionality of the amenity mix in surrounding neighborhoods. The consumption processes will be further analyzed in the next section to better understand amenity heterogeneity.
Amenity heterogeneity
Consumer amenities show crucial differences in the social groups that tend to visit them. For example, Nightlife venues are mostly visited by young adults, while Art Museums are mostly attended by educated people and tourists. This is relevant because some social groups tend to use subway transport more than others and may thus stimulate the local market, as studies finding higher pedestrian activity and staying time in metro station catchment areas compared to other urban areas suggest (Kim et al., 2017). Therefore, it is important to understand who travels with the subway.
A large body of literature on modal choice analysis aims at identifying the conditions under which specific groups of people choose their mode(s) of transport, whereby convenience, time and financial costs are the major factors (Buehler, 2011). Since car ownership is expensive but allows for fast and flexible traveling, high-income households tend to travel more by car instead of the subway than less affluent ones. Moreover, personal “environmental preferences increase the likelihood of choosing an environmentally friendly mode” (Johansson et al., 2006: p. 517). Considering the interest of young people in Nightlife and their higher likelihood to use public transport because of budgetary and environmental reasons, one might expect Nightlife venues to pop up near new subway stations.
Amenities in subway neighborhoods are not only attracted by people that use the subway system but also by people that move close by. A substantial amount of literature has shown how urban rail transit investment capitalizes in neighboring home values (Debrezion et al., 2007). Zheng et al. (2016) proved that in Beijing an increase in the amount and diversity of restaurants close to new metro stations can partially explain the increase in home values. The increase in housing prices due to rising neighborhood attractiveness may induce a displacement of less affluent and an inflow of more affluent households that can afford and demand more and specific types of consumer amenities. We assume that Arts & Entertainment venues may indicate an underlying process of gentrification.
Consumer amenities differ also in their market entry barriers which affect how quick and strong they react to subway stations. The two most important factors are the dominance of economies of scale, which makes it difficult for small firms to enter the market, and set-up costs with their attached financial risks (Porter, 1980). Restaurants tend to require lower set-up costs compared to, for example, Medical Offices (a professional venue) or a Spa (a recreation venue). Moreover, the former are usually quite decentralized and do not depend heavily on economies of scale. This should make them much more likely to respond quickly and numerously to location opportunities. The third hypothesis becomes:
Hypothesis 3: There is a heterogenous reaction to subway connection of different amenity types, whereby Nightlife, Arts & Entertainment and Restaurant venues are expected to react stronger than other types. The discussed literature is summarized in the following conceptual model (see Figure 1), which will help interpret the results.
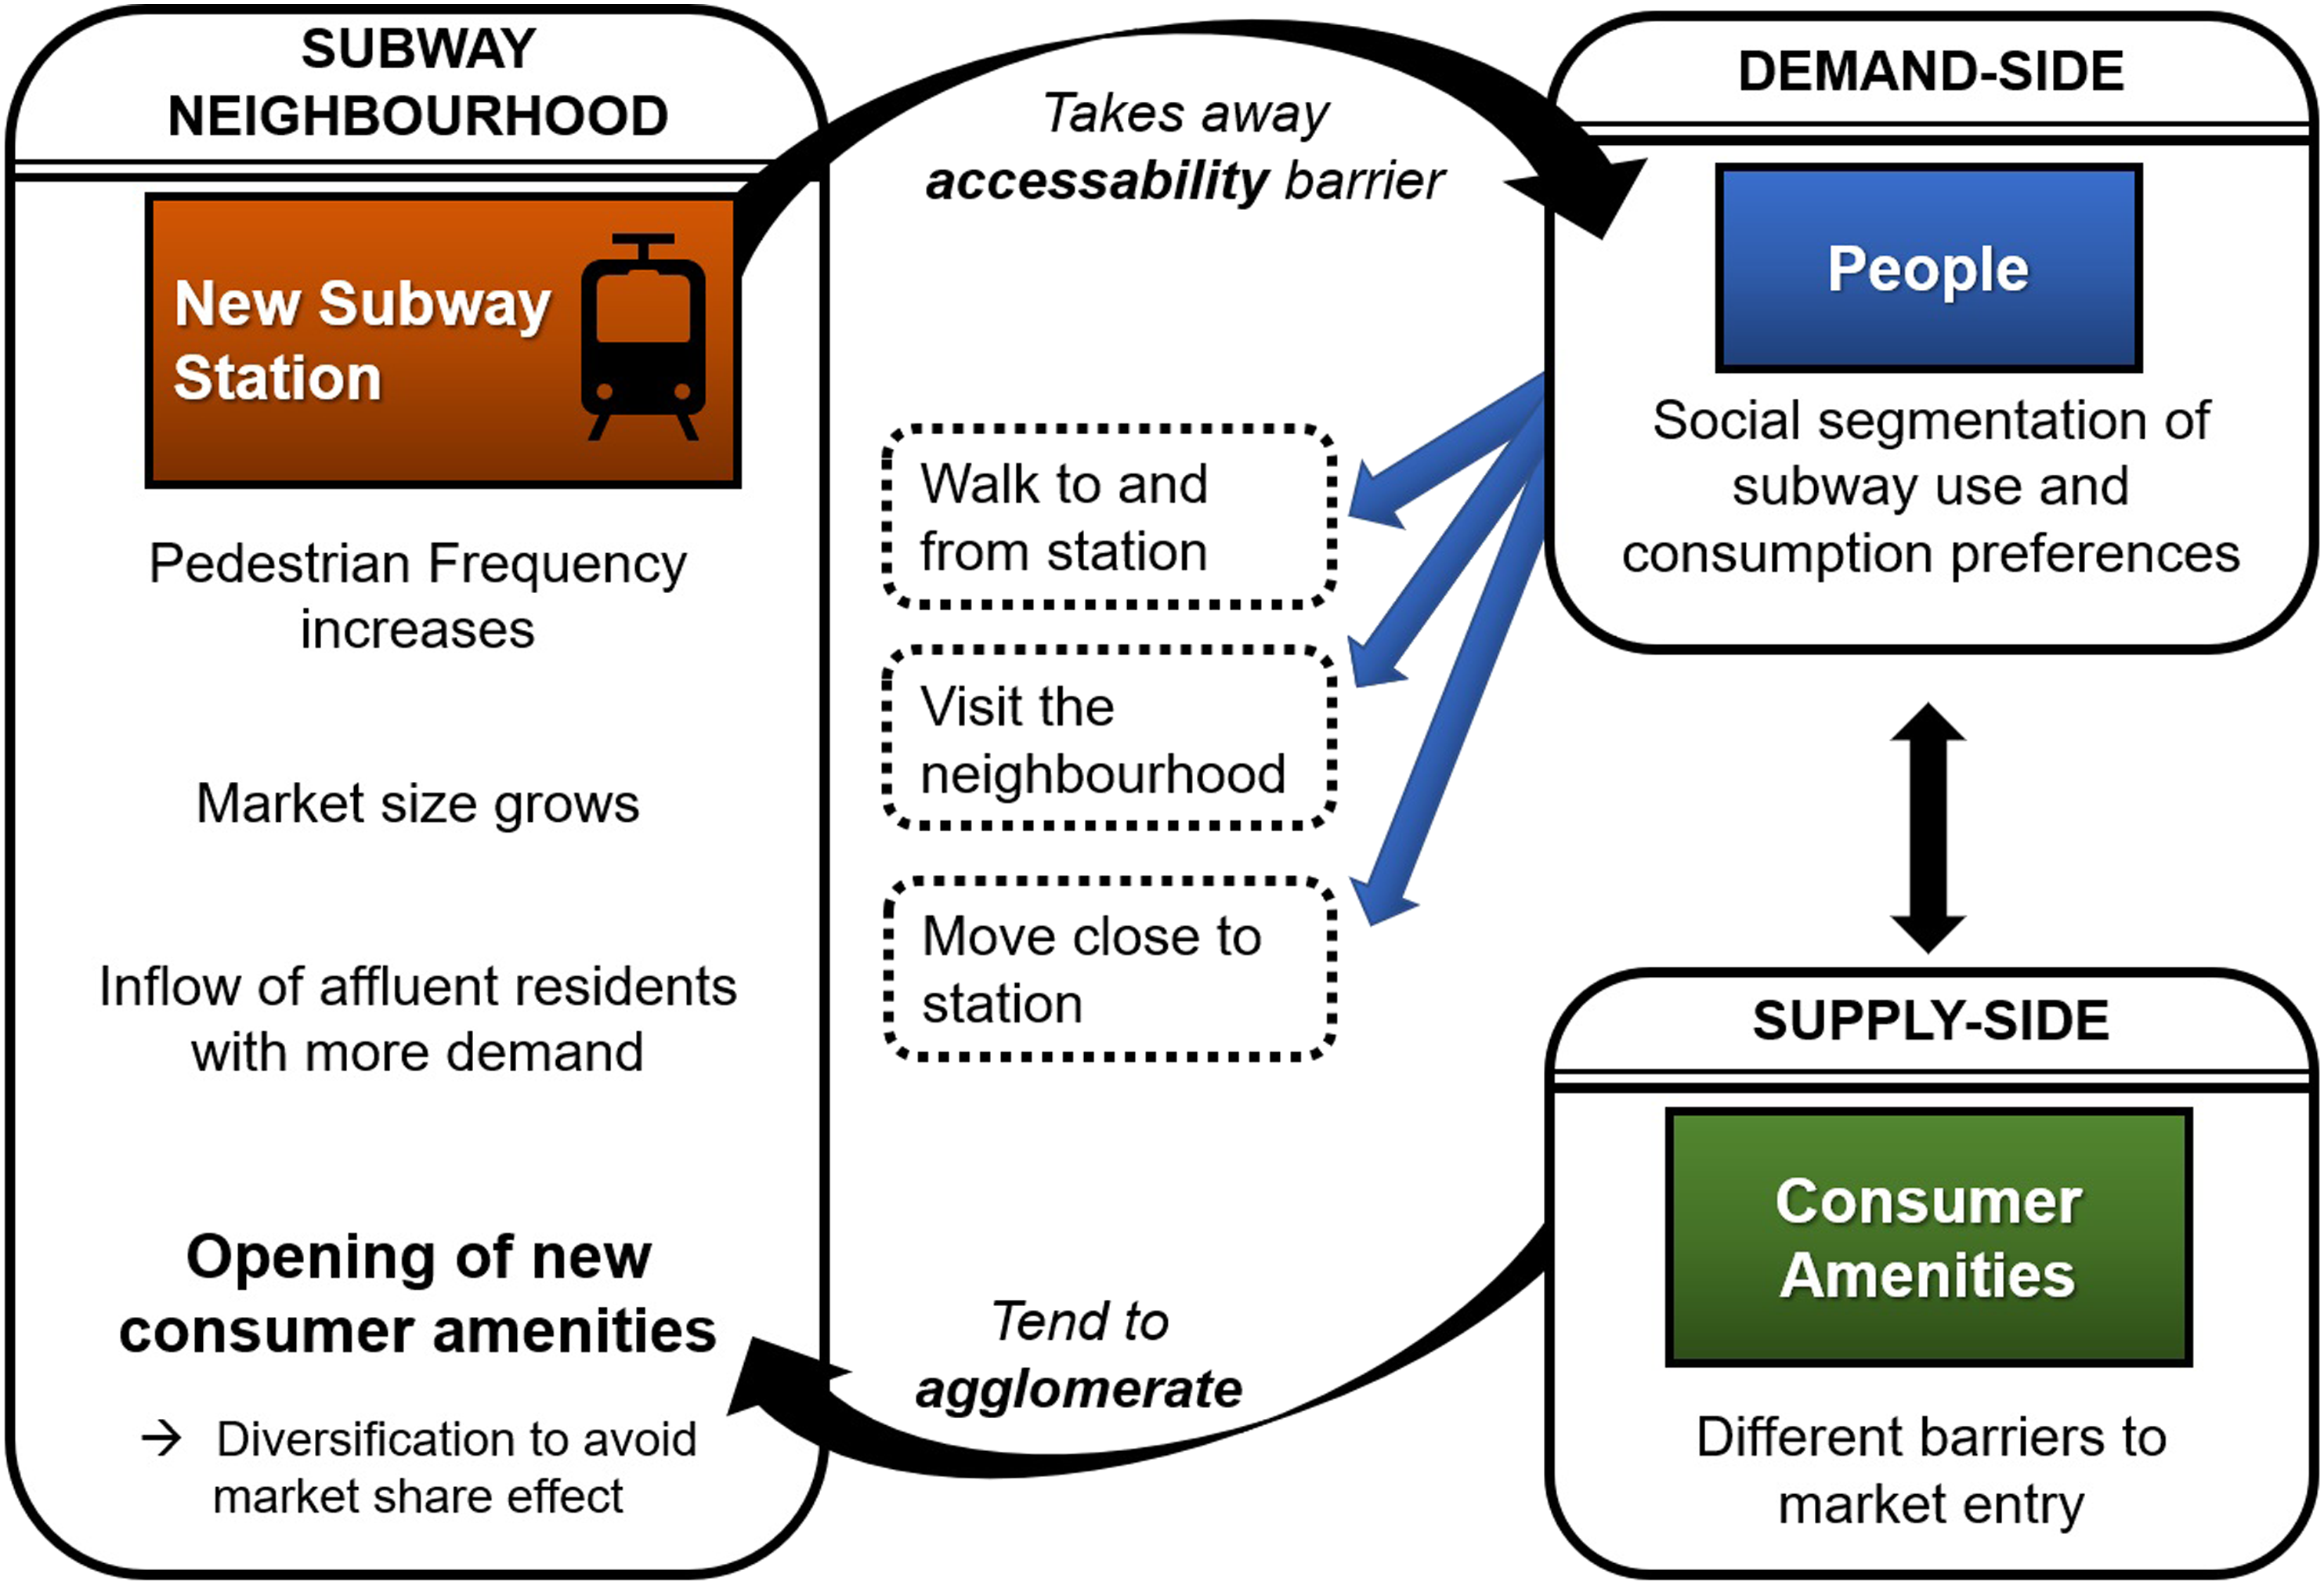
Conceptual framework: metro expansion and consumer amenities.
Methodology
Case selection and spatial units
To be able to assess the treatment effect of new stations with a temporal lag and a possible selection bias, data on 1 year before and 2 years after the new metro station opening is required. Since Foursquare has reliable data since 2012 (Foursquare, 2020), the eligible cases are metro openings between 2014 and 2017. The selection is further limited to cities with more than 500.000 inhabitants as they rely more on metro transit (Gonzalez-Navarro and Turner, 2018). This leads us to select Rome, Milan, Barcelona, Budapest, Warsaw, Sofia, Vienna, Helsinki, and Stuttgart, which together opened 84 new metro stations during that period, as the best European cases for our study (see Supplementary Table 1 for population and subway expansion data on these cities). It should be noted that most new stations are located in outskirt areas.
To define the cities’ urban boundaries, Nightlight satellite imagery was used (see the section Definition of Urban Areas of the Supplementary Material). The spatial units of analysis are based on a regular point grid randomly generated over the urban area, where points are 100 m distant from each other and their properties are defined by a neighborhood of 300 m geodesic radius, a distance most urbanites are willing to walk (Yang and Diez-Roux, 2012). The grid represents an amenity density and multifunctionality field. The overlapping neighborhoods reduce the arbitrariness of the borders of the units of analysis (see supplementary materials to see all the figures and tables).
Data and variables
As the core data source on amenities, we chose Foursquare, one of the most extensive and complete social media datasets on places, which provides reliable historical data on venue creation dates and detailed categories of venues from 2012 onward (Foursquare, 2020; McKenzie et al., 2015; Weerdenburg et al., 2019). 1 The venues are classified into standardized categories by users, which reflects their subjective experience of a place. Due to the large-scale use and crowd sourcing of Foursquare, its amenity categorizations must have utility and therefore quality. 1 For example, in contrast to, for example, firm registries, it is able capture small and informal amenities. Moreover, Foursquare’s venues have been shown to predict with high confidence the location of retail, hotels, restaurants and cafes (Spyratos et al., 2017). Supplementary Figure 7 shows the number of Foursquare Arts & Entertainment, Retail and Food venues in comparison to the respective number of Orbis firms per city. The proportions of venues per type and the intercity ranking of Foursquare venues resemble the ones found in Orbis. The few exemptions can be explained through different definitions of urban areas and limitations in data quality of both Foursquare and Orbis (see Supplementary Materials, p. 13 for more information).
Due to its standardized categorization and data generation, Foursquare data has the special property that it allows for comparability across cities. There are 937 categories of venues in total, organized in a tree-like structure of up to 4 subcategories (see Supplementary Figure 2 for a graph representation of the taxonomy). The meta-categories we used are “Arts & Entertainment,” “Food,” “Shops & Services,” “Nightlife Spots,” “Professional Places,” “Outdoors & Recreation.” From the latter, only Recreation amenities, specifically sports and spa facilities, are selected. In contrast to that, “Arts & Entertainment” contains rather high-class entertainment like museums, theaters or theme parks and “Nightlife” captures the pubs and clubs that engage the young and informal. The final dataset contains 562 categories. Supplementary Figure 1 shows the sample size per meta-category for each city and Supplementary Table 11 lists the final Foursquare venue categories assigned to the meta-categories.
After collecting the data using Foursquare’s Web API, the number and type of venue openings in the cities of interest can be regenerated for various points in time. While unfortunately only amenity openings that survived until now are contained in the data, it can be argued that those that survived are the most successful ones, which makes them more interesting anyway. Moreover, the same bias exists across all cities, allowing us to draw comparisons. We assume that this data limitation should not interfere with causal analysis, as there is little reason to suspect that new subway neighborhoods have more amenities closing shortly after opening compared to other places.
Descriptive statistics and maps for the Foursquare data and the data sources and computation method for the rest of the variables can be found in the Supplementary Materials. 2
Similarity-based diversity
In previous studies, Multifunctional Amenity Mix (or Multifunctional Land Use) has been mainly assessed by counting the number of locally present amenity types (Vreeker et al., 2004) or adding up the proportions of each locally present amenity type to its total amount (Batty et al., 2004). Our new multifunctionality measure integrates the idea of amenity complementarity by quantifying the similarity of venue types. Thereby, we assume that more similar amenities and their activities are more likely to be substitutes for each other, while dissimilar amenities are more complementary across a daily schedule. For example, people that attend a theater show are less likely to go to the cinema afterward, another form of Entertainment, but could be probably more willing to go to a pub or restaurant instead, which involves different activities. Based on Jane Jacobs’ (1961) conceptualization of urban vibrancy, the core idea behind our measure is that for a diversity of people to use a given space over time, they need to be kept occupied with different kinds of activities. A simple entropy measure would fail to accurately capture the multifunctional quality of a neighborhood because it treats all categories on a par.
We, therefore, propose a similarity-based diversity measure as an indicator of multifunctionality. It assesses how uniform a population is distributed over a set of categories, taking into account that similar categories might be confused with each other or are more substitutive in nature. The idea is to redistribute a nominal distribution over categories (cat) according to some similarity measure between categories and then measure entropy over this new distribution. The diversity of this distribution should get higher, the higher the entropy of the original distribution is, as well as the more dissimilar the categories are from each other. The frequencies of categories are given in terms of the following list


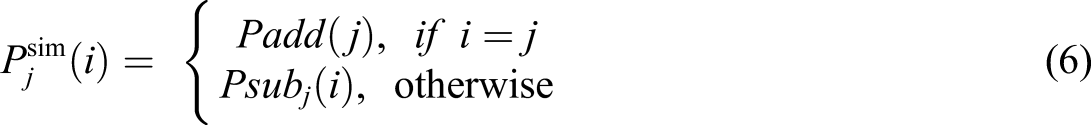

Finally, in order to nullify the effects of shifting profits only into one direction, we compute

The relationship between amenity density and multifunctionality of amenities is non-linear but positive (see Supplementary Figure 3). An increase of density by several new amenities will increase multifunctionality less at already highly dense areas due to a greater likelihood of repetition and similarity to other amenities compared to the same number of amenities being added to a low-density area. Supplementary Figure 4 shows that our new similarity-based diversity measure of multifunctionality differs considerably from the entropy of the amenity distributions.
Regression models
To test the hypotheses, Difference-in-Difference Regression is applied, whereby two different control-unit-matching methods are exploited to test for causal effects of treatments: Propensity Score Matching and Entropy Balancing. For both preprocessed datasets, we tested eight dependent variables: The change in the number of total amenities (H1), change in multifunctionality (H2), and change in the number of a specific amenity type from before the station opened to 2 years afterward, whereby the latter is differentiated between Food, Nightlife, Arts & Entertainment, Shops & Services, Recreation and Professional Places (H3). To account for the difference between existing subcenters and amenity poor areas receiving a new station (part of H1), the interaction effect between the metro neighborhood dummy and the density of amenities beforehand is tested.
As a first control matching method, nearest neighbor Propensity Score Matching (PSM) is applied to mimic a RCT, whereby treated units (up to 1200 m distance from a new station) are matched to control units (minimum 1500 m distant to any metro station) with a similar likelihood of receiving a new metro station (Rosenbaum and Rubin, 1983). We define this likelihood as being determined by the demand for a station, or accessibility need. Therefore, population density, the density of amenities before the subway expansion, the unemployment rate and the distance to the CBD are included in the matching algorithm. For validation, the distributions of these variables were compared between the treated and newly matched control units to ensure their similarity. As a second method, we applied Entropy Balancing (EB), a data preprocessing method to reweight control units (minimum 1500 m distant to any metro station) so that they optimally represent the covariate distribution of the treated units (up to 1200 m distance from a new station) (Hainmueller, 2012). The covariates for which balance is achieved are the population in 2012, the change in population density between 2012 and 2018, the unemployment rate, the Euclidean distance to the CBD, the street accessibility to the nearest subcenter and the density of amenities before the subway expansion. Supplementary Table 4 specifies the distribution of the most important control variable—amenity density before expansion—for the treated and the PSM and EB control units

Results
Treatment effect of new metro stations on the density of local amenities.
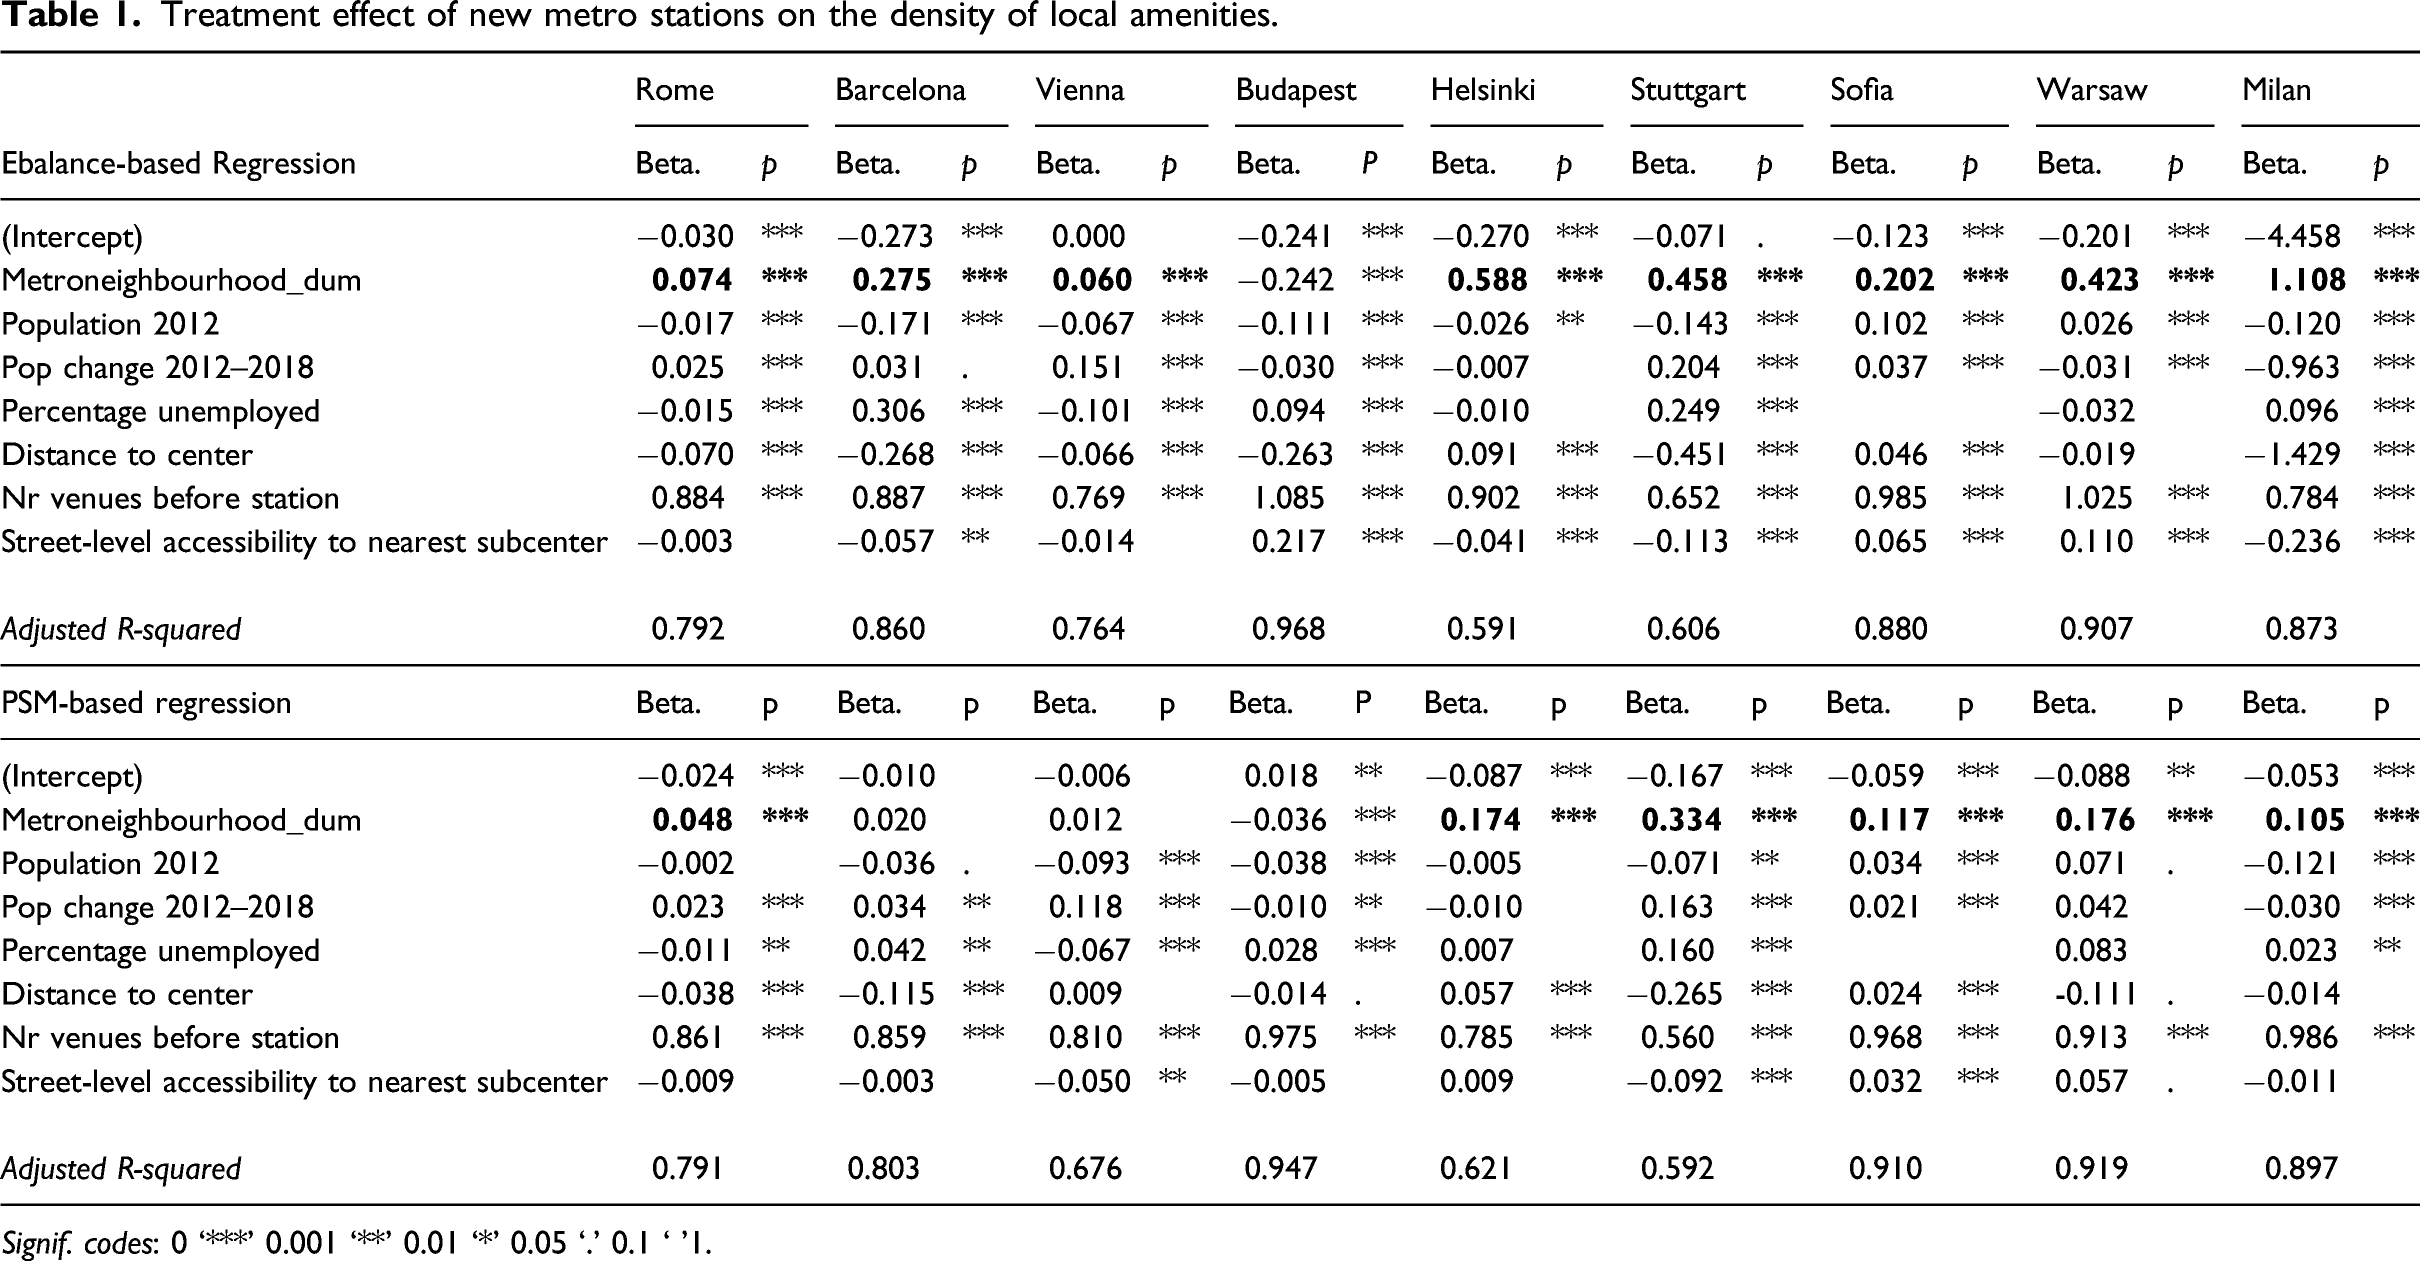
Signif. codes: 0 ‘***’ 0.001 ‘**’ 0.01 ‘*’ 0.05 ‘.’ 0.1 ‘ ’1.
Across all cities and methods, the number of venues before the station opened is the strongest predictor of amenity increases, proving that agglomeration forces are considerably strong for consumer amenities. An additional test of the interaction effect of the amenity density before the station opened and the new metro station dummy, in both the PS-matched as well as E-balanced datasets, shows that, as expected, previous amenity subcenters in Rome, Helsinki, Stuttgart, Warsaw, Sofia, and Milan benefited more from the new metro station. In Barcelona and Vienna, the interaction effect is significant in one of the two models.
Population Density is in most cities negatively related to amenity density increases, indicating that there is still a strong separation of residential and commercial uses in these cities. The analysis of the impact of the population increase between 2012 and 2018, on the other hand, shows very mixed results, making it very difficult to interpret. Areas with higher unemployment experience significantly stronger amenity increases than those with lower unemployment in Barcelona, Budapest, Stuttgart, and Milan, whereas the opposite relation only holds in Rome and Vienna. As expected, in line with the retail gravity models, the more walking distance to a subcenter, the fewer amenities opened, whereby this relationship is only significant in a few cities. Also, the distance to the CBD is negatively correlated to amenity density increases in most cities. Together, the entered variables can explain a large percentage of the variation indicated by high adjusted R-squared results.
Treatment effect of new metro stations on the multifunctionality of the amenity mix.
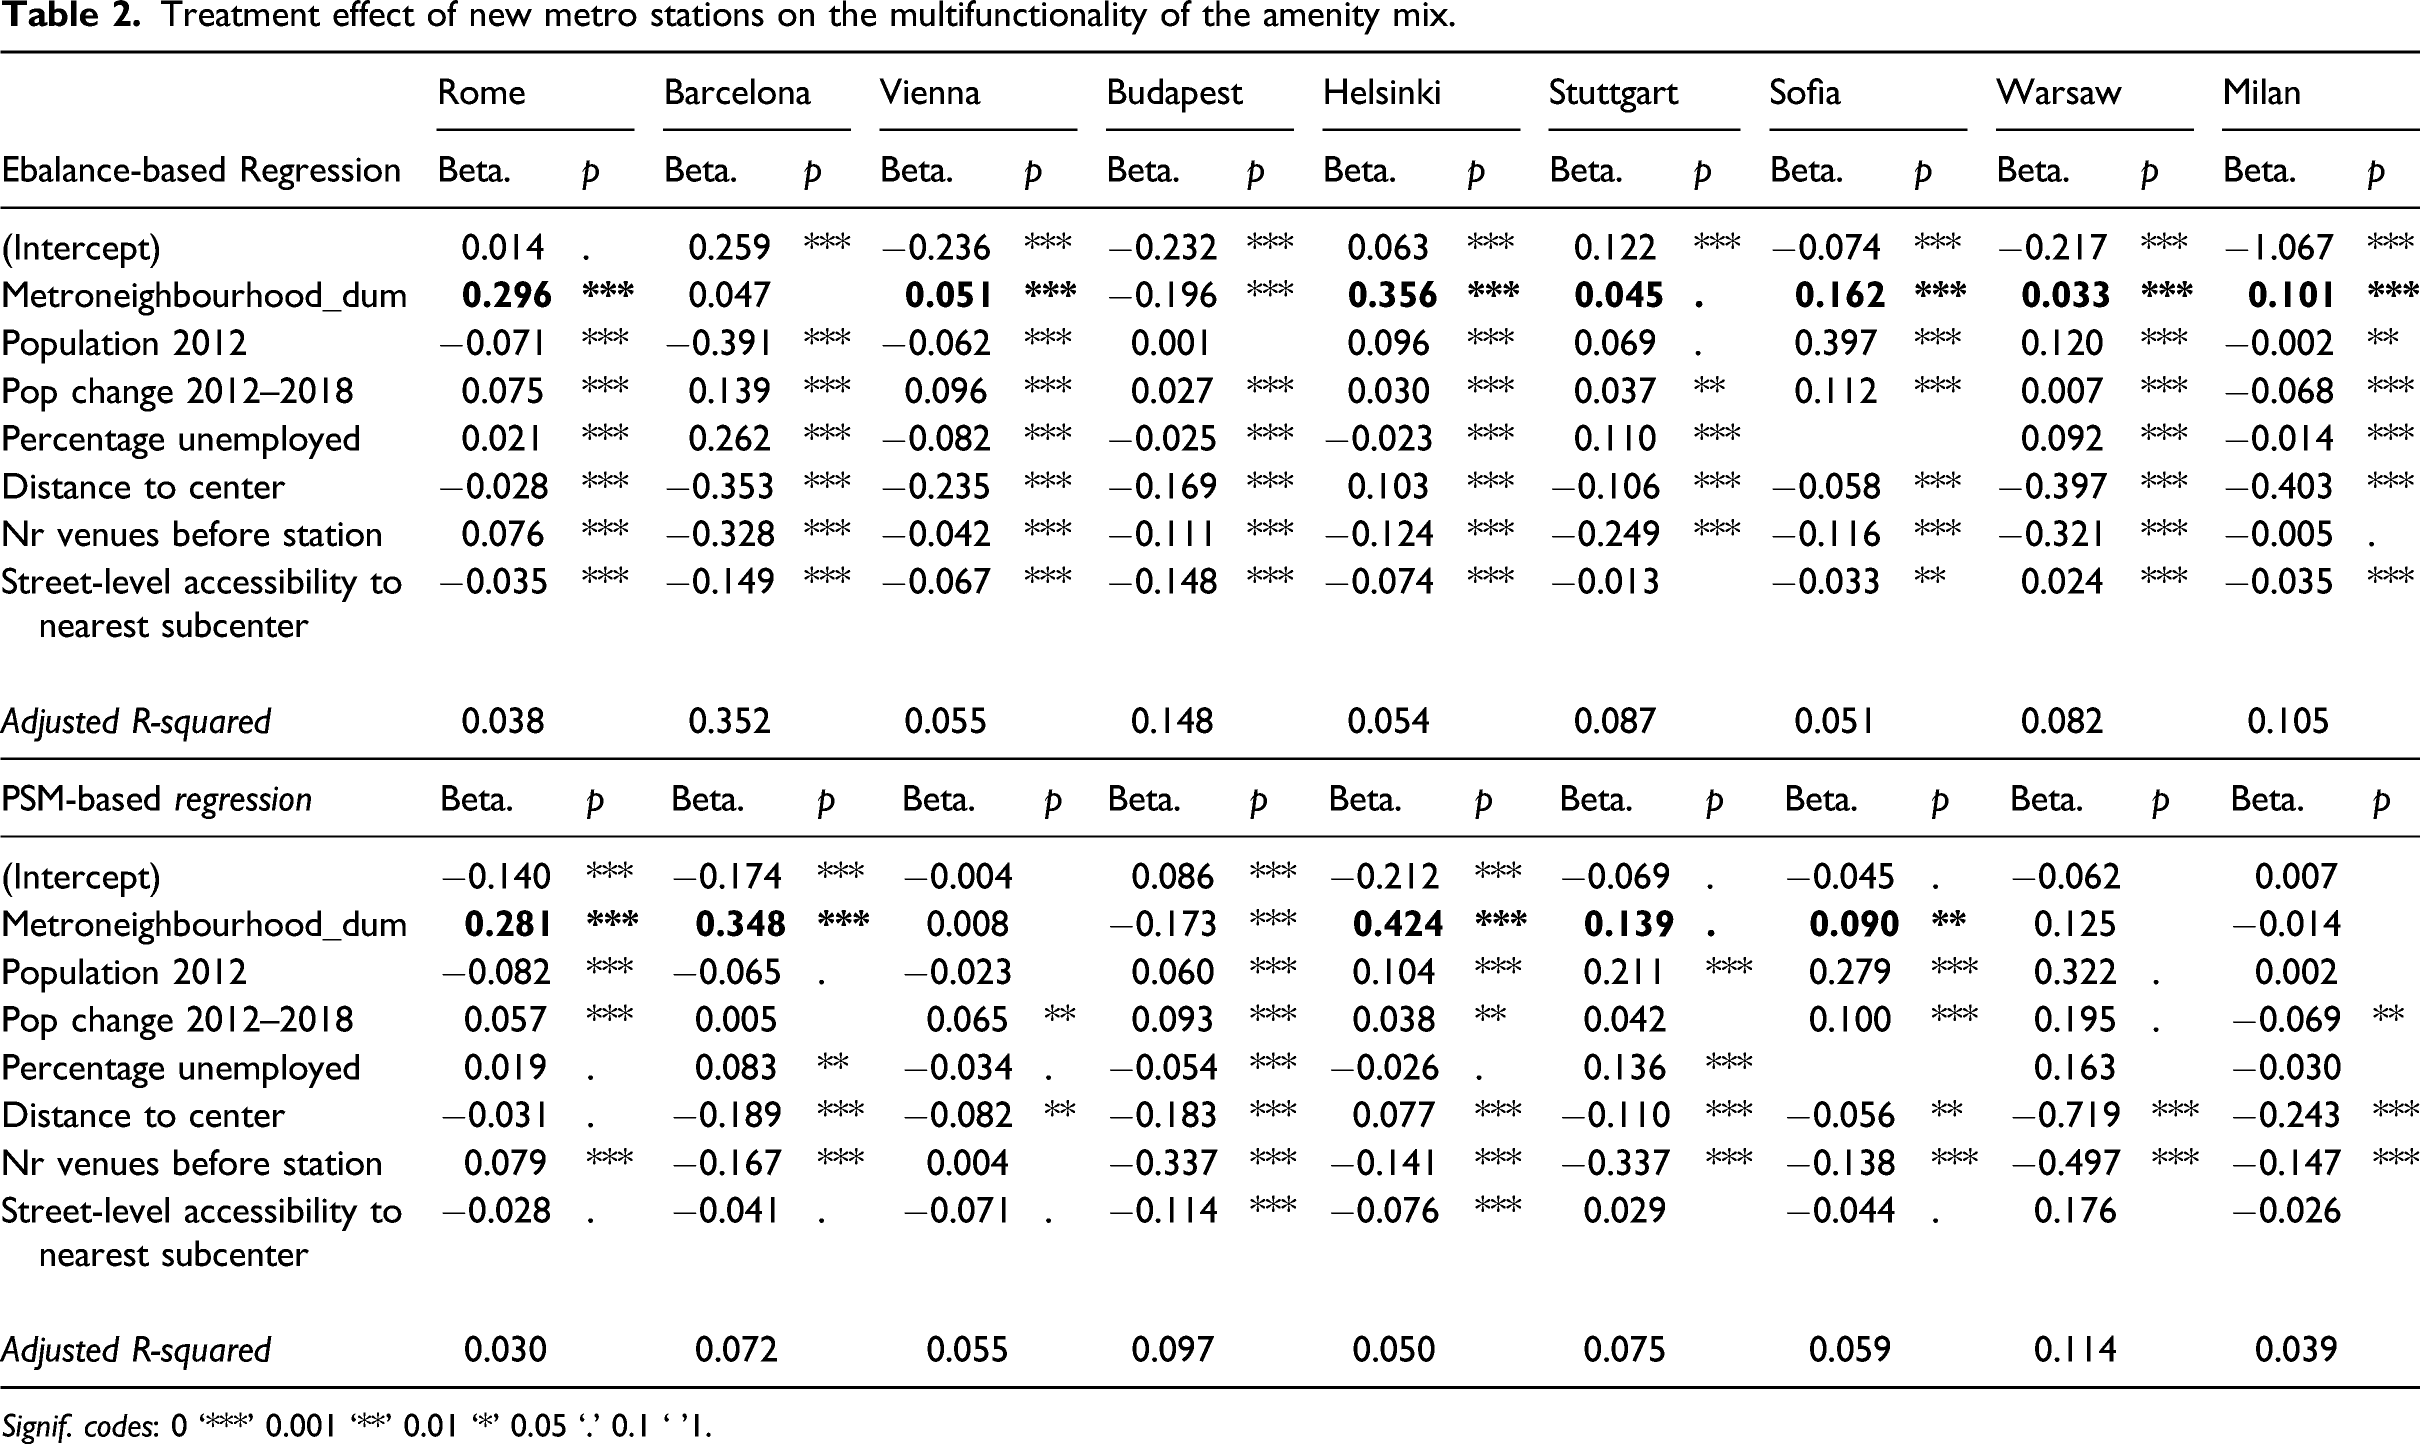
Signif. codes: 0 ‘***’ 0.001 ‘**’ 0.01 ‘*’ 0.05 ‘.’ 0.1 ‘ ’1.
Due to the decreasing returns of amenity density for multifunctionality, one can observe that many cities have a negative relationship between the level of multifunctionality before the stations opened and the increase in multifunctionality 2 years after the station opened. Therefore, we have tested which cities had a significantly higher multifunctionality of areas around new metro stations compared to control units before the stations opened, which could explain why the increase is not substantial. It turns out that this selection bias applies to Sofia, Warsaw, Budapest, Vienna, Helsinki, and Rome for both the PSM and EB datasets. The results also show that the variables that predict amenity density very well are weak in predicting multifunctionality, as the consistently low adjusted R2 values reveal. This leads us to question how much of the multifunctionality of an amenity mix is based on randomness or, instead, what explanatory variables might be omitted.
Moving on to the findings regarding the heterogeneity between amenity types, which can be found in Table S9 of the Supplementary Materials, Arts & Entertainment venues increase significantly more in new metro neighborhoods compared to their controls in 8 out of 9 cities, Food venues in 7 and Nightlife in 4 of them, supporting H3. Shops and Services significantly increase in 3 out of 9 cities, Professional venues also in 3 and Recreational venues only in 2 of them. The average standardized coefficient is highest for Arts & Entertainment, followed by Food venues, then Nightlife and Shops and Services. This further highlights the possibility of an underlying gentrification process, where more affluent, educated, and young people move into the new neighborhoods. We additionally tested this by analyzing the interaction effect of the metro neighborhood dummy and population increase, which proved to be positive and significant in Rome, Vienna, and Helsinki for both Arts & Entertainment as well as Nightlife, and in Stuttgart only for Arts & Entertainment. The number of respective venues before the station opened is the strongest predictor for new venues across all cities and venue types, whereby this agglomeration effect is the strongest for Shops and Services, Gastronomy and Professional venues.
Discussion and conclusion
Taking advantage of the growing availability of georeferenced social media data for urban studies, we used Foursquare venues to evaluate the spatiotemporal effect of subway expansion on amenity density, multifunctionality of the local amenity mix and different venue types. The findings show that there is a significant impact of new subway stations on the local amenity mix, but that the effect varies across cities and venue types. Subway neighborhoods in Rome, Helsinki, Stuttgart, Sofia, Warsaw, and Milan seem to benefit much more in terms of amenity density from the new stations than the ones in Vienna, Budapest, and Barcelona (H1). It also becomes clear that previous amenity subcenters profit significantly more from new metro stations than amenity deserts, hinting at strong agglomeration forces. Helsinki, Rome, Sofia, Barcelona, and Stuttgart have significant increases in multifunctionality, which speaks to the area’s increased ability to attract dissimilar amenities that involve activities that could not be found there previously (H2). Our new similarity-based diversity measurement for assessing the multifunctionality of an amenity mix can capture an important quality, which might approximate Jane Jacobs’ idea of urban vibrancy (1961) and a diversity of lifestyle activities. It could be therefore an important factor for increasing local livability. We hope that it can be further used and tested in other studies.
Finally, our results show that indeed Arts & Entertainment, Food venues and Nightlife have been impacted most strongly by new subway stations, as was expected (H3). It is interesting that especially the social, cultural, and informal types of amenities have been affected, strongest of them the high-class Arts & Entertainment amenities. On the one hand, they are said to particularly attract the Creative Class (Florida, 2002) and may play a role in creating the collaborative environment that makes urbanites innovate (Glaeser, 2012). On the other, they could be a symptom of gentrification and displacement, indicating that TOD projects may potentially not benefit those for whom they were originally intended. Future work should focus on better methods and data to distinguish amenity-led gentrification and displacement from gains in local economic life and livability, an analytical goal that goes beyond the current study.
Certainly, this study has a few more limitations. While the Foursquare amenity data has many advantages, we could not access past amenities that did not survive until our time of data collection. Moreover, we have not analyzed the obvious network effect that subway expansions have on the whole city. Due to the limited scope of the research and lack of data, we had to omit a few variables that could have helped to better explain why the impact of new stations varies in strength and composition between the cities. One factor is the path dependency of transportation and the built environment, as a city, once it is constructed, is hard to modify on a large scale. Some subway neighborhoods perhaps do not have enough vacant land available to create new amenities. In others, the amendments of zoning regulation and building codes, governmental investments or even the construction of new buildings could have enabled the development of new amenities. Next, subway culture varies between cities, whereby the level of stigmatization and therefore use may influence the impact a new station has on the surrounding areas. Finally, in different cities the subway expansion has been performed in neighborhoods of different socio-economic geographies for which our control of the local unemployment percentage cannot account. As the PSM and EB approach can only address the selection bias due to observed attributes, we still face some challenges to identify the causal relationships due to endogeneity coming from unobserved variables.
Despite that, our study does show that the spatiotemporal dynamics of different cities display surprisingly many parallels. The evidence supports the relevance of subway expansion as a TOD policy tool that can attract amenities even to outskirts, thereby transforming them into more multifunctional, mixed-use neighborhoods. However, the results also show that subway connection alone cannot miraculously vitalize amenity deserts. A minimum number of pre-existing amenities are necessary for new subway stations to have an amenity-attracting effect on neighborhoods. More research is needed to understand how subway expansion interacts with other TOD policies and which TOD policies packages are the most effective in achieving a decentralized structure of mixed-use around mass transit stations. In an age of urbanization, where an ever-larger share of people has to live outside central areas, TOD may become part of a larger strategy to tackle the geographical inequality in accessing amenities and jobs.
Supplemental Material
sj-pdf-1-epb-10.1177_23998083211056955 – Supplemental Material for The rebirth of urban subcenters: How subway expansion impacts the spatial structure and mix of amenities in European cities
Supplemental Material, sj-pdf-1-epb-10.1177_23998083211056955 for The rebirth of urban subcenters: How subway expansion impacts the spatial structure and mix of amenities in European cities by Tabea S Sonnenschein, Simon Scheider and Siqi Zheng in Environment and Planning B: Urban Analytics and City Science
Footnotes
Acknowledgment
The research was supported by the MIT Sustainable Urbanization Lab, which funded the stay of Tabea Sonnenschein as a visiting student in the lab. We moreover thank Pierre-Alexandre Balland and Adriano Borges Ferreira Da Costa for the support and mentorship during the process.
Declaration of conflicting interests
The author(s) declared no potential conflicts of interest with respect to the research, authorship, and/or publication of this article.
Funding
The author(s) received no financial support for the research, authorship, and/or publication of this article.
Supplementary material
Supplementary material for this article is available online.
Notes
Author Biographies
References
Supplementary Material
Please find the following supplemental material available below.
For Open Access articles published under a Creative Commons License, all supplemental material carries the same license as the article it is associated with.
For non-Open Access articles published, all supplemental material carries a non-exclusive license, and permission requests for re-use of supplemental material or any part of supplemental material shall be sent directly to the copyright owner as specified in the copyright notice associated with the article.