
Abstract
Many years, urbanisation research has largely focused the development of urban agglomerations and megacity regions, whereas less attention was paid on the development of medium-sized cities, small towns, villages, or rural areas. Yet many interrelations and spatial linkages between urban and rural areas exist. In this paper, we present a novel method called ‘TOPOI’ for the integrated analysis and description of settlement units in an urban–rural setting. The TOPOI-method enhances the understanding of the built environment by clustering and describing settlement units of similar characteristics with view to their physical form, function, and connectivity. The method is built on known planning parameters, but does not limit the analysis of settlement units to their administrative boundaries. Based on 11 indicators, 13 TOPOI-classes were identified in two exemplary study regions revealing new insights into urban–rural settlement types. This allows a better understanding of urban–rural linkages and therefore opens up new pathways for a more sustainable development.
Keywords
Introduction
Urbanisation is a process that, with few geographic exceptions, has seized the entire world (Lefèbvre, 1970; UN-DESA, 2019). Urbanisation does not only entail the physical change of land from un-built to built, the expansion of cities to urban regions and agglomerations (van den Berg, 1987), or the transformation of the built environment, but it also entails the change of lifestyles, cultures, and routines (Carlow, 2016; Lefèbvre, 1970). In this process, not only cities and urban regions show a high dynamic, but also rural areas (Carlow, 2016; Diener et al., 2005; Koolhaas, 2014). Since many interrelations and spatial linkages between urban and rural areas exist (Akkoyunlu, 2015; Tacoli, 2006), the boundaries between them are vanishing as lifestyles are changing (Steinführer, 2016). Consequently what is considered ‘urban’ and what ‘rural’ is also re-evaluated (Carlow, 2016; Diener et al., 2005; Lefèbvre, 1970; Oltmanns, 2016; Steinführer, 2016).
However, recent urbanisation research has largely focused the development of large urban agglomerations and megacity regions (Burdett and Rode, 2018). Less attention was paid on the development of medium-sized cities, small towns, villages, or rural areas (Oswalt, 2005). Currently, these settlement types are largely understood as depending on core cities, as spaces for outsourcing industry, logistics, waste management, energy- or food-production from cities (Carlow, 2013). Newer approaches foster an integrated view on urban and rural areas as interconnected systems of networks and flows of people, goods, information, and services beyond administrative boundaries (Baccini and Oswald, 1998). Since the functional and physical distinction between core cities and their hinterlands are fluid today, the understanding of urban and rural is changing, too. Concepts such as Metapolis (Ascher, 1995), Zwischenstadt (Sieverts, 1999), Netzstadt (Baccini and Oswald, 1998), or Metacity (McGrath and Pickett, 2011) illustrate this, but often focus on deficiencies and negative impacts of urbanisation without highlighting possible synergies between different settlement types.
Complementary to defining what is urban and what rural (Coombes, 2003), various methods of classifying settlements were established on country level (Castillo, 2018) or for international comparison (European Commission et al., 2021). Thereby, different criteria and weightings are applied. The European Statistical Office (EUROSTAT) for example uses a demographic approach to typify territorial areas from regional level (NUTS3) up to the scale of local administrative units (LAU) (Féret et al., 2020). In 2020, the United Nations Statistics Division (UNSD) implemented a new method measuring the ‘Degree of Urbanisation (DoU)’ (European Commission et al., 2021) enabling the classification of the entire territory of a country along an urban–rural continuum. Prior to this, UNSD’s binomial definition of urban and rural was based on the criteria and spatial resolution used by each country, and thus differed from country to country (UN-DESA, 2018). DoU addresses the problem of categorising spatial units of different sizes by translating the population data into a grid and overlaying it with the smallest administrative or statistical spatial unit (European Commission et al., 2021). This can cause a dilemma. In many European countries, such as Germany for instance, these units do not correspond with real existing physical spaces, but are – as administrative entities – rather abstract geographical units (BBSR, 2017). Additionally, approaches to describe the built environment differ between countries. The Rural Urban Classification of Local Authority Districts (RUCLAD) in the UK, for example, defines Census Output areas and intersects the built-up area with demographic data at 1 ha resolution, defining 10 classes from major conurbation (urban) to village (rural) (Office for National Statistics, 2016). Although the population size within delimited areas is usually the basis for settlement classifications worldwide, there are different thresholds as well as different methods of delineating the relevant spatial units from administrative regions to built-up areas (Hopkins and Copus, 2018). The spatial resolution of these established classification methods is often well suited to describe spatial structures at the regional level. However, this is not sufficient to analyse the entire urban system or to precisely characterise the settlement units within.
Again focussing on administrative boundaries, in formal planning to date the ‘central place’ theory (e.g. Christaller, 1933) is still enacted in many European countries and forms the basis for decisions on the allocation of public funds, for example in Germany (BBSR, 2000; Greiving et al., 2015). Depending on the population size within an administrative boundary a municipality will offer certain public goods and services or not. This may include child care, schools, hospitals, law courts, higher education or others (BBSR, 2000; Greiving et al., 2015). The population size within the defined administrative boundary is thereby the main indicator (BBSR, 2017). However, such an approach favouring size does not take into account exactly those interrelations and linkages that are characteristic for the urban–rural system today. As a consequence, large and well-connected municipalities are considered urban and receive more public goods and services, whereas more remote and smaller ones are defined as rural and usually have fewer public goods and services. This has been challenged: While Sieverts (1999) emphasised the historic relevance of central places, he showed that urban systems are evolving away from hierarchies of centrality towards network structures of multiple centres with different and complementary functions. Baccini and Oswald (1998) characterised the urban system as networks of nodes, edges, and flows, creating multiple connections in which people, goods, and information are concentrated and move as flows on the edges between the nodes. While Ascher (1995) has described this as ‘metapolis’ for the mono-centric conurbation of Paris, our TOPOI–approach presented here addresses urban–rural settings.
In the worldwide course of urbanisation and the inherent physical, economic, social, and cultural change transformations of urban and rural landscapes, new descriptive models of settlement patterns depicting the interrelations and linkages between urban and rural are therefore needed (Baccini and Oswald, 1998; Bolchover and Lin, 2017; Janelle, 2019; Pretterhofer et al., 2010). Furthermore, such a new analytical framework potentially allows for new insights when linked to the knowledge about specific spatial configurations that can be considered part of urban–rural regions (see for instance Besussi, 2010; Galster, 2001; Kotkin, 2016).
To understand regional settlement patterns (a) along urban–rural gradients and (b) in their interrelation, we therefore suggest a new approach. With TOPOI (plural) referring to the term ‘topos’ (Greek) meaning ‘(common) place’, we present a novel method for detecting, describing and functionally, physically and morphologically classifying settlement units according to their properties. The TOPOI-method is based on the real existing built environment, non-regarding administrative boundaries. It provides a starting point for understanding settlements of different or similar characteristics and sizes in an urban–rural context.
Materials and methods
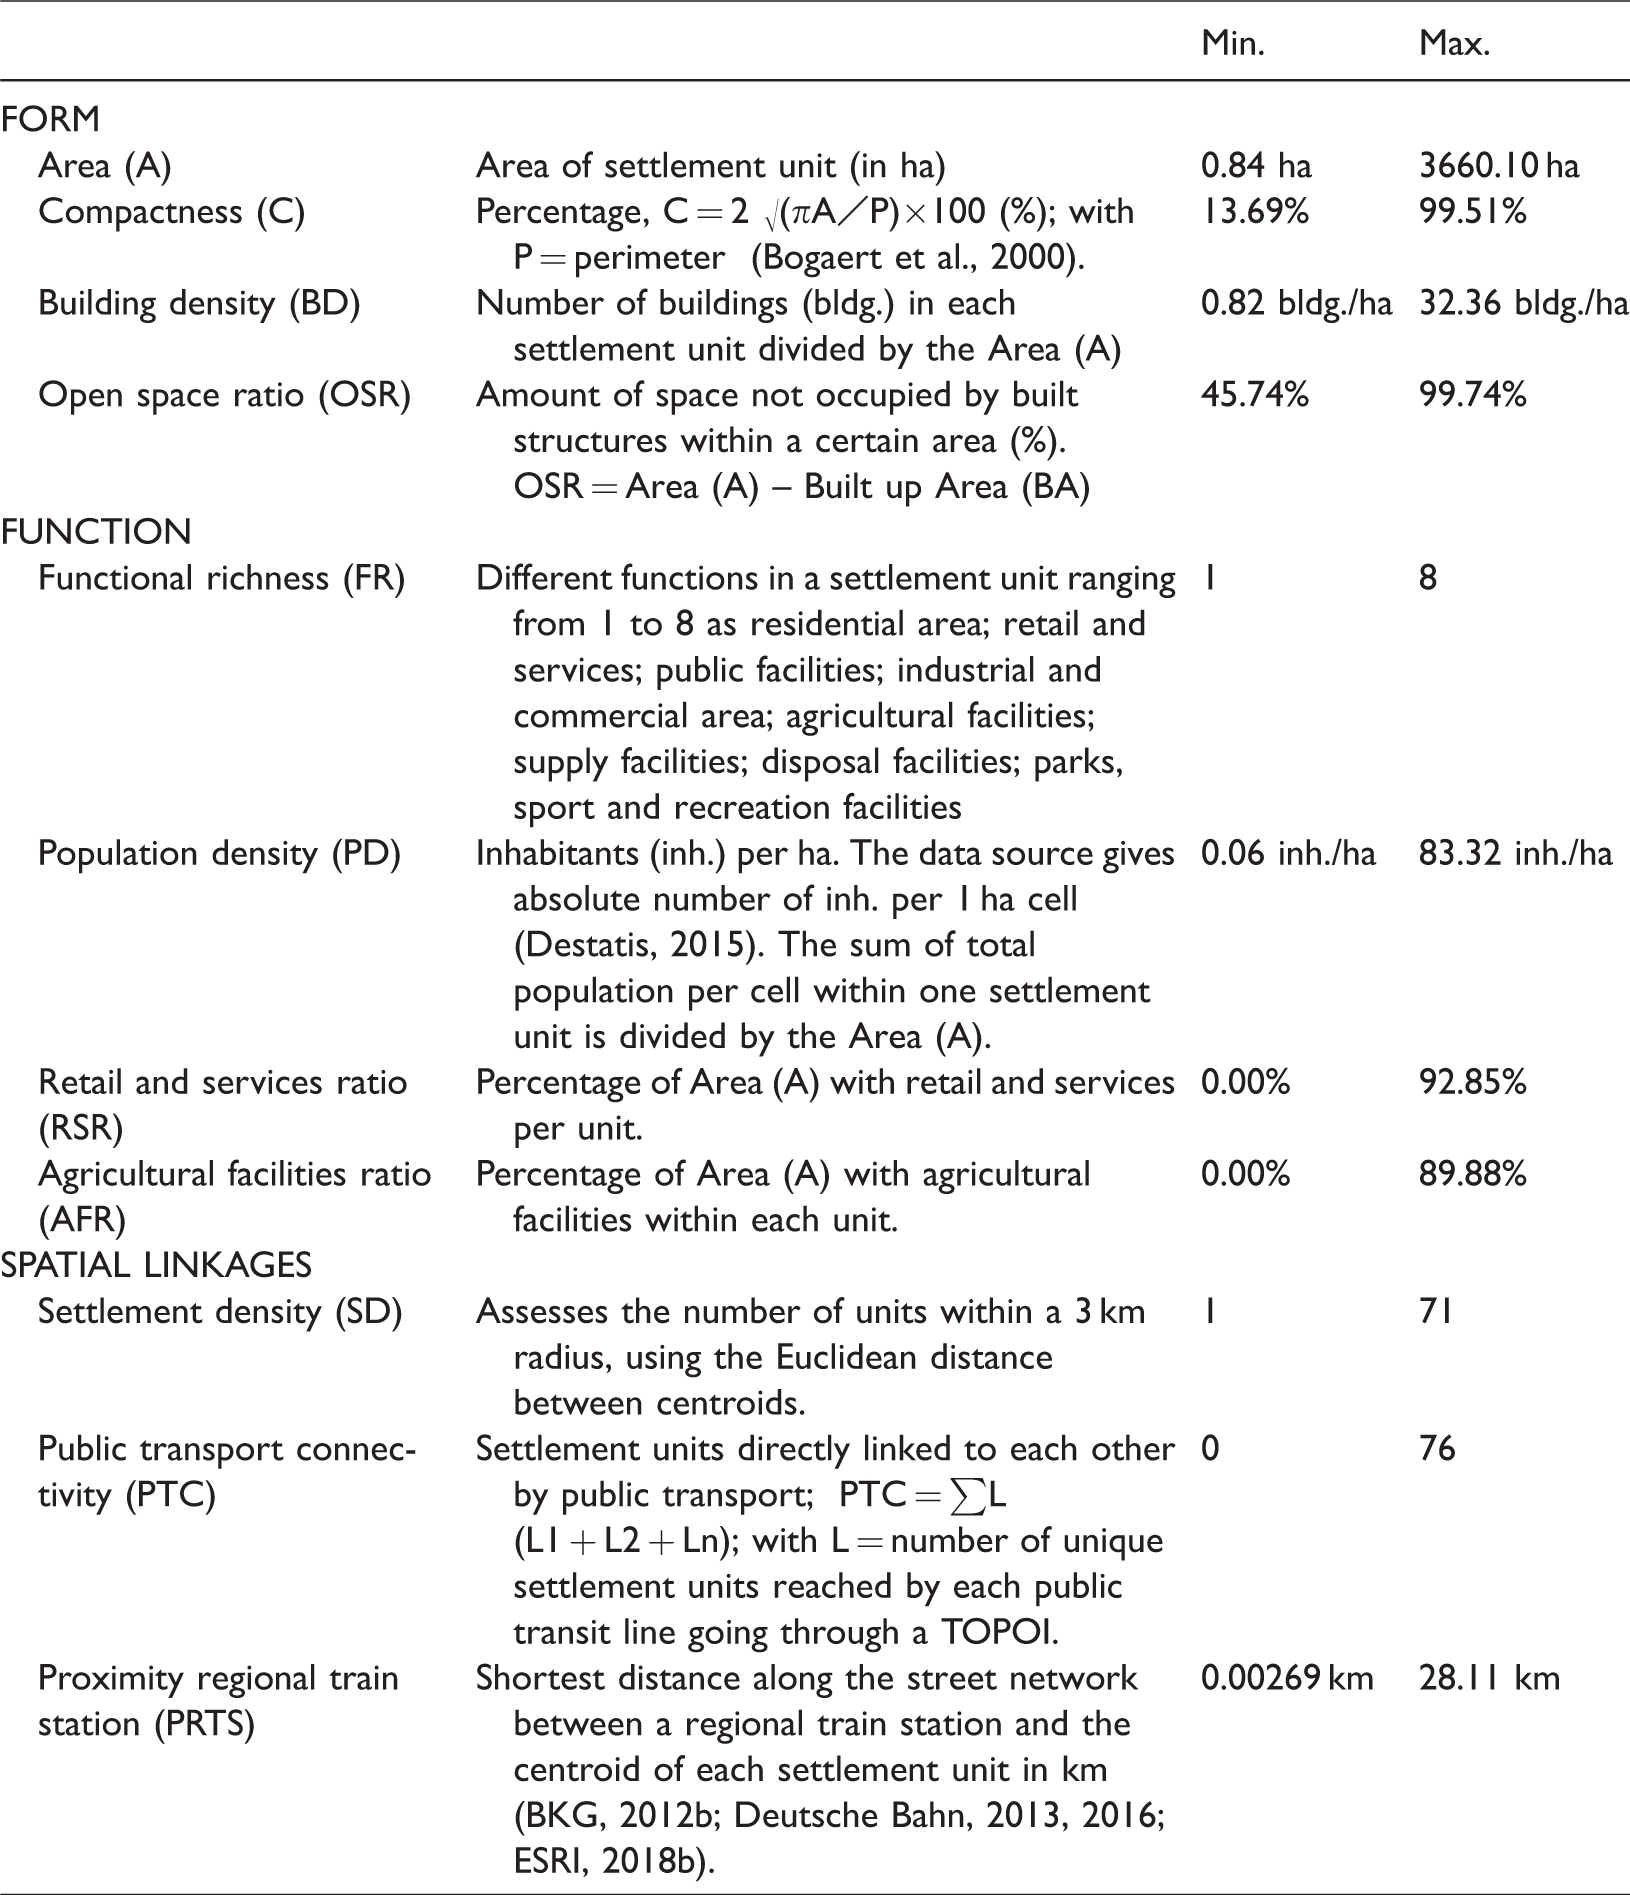
We define TOPOI-classes as classes of settlement units of similar characteristics, independently from their administrative borders. Unlike traditional attributions of settlement types used in formal planning procedures, such as ‘city’, ‘small town’, ‘village’, etc. (BBSR, 2017), the TOPOI-method departs from known planning parameters, such as building and population density, or functional distribution, but does not limit the analysis to areas within ascribed administrative boundaries (Table 1 for formulas and definitions). Adding properties such as proximity or accessibility to the analysis, functional interrelations and spatial linkages between the settlement units become additional determining factors in the classification of settlements.
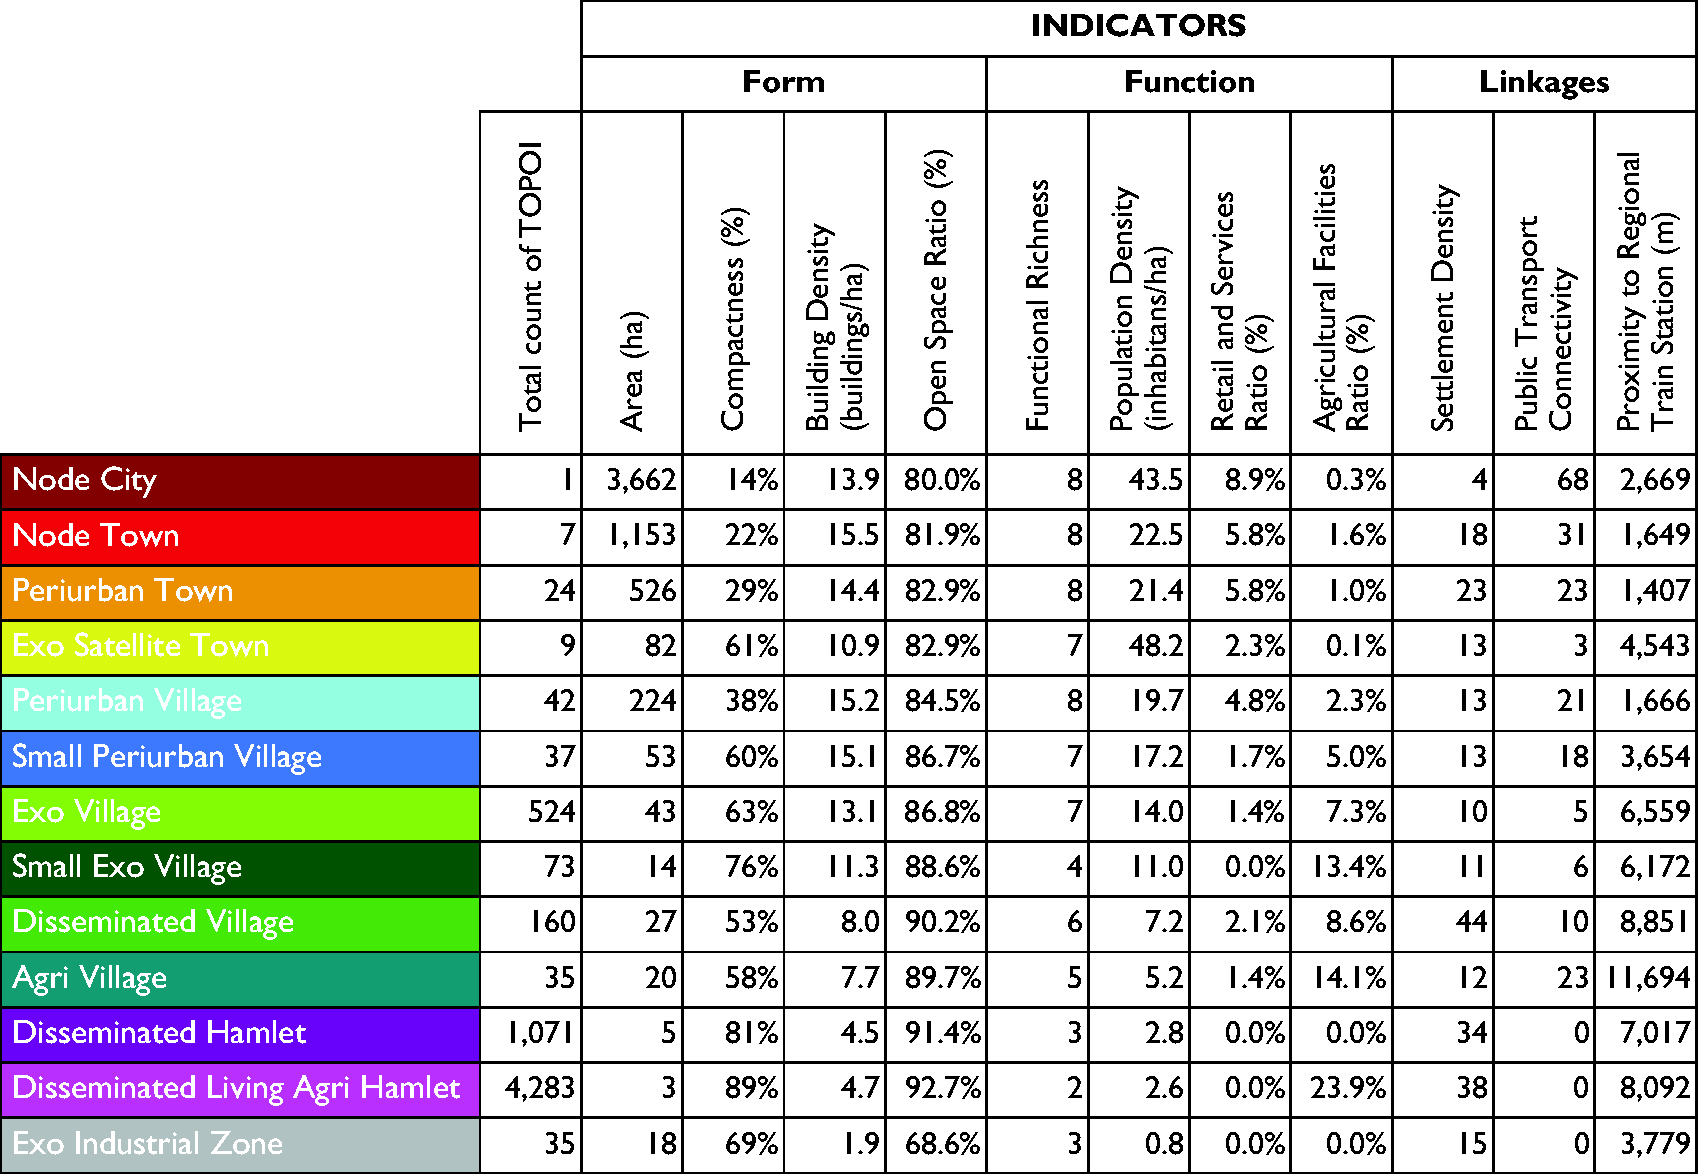
Range of 11 indicators of form, function, and spatial linkages used in the affinity propagation clustering for classifying settlement types according to the TOPOI-method.
The TOPOI-method was developed and tested for two study regions in Lower Saxony, a Federal State of Germany. In Lower Saxony 20% of the population live in large cities (>100,000 inhabitants), 9% in medium-sized towns, 71% in small towns (<50,000 inhabitants), suburban, and rural areas (LSN, 2019). The regions show very diverse development patterns. Simultaneous shrinkage and growth in close geographic proximity are characteristic for the recent development, with often unsustainable effects, such as a high sealing of land and dense commuting patterns (MSGG, Ministry of Social Affairs, Health and Equal Opportunities Lower Saxony, 2013).
Figure 1 shows Lower Saxony settlements in relation to different landscape types based on the classification of the Lower Saxony State Office for Mining, Energy and Geology (LBEG, 1995). Regions in Lower Saxony developed historically differently. For the development of the TOPOI-method, we selected two study regions on the base of their different urbanisation and landscape patterns. The western study region Vechta-Diepholz-Verden (A, Figure 1) is characterised by a large number of evenly distributed, mainly prospering medium-sized and small towns in a sandy soil or heath landscape (Geest). Founded on originally rather infertile soils, the region is today characterised by intensive animal husbandry and agriculture (Tamásy, 2013). The study region of the larger Braunschweig region (B, Figure 1), includes both prospering cities and shrinking municipalities. The landscape of foothills is characterised by very fertile loess soils (Börde), which led to an early and relatively dense formation of settlements in the region.
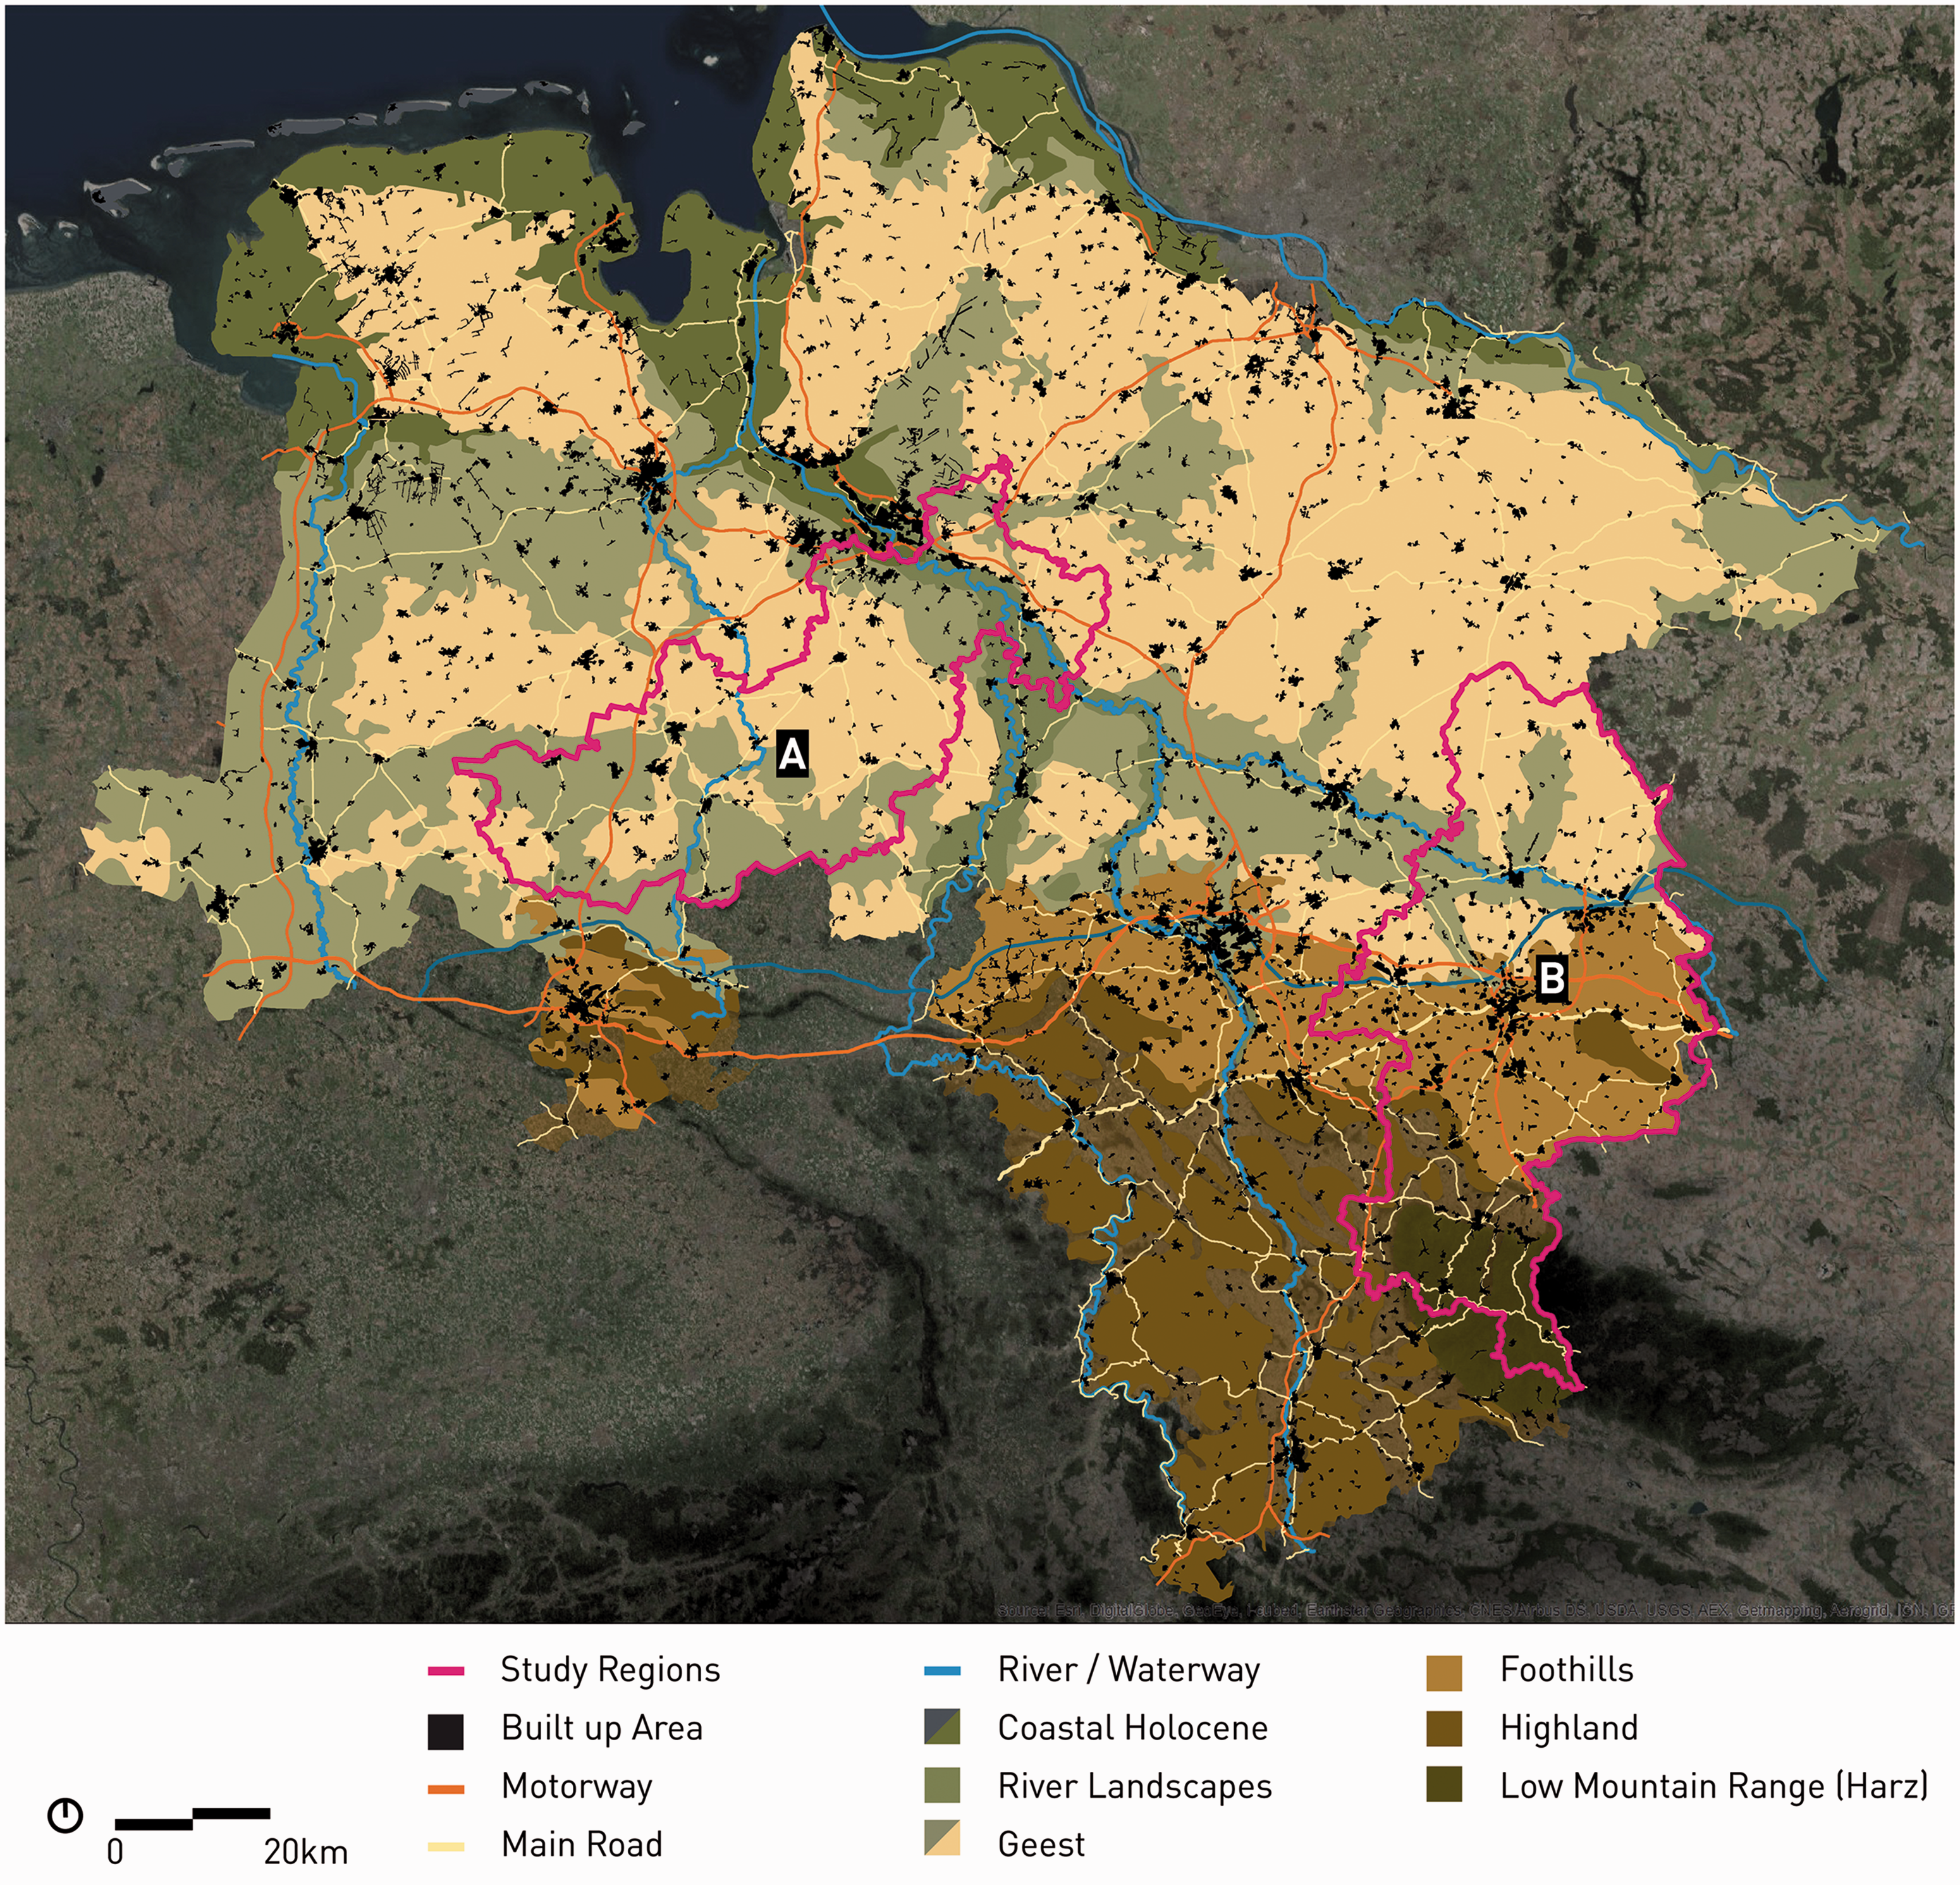
Built up areas and landscape types (LBEG, 1995) of Lower Saxony and the two study regions: (A) Vechta-Diepholz-Verden and (B) Larger Braunschweig region. Data Source: BKG (2012b); ESRI (2018b); BKG (2012a).
The formal spatial planning perspective provides yet a different view on the urban–rural settlement structure. Spatial planning in Germany groups settlements into categories such as urban or rural in relation to administrative boundaries and population size or density, largely disregarding other important aspects such as morphology, connectivity or linkages to other settlements. One example is the Spatial Development Report 2017 of Germany (BBSR, 2018), which defines settlements or county types such as ‘city’, ‘urban’, or ‘rural’ on the base of population density (inhabitants per hectare) (BBSR, 2018). This is shown for our two study regions in Figure 2. According to the report, metropolitan counties are those showing a denser, and rural areas as those with sparser population density.
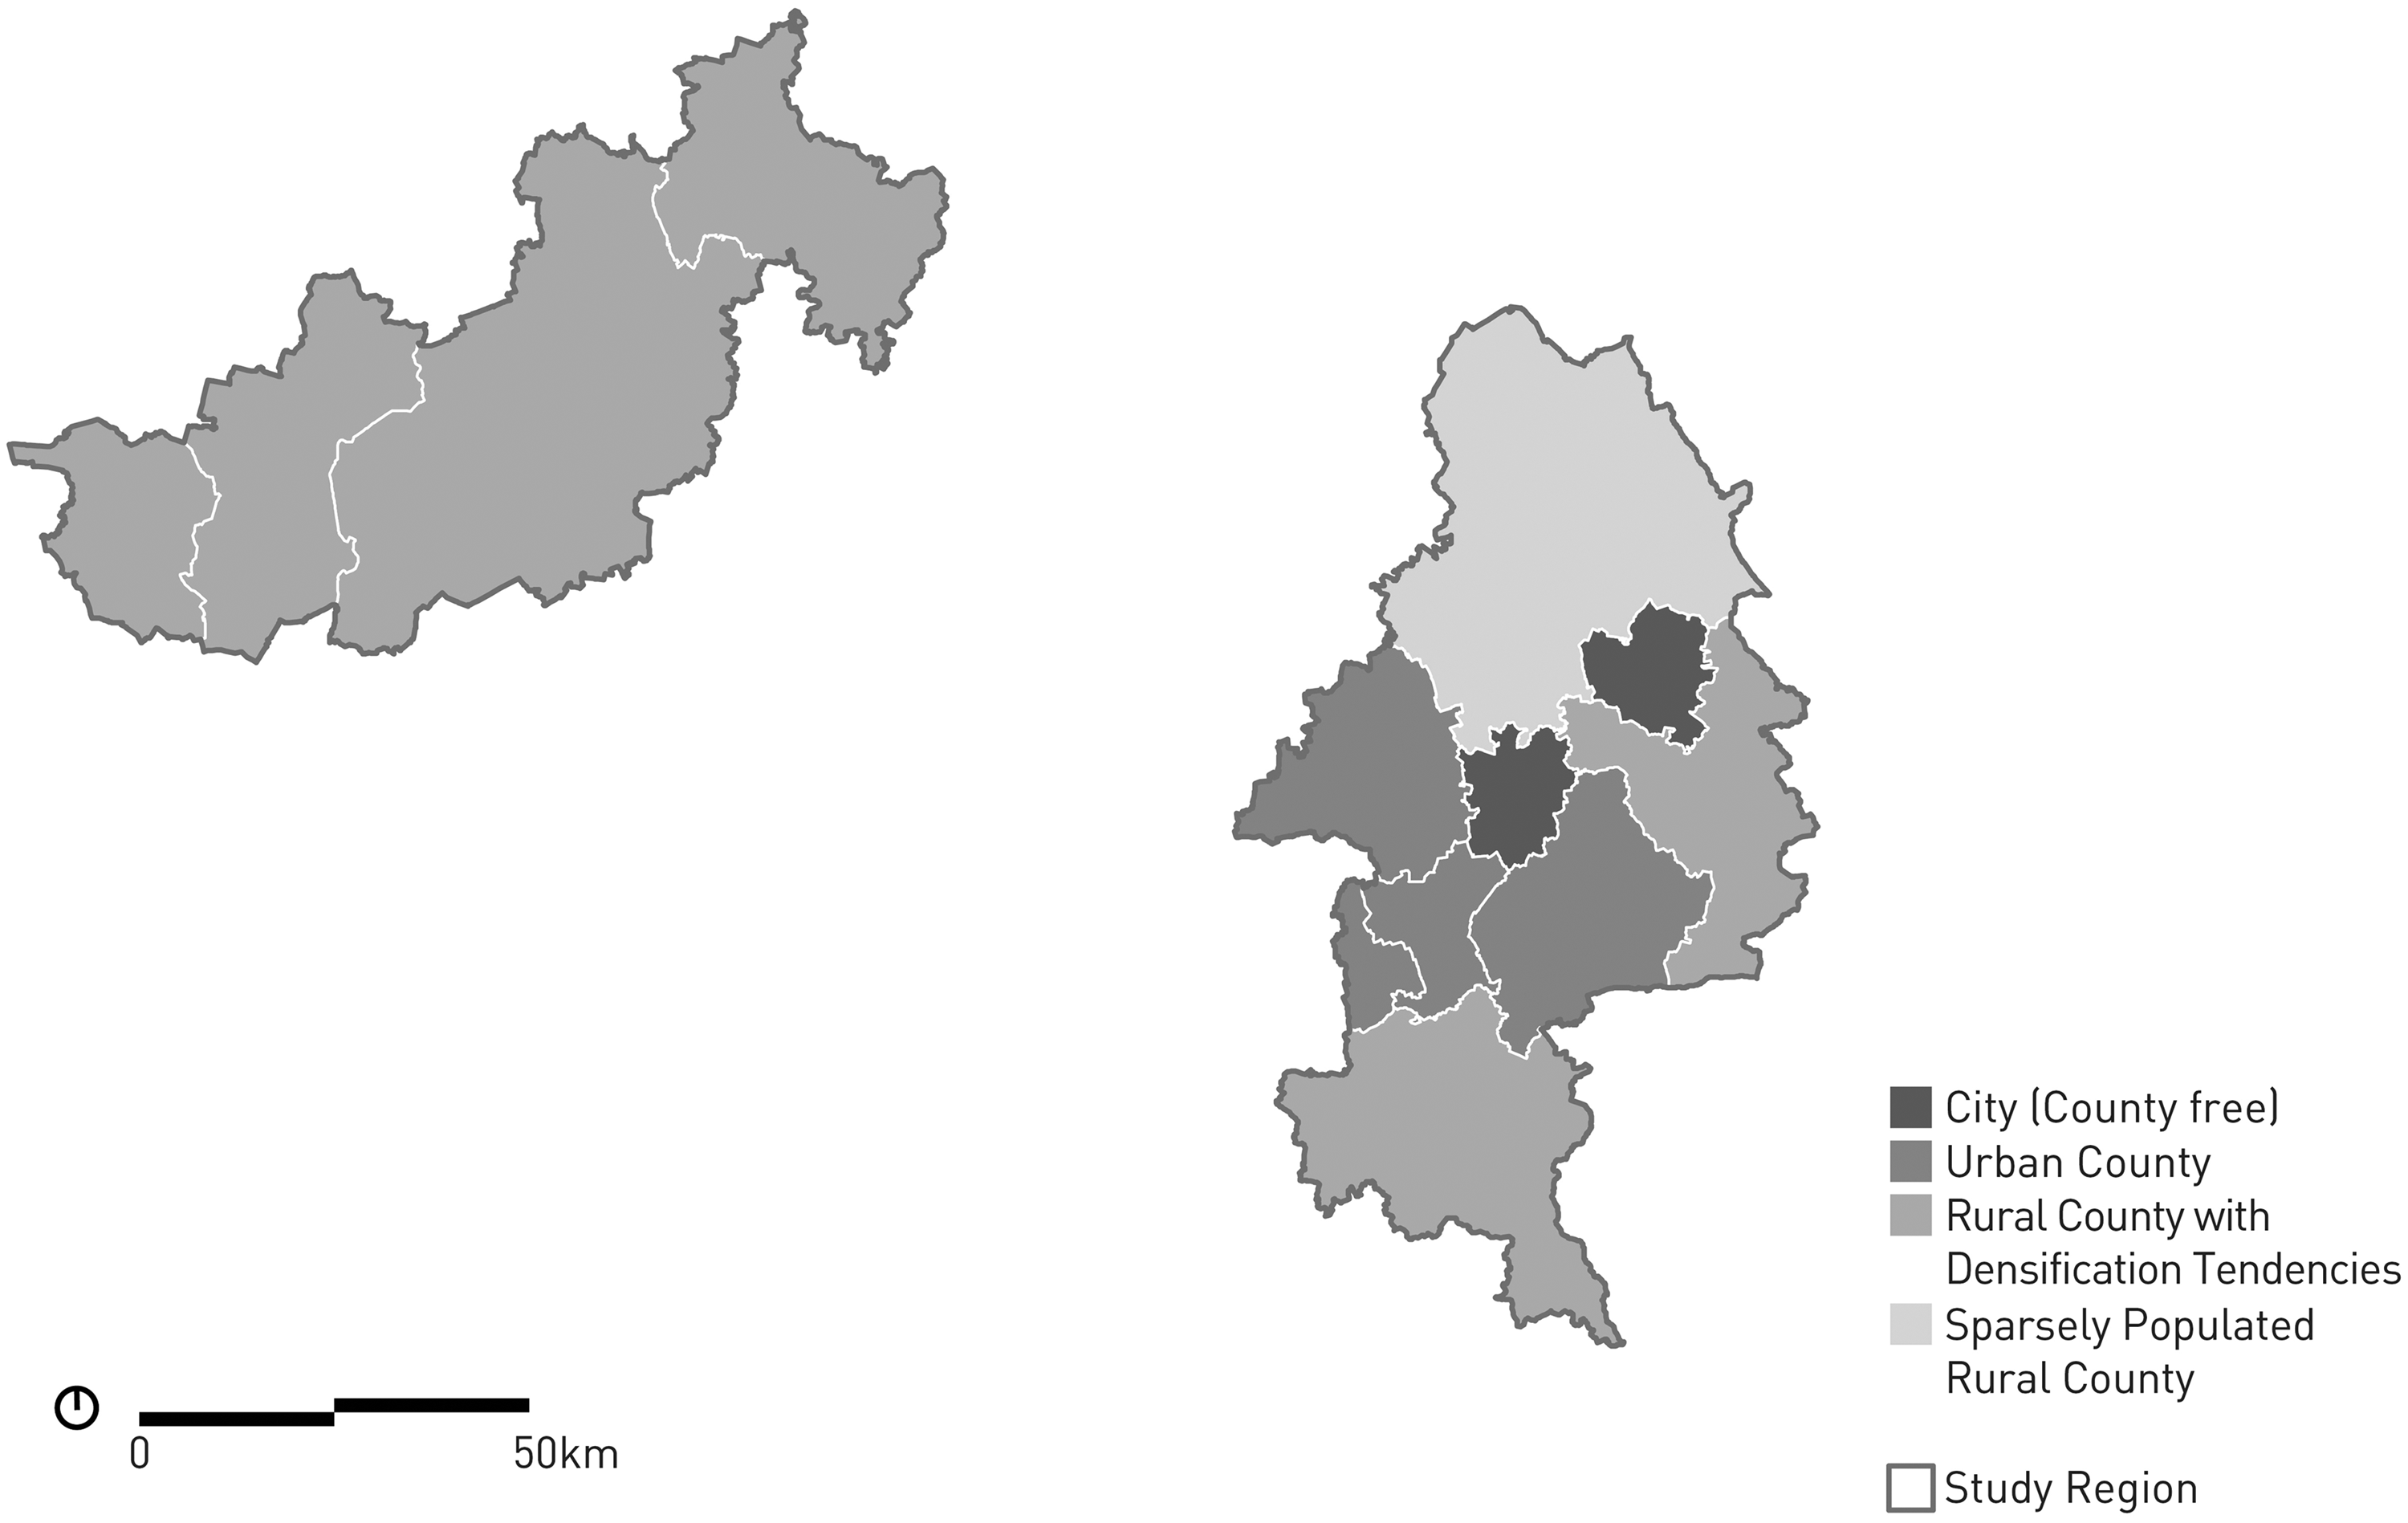
Classification of counties of the two study regions in the Spatial Development Report 2017 (BBSR, 2018). Data Source: BKG (2012b).
In order to gain a deeper understanding of urban–rural settlement patterns, we developed the TOPOI-method for classifying different settlement types of similar characteristics, non-regarding administrative boundaries (software and data: Supp Ch. S1). The method consists of four steps: Definition of basic settlement units based on the spatial aggregation of building footprints. Assessment of functional properties of basic settlement units. Assessment of spatial linkages and connectivity between basic settlement units. Synthesis: Classification of the units into TOPOI settlement classes, their description and interpretation.
Step 1: The definition of basic settlement units based on the spatial aggregation of building footprints
In a first step, settlement units were defined on the base of building footprints (Supp Figure 1). A single settlement unit is understood as a cohesively built group of buildings, as opposed to e.g. single buildings or splinter settlements (§ 35(3) 1 No. 7 BauGB; BfJ, 2017). Such settlement units were defined based on two parameters: (a) the maximum distance between buildings, describing the cohesiveness of a group of buildings and (b) the minimum number of buildings within such a cohesively built settlement unit.
To achieve an appropriate grouping of the units, distances between buildings of 10, 20, 40, 80, 120, and 160 m and unit sizes of four or eight buildings were tested (Supp Figure 1). The appropriate grouping was defined as to include all of the built structures of a cohesively built-up area within one surface – the basic settlement unit. Therefore, a set of algorithms of the ArcToolbox (ArcMap 10.6) was applied: ‘Buffer’ created an offset around each building and overlaying outlines of the created buffers were merged by the Boolean operation ‘dissolve’ generating continuous settlement units (ESRI, 2018a).
Working with a minimum of four as the smallest number of buildings to form distinguishable individual settlement units, the algorithm detected most of the smaller isolated buildings, including splinter settlements or small farming structures. In contrast, groups of minimum eight buildings allowed the algorithm to detect larger farming complexes or hamlets. The option of eight buildings was therefore chosen as an appropriate minimum number of buildings within one settlement unit to avoid detection of splinter settlements, isolated buildings or building groups.
The distances of 40 and 80 m proofed suitable, since they grouped settlements and their sub-quarters despite a porous land uptake, e.g. through dispersed green spaces, bigger squares, wider streetscapes, or the required building distances between higher buildings or structures (Supp Figure 1(c) and (d)). As basis for the TOPOI-method, we finally selected 80 m as an appropriate distance. This allowed to depict cohesively built up settlement units divided by wider infrastructures such as highways, railway tracks or open landscape.
Then, the form of the identified settlement units was described based on geometric properties, including area, perimeter, compactness, building density and open space ratio, etc. (Table 1). These analytical steps resulted in identification of intermediate settlement units based on geometric properties. Following, they were integrated into a geospatial database.
Step 2: Assessment of functional properties of basic settlements units
In order to determine the type of use of buildings within a settlement unit, geospatial data with a corresponding accuracy level were employed (LGLN, 2016a). The ALKIS dataset (LGLN, 2016b) was used to retrieve information on the use of buildings (Supp Table 1). A set of properties was calculated for each basic settlement unit defined in step 1. The relative area share of each function was determined (Table 2), whereby the number of functions within one settlement unit indicates its functional richness (Ritsema van Eck and Koomen, 2008).
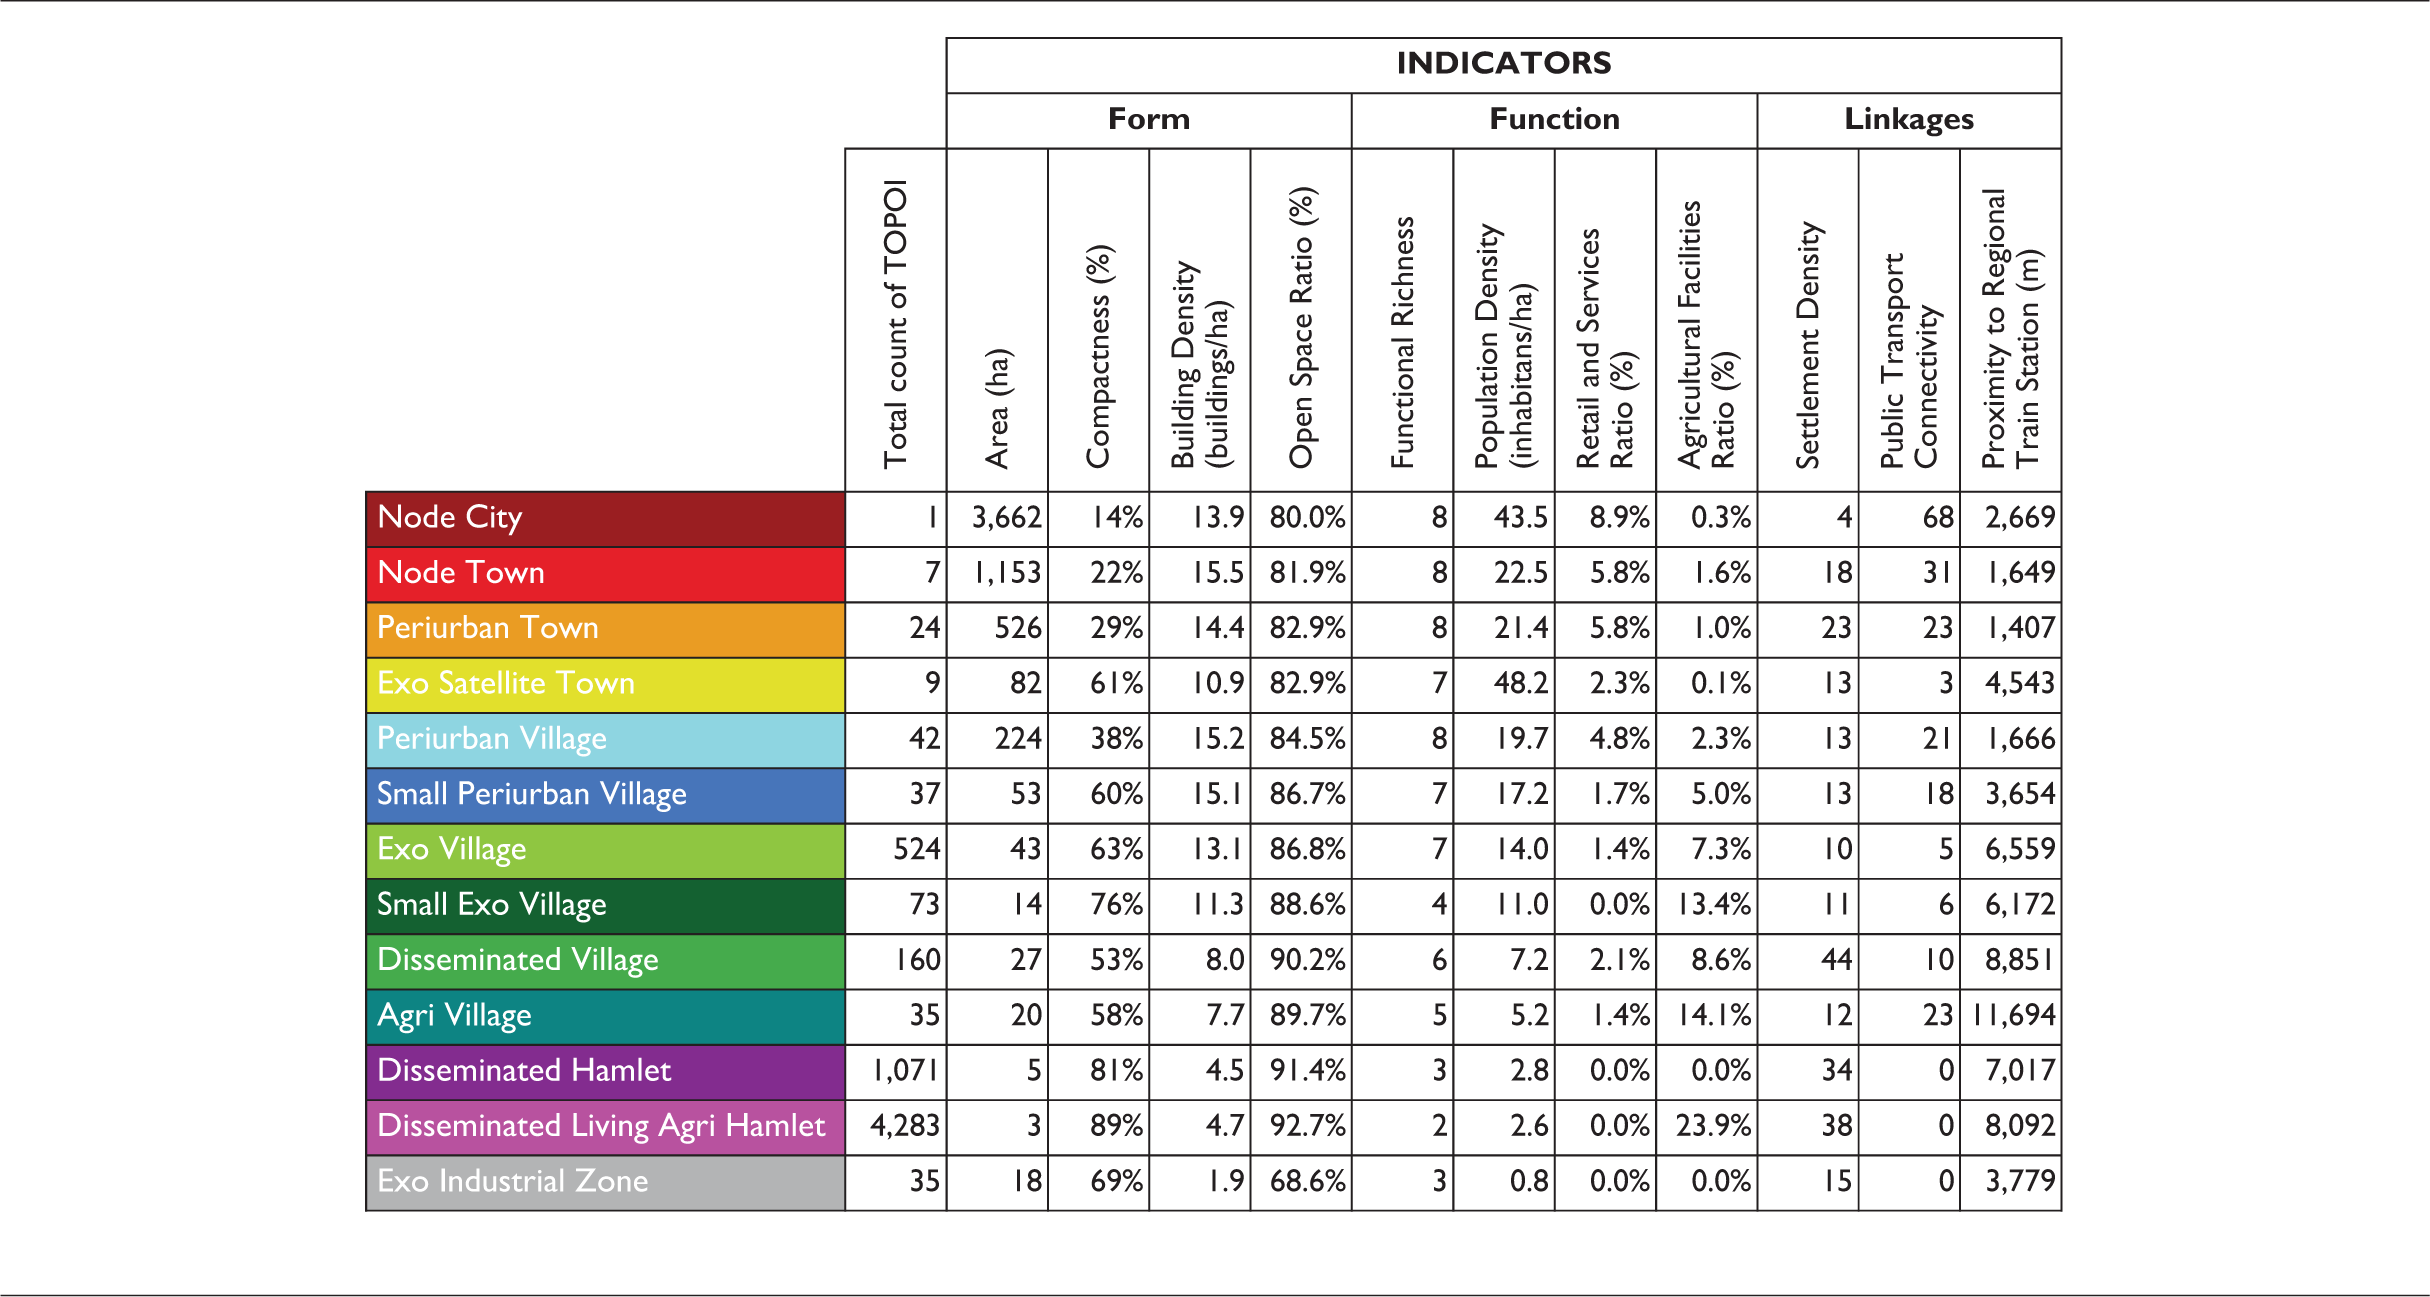
The TOPOI-classes for the two study regions in Lower Saxony (Germany) and the median per indicator.
Step 3: Assessment of spatial linkages and connectivity of basic settlement units
Spatial interrelations between different settlement units and their connectivity are of great interest, since they can depict urban–rural linkages. Accessibility is considered an important indicator for connectivity, and therefore daily routines. In our understanding of accessibility, not only the geographic distance between settlement units plays a role, but also the modality by which a place is connected. Another indicator of spatial interlinkages is the proximity of each settlement unit to neighbouring ones.
Two analyses were carried out on the accessibility and connectivity of each settlement unit. First, we determined the shortest distance between a regional train station and the centroid of each basic settlement unit along the street network (BKG, 2012b; Deutsche Bahn, 2013, 2016) (Supp Figure 3). Second, the quality of the local public transport network was assessed, based on the reachability of each settlement unit, e.g. bus or tram, without interchange (Connect, 2019).
Furthermore, to describe spatial proximities in the network, we carried out a location analysis (ESRI, 2018a) determining the number of settlement units within a 3 km radius, coinciding with an area where daily goods and services should be easily accessible (BBSR, 2010; Christaller, 1933). The result (Supp Figure 4) shows the density of settlement units within a certain area. The corresponding degree of proximity or dispersion, we used for the differentiated description of the urban–rural gradient.
Step 4: Synthesis: Classification of basic settlement units and description of TOPOI settlement types
In steps 1 to 3, the basic settlement units were identified with respect to three properties: physical form, function, and spatial linkages. The intermediate results provided the basis for their classification into clusters. Although the settlement patterns in the two study regions showed some recognisable patterns in the cartographic representation, the overall picture was still difficult to theorise. In particular, if attributes attached to the settlement units needed interpretation, using an additional method of depicting patterns was necessary. The collected attributes of each analysis category (form, function, spatial linkages) were therefore used to generate an appropriate set of indicators relevant for the classification of possible TOPOI-classes.
The classification of settlement units of similar characteristics (TOPOI-classes) was realised by applying the clustering algorithm ‘affinity propagation’, which considers the dissimilarity of units and gradual changes in dissimilarities (Frey and Dueck, 2007). In contrast to other clustering approaches, it has the advantage of not requiring to determine the final number of clusters beforehand, thus providing open and unbiased results. As an important step in the procedure, the algorithm identifies exemplary cluster members, so-called exemplars. We utilised the ‘apcluster’ algorithm implemented in the ‘apcluster’ package (Bodenhofer et al., 2011) in R (R Core Team, 2018). Two parameters in the algorithm determine the resulting number of clusters. The first parameter r is the exponent of the negative Euclidean distance matrix. We set r to 2 in order to cover the dissimilarity gradient between the smallest and largest settlement patches appropriately. The second parameter q, we set to 0.5 to yield a feasible number of clusters. The number of clusters was additionally reduced after applying the clustering algorithm by pruning the resulting dendrogram at a certain dissimilarity value (Supp Figure 5).
For identifying the TOPOI-classes, we applied 11 parameters of physical form, function, and spatial linkages – all used in planning – as indicators for affinity propagation clustering (Table 1). The finally defined ‘exemplars’ were specific settlement units that can be seen as average exemplary settlements characterising certain settlement types or TOPOI-classes (Figure 5).
Results
Affinity propagation identified 46 clusters within the 6301 settlement units (Carlow et al., 2020) based on eleven indicators (Table 1). Figure 3 shows how the 46 clusters were combined by pruning the dendrogram that resulted from AP clustering at the dissimilarity value of –3.9. We yielded a feasible and interpretable set of 13 TOPOI-classes. The figure is derived from the dendrogram, but it is focussed on the settlement grouping and therefore it is not completely structured by the dissimilarity on the y axis. The resulting 13 TOPOI-classes were named and described according to their most specific features (Figure 5 and Supp Table 2).
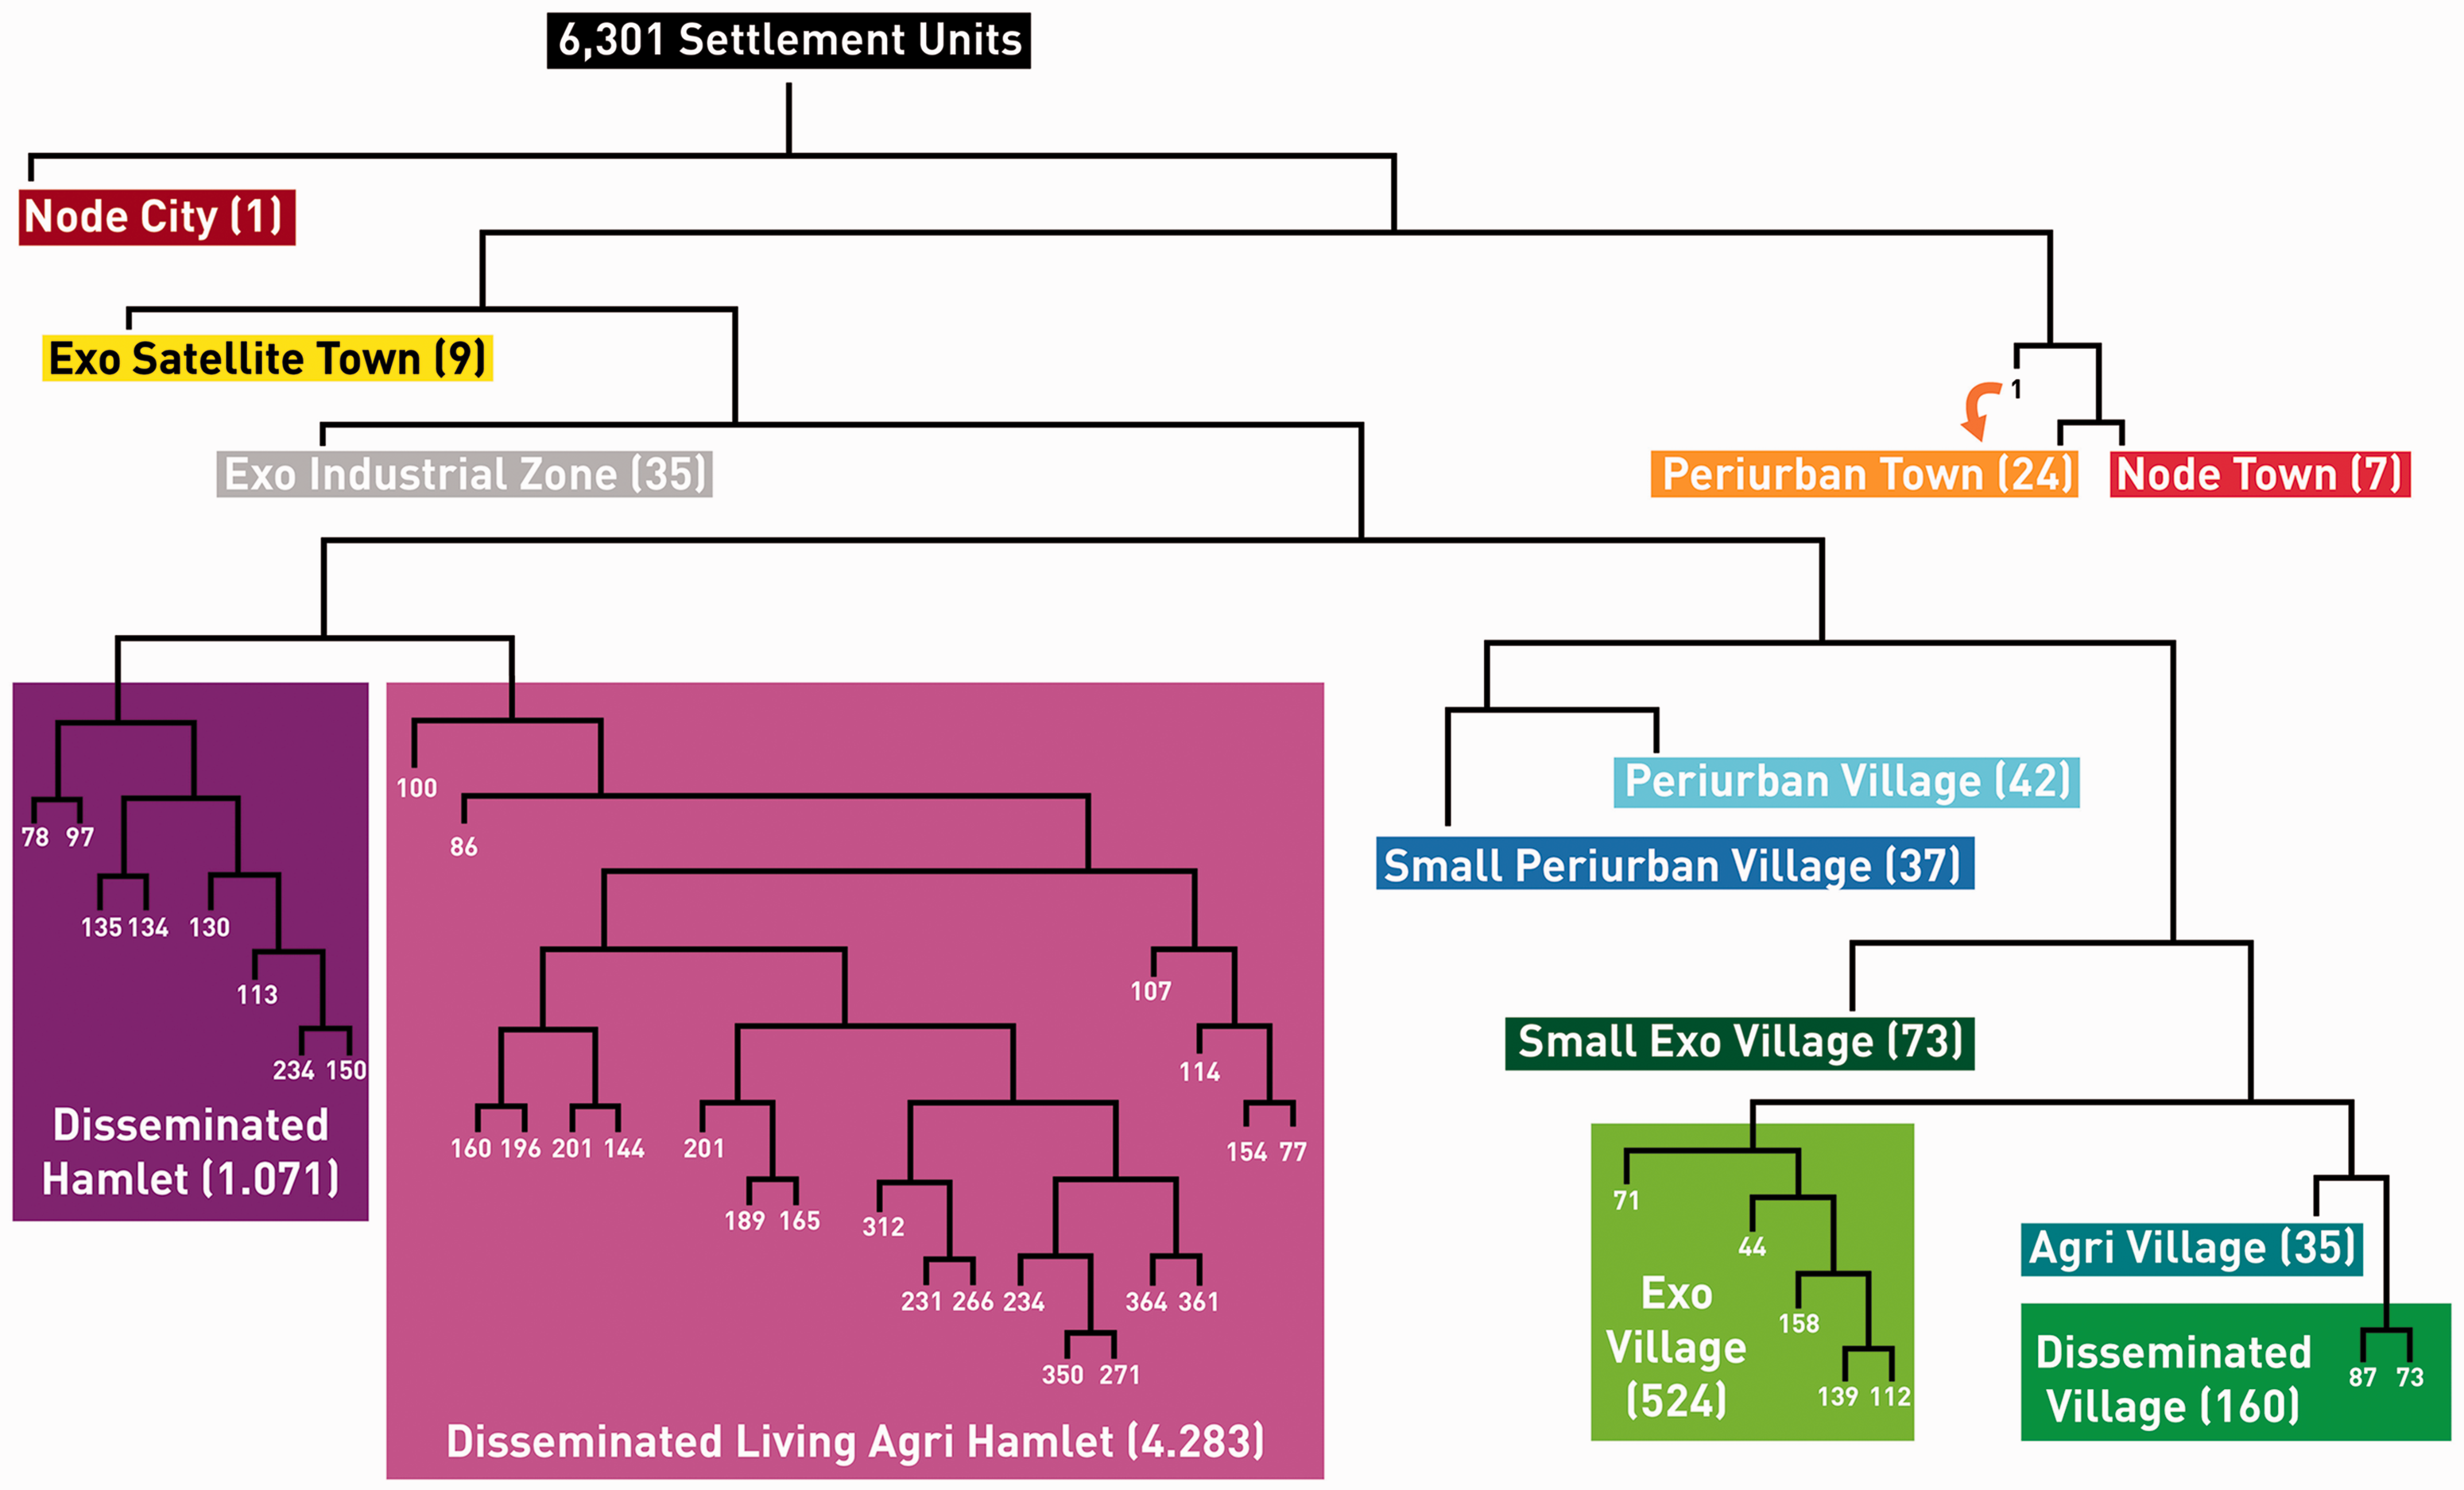
Grouping of 46 settlement clusters based on the dendrogram yielded by affinity propagation clustering. The 13 identified TOPOI-classes are distinguished by colour. The y-axis does not give dissimilarity values in order to yield a readable figure. Numbers in brackets give numbers of settlements included in the settlement type. The branch to the cluster of Periurban and Node Town delivers one exceptional case: The settlement unit containing Braunschweig's main railway station has a PTC of 76 – all other indicators are in line with the Periurban Town, so this settlement unit has been classified as such.
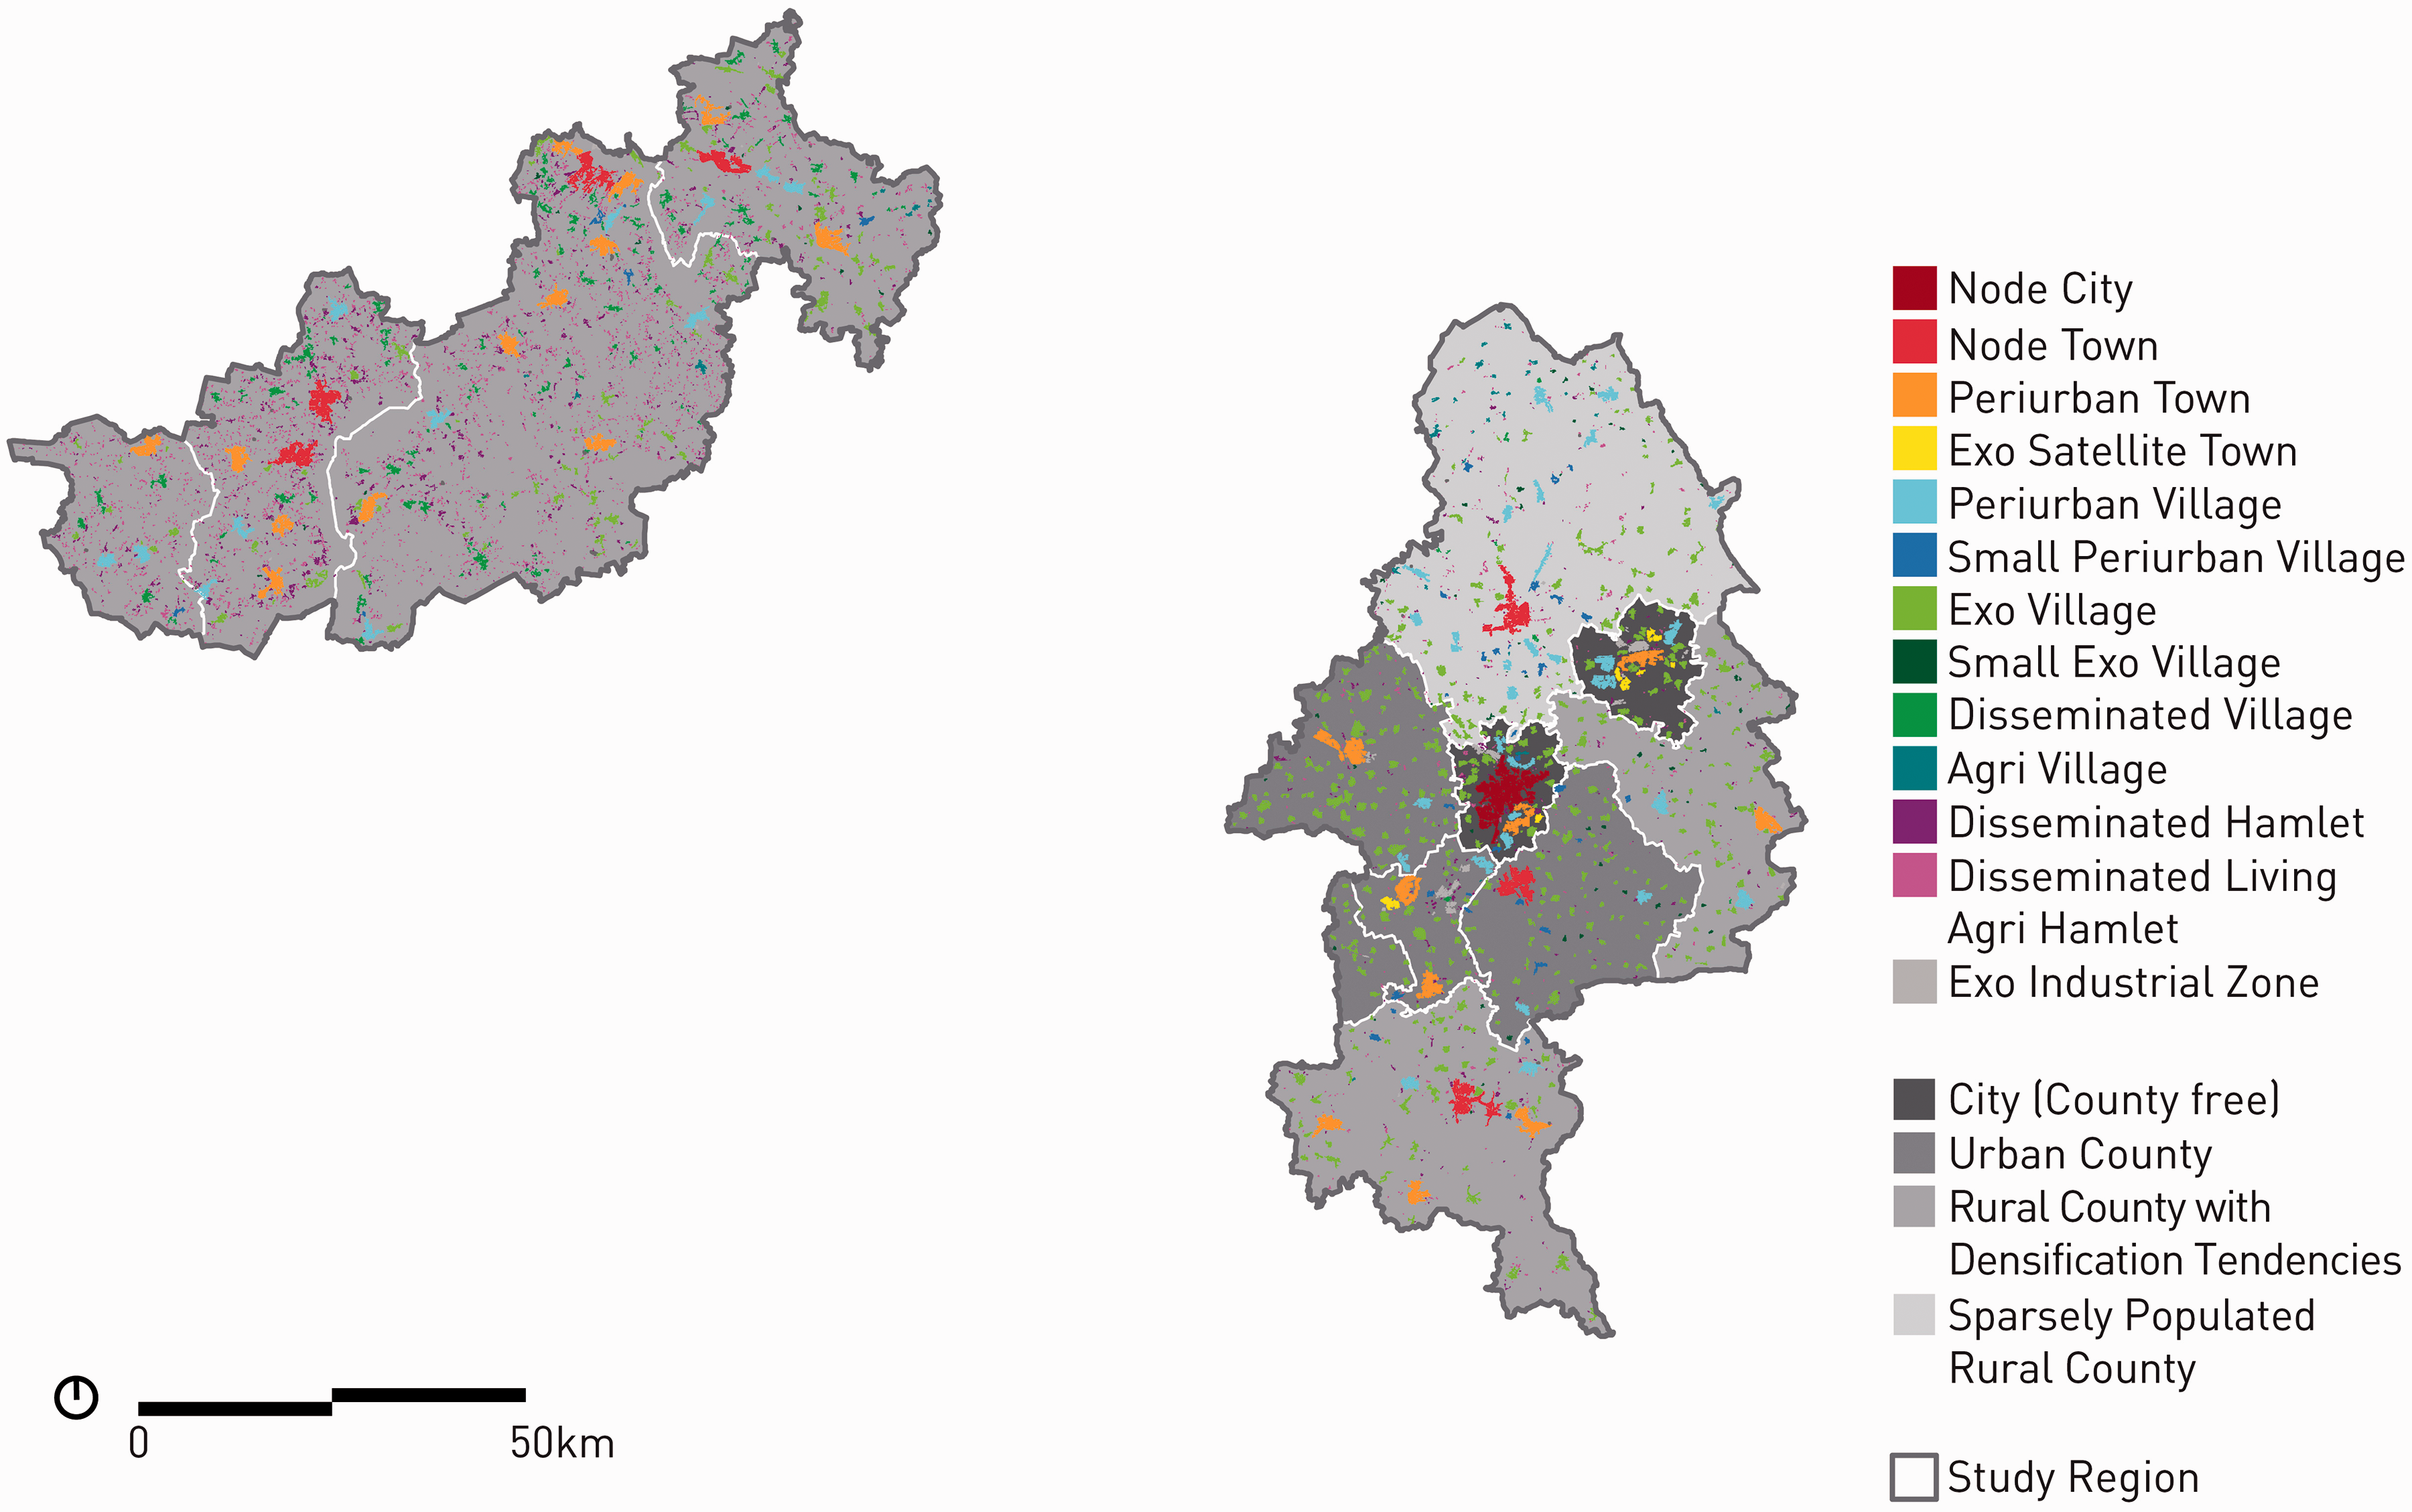
In the two study regions, 13 different TOPOI settlement types were detected, describing settlement patterns along the urban–rural gradient (Figures 4(a) and (b) and 5). The results of the TOPOI-method are best understood in contrast to the classification of settlement patterns based on established planning categories (Figure 6).
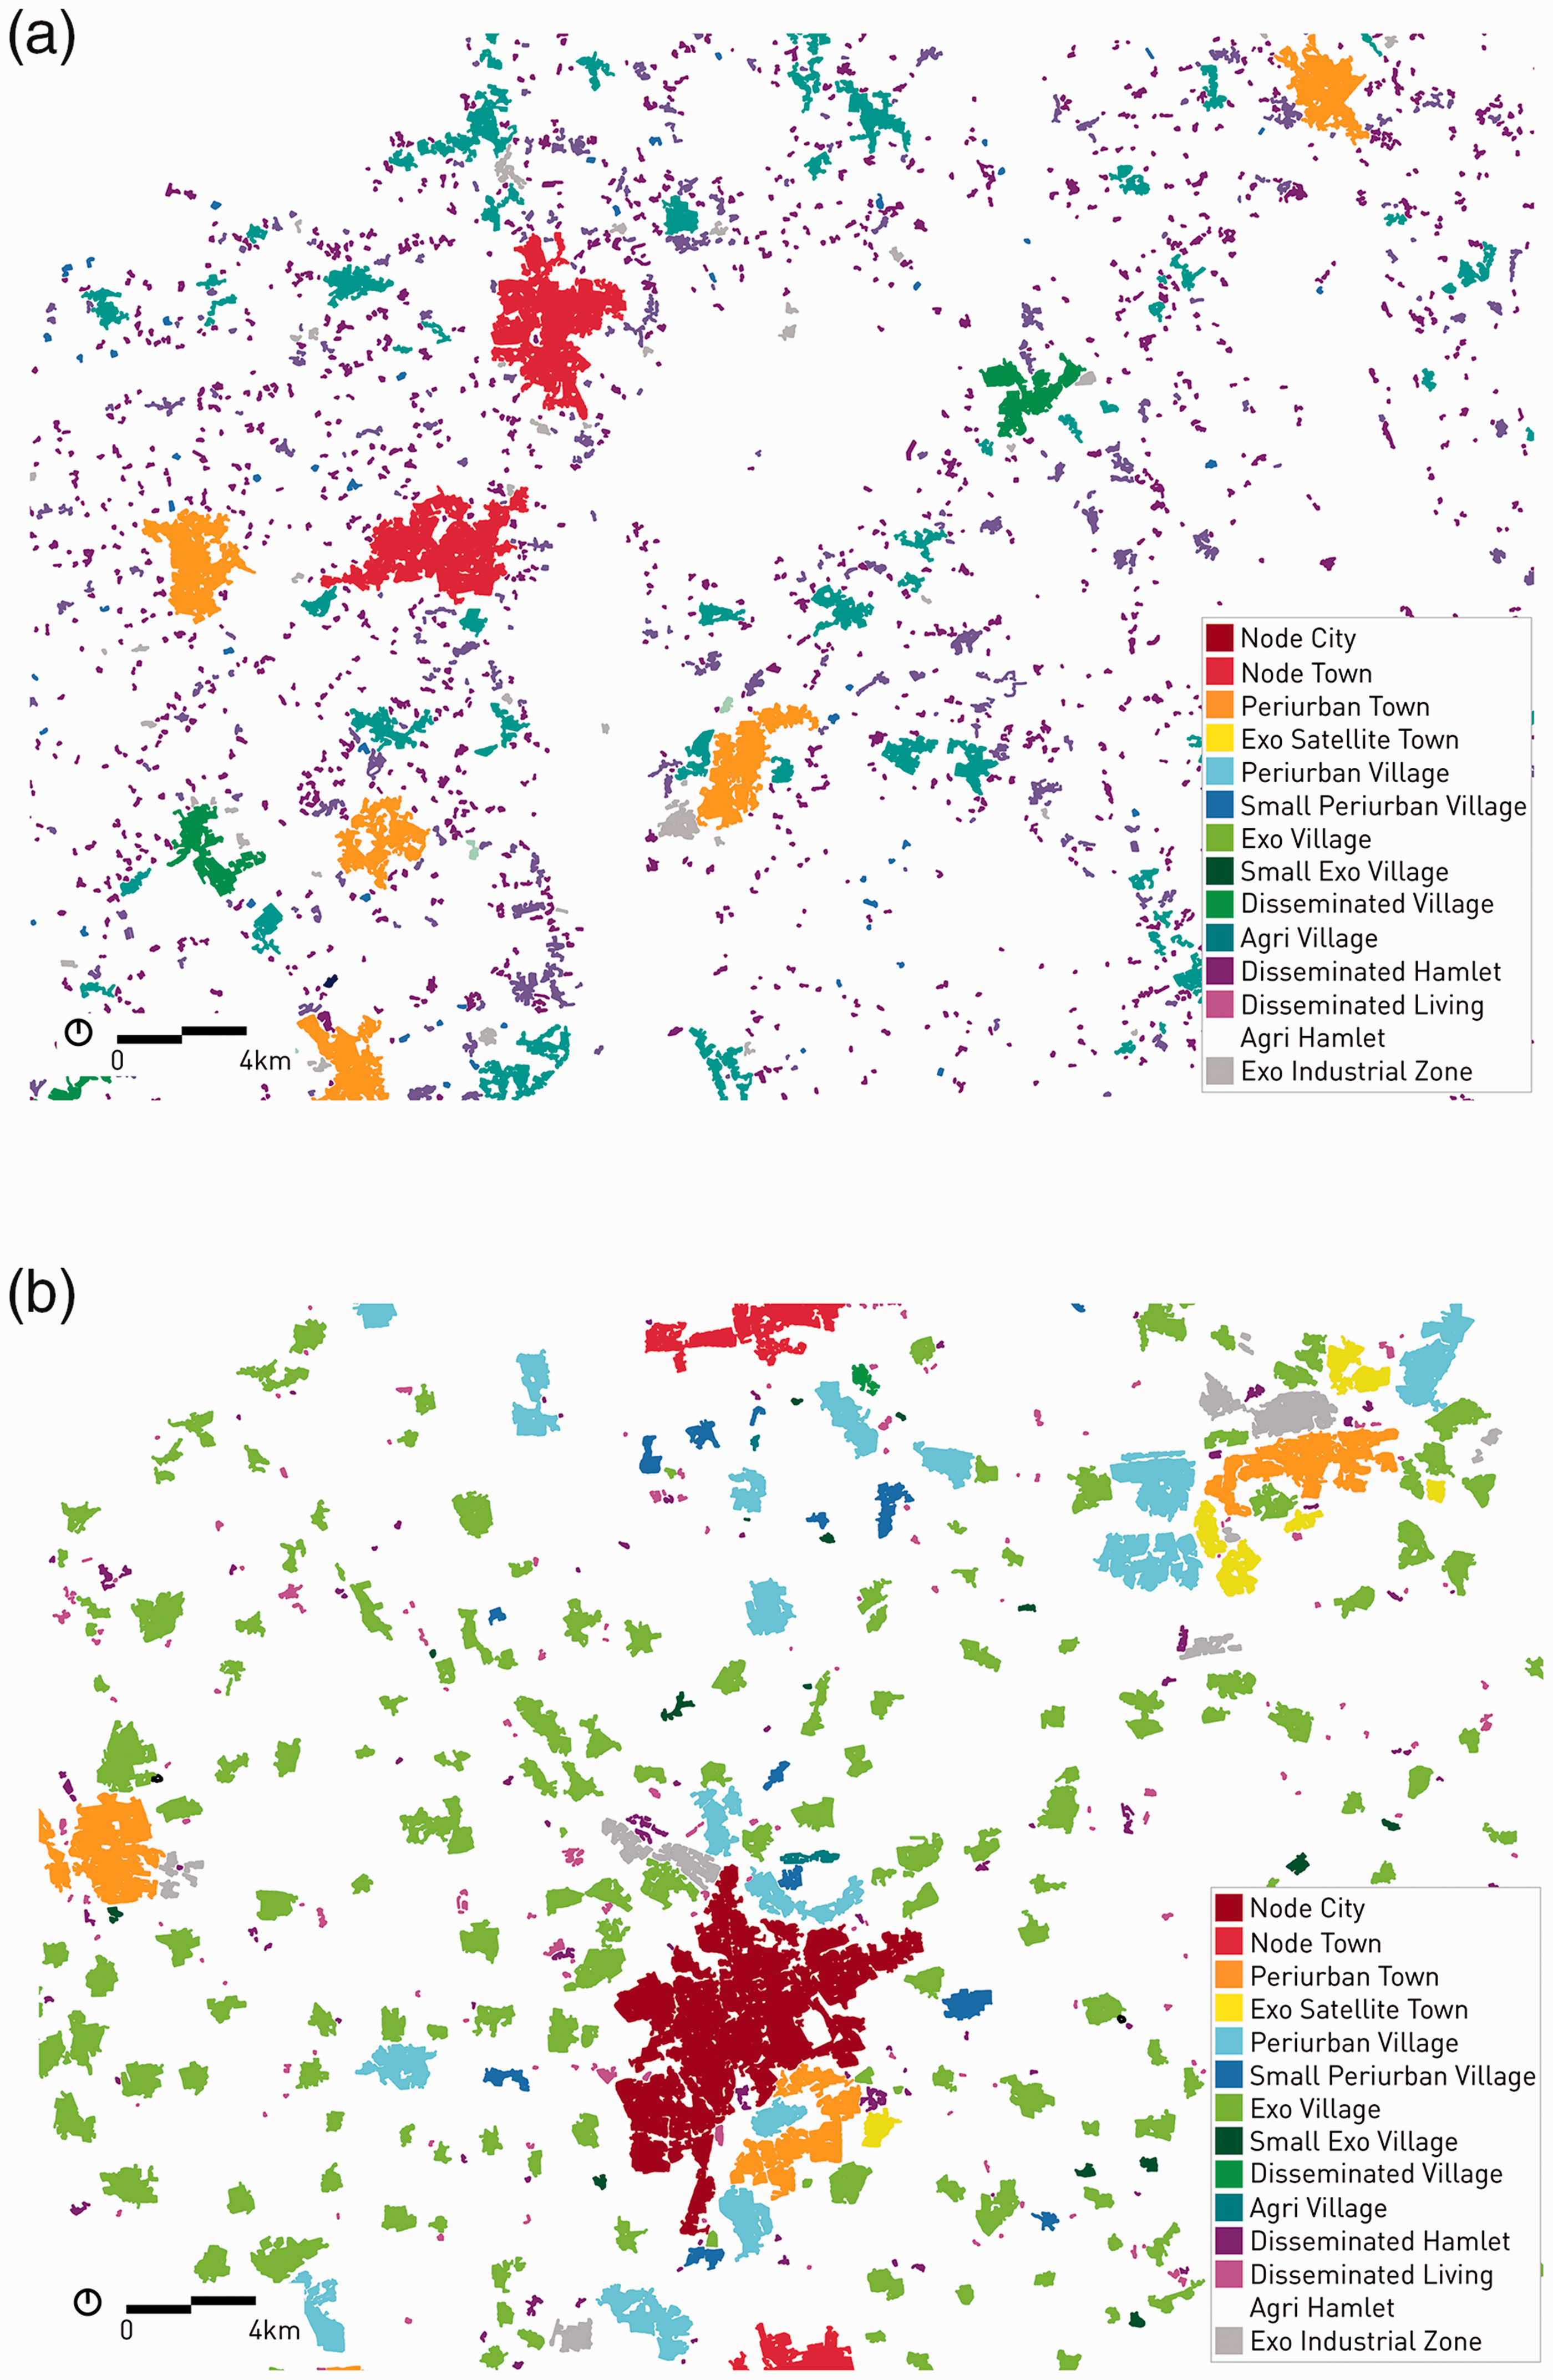
(a) TOPOI classification of settlement units in region A (Vechta–Diepholz-Verden, detail). (b) TOPOI classification of settlement units in region B (larger Braunschweig region, detail).
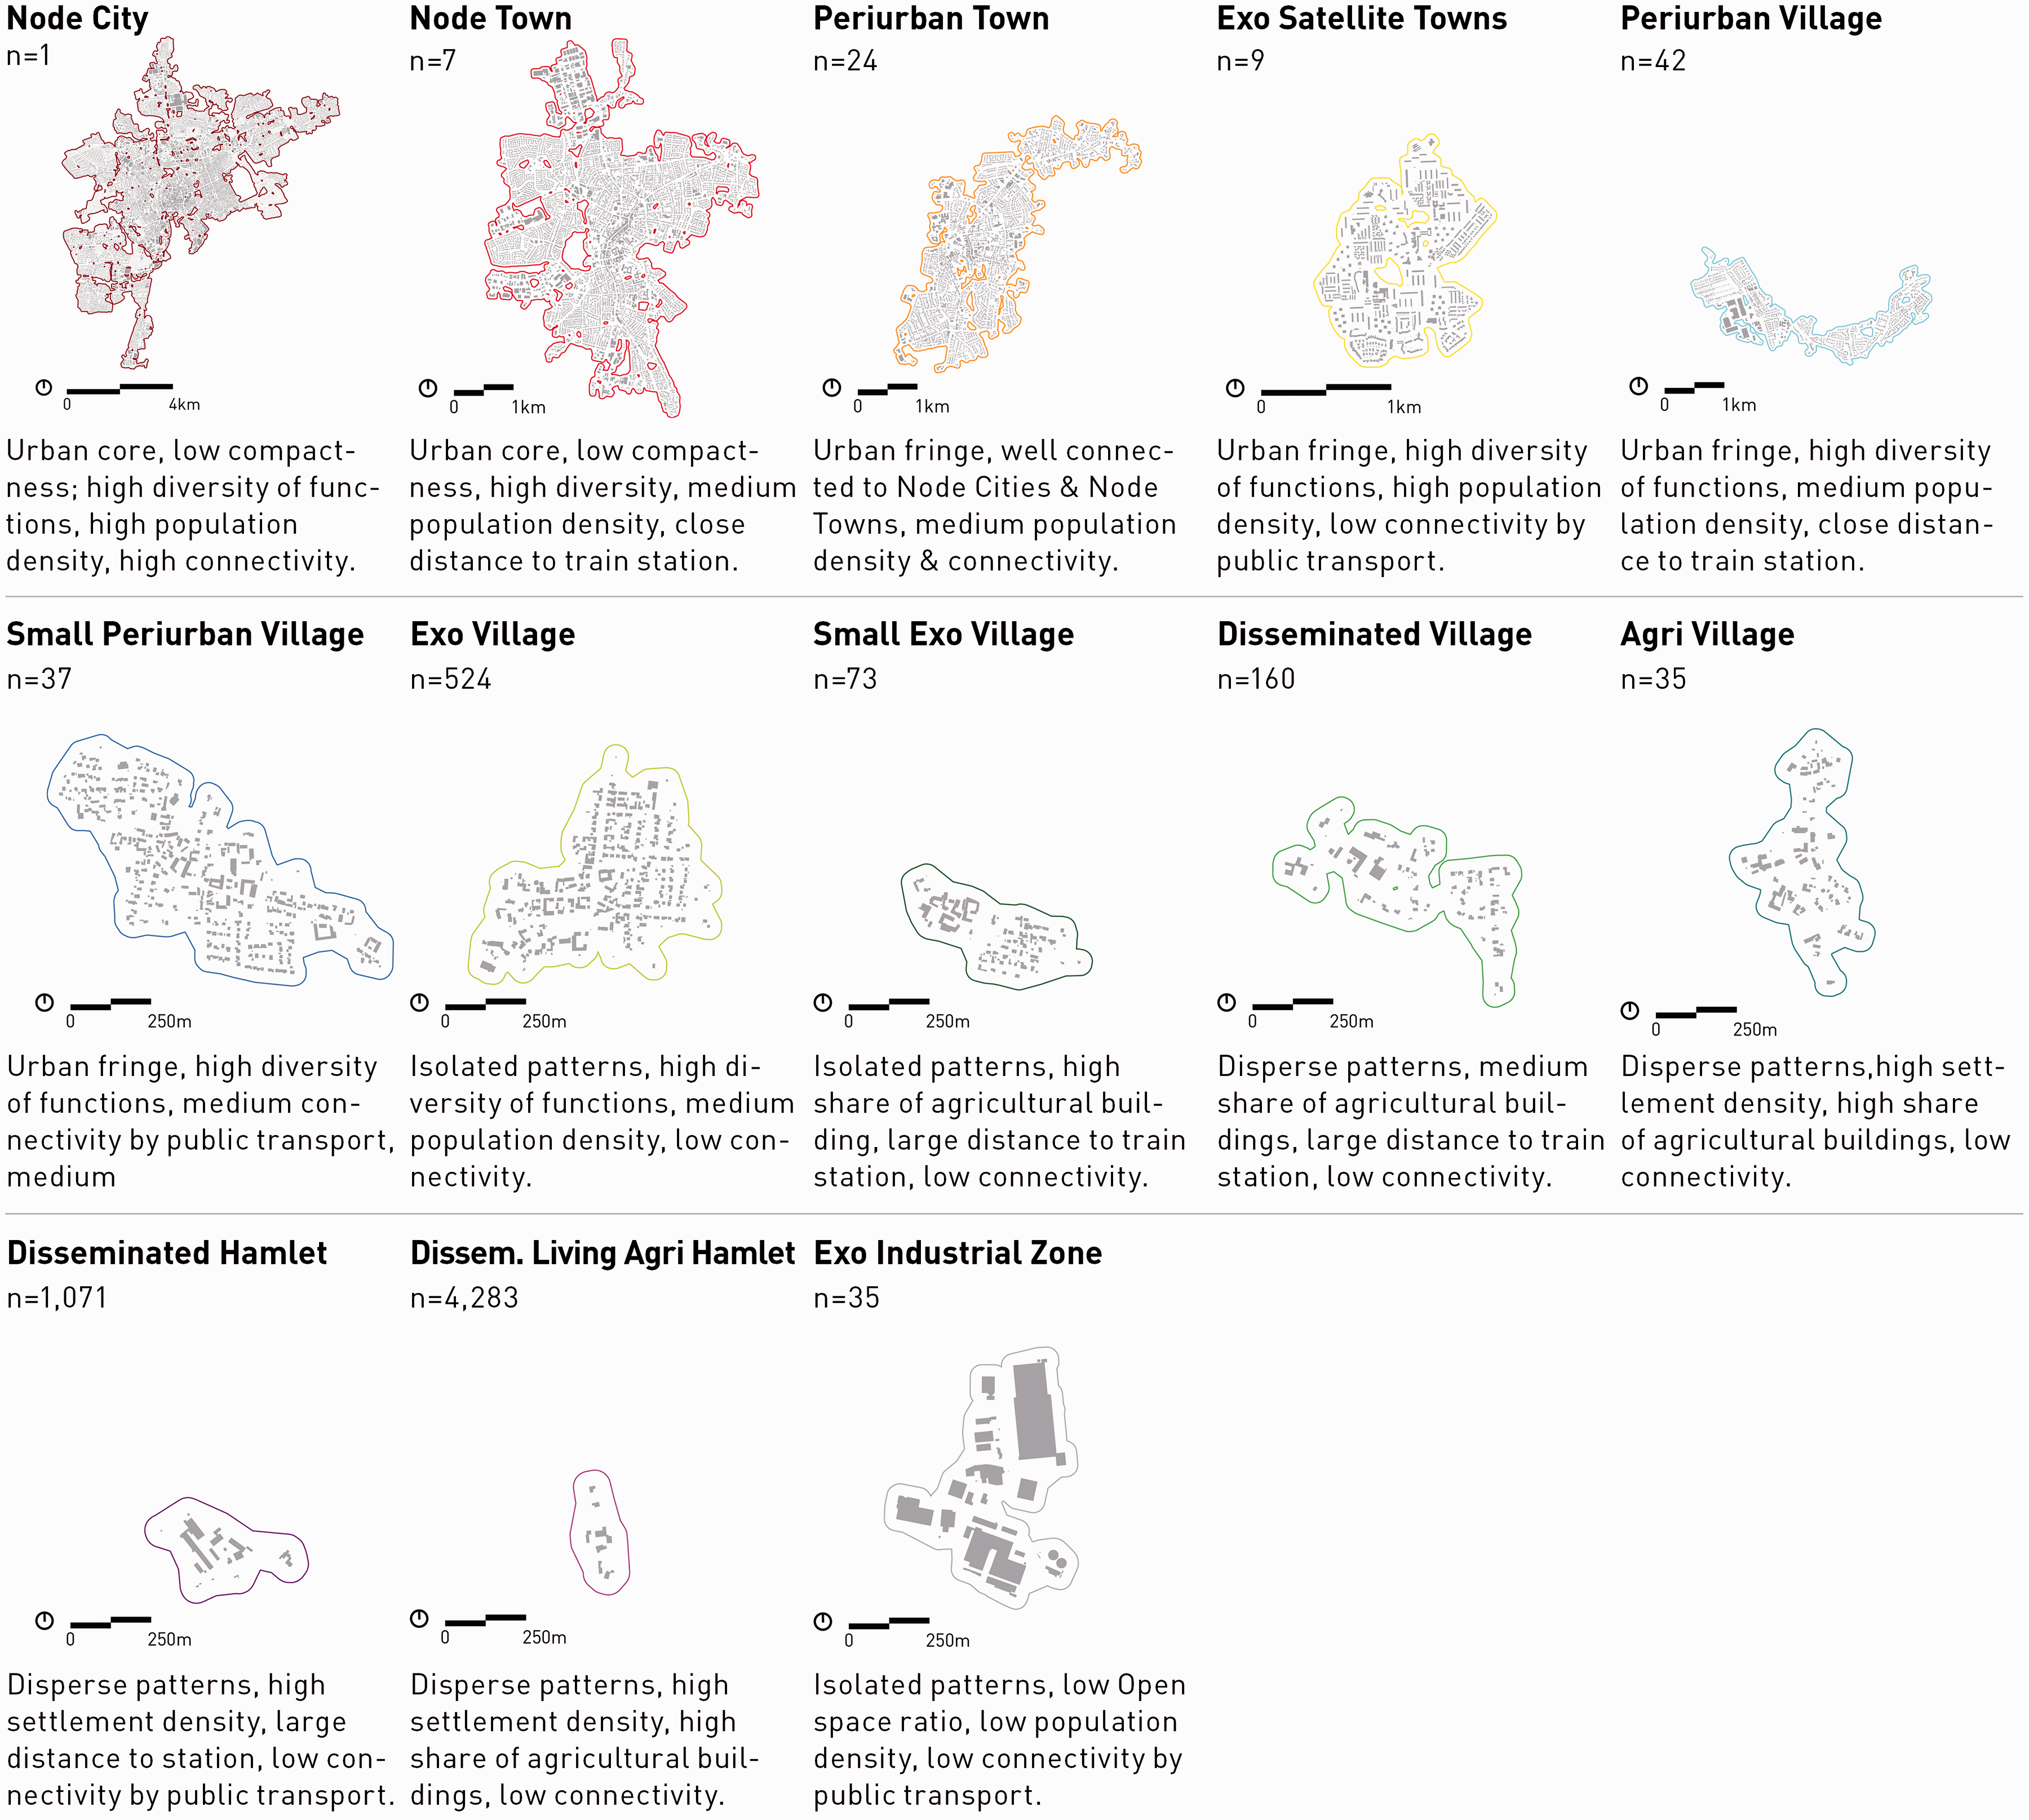
Thirteen TOPOI exemplars identified in the two study regions. The given result from affinity propagation clustering.
Superimposition of the results of two classification methods: counties of the Spatial Development Report 2017 (BKG, 2012b) and TOPOI classification of the settlement units in both study regions (see Supp Tables 3 and 4 for comparative distribution).
The TOPOI analysis shows that the urban–rural gradient, based on the precisely described TOPOI-classes is much more detailed (Figure 4(b) and 5) than the established classification method of BBSR (Figure 2). Moreover, the location of settlement units and their connectivity vice versa others allows differentiating more urban and rural categories – such as EXO (isolated patterns), DISSEMINATED (disperse patterns), PERIURBAN (urban fringe), NODE (urban core). This shows that the urban–rural gradient consists of very different settlement types.
The superimposition of the results of the two classification methods thus shows a differentiated picture (Figure 6). With Node Towns, Periurban Towns and Exo Satellite Towns, urban settlement types with a comparatively high population density can be found in areas described as rural by the traditional classification. The town of Gifhorn, for example, identified as TOPOS ‘Node Town’ is situated in the BBSR category ‘Sparsely Populated Rural County’ (Supp Figure 7(a)). On the other hand, ‘City’ and ‘Urban County’ of the traditional BBSR classification system (BBSR, 2018) contain TOPOI that are strongly linked to core cities, but still show more rural characteristics (Periurban Village, Small Periurban Village, Exo Village). The administrative region of the city of Wolfsburg, for example, is categorised by the BBSR as ‘City (county free)’ (Supp Figure 7(b)). However, it contains several different TOPOI-classes with rural characteristics: Exo Villages, Disseminated Hamlets and Disseminated Living Agri Hamlets. The example of the Exo Village shows a high number of unconnected settlement units in the vicinity of Node Towns. In contrast, the Periurban Town is showing that the ‘urban’ is expanding geographically, with settlements that are well connected and accessible. The Disseminated Living Agri Hamlets indicate the urbanisation of the countryside with finely dispersed and evenly spread settlements (Supp Figures 4 and 8).
Discussion
Known planning parameters were used to develop and test the described TOPOI-method. It is built on the analysis of real physical spaces and buildings as the smallest analysis unit, while established methods largely rely on the administrative entity as smallest unit for analysis. Therefore, the TOPOI-method provides a finer-grained understanding of urban–rural settlement types than traditional classifications.
Open to adapting the equally weighted indicators to other planning contexts or requirements, while maintaining the analysis steps and general parameters, the TOPOI-method is applicable to other regions. However, the resulting TOPOI-classes be regionally specific and exclusive to our two study regions or re-appear in morphologically similar regions, only. Accordingly, the application of the same method to another region may lead to additional or different TOPOI-classes due to differences in settlement patterns, morphology, building law, local standards for public transport or other determining factors.
Our TOPOI approach makes it possible to identify and describe the physical environment, and in our case urban–rural relations on a small or large scale, below or above administrative units. This also allows to trace phenomena and characteristics related to the TOPOI-classes more easily back to their cause. So can the relatively high population density of the TOPOS Exo Satellite Town be explained through the found building structures and housing types. Another example is the indicator of accessibility that is derived from the presence of public transport options. These direct dependencies would be much more difficult to detect if data on administrative level solely was used. Applying the TOPOI analysis for planning and design tasks, such causes and effects could be quickly identified, which many advantages for future planning.
The fact that the TOPOI-method is based on a high spatial resolution, however, comes with the disadvantage that the geodata in steps 2 and 3, which were aggregated to the settlement units, must be available in the same or a higher resolution. When transferring the method to other regions, it might be challenging to access such data with the necessary spatial resolution.
With TOPOI, a classification method was developed that is based on relevant known indicators. The indicators were divided into three categories of form, function, linkages. This selection of indicators had a decisive influence on the classification. In this study all indicators had the same rating. In subsequent studies, different weightings of indicators could be tested with view to their impact on the TOPOI classification. It would also be conceivable to extend this list of categories if a more detailed focus of analysis was required, for example by including dynamic data on population development, social or economic indices.
Overall, the TOPOI-method can be understood as a spatially higher resolved multi-layered amendment to inherited planning classifications, such as that of the BBSR or others presented above. Since the binary differentiation of ‘urban’ and ‘rural’ is no longer conceived helpful in describing settlement patterns, the TOPOI found on applying the method rather help visualising and understanding settlement units in the urban–rural gradient and their linkages. This ultimately allows for a data-driven and highly differentiated understanding of different urban and rural settlement types and their interconnections.
Outlook
The classification of settlement units into settlement types – TOPOI – provides a sound base to integrate other disciplinary data and so open up for interdisciplinary research, further analysis and study. The method is suited to link to other fields in urban research, for example urban structure analysis, economy, transport, or resource planning. One example could be an assessment of public transport provision in relation to population density. There are some TOPOI-classes that have a relatively low population density, but good public transport provision. Here, urban densification could be envisioned. Inversely, some TOPOI-classes have a high population density, but low public transport connectivity. Here improvements could be proposed based on our method. An analysis of the embodied energy of the built environment based on the TOPOI-classes and in relation to mobility could also reveal new insights. On the base of this, interdisciplinary recommendations for the reduction of CO2 could be conceived, taking into account trade-offs of individual measures. Moreover, based on the TOPOI-method we can detect, which settlement type has been developing over which time period in relation to planning paradigms or regulations. This could contribute to the world-wide discourse of reducing land consumption.
As a spatial framework for analysis, the TOPOI-method thereby sets a unifying framework to integrate interdisciplinary perspectives or data. Thereby the TOPOI-method allows for a structured analysis and integrated modelling. The special feature of the method is its potential of an integral consideration of sustainability criteria, especially in the newly detected settlement types that can neither be described as rural nor urban. This would include questions such as sustainable building structures, the smart exploitation of the scarce resource land, sustainable accessibility, ecosystem services, and energy efficiency on various scales – from settlements to regions, topics so far mainly discussed for urban settlement types. Further strategies and planning tools for a sustainable development of settlements set in an urban–rural context based on this approach will be demonstrated in future studies.
Supplemental Material
sj-pdf-1-epb-10.1177_23998083211043882 - Supplemental material for TOPOI – A method for analysing settlement units and their linkages in an urban–rural fabric
Supplemental material, sj-pdf-1-epb-10.1177_23998083211043882 for TOPOI – A method for analysing settlement units and their linkages in an urban–rural fabric by Vanessa Carlow, Olaf Mumm, Dirk Neumann, Anne-Kathrin Schneider, Boris Schröder, Maycon Sedrez and Ryan Zeringue in Environment and Planning B: Urban Analytics and City Science
Footnotes
Data availability
The datasets generated during and/or analysed during the current study are available in the Institutional Repository of TU Braunschweig, doi: 10.24355/dbbs.084-202003180800-0.
Declaration of conflicting interests
The author(s) declared no potential conflicts of interest with respect to the research, authorship, and/or publication of this article.
Funding
The author(s) disclosed receipt of the following financial support for the research, authorship, and/or publication of this article: This work was supported by the Ministry of Science and Culture of Lower Saxony and by the Volkswagen Foundation under Grant ZN3121.
Supplemental material
Supplemental material for this article is available online.
Biographical notes
References
Supplementary Material
Please find the following supplemental material available below.
For Open Access articles published under a Creative Commons License, all supplemental material carries the same license as the article it is associated with.
For non-Open Access articles published, all supplemental material carries a non-exclusive license, and permission requests for re-use of supplemental material or any part of supplemental material shall be sent directly to the copyright owner as specified in the copyright notice associated with the article.