
Abstract
Gentrification, displacement and social exclusion are hot topics of debate in the city of Amsterdam, the Netherlands. A current phenomena is short-term rentals of private homes. In its peer-to-peer form, this phenomena has grown sharply, facilitated by services such as Airbnb. Its growth has caused controversies among communities in touristic areas of Amsterdam, since it contributes to a changed social fabric, increased housing prices and overall gentrification. In the Netherlands and elsewhere, municipal and national policy makers are interested to regulate short-term rentals. In order to provide insights into qualitative policy effects, we develop a micro-level agent-based simulation. Our spatial model simulates residential migration based on income and house pricing. The underlying economic theory is that of Smith’s rent-gap hypothesis. Our model is among the first agent-based approaches investigating this type of rental market, and the first to model a specific housing market, including social housing, in a geographically accurate way. Simulation analysis shows that the touristic rental market has caused considerable changes in housing prices and population development. We find that more lower income citizens remain in the city centre when regulation of the market is stronger, and that banning the touristic market restrains the overall increase in house prices, compared to the business-as-usual scenario. However, the feasibility of enforcement of regulation, and its libertarian consequences, must be considered.
Introduction
The capital of the Kingdom of the Netherlands, Amsterdam, is the cosmopolitan centre of the Randstad megalopolis. From 2013 until 2020, Dutch house prices moved relentlessly upwards, to the point where Amsterdam ranked in the least 10 affordable cities worldwide (Knight Frank, 2019).
In 2004, installation of the iconic ‘I am Amsterdam’ signage launched a tourism drive. By 2018, the city’s compact historical centre of 850,000 inhabitants was visited by 8 million tourists annually, and, with the municipality’s tourism policy changing, the signage was removed. During this period, the peer-to-peer short-term rental market became mainstream through the Airbnb platform. The concept of this ‘touristic rental’ fitted perfectly with Amsterdam: locals could rent a room or even a whole apartment to tourists, earning money in a city where accommodation remains in high demand.
Already by 2018, gentrification, displacement and social exclusion were hot topics of debate in Amsterdam. In light of this debate, the municipality has been attempting to increase regulation of touristic rentals. Despite its conveniences, the growth of services such as Airbnb causes controversies, since it contributes to a changed social fabric and the ‘touristic overrun’ of the city (Henley, 2020), and to increased housing prices and overall gentrification (Wachsmuth and Weisler, 2018). As Furukawa and Onuki (2019) survey from 17 cities, a slew of approaches to regulating the touristic rental market have come from various policy objectives and found varying success.
Gentrification and neo-liberal reforms in the (Amsterdam) housing market have been studied thoroughly, for instance, by Boterman and colleagues (e.g., Savini et al., 2016) and by Musterd (2014) and Kadi and Musterd (2015). Some authors have fiercely criticized Amsterdam’s gentrification (Uitermark, 2009; van Gent, 2013). Other literature describes Amsterdam as a ‘just’ or ‘ideal city’ (Gilderbloom et al., 2008; Kadi and Musterd, 2015), but even from this literature it is clear the affordability of housing is not something to be taken for granted. This motivates focused study on the touristic rental market.
Our methodological lens to study the ‘Airbnb effect’ on Amsterdam – and to provide insights into qualitative policy effects on the regulation of short-term rentals – is a micro-level agent-based simulation. The agent-based modelling (ABM) we develop is grounded in data. In contrast to Vinogradov et al. (2020) our model is geographically accurate, and is based on Smith’s rent-gap hypothesis rather than a real estate market model. Using the ABM, we analyse retrospectively the policies being considered by the Amsterdam municipality as of 2018, concluding that tighter limits, on the amount of nights a property can be listed on Airbnb, is preferable to an outright ban.
This article advances the state-of-the-art over the literature by, first, modelling the unique characteristics of Amsterdam’s residential housing in an ABM. Second, we develop the first such GIS-based spatial ABM rent-gap model for touristic rentals. Third, we analyse policy interventions, taking into account social housing as well as short-term rentals. While calibrated on Amsterdam, our modelling approach is generic. Further, in incorporating economic and cultural principles, as well as a data-driven approach, we connect the ABM with social theory and observed practices (O’Sullivan and Haklay, 2000).
Literature review
Touristic rentals
The rapid growth in a decade of touristic rentals – a growth exemplified by Airbnb – has come, it is argued, from a void of regulation (Interian, 2016). While Airbnb has brought societal benefits, political attention is drawn to its disturbing effects on urban dynamics and house prices, its side-stepping municipal taxation and its restriction on the long-term housing supply (Furukawa and Onuki, 2019; Interian, 2016; Wachsmuth and Weisler, 2018).
Gant (2016), for instance, speaks of the ‘collective displacement’ of citizens from Barcelona’s touristic centre. On the one hand, this arises because touristic rentals bring to the short-term market properties not previously rented (Guttentag, 2015). In the case of Amsterdam, sometimes these are properties that may not be legally rented in this way (such as social housing which may not be sub-let). On the other hand, the properties offered on the short-term market would otherwise be available on the regular long-term rental market (Wachsmuth and Weisler, 2018).
The empirical evidence continues to mount. Picascia et al. (2017) analyse touristic rentals in Italian cities and finds the majority of listings are whole homes (as opposed to just singular private or shared rooms) and that the majority of Airbnb revenue goes to wealthy home owners or investors, that own more than one property. Using USA country-wide data, Barron et al. (2017) find that Airbnb has a positive impact on house prices and rents, and that ‘while the total supply of housing is not affected by the entry of Airbnb, Airbnb listings increase the supply of short-term rental units and decrease the supply of long-term rental units’. Cocola-Gant and Gago (2019) examine the case of Lisbon and find a buy-to-let investment economy rather than a sharing economy, with the result of displacement of long-term residents.
In light of the effects of the Airbnb business model, regulators in cities across the world have grappled with regulation of the short-term rental market (Furukawa and Onuki, 2019). The now extensive body of scholarly literature on the ‘Airbnb effect’ is summarised by Guttentag (2019).
Regulation of touristic rentals have, as Interian (2016) point out, been founded more on trial-and-error than on empirical models. The various policy measures range from a complete ban (e.g. China) to taxation (e.g. London) to licensing (e.g. Berlin) to limiting the duration of listings (e.g. Amsterdam, as discussed below). Furukawa and Onuki (2019) hypothesise that ‘regulation tends to be stricter in cities where the lodging industry contributes to the local economy to greater extents’ or where citizen or political criticism of Airbnb is louder. Both of these are true for Amsterdam.
Agent-based modelling
ABM is a methodology that simulates the behaviour of individual actors in a social–technical context (Chappin et al., 2019). In contrast to traditional tools, such as equation-based modelling with a set of dynamic equations, or aggregate-level modelling such as system dynamics models, ABM re-creates and predicts the appearance of complex phenomena. Contemporary ABMs capture social constructs such as institutions and norms (Mercuur et al., 2019), and find use in policy exploration (Feitosa et al., 2012).
Vinogradov et al. (2020) adopt ABM to study Airbnb in Norway. Their model blends a short- and long-term equation-based model of the residential housing market, with an abstract ABM of a city. The authors conclude that moderate local taxation is the preferable policy approach.
The work of Vinogradov et al. is a rare example of quantitative computational modelling of the sharing economy in this setting. Most works provide evidence from case studies (e.g. Törnberg and Chiappini, 2020; Yrigoy, 2019; Zou, 2020): while valuable, from these one cannot explore what-if policy scenarios, which indeed is a strength of ABM (van Dam et al., 2013). In contrast, other works that adopt theoretical or equation-based models, such as Li and Srinivasan (2019), cannot capture behavioural factors at the individual level.
Other authors have used ABM to study varied aspects of urban systems (e.g. Ghandar et al., 2019; Huang et al., 2014; Roy and Lees, 2020), including gentrification (Torrens and Nara, 2007), and questions in urban planning and geography (e.g. Crooks et al., 2018; Huynh et al., 2015; Johnson and Sieber 2011). Ligtenberg et al. (2001) uses ABM to study land use modelling in a Dutch city. Researchers have also successfully used ABM to model rent-gap theory (Picascia and Yorke-Smith 2017) – the economic model that we adopt.
Municipality of Amsterdam
Amsterdam is the largest city in the Netherlands. Its population at the time of writing is 850,000 in the municipal boundary and 2,500,000 in the metropolitan area. In 2018, tourist nights were 19.9 million, of which 2.7 million were via the touristic rental market (Fedorova et al., 2019).
Data on the spread of Airbnb show the platform became mainstream in Amsterdam from approximately 2011 (Dwarshuis, 2017). In 2018, the municipality estimated 80% of touristic rentals were through Airbnb, with approximately 29,000 unique listings (Fedorova et al., 2019). The share of Airbnb listings relative to the housing stock was 7%.
Perhaps due to the intensity of tourism in the city, the municipality of Amsterdam was early in regulating Airbnb. From the beginning of 2017 up until the time our research commenced in 2018, Amsterdam was limiting the maximum number of nights a property could be thus rented to 60 nights in a year. By that time the city’s municipal council was considering new by-laws to tighten this limit. Some wanted to ban touristic rentals outright. The informal renting of social housing property, which has a different status in Dutch law than regular housing, was another concern.
This motivates our main research question: in the case of Amsterdam, can ABM give insight to policy makers about the implications of alternative regulation measures on the short-term tourist rental market? While calibrated on Amsterdam, our modelling approach is generic.
Rent-gap theory
The RGT is a supply-side approach to housing investment, conceived as a model for studying gentrification (Smith, 2002). The rent gap is the difference between the actual (current) economic return from land, and the maximum potential return if the land were put to its ‘highest and best use’ (Smith, 1979). The rent gap is due to the progressive decline in maintenance condition which properties undergo, together with changes in technologies which render dwellings obsolete. Restoration or rebuilding increases the economic return that a portion of land or a dwelling generates, bringing it to the maximum possible according to the theory. The locations with the highest difference between actual and potential economic return will be the ones more likely to attract investment capital. As a supply side theory, RGT contrasts with Ley’s (1978) social restructuring theory.
Several authors study the rent gap through simulation models of varying realism. O’Sullivan (2002) developed a simple cellular automaton. Diappi and Bolchi (2008, 2013) were the first to develop a full ABM, using it to study housing market dynamics and gentrification in Milan, Italy. The ABM of Picascia et al. incorporated demand as well as the supply sides (Picascia et al., 2014, 2015; Picascia and Yorke-Smith, 2017). These authors studied Manchester, UK; and Beirut, Lebanon with migrant flows.
Wachsmuth and Weisler (2018) analyse data to study the relationship between short-term rentals and gentrification, taking New York City as a case study. The authors argue that touristic rentals introduce ‘a new potential revenue flow into housing markets … systematic but geographically uneven, creating a new form of rent gap’. While their approach can identify neighbourhoods impacted by the Airbnb effect and those susceptible to Airbnb-induced gentrification, and also estimate the amount of rental housing lost to the new touristic rental market, unlike ABM such an approach has limited capability to analyse future policies for their impact.
Model design
In the terminology of Edmonds et al. (2019), our purpose is ‘prediction’: qualitative prediction of the effects and side effects of policy measures to regulate the ‘Airbnb effect’ in the Amsterdam residential market. To this end, we design an agent-based micro-simulation model. We build upon an extant validated ABM of urban residential dynamics (Picascia and Yorke-Smith, 2017). That model combines Smith’s rent-gap theory (Smith, 1979) and Axelrod’s cultural exchange theory (Axelrod, 1997), to study the effect of refugee immigration. This section explains our model and its major differences to that prior work; we describe the agent-based simulation model following the standard Overview, Design concepts, and Details (ODD) protocol (Grimm et al., 2013). For additional details we refer to the Supplemental material, and to Picascia and Yorke-Smith (2017).
The ABM is implemented in NetLogo, a dedicated system for ABM and social science simulation (Wilensky, 1999). The full NetLogo model is available at: [http://www.doi.org/10.4121/14188493].
Purpose
The purpose of the ABM is to study the effects of policy changes on the Amsterdam residential dynamics, especially the short-term tourist accommodation market.
States and variables
Locations
Figure 1 shows a visualisation of Amsterdam. The spatial model is a square grid of 65 × 65 locations. Each location is a residential dwelling (i.e. house or apartment), with attributes given in Table 1. The city quarters are fitted over the locations; each location is in one quarter.
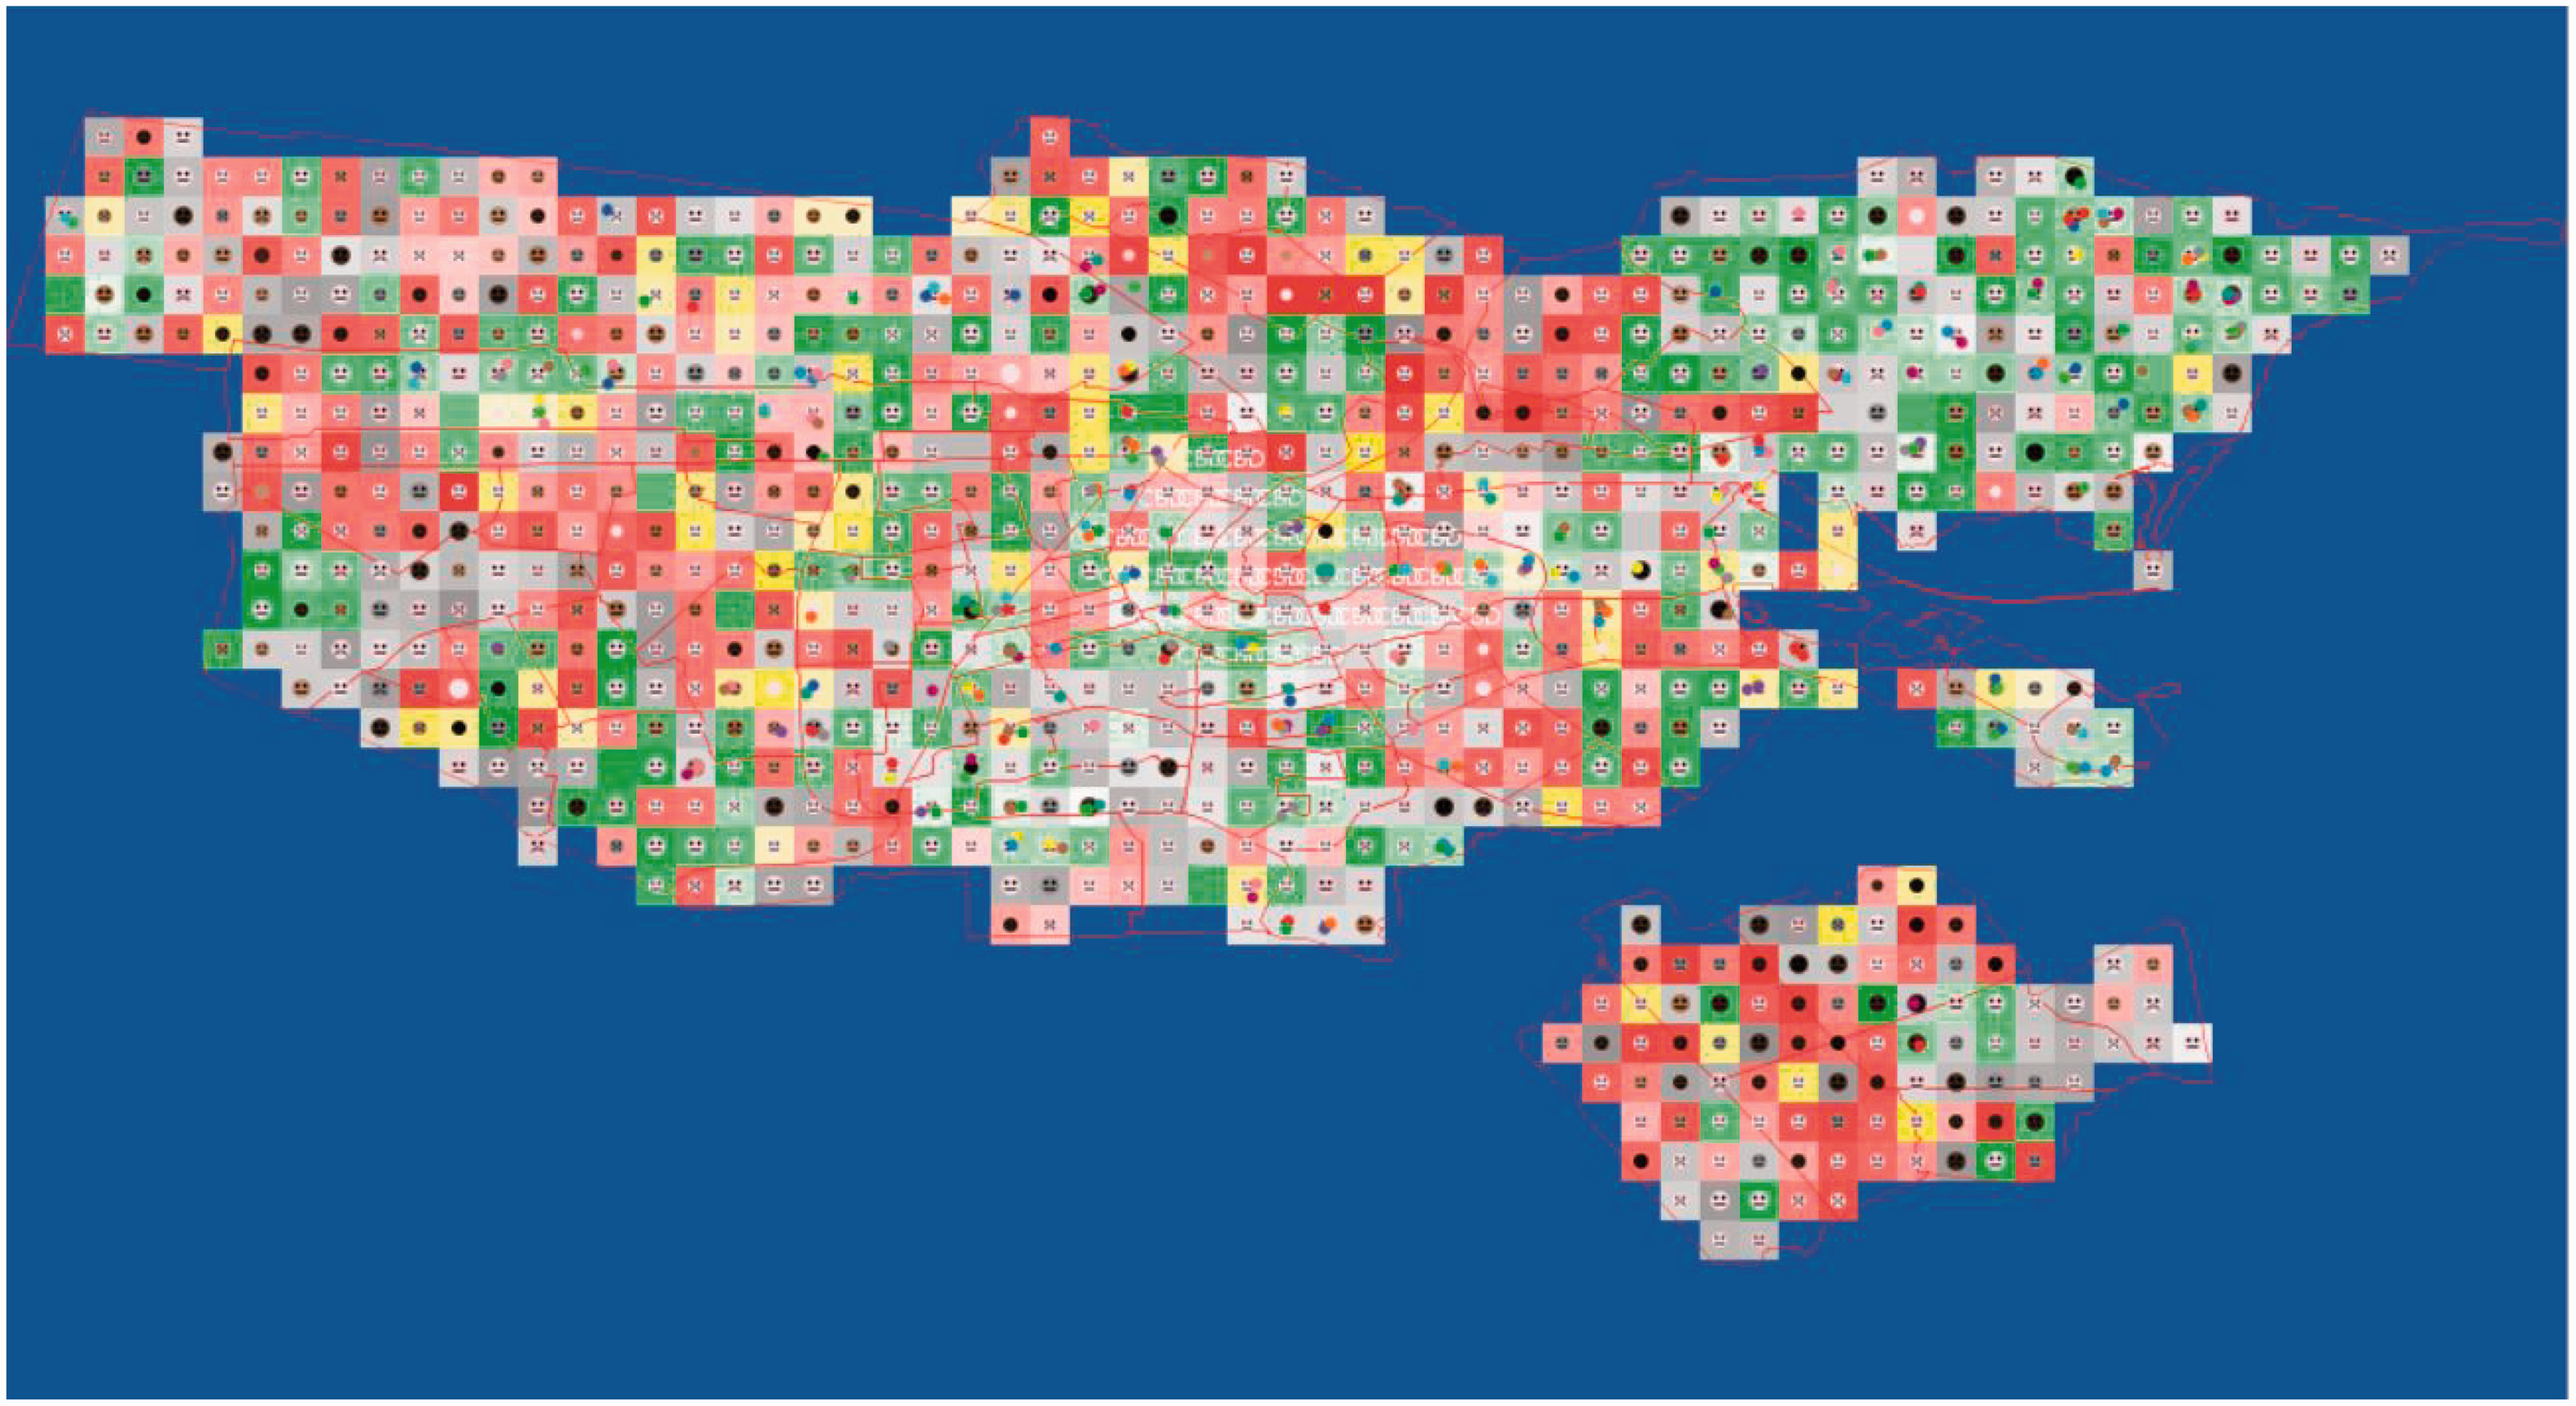
Agent-based model of Amsterdam. Each cell is a residential location. Privately owned locations that are available for touristic rental are green, those that are not available are coloured grey. Socially owned locations that are available for touristic rental are yellow, those that are not available are coloured red. For all locations, the brighter the shade, the higher the maintenance level of the location. Agents denoted by circles: those with faces are long-term residents, those without are tourists. District boundaries are marked by thin red lines. The central districts are in the middle right of the city. Note the discontinguous districts to the southwest.
Location attributes.
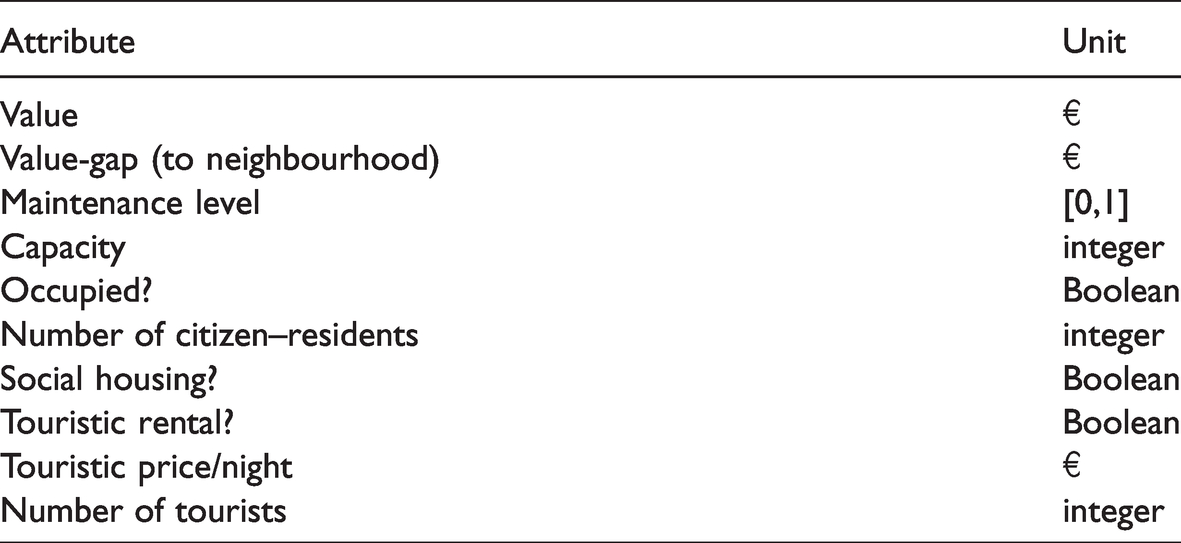
A dwelling can accommodate residents and/or tourists. A dwelling is either owned privately, or owned by a social housing association. 1 The latter social housing has limits on rent, and a prohibition on sub-rentals including touristic rentals.
In addition to touristic rentals, tourists can find accommodation in the conventional route of licensed hotels. As discussed in the Supplement, we choose to not model hotel locations, but model average hotel prices as a simulation-global market. The number of tourist agents (i.e. using touristic rentals) depends on the affordability of hotels.
Agents
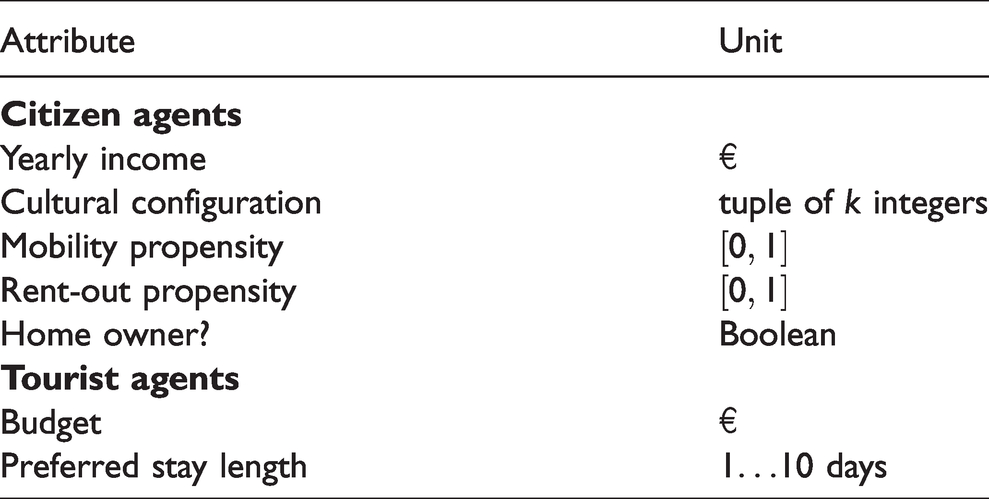
The two types of agents are household agents (‘citizens’) and tourists. Their attributes are given in Table 2.
Agent attributes.
Time
Each tick of the simulation corresponds to one day.
Processes
The simulation flow is depicted in Figure 2. We describe the most crucial processes.
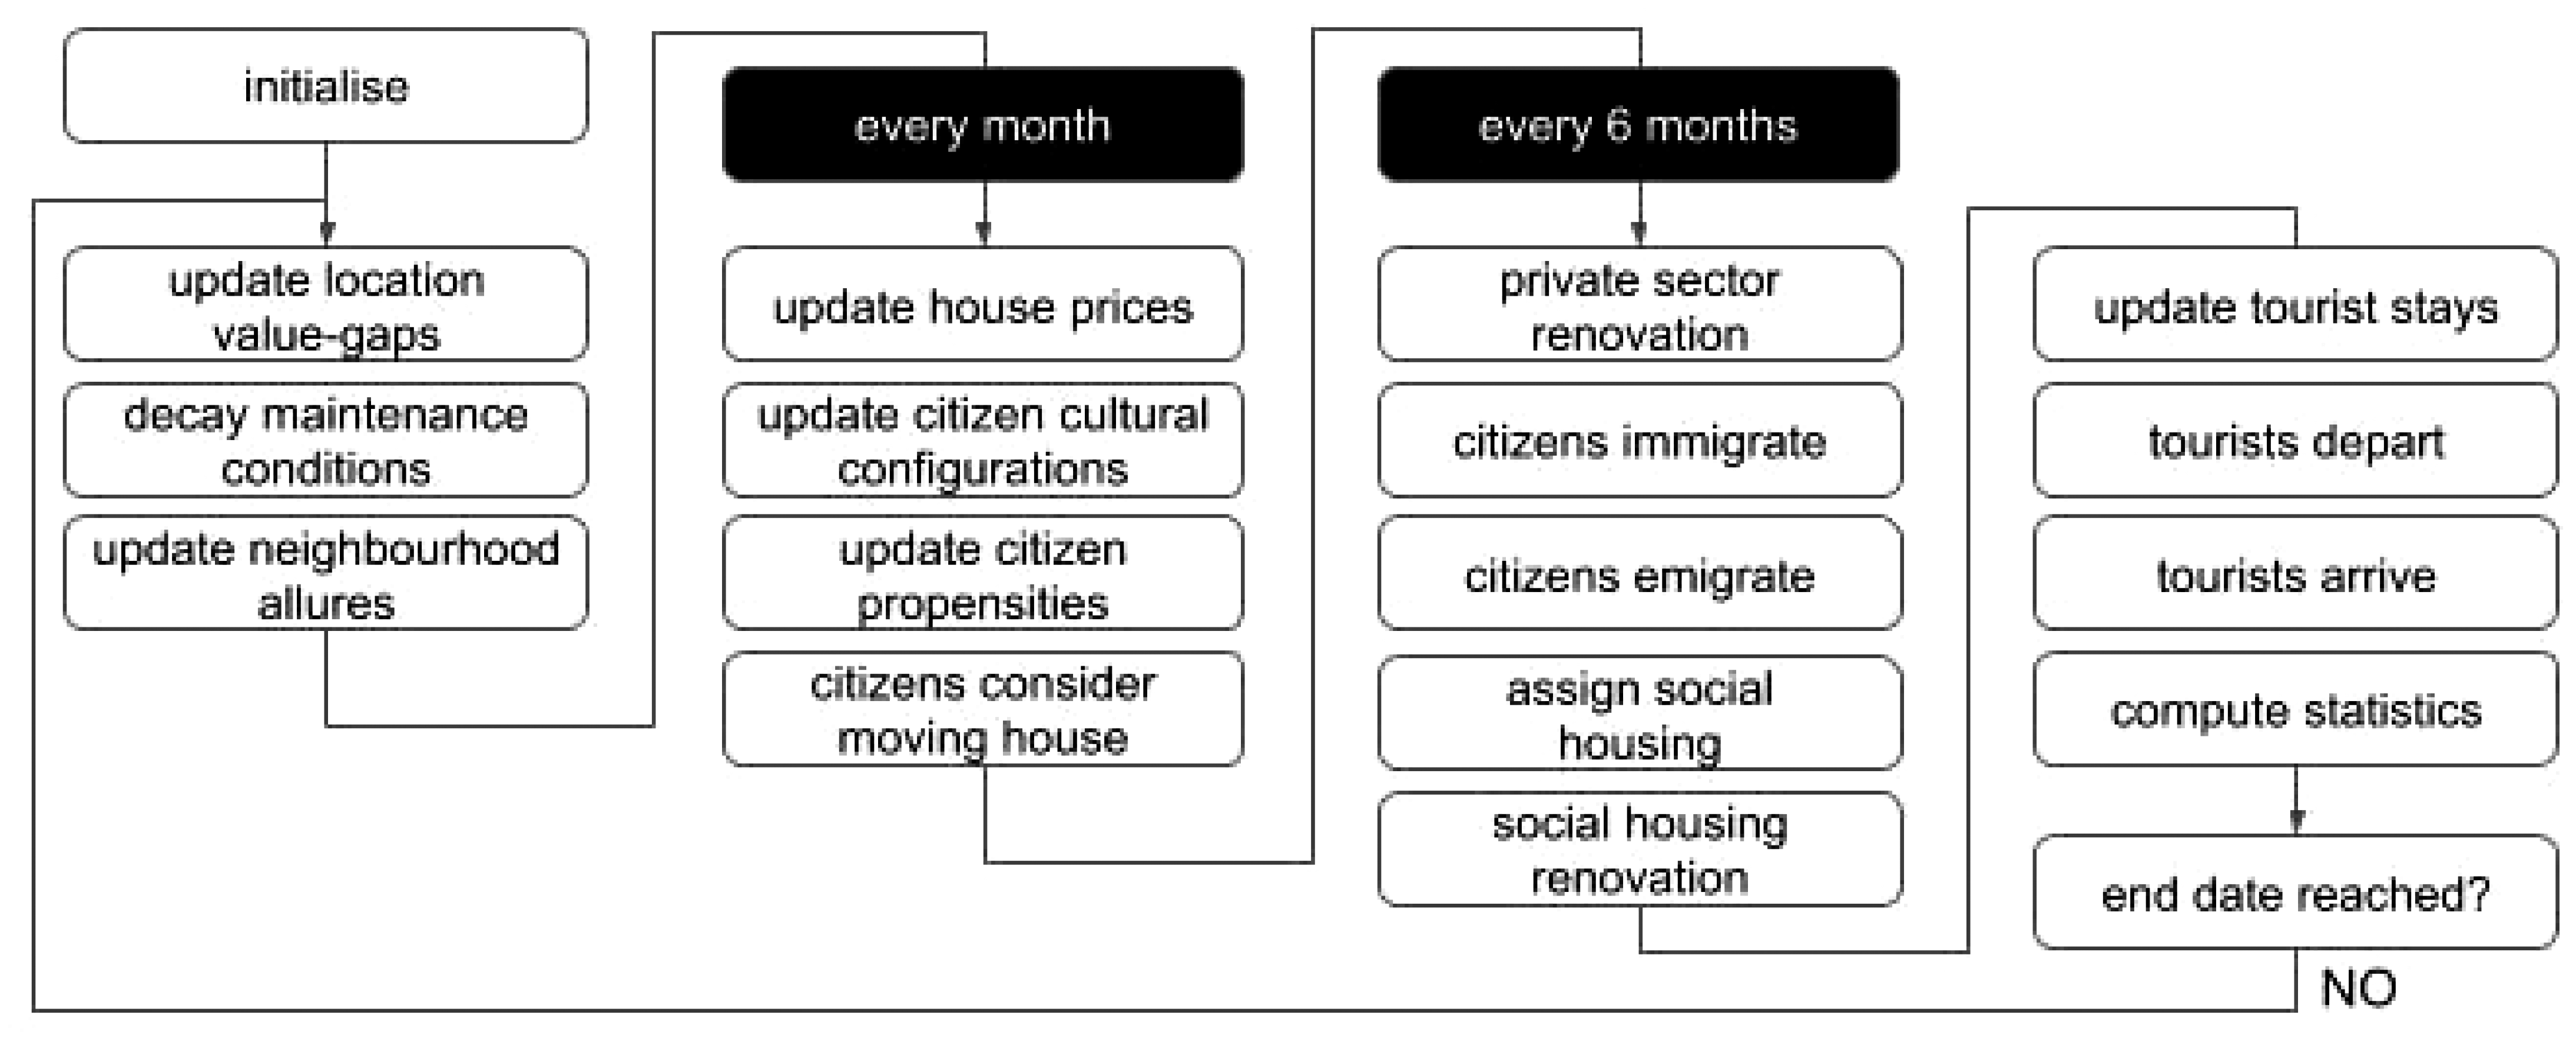
Simulation flow.
The mobility propensity is set following Picascia and Yorke-Smith (2017); the rent-out propensity is set in the same range for simplicity. Since the aim of our model is not historical replay, we did not investigate empirical calibration of the rent-out capacity. This would be interesting for future work.
Mobility propensity
Mobility propensity is updated every month. After the monthly change, the citizen will decide to relocate with probability of the mobility propensity.
The update rule largely follows Picascia and Yorke-Smith (2017): if the citizen is not living in a slum (i.e. dwelling with maintenance level <0.05), and her dissonance is equal or below the globally set tolerable dissonance of 5, her mobility propensity will be randomly reset in the initial interval (Table 3). If the citizen has either been living in a slum for longer than a year and her budget is over 1.2 times her current rent, or the median of the eight neighbouring dwelling is a slum, her propensity is multiplied by 1.5. This signifies her wish to leave a slum. If the dissonance is above the tolerable dissonance the propensity of multiplied by 1.5. If, for at least 10 days in the past month at least one tourist stayed at one a neighbouring dwelling, the propensity is multiplied by 1.2. If there are currently tourists staying in the dwelling, the propensity is multiplied by 0.8.
Initial value of key simulation parameters.
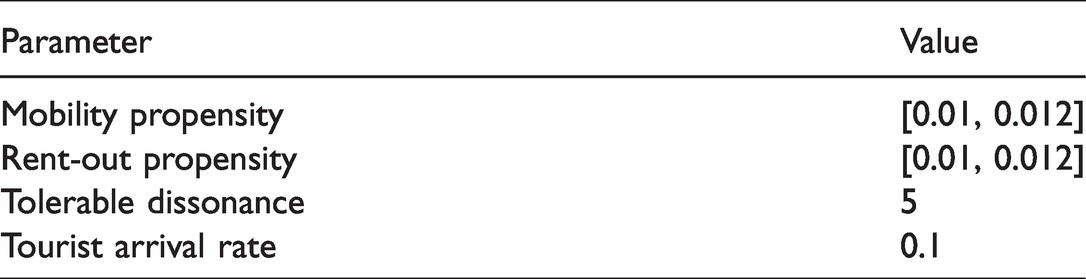
Rent-out propensity
Rent-out propensity is updated every day. After the daily modification of his rent-out propensity, the citizens decides whether to list his dwelling as available for the day (and following night) with probability of the rent-out propensity.
The update rule is: a citizen multiplies his rent-out propensity by 1.1 after a consecutive five days having at least one neighbouring unit with at least one tourist in it. (The mobility propensity also increases under these conditions, since we assume tourists can be a nuisance to the residents.) When a citizen successfully touristically rents his dwelling, his rent-out propensity is multiplies by 1.2, while his mobility propensity decreases slightly. But when the number of tourists exceeds the capacity of the dwelling, it is also multiplied by 0.5 to deter over-crowding. Citizens whose income is less than 1.5 times their home price multiply their rent-out propensity by 1.2. When the regulated maximum number of nights for dwelling is exceeded, the citizen will calculate his probability with 0.50.95 d times his rent-out propensity, where d is the amount of rented days exceeding the maximum for the past 360 days. There is additional multiplication with 0.5 if the dwelling is social housing; otherwise rent-out propensity is assumed to not differ between private and social housing.
Maintenance decay
Maintenance level decay is a daily process that models the natural decay of dwellings. Following Picascia and Yorke-Smith (2017), a base depreciation term is set to 0.00004 daily. This is halved when the dwelling is an owned or purchasable dwelling, even if it is currently empty. The term is multiplied by 1.2 if the dwelling is vacant. When more than one tourist resides in a dwelling the condition deprecation is twofold. The dwelling’s condition is subtracted by the depreciation term. When a citizen lives in a dwelling with condition under 0.15 for 60 sequential days, he is forced to move out and seek another home. This is due to strict Dutch housing laws. When a social housing unit drops below the condition threshold of 0.2, it will automatically be renovated to 0.55 by the housing association.
Price depreciation
The price of private dwellings follows a trend similar to their condition. Unlike the condition, the price update process occurs only every month. The base depreciation term is set to
Tourist price mechanism
Each location has variables specifying the dwelling’s availability for tourists and the price per night for tourists; these variables are updated every day. The dwelling is managed by (1) the citizen that lives there or (2) the (simulation-global) housing market if no citizen lives there. The two have different strategies for setting the availability and price, which we describe next. In both cases, each day when tourists stay in a dwelling, its regular residential price is multiplied by 1.0001 to the power of the number of tourists. Taking the housing market first: it does deliberately not break the rules. For social housing units, if the maximum number of nights within the past year (360 days) has passed, or the dwelling is already at full capacity, the market will not rent it out (further). When there are no legal objections and an empty dwelling is not yet listed as available, the market will consider a tourist price. The considered price is the mean tourist price for all houses which are currently available for tourists and which successfully has at least one tourist staying. (If none of these properties exist, the considered price is the mean regular residential price of the property divided by 30, the number of days per month) Only when the 30 times the considered price is greater than 1.1 times the regular residential price, tourism is judged profitable and the housing market will begin renting the property out using the considered price. The market will raise tourist prices of successfully rented dwellings by multiplying it with 1.01 to the power of the number of tourists; unsuccessful dwellings on the touristic market have their tourist price multiplied by 0.9. Taking the citizen agents second: as discussed earlier, citizens base their decision of renting to tourists on their rent-out propensity. If a citizen decides to list her dwelling, her rent-out propensity is set to 1. If a citizen decides to de-list her dwelling, her rent-out-propensity is halved. These bonuses capture a decision inertia and prevent excessive decision flipping. Citizens decide their property’s tourist price the same way the housing market does with only a few differences. Citizens lower bound their initial tourist price to 0.001 times their monthly income. The idea is that they will not take the effort to take strangers in when they just earn too small a fraction of their income. When the price modifies during an availability period, that price is lower bounded by 0.0005 times their monthly income.
Tourist arrival and departure
Every day 0.05 times the tourist population try to find accommodation. Each tourist starts out with her budget and preferred stay duration. Tourists consider dwellings which are listed as available on the touristic market. Whereas citizens prefer to be close of the centre of the local district, tourists prefer to be close to one of the city centre districts. Tourists will first seek affordable accommodation for their preferred stay length with a condition greater than the average listed accommodation and which still has less tourists than its (recommended) capacity. If that fails they will seek affordable accommodation which has at least less tourists than its capacity. If that fails they will also consider overcrowded locations due to their capacity and tourists already there. If that fails they will try these three steps with one stay day less. If that fails for even a single day they will leave the city.
For tourists already staying, every day the preferred stay length will decrease by one. Although a price change could occur we assume it to be fixed for tourists already checked in. Even if the accommodation ceases to be available (for new tourists), the current tourist can complete her stay. The tourist may even stay if the resident moves out. The home market then automatically ‘inherits’ the ‘business’. Once the stay length reaches zero, the tourist leaves the city.
Simulation results and analysis
Verification and validation
Model verification was performed through regression testing and examining extreme values. Sensitivity analysis is reported below. The prior ABM on which we build was validated by its authors (Picascia and Yorke-Smith, 2017). We further undertook validation of our ABM by means of expert review of the model outputs. The expert was from the municipality. Note that historical replay was not a suitable method, because our model excludes factors such as mortgages and interest rates, and historical changes to municipal Airbnb regulation. We also exclude exogenous historical shocks to the market.
Hypotheses
As summarised in Table 4, the default situation is one where touristic rentals are present and a regulation of a maximum of 60 nights per year per house is in force: the de facto situation at the start of 2019. The goal of the experiments is to address the following hypotheses:
Scenarios.
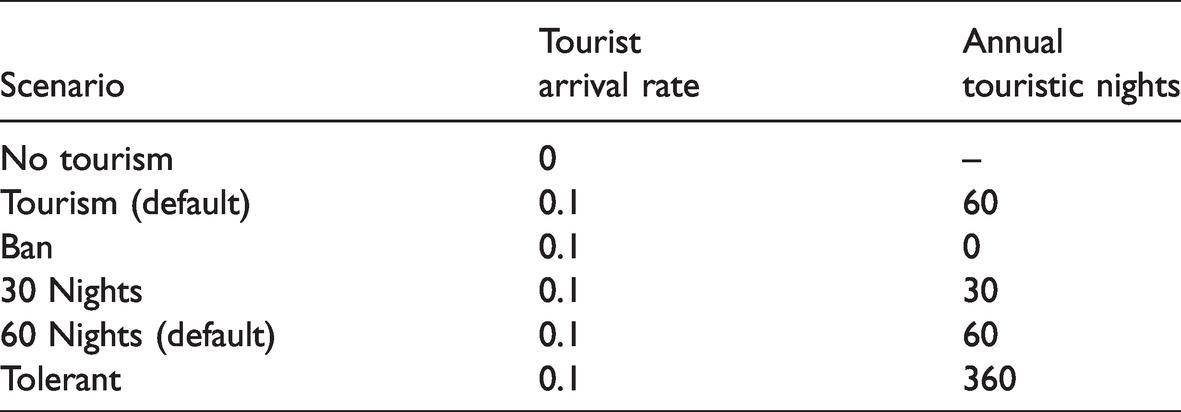
Following initial experiments to determine variance, we repeated each run of the simulation 64 times. The simulation runs from 2011 for 11 years, by which point we expect to see the medium-term effects of policy interventions.
We recorded the following output variables: Citizen population count Mean permanent income of citizens Gini coefficient of the permanent income of citizens Mean monthly price of houses in city Mean condition of houses in city Total immigrated, emigrated, and inner-relocated citizens Number of touristic market tourist nights Total revenue of tourist stays in homes
The simulation is configured with citizens who may rent their houses to tourists, and the globally simulated private sector renting of dwellings unoccupied by citizens.
Experiment 1: Tourism
We compare with-tourism and without-tourism situations. Table S1 (in the Supplemental material) reports the results of a one-sided t-test (64 pairs). When tourists are present, we would expect an effect on total tourist nights and tourist revenue variables. Indeed, the p values of the total tourist nights and tourist revenue are close to zero.
We see in Figure 3(c) and 3(d) that the home condition is negatively affected by tourism, while the price is positively affected. The population is slightly affected by tourism.
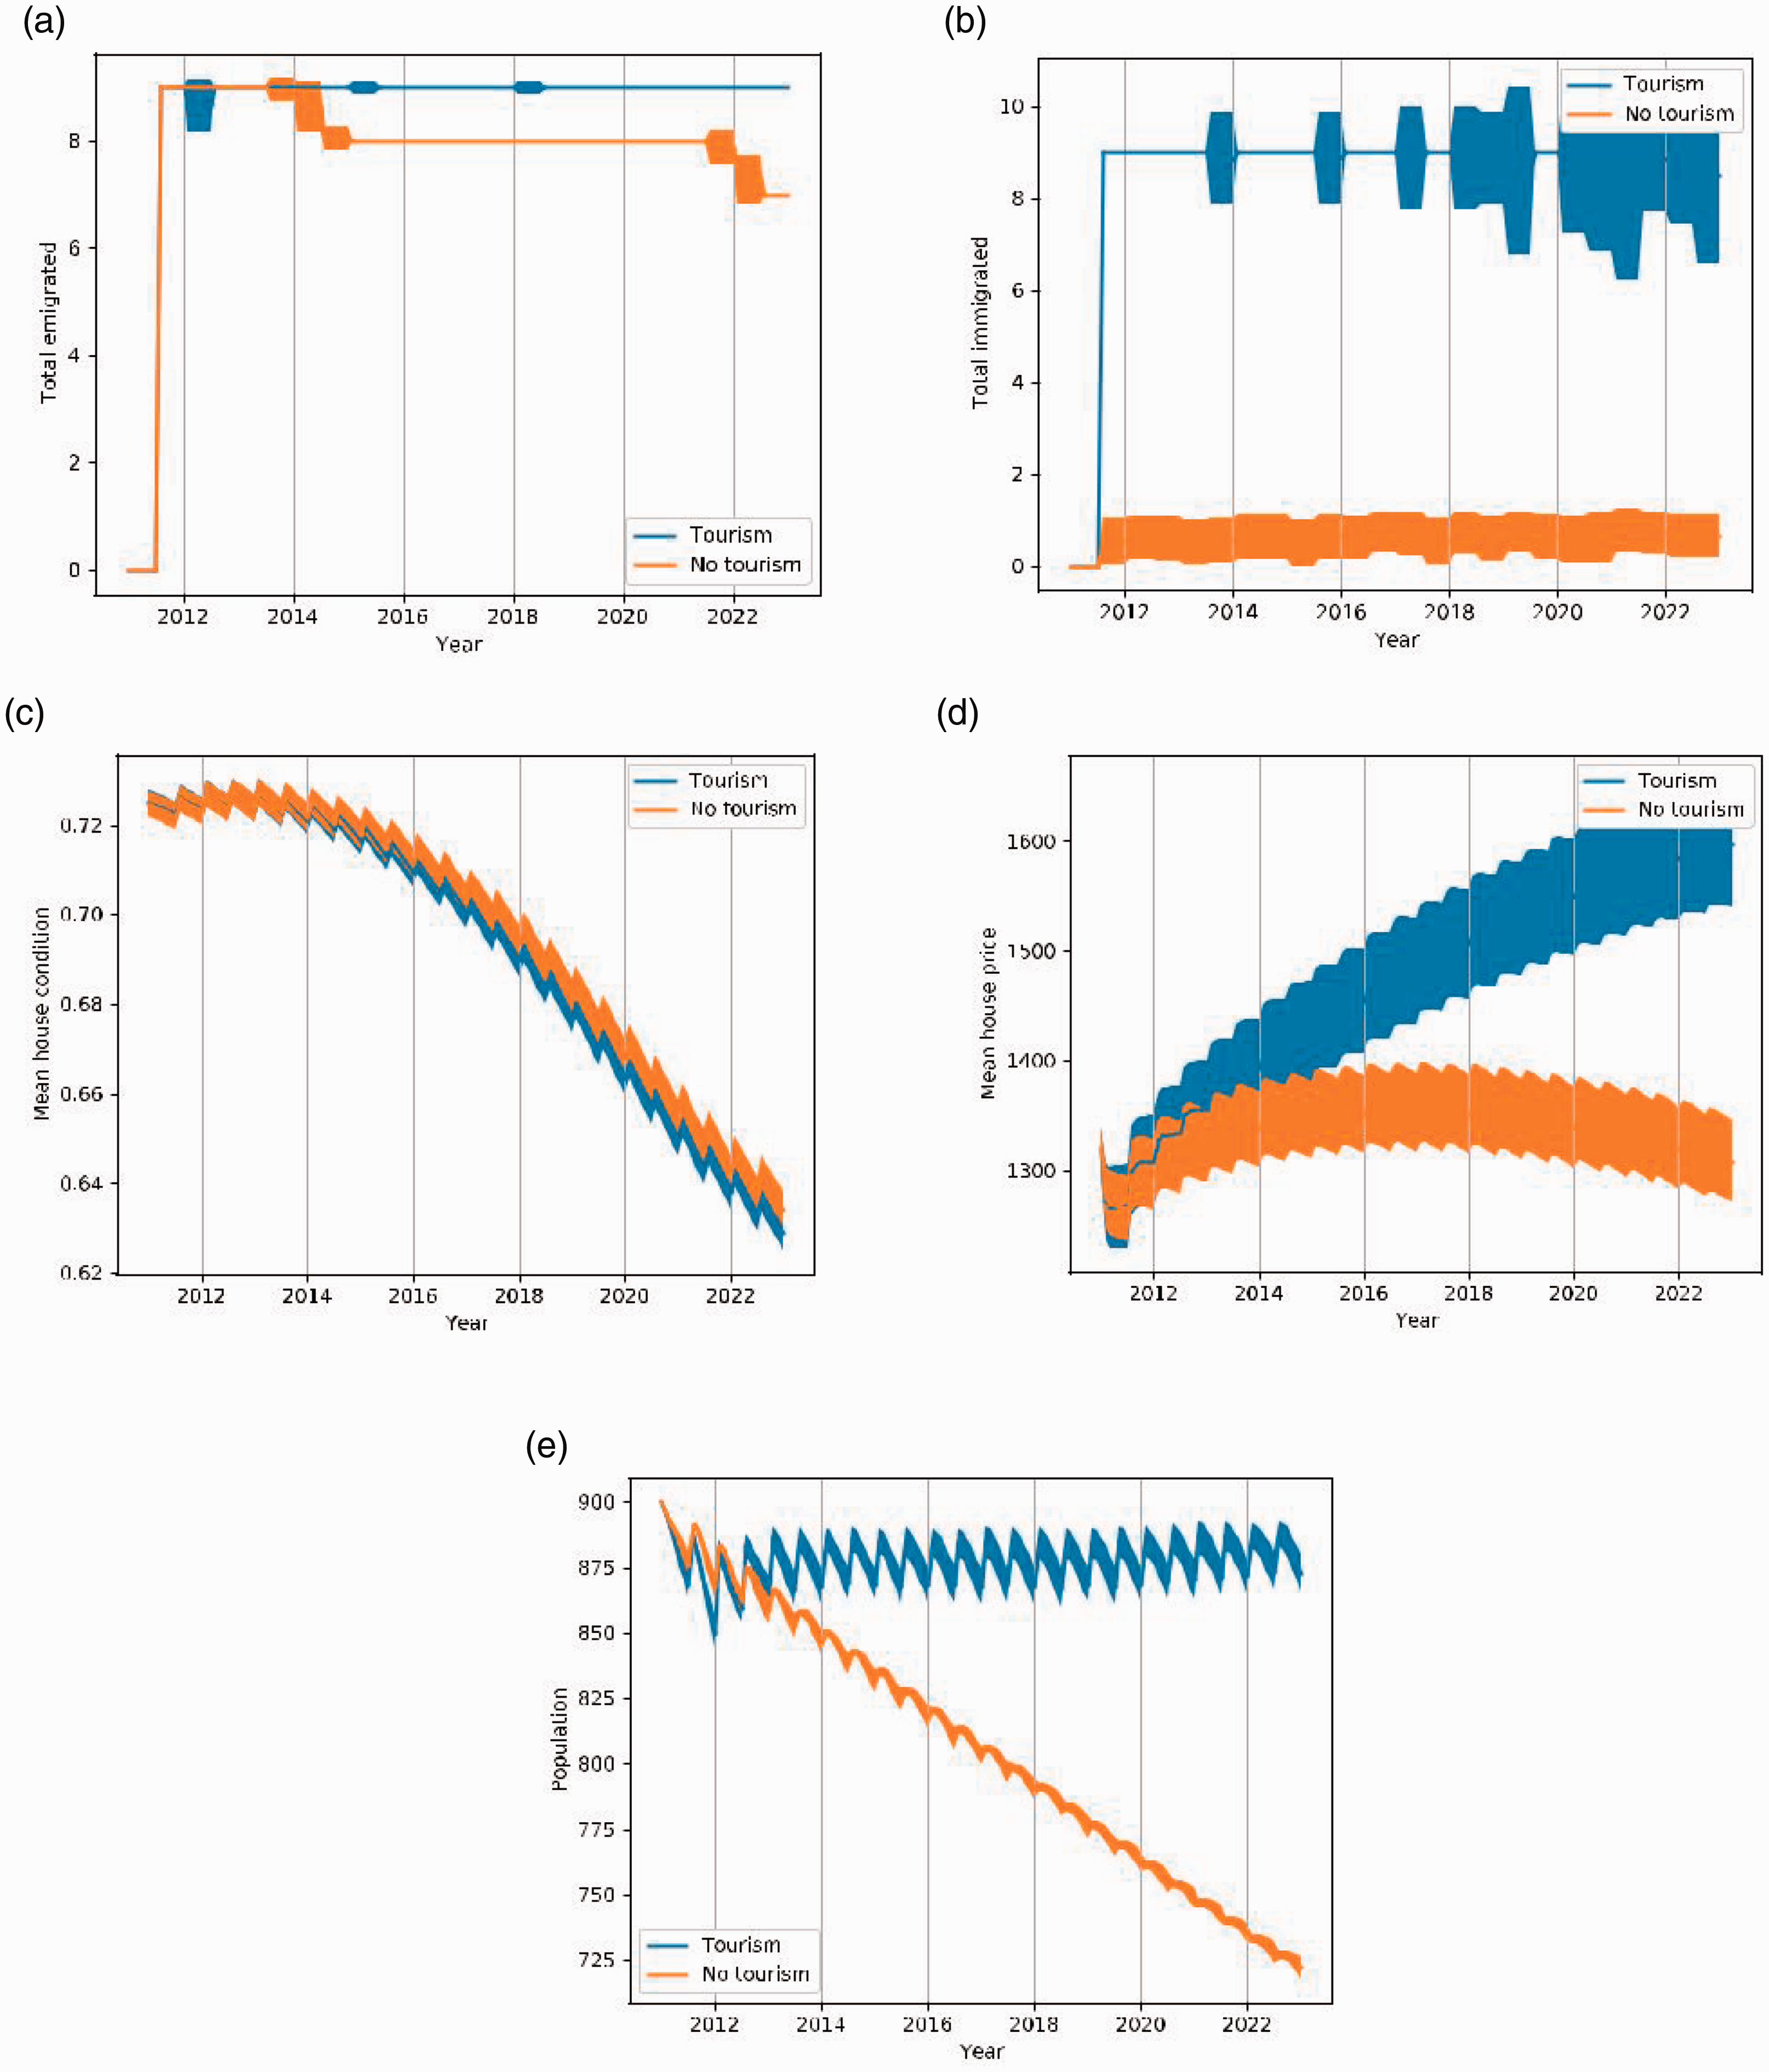
Experiment 1: Tourism. X-axis in months. (a) Total number of emigrated citizens (b) Total number of immigrated citizens (c) Mean house condition (d) Mean house price (e) Population count.
The citizen emigration and immigration rates are both higher under tourism as seen in Figure 3(a) and 3(b). The difference in immigration is greater than that in emigration. This is reflected in Figure 3(e) where the population is more sustained under tourism. The reason for the larger immigration can be explained by the in-model social housing. When there is tourism, more residents of the city apply for social housing. A resident who successfully applies for social housing is ‘removed’ from the residential market of the city, but does not count towards the emigrated count. The private market units thus vacate are then immigrated into by new residents. Although potential immigrants are allowed to apply for social housing, they will not do so if the outlook of getting one is poor (this differs with residents already in the city). From this we can deduce that the immigrants are not likely in the social housing list. When this finding is combined with the higher house prices when tourism is turned on, it is clear that a gentrification process is happening. The former residents are displaced into social housing and new residents take their place. The price hike can be attributed to tourism as seen in Figure 3(d).
Experiment 2: Maximum nights regulation
We compare different regulated levels of maximum nights. Table S2 reports the results of pairwise t-tests against the default situation. The population is consistently influenced when there are no regulations on the maximum tourist nights and when there is a complete ban.
Figure 4(a) shows a stronger decline in both of these cases. House prices showed marked differences in the ‘Banned’ versus permitted scenarios, while condition is little affected. The ban keeps the prices lowest, according to Figure 4(c). The ‘30 nights’ scenario keeps the prices close to the original ‘60 nights’ scenario and results in the lowest condition. It is not certain whether the slight increase in prices holds at a ban, since this has a higher p value when compared to the ‘60 nights’ scenario.
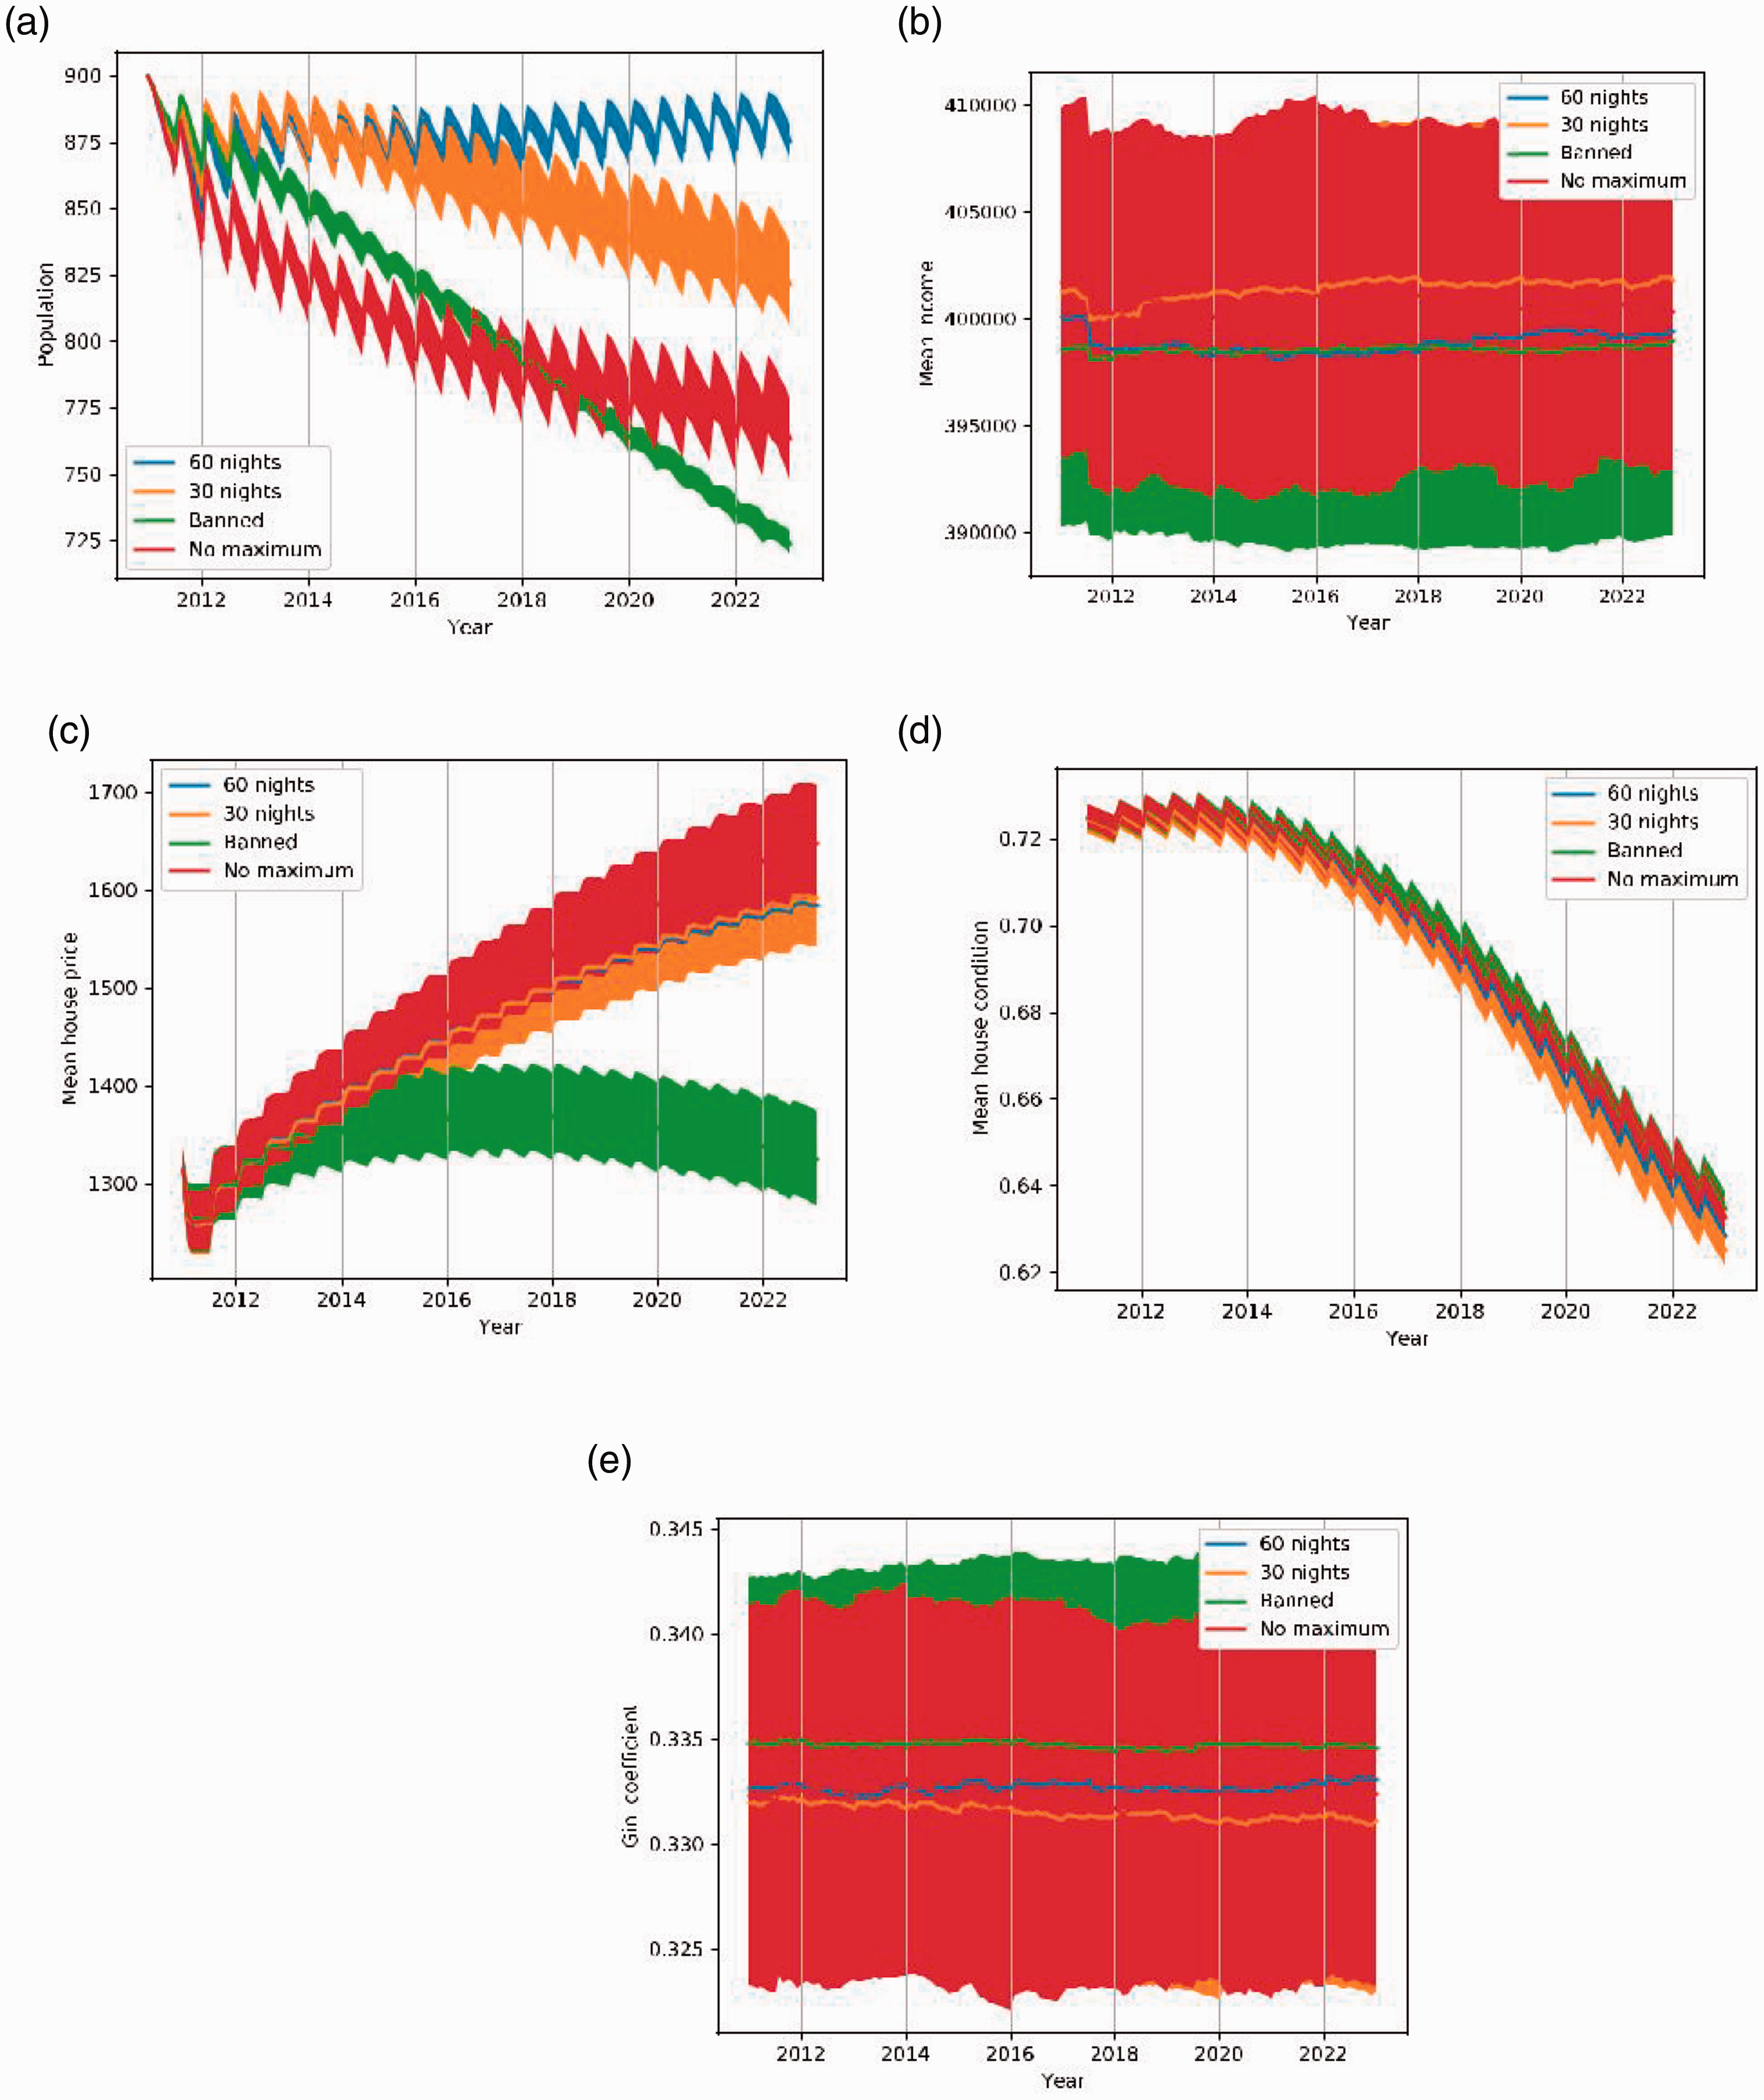
Experiment 2: Maximum nights’ regulation. (a) Mean population (b) Mean income (c) Mean home price (d) Mean home condition (e) Gini coefficient.
The immigration and emigration rates are all significantly changed, but the differences in emigration are low. The lower differences can be attributed to the social housing safety net. In the ‘Banned’ scenario, the immigration rate is the lowest in Figure 5(a), which is reflected in the population development in Figure 4(a). It is no surprise the population and migration development in the ‘Banned’ascenario are near identical to the ‘No tourism’ scenario from Experiment 1. Like the first experiment, more residents are applying for social housing and immigrants move into the vacant houses they leave behind. The immigration and with it also the gentrification is strongest in the ‘60 nights’ and ‘No maximum’ scenarios.
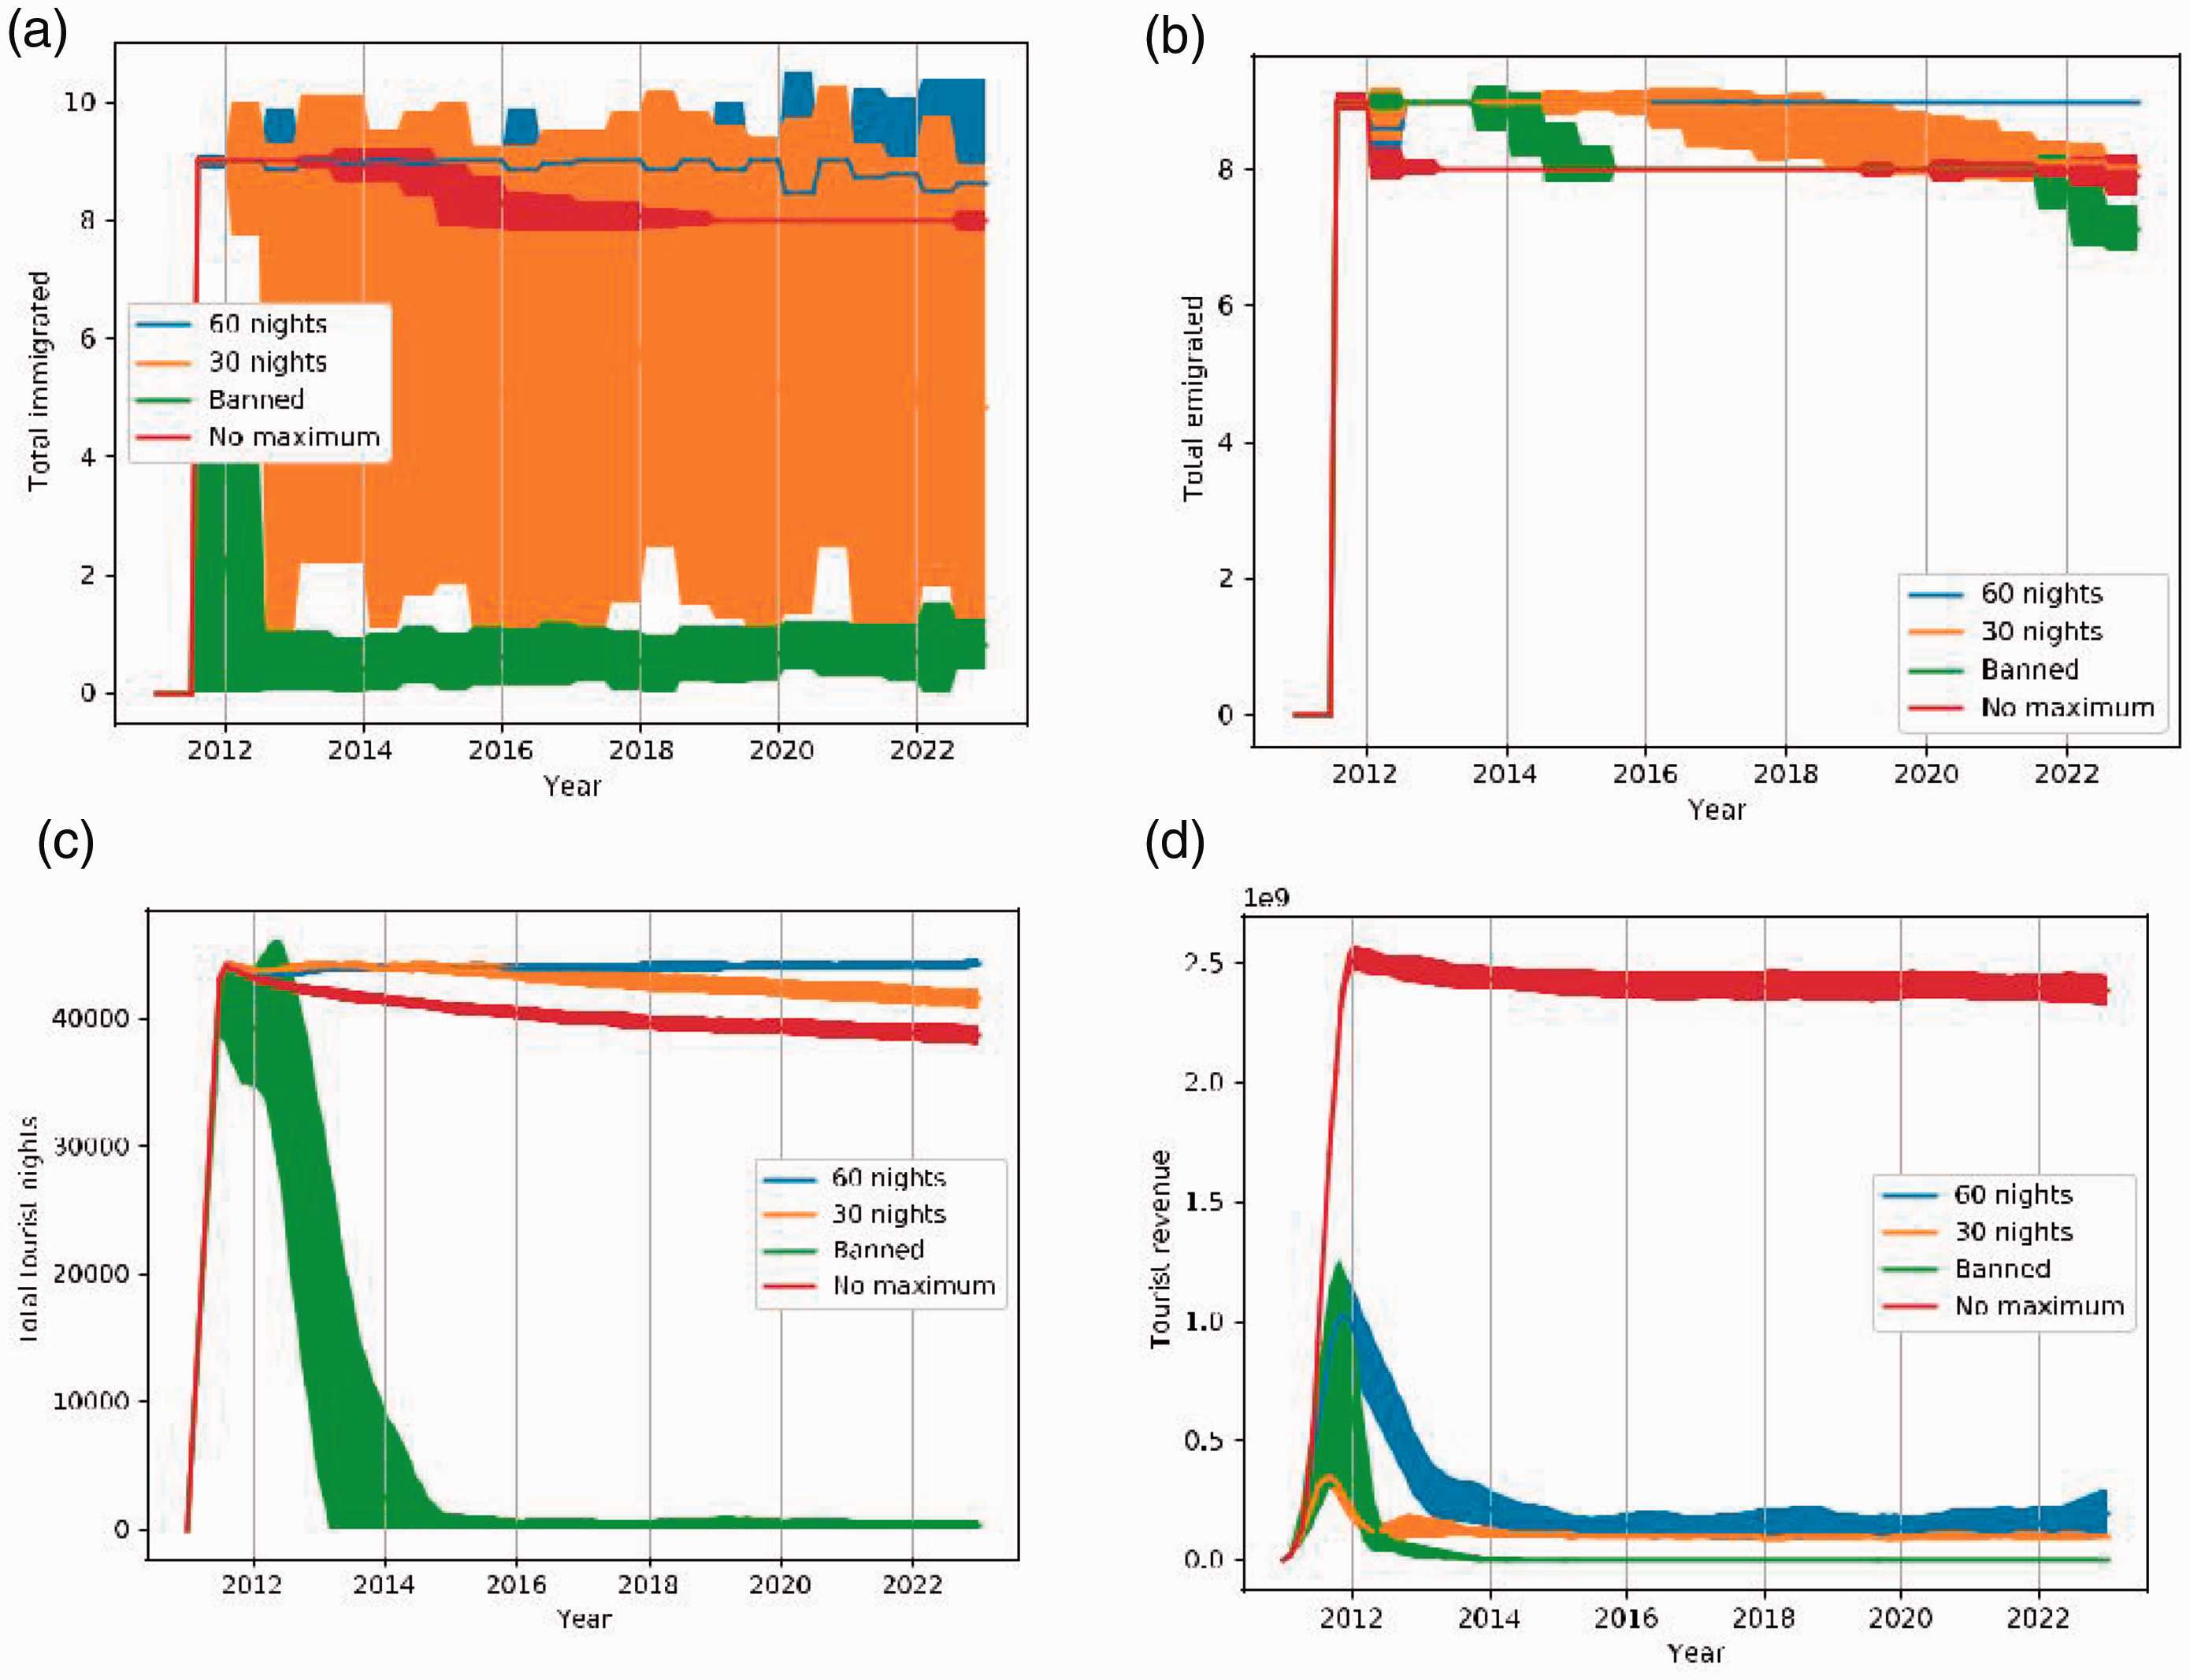
Experiment 2: Maximum nights’ regulation. (a) Total number of immigrated citizens (b) Total number of emigrated citizens (c) Mean total tourist stay nights accumulated (d) Mean total tourist stay revenue accumulated.
It is no surprise the tourist revenue is greatest in the ‘No maximum’ scenario from Figure 5(d). However, when we look at the amount of stay nights only in Figure 5(c), rather than the money earned, we see the ‘60 nights’ scenario has the most tourists staying, closely followed by the ‘30 nights’ and ‘No maximum’ scenarios. This means these cases had more stay nights, but the average turnover per night was less.
It should be noted that the ‘Banned’ scenario differs from the ‘No tourism’oscenario from the previous experiment. ‘No tourism’ completely switched off the tourists and their demand, while the ‘Banned’ simply discourages citizens to rent to tourists. We return to the point of citizen agents’ compliance with rule, and the enforcement of such regulation, in the conclusion.
Sensitivity analysis
To further examine the observed emergent effects, we adopt the Fourier Amplitude Sensitivity Test (FAST) method of sensitivity analyses. In order to examine the influence of tourism parameters in the experimental outputs, the following two inputs are tested (Table S3): Tourist arrival rate. The amount of tourists trying to arrive as a fraction of the number of citizens and can be seen as the natural demand. We sample the values [0,0.1]. Maximum stay night count per year. We sample the values [0,360]. The in-model year length in days is 360 and the in-model month length in days is 30.
Table S3 shows considerable contributions from both the maximum and the tourist arrival rate. The arrival rate is the main influencer of the total number of nights stayed, but only the maximum also influences part of the total revenue. This confirms similar findings in Experiment 2 where a lower maximum resulted in a similar number of nights, but with lower turnover. Even though the price is was influenced by the maximum nights in Experiment 2, the tourist arrival rate contributes more to this, indicating that consumers’ preference trends are stronger in model than regulations. The regulations do, however, have more influence on the population count than the arrival rate.
Discussion and conclusion
How municipal, regional and national authorities should regulate the peer-to-peer short term rental market is a current topic of debate. This debate has become urgent for the Dutch capital, Amsterdam, with the ‘Airbnb effect’ distorting the housing market and even the character of the city. This article examined the qualitative macro-level effects of maximum-nights policy measures by means of a data-driven spatial agent-based simulation.
Our ABM model captures two types of agents: city residents and visiting tourists. We build upon an extant ABM of urban residential dynamics (Picascia and Yorke-Smith, 2017) that combines Smith’s rent-gap theory (Smith, 1979) and Axelrod’s cultural exchange theory (Axelrod, 1997), adapting it significantly to model the touristic rental market. We capture private and social housing, and residents’ propensity to rent their dwelling, under the cases where it is and is not permitted by contract. While calibrated on data from Amsterdam and the Dutch legal setting, our modelling approach is generic.
Simulation analysis shows that the tourism market has caused considerable changes in housing prices and population development. We find that more lower income citizens will live in the city when regulation of the market is stronger. Banning the touristic market restrains the overall increase in house prices, compared to the business-as-usual scenario. However, the feasibility of enforcement of regulation (Leshinsky and Schatz, 2018), and its libertarian consequences (Kadi and Musterd, 2015), must be considered. Indeed, a complete ban would not align with the ‘tolerant’ Dutch culture. Thus our main conclusion for the case of Amsterdam is that tighter limits, on the amount of nights a property can be listed on Airbnb, is preferable to an outright ban.
The results are timely for the municipality of Amsterdam, which is considering tightening its current listing limitation, and requiring legal permits of Airbnb hosts.
This article advances the state of the art over the literature by, first, modelling the unique characteristics of Amsterdam’s residential market in an ABM. Second, in contrast to previous scholarly works on Airbnb, develop a GIS-based spatial RGT ABM. Third, we analyse policy interventions, taking into account social housing as well as short-term rentals.
Our work opens up several avenues for further study. First, we evaluated the policy measures contemporary to our case study: other market interventions such as taxation can be studied with the same methodology. Likewise, different regulations in different districts of the city (e.g. central districts). Second, we assumed that tourists are culturally homogeneous. The cultural and touristic preferences of different groups can be considered, including data on the varying distribution of visit lengths. Third, it would be worthwhile to survey residents to better characterise their attitude to restrictions and touristic rentals, and their propensity to ignore rules and contracts (Leshinsky and Schatz, 2018). Four, in addition to the two ownership types, social housing associations and private citizens who own more than one property, one could also consider a citizen renting her current dwelling and purchasing a second dwelling to instead live in. 2 Fifth, investigation of how initial configurations influence the resulting simulation outputs is a topic for future study. Last, the interplay of the short-term and long-term rental markets deserves further study using agent-based simulation.
Supplemental Material
sj-pdf-1-epb-10.1177_23998083211000747 - Supplemental material for Agent-based simulation of short-term peer-to-peer rentals: Evidence from the Amsterdam housing market
Supplemental material, sj-pdf-1-epb-10.1177_23998083211000747 for Agent-based simulation of short-term peer-to-peer rentals: Evidence from the Amsterdam housing market by Arnold Overwater and Neil Yorke-Smith in EPB: Urban Analytics and City Science
Footnotes
Acknowledgements
Thanks to Jan Kwakkel and Stephen van der Laan.
Declaration of conflicting interests
The author(s) declared no potential conflicts of interest with respect to the research, authorship, and/or publication of this article.
Funding
The author(s) disclosed receipt of the following financial support for the research, authorship, and/or publication of this article: This research was partially supported by TAILOR, a project funded by EU Horizon 2020 research and innovation programme under GA No. 952215.
Supplemental material
Supplemental material for this article is available online.
Notes
References
Supplementary Material
Please find the following supplemental material available below.
For Open Access articles published under a Creative Commons License, all supplemental material carries the same license as the article it is associated with.
For non-Open Access articles published, all supplemental material carries a non-exclusive license, and permission requests for re-use of supplemental material or any part of supplemental material shall be sent directly to the copyright owner as specified in the copyright notice associated with the article.