
Abstract
Analysis of changing patterns of ethnic residential segregation is usually framed by the coarse categorisations of ethnicity used in censuses and other large-scale public sector surveys and by the infrequent time intervals at which such surveys are conducted. In this paper, we use names-based classification of Consumer Registers to investigate changing degrees of segregation in England and Wales over the period 1997–2016 at annual resolution. We find that names-based ethnic classification of the individuals that make up Consumer Registers provides reliable estimates of the residential patterning of different ethnic groups and the degree to which they are segregated. Building upon this finding, we explore more detailed segregation patterns and trends of finer groups at annual resolutions and discover some unexpected trends that have hitherto remained unrecorded by Census-based studies. We conclude that appropriately processed Consumer Registers hold considerable potential to contribute to various domains of urban geography and policy.
Keywords
Introduction
Ethnic residential segregation has provided an enduring and debated focus for social investigation in the United Kingdom and elsewhere. Both the academic and public discussions are frequently dominated by anecdotal evidence because extensive, timely and detailed data on ethnic residential patterns are unavailable. Segregation researchers recognise that the lack of sufficiently granular data with respect to ethnic categories and temporal resolution are of paramount importance and impede progress in significant policy debates, such as migration and segregation in England and Wales (Harris and Johnston, 2018). Additional obstacles in understanding the patterns, causes and consequences of ethnic segregation arise from the ‘slippery’ (Peach, 2009) nature of segregation measures, which continue to be contested.
In the United Kingdom, conventional data sources of ethnicity information are mainly drawn from decennial Censuses of population. While they are broad in coverage, relying on Census data creates significant gaps, as data are only collected every 10 years. The delay to the release of the information means that, currently, the most recent data are eight years out of date and the next population-wide update cannot be expected before 2022. Moreover, Census categorisations provide little flexibility in profiling particular ethnic communities of policy concern beyond the coarse, pre-defined ethnic categories released by the Census.
In this paper, we seek to demonstrate the feasibility of using Consumer Registers (Lansley et al., 2019) as an alternative population data source to official Censuses, in order to develop a more granular analysis of recent segregation trends and patterns in England and Wales. We make annual estimates of ethnic segregation in England and Wales from 1997 to 2016 for all ethnic groups recorded by the Census as well as a selected number of finer ethnic categories. We develop two innovative manipulations: (1) we employ the algorithm developed by Kandt and Longley (2018) to infer probable ethnic origins for aggregations of individual names at the Census Output Area level; and then (2) track annual segregation estimates for England and Wales as a whole and for four case studies.
Consumer Registers
The Linked Consumer Registers (Lansley et al., 2019) are a set of annually assembled databases of names, home addresses and postcodes of adult individuals spanning a period of nearly 20 years, 1997–2016. They are compiled from the public Electoral Register and a range of private sector data sources. Based on individual names and addresses, it is possible to match records between years and thus turn Consumer Registers into a powerful, longitudinally linked data resource that can be aggregated to any convenient geography. Such a resource can permit novel insights into a range of research and policy problems, including segregation.
Yet, as is typical for consumer and other big data sources, Consumer Registers require significant data cleaning and pre-processing before they can be deployed for research purposes. A major challenge arises from the unknown provenance of individual records because Consumer Register inherits records from the Electoral Register, which is known to exclude non-electors and (post 2003) electors that have exercised their right to withdraw from the public version of the Electoral Roll. Issues of residential mobility bring additional concerns: recent research has estimated that 17% of eligible voters in Great Britain are not correctly registered at their current address, representing as many as 9.4 million people (Electoral Commission, 2019). The same study revealed that 11% of register entries are inaccurate, affecting up to 5.6 million people.
In order to attain wider coverage of non-electors, Electoral Register records have been supplemented with records of other consumer data sources based on appropriate consents from data subjects. By means of appropriate address standardisation methods, significant parts of missing records could be reconstructed. Furthermore, Lansley et al. (2019) develop procedures matching the individual names and addresses between registers of different years through linkage to external data sources, such as the Ordnance Survey AddressBase list of all addresses in Great Britain and Land Registry data for England and Wales and for Scotland. Using the matched, annual records, they were able to fill gaps or correct inaccuracies that may have arisen due to moves.
Although these cumulative additions are unlikely to bring the Consumer Registers to universal adult coverage, Lansley et al. (2019) demonstrate that population totals can be brought in line with the 2001 and 2011 Census population counts and Office for National Statistics (ONS) Mid-Year Population Estimates. The total number of recorded adults in the linked Consumer Registers is highly correlated (correlation coefficients > .99) with the ONS Mid-Year Population Estimates over the period 1997–2016: the average difference in estimated population sizes is just 1.8%.
Consumer Registers do not record any demographics but names can be used to infer age, sex and ethnicity (Longley et al., 2015). Names-based classifications have been proved to be viable for ethnicity related studies (Bakens and Pryce, 2018; Lan et al., 2018; Longley et al., 2015). In contrast to previous names-based segregation studies, the freely available Ethnicity Estimator tool (indicators.cdrc.ac.uk/ethnicity-and-names/ee/) has been calibrated with the 2011 Census population data and demonstrate a success rate of 88% (Kandt and Longley, 2018), which performs better than other algorithmic comparators such as Onomap (Kandt and Longley, 2018). In what follows, however, we do use the Onomap algorithmic solution to estimate numbers of adults within the blanket Census ‘Other White’ category, provided that the higher level ethnicity estimator software assigns individuals to this blanket category. Using these procedures, we infer ethnic group of each name bearer in the Consumer Registers and are thus able to generate annual estimates of ethnic diversity and segregation.
Background: Ethnic segregation in the British context
Ethnic segregation first returned to the public and political spotlights after the 2001 disturbances. Policy reviews by governmental think-tanks and experts (Cantle and Kaufmann, 2016) have suggested that the disturbances resulted from inequality and self-segregation among minority groups. Since then, continued efforts to monitor segregation in the country have demonstrated that degrees of segregation have generally been decreasing, albeit with some variations among ethnic groups (Cantle and Kaufmann, 2016; Casey, 2016). Simpson (2007) argues that residential mixing increases as minority populations grow and spread more evenly across localities. Likewise, Peach (2009) concludes that ethnic segregation levels in Britain have been decreasing, challenging myths of US-style ghettos in English cities. Similar evidence is presented by Finney and Simpson (2009). Catney (2016) analyses the 1991, 2001 and 2011 UK Censuses and charts the geography of ethnic diversity that has evolved over the last two decades. Apart from the index-based segregation studies, another important strand of work focuses on the ethnic composition and typologies of neighbourhoods using Census data (Harris and Longley, 2002; Johnston et al., 2016). Their findings show the increase in both Type 2 (White predominate) and Type 4 (non-White predominate) neighbourhoods across the urban systems of England and Wales.
Although the evidence is broadly consistent, it remains at a coarse level as a result of the data source that most studies employ, notably the UK Censuses. Census data are authoritative and widely accessible but they are not without drawbacks. First, geographic boundaries of the Census output units are subject to changes across Censuses. For example, between the 2001 and 2011 UK Censuses, 4354 of 175,434 Output Areas (2.4%) in England and Wales were either split or merged. Such inconsistent boundaries lead to comparability issues (Simpson, 2007) when developing Census-based segregation indices. Moreover, different Census classifications of ethnicity have been created over time following stakeholder consultations and changes in priorities mean that they are not consistent across the 1991, 2001 and 2011 UK Censuses. The current practice of defining ‘pan-ethnic’ classes combines distinctive minority groups in Britain and renders categories imprecise and problematic. For example, many European immigrants, such as Polish, Germans, Italians, French, Lithuanians, Portuguese and Romanians, are categorised collectively as ‘Other White’ in Censuses, despite the fact that this comprises a diverse range of cultural origins that likely pose distinctive challenges to social harmonisation. Consequently, the residential segregation patterns of the various groups within the ‘Other White’ category may vary markedly and contribute to a number of different policy concerns.
These vicissitudes have previously been overcome by using algorithmic classifications of individual given- and family-name pairings to establish a consistent benchmark for analysis (Mateos et al., 2011, 2009). Names-based classification of ethnicity has been applied in previous research (Bakens and Pryce, 2018; Lan et al., 2018; Longley et al., 2015). However, unlike the classification that we use here, such tools do not validate their results with reference to the self-assignments (e.g. Census ethnic groups) that individuals make (Kandt and Longley, 2018), despite the evidence that such assignments are not invariably stable or straightforward (Simpson et al., 2016).
Neighbourhood change may be rapid, rendering decennial measurements of segregation too coarse to base propositions on segregation trends, especially when a key movement of ethnic groups occurs between Census years. For example, a large number of ‘Other White’ migrants moved to the UK between the 2001 and 2011 Censuses following the 2004 and 2007 accessions of Eastern European countries to the European Union (EU). Although there exist other population data sources for the intermediate years, they are not precise and sometimes suffer from the underestimation of long-term immigration (ONS, 2012). Thus most previous residential segregation studies have drawbacks of inconsistency, imprecise ethnic categorisations and very coarse temporal granularity.
Research design
Since the novel names-based classification tool, Ethnicity Estimator, is sensitive to ethnic self-assignment in the British context (Kandt and Longley, 2018), we use it to classify linked records in Consumer Registers. This process results in Consumer Register records that are coded up by granular ethnic groups, geo-referenced and longitudinally linked between 1997 and 2016. Thus, we are able to define a number of segregation case studies that can be benchmarked against the picture offered by conventional data sources. In so doing, we demonstrate the value of Consumer Registers for segregation studies and outline new, potential insights.
Definition of case studies
Using the Ethnicity Estimator as described above, we are able to follow the 2011 Census ethnicity categorisation, which was developed by the ONS (2009) in consultation with key stakeholders, and to further isolate French, Greek and Polish ethnicities from within the ‘Other White’ category of estimates. The longitudinal structure of the linked Consumer Registers further enables us to attain an annual resolution by which segregation may be measured. We further aggregate the population counts by ethnic groups to 2011 Census Output Areas, which are the lowest geographical level in the UK Census and are used by the ONS to maintain disclosure control for Census outputs.
We first carry out some general validation of estimated ethnic composition in urban and rural areas in England and Wales. We proceed with an estimate of segregation of ethnic groups in those areas, and finally explore the different dynamics of segregation at annual resolution between 1996 and 2007 in three urban study regions, Greater London, Greater Manchester and Birmingham and one rural region, Lincolnshire. In those regions, we go beyond Census categories and explore trends related to three groups normally subsumed under ‘White Other’: French, Greek and Polish. Our hypothesis is that the UK settlement patterns of nationals of founding and accession EU member states are each geographically distinctive. This distinction demonstrates the heterogeneity masked within conventional data sources for ethnicity research.
Measurement of segregation
Although numerous indices have been proposed to quantify the extent of ethnic segregation, each of them has limitations and fails to capture all dimensions (Massey and Denton, 1988). For example, a common critique voiced about the Index of Dissimilarity is that it is heavily influenced by the population size, and it could overestimate segregation levels to different degrees, depending on spatial unit sizes and minority proportions. More recent methodological developments such as the Theil’s entropy index overcome this issue; however, they mostly are undermined by the difficulties of interpretation. Despite this critique, such indices are widely applied in academic and policy studies. Hence, in order to ascertain the value of novel data sources in advancing segregation research, we examine ethnic segregation using the Index of Dissimilarity and the Index of Isolation representing evenness and exposure, respectively, for comparability and interpretability purposes. Nonetheless, the use of Consumer Registers and other aspects of our analysis can be easily extended to other segregation measurements.
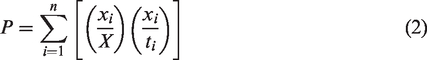
The pairwise Index of Dissimilarity

In addition, in order to evaluate the influence of randomness, we test the significance of the Dissimilarity Index under the null hypothesis of no systematic segregation. Following the randomisation tests of Boisso et al. (1994) and Carrington and Troske (1997), we generate pseudo-sample distributions with 1000 repetitions by randomly allocating individuals from different ethnic groups to 2011 Census Output Areas. In each repetition, random numbers of the group population
Results
Ethnic composition in England and Wales
We validate ethnic composition, as estimated from Consumer Registers, with the adult population (age 16 and over) of the Censuses in 2001 and 2011 and find a high level of consistency (see Table 1). The estimated proportions of ‘White British’, Indian, Pakistani, Bangladeshi and ‘Black African’ groups estimated from the Consumer Registers are similar to those found in the Census. The Chinese are underrepresented in comparison with the 2001 Census and the ‘Black Caribbean’ groups are underrepresented in both years, whereas the ‘White Irish’ groups are overrepresented in Consumer Registers. Some possible explanations for the overestimation of Irish include mismatches between names-based ethnic origin and self-identification, given a high degree of common historical roots and cultural similarity between British and Irish people. Kandt and Longley (2018) describe how the Ethnicity Estimator software upweights probabilistic assignments of all ethnic minorities relative to White British, in order to improve successful identification of minority group membership: a consequence of this is the observed under-prediction of the White British group, largely corresponding to over-prediction of the White Irish group that may consider itself largely assimilated into the White British category. The underrepresentation of minority groups, such as the Chinese, may be due to their ineligibility to register to vote. Consequently, they are not well captured in the pre-2003 Consumer Registers which are largely based on the Electoral Roll. Such a situation appears to be mitigated in the 2011 Consumer Register by the compensation of consumer sources. In addition, the Black Caribbeans are more difficult to detect through names classification due to the disruption of traditional naming practices as one of the consequences of a family history of enslavement (Kandt and Longley, 2018).
Ethnic composition in per cent found in Consumer Registers compared with the adult population (16 and over) 2001 and 2011 Censuses (italics).
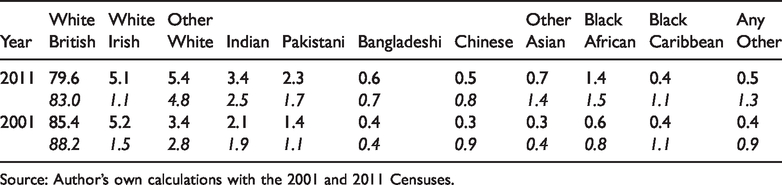
Source: Author’s own calculations with the 2001 and 2011 Censuses.
In sum, the inferred proportions of ethnic groups in Consumer Registers largely align with those in the Censuses, and hence Consumer Registers offer a valid resource to estimate ethnic composition in more details. To do so, we divide Output Areas into urban and rural Output Areas using the ONS 2011 Rural–Urban Classification 1 for England and Wales. Defining 1997 as the base-year, we calculate yearly population counts for each ethnic group and divide these by population counts for the corresponding groups in 1997 (see Figure 1 and Supplemental material Table S1).
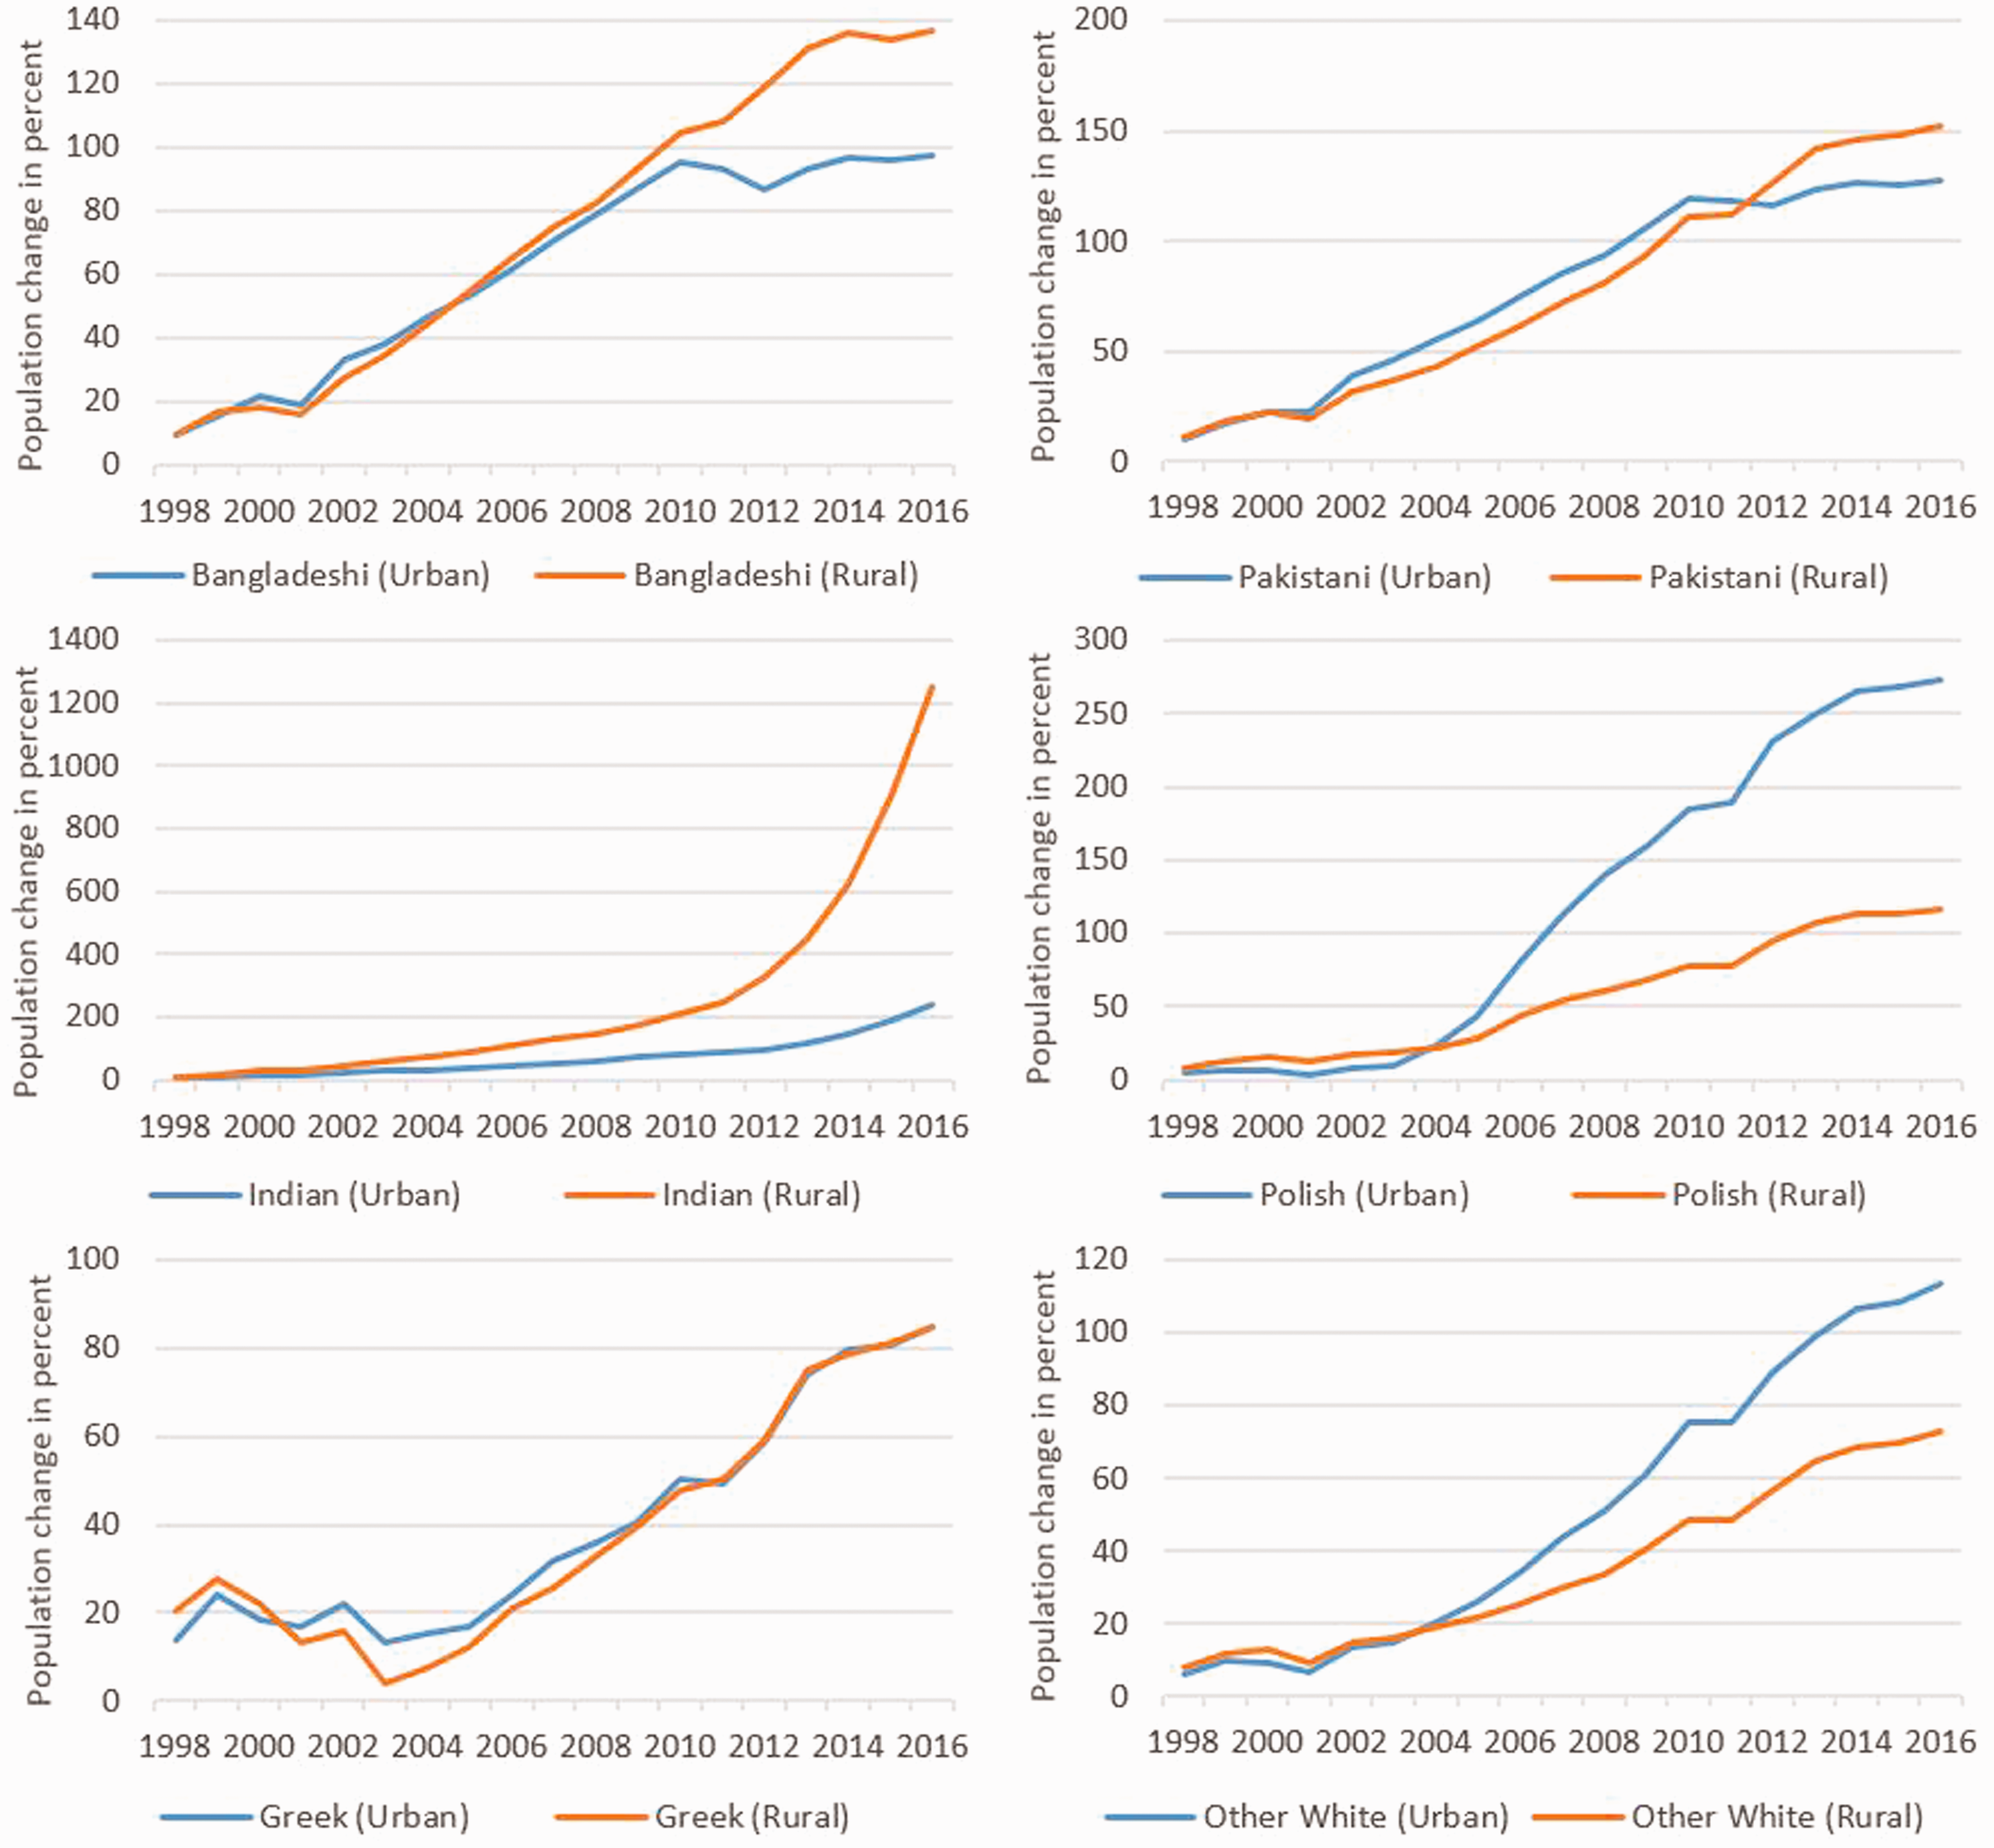
Annual population change in per cent relative to 1997 for selected ethnic groups in urban and rural areas estimated from Consumer Registers.
Both urban and rural areas have experienced population growth by all ethnic groups over the last 20 years. Growth is particularly pronounced for Indians in rural areas. In addition, two trends can be identified from annual population growth rates by selected ethnic groups, as shown in Figure 1. Growth in numbers of some ethnic groups is increasingly divergent in urban and rural areas, but the nature of this divergence differs among some ethnic groups. While growth of Bangladeshi, Pakistani and Indian populations has accelerated in rural areas and stagnated in cities since the last Census, ‘Other White’ populations have grown more in cities. Furthermore, Consumer Registers document the marked increase in the urban Polish population following the Polish EU accession and further stagnating of this trend post 2014. A different trend emerges for the Greek population, which shrank between 1998 and 2004, only to then grow steadily in urban and rural areas alike. A similar trend can be traced for French name bearers although stronger growth occurred in urban areas. If the trends estimated from Consumer Registers are reliable, we can expect to see in the next Census notable demographic shifts in rural areas by influx from Asian groups and modestly decelerating growth of some European groups in cities.
Changes in ethnic segregation in England and Wales
While ethnic segregation is mainly studied in metropolitan areas, trends in ethnic composition suggest that the movement of ethnic minorities and migrants into rural localities in recent decades deserves increasing attention (see also Catney, 2016; Finney and Simpson, 2009). Again, we validate segregation estimates from Consumer Registers with those derived from the Censuses of 2001 and 2011. We estimate Dissimilarity Indices for urban and rural areas at the national level and calculate their CIs.
We first show the Dissimilarity Indices D and ranks of the urban Output Areas from Consumer Registers in 2011 and 2001 and compare to the equivalent statistics derived from the Censuses (Table 2). Taking values of D from 2011 Consumer Registers as an illustration, ethnic minorities (e.g. Pakistanis, Bangladeshis and Africans) are among the most segregated groups while the least segregated groups are the White groups (British, Irish and Other White). The equivalent D values derived from the 2011 Census suggest that the D values may be underestimated for all groups except the Chinese (which tend to be underestimated in Consumer Registers, as noted above). The ranking by D value across the 2011 Consumer Registers and Census remains unchanged for Bangladeshis (1), Pakistanis (2), Africans (4) and ‘White Irish’ (10), with minor differences for other groups.
Consumer Register and Census Dissimilarity Indices (D) and associated ranks, showing changes since 2001 and point estimates D* by random allocations with confidence intervals (CIs) for urban Output Areas in 2001 and 2011.
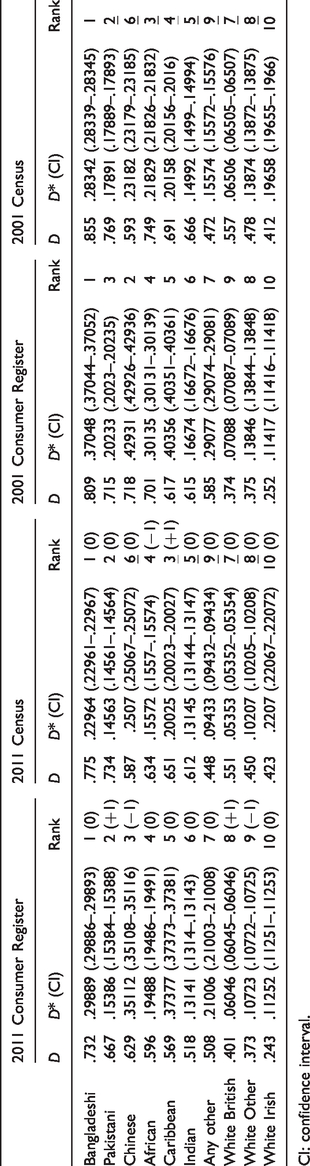
CI: confidence interval.
With respect to temporal changes, segregation levels from Consumer Registers and Censuses have both decreased in 2011 with the exception of a slight increase observed for the ‘White British’ using Consumer Registers. There are some upward and downward changes in the ranks of D values from 2001 to 2011. For example, the Pakistanis and Chinese, ‘White British’ and ‘Other White’ swap their ranks of D based upon Consumer Register data. Results for the rural Output Areas are reported in the Supplemental material (Table S2). In rural Output Areas, segregation levels by ethnic groups are high relative to values recorded for urban Output Areas for ethnic minorities; however, the ‘White’ groups are more evenly distributed in rural Output Areas where segregation levels are generally lower.
As outlined in the ‘Background: Ethnic segregation in the British context’ Section, we test the significance of the Dissimilarity Index D under the null hypothesis of random allocation. The point estimates D* and CIs from the 1000 random tests are presented in Table 2. Dissimilarity Indices D from both Consumer Registers and Censuses lie outside the CIs of the point estimates D*, thus rejecting the null hypothesis that segregation levels are random and confirming the existence of systematic segregation. However, the ratios of D* to D are generally higher in the rural Output Areas than in the urban Output Areas, since a larger component of the observed segregation D in rural areas may arise because of the relatively small population size of ethnic minorities.
It is observed from Table 2 and Table S2 that the correspondence degrees of D values between Consumer Registers and Censuses vary among individual ethnic groups. In order to present a summary metric of the conformity of the Dissimilarity Indices obtained from Consumer Registers with those from the Censuses, we conduct correlation analysis of the D values and ranks of the 10 ethnic groups from Table 2 and Table S2 for both urban and rural areas. Results of the analysis are summarised in Table S3. Here, the coefficients suggest that there are strong and positive correlations (coefficients > .8) between Consumer Registers and Censuses in terms of the index values and ranks at the 99% confidence level (p-value < .01). All in all, the correlations suggest that Consumer Registers offer a broadly accurate picture of the ethnic structure of segregation in the country and can be used as a source of information when examining segregation during the intercensal period. At the same time, the group-specific segregation indices should be viewed with caution.
Segregation dynamics in Greater London, Greater Manchester, Birmingham and Lincolnshire between 1997 and 2016
Set against the backcloth of rapid change in the ethnic composition of England and Wales, we investigate the detail of change in annual increments. It is evident from Table S1 in the Supplemental material that the Polish group has experienced quite a different process of demographic changes in terms of both amount and pace, compared with other ‘Other White’ sub-groups, such as the French or Greek. Such divergent patterns remain concealed within the aggregated ‘Other White’ in the Census. To illustrate such divergent patterns, we take advantage of our granular, names-based ethnicity estimation and explore segregation for Polish, French and Greeks separately from ‘Other White’, measuring ethnic segregation in Greater London, Greater Manchester, Birmingham and Lincolnshire. The first three cases are traditional immigrant entry and settlement points. Lincolnshire is chosen as an example of a rural and agricultural setting for increased inward, international migration.
Table S4 in the Supplemental materials presents the Indices of Dissimilarity and Isolation in the most recent year 2016 from Consumer Registers as an example to show the absolute levels of segregation across ethnic groups. There are patterns of high, moderate and low segregation levels for various ethnic groups concerning evenness. The White majority, including ‘White British’, ‘White Irish’ and ‘Other White’, have lower segregation levels compared to the other ethnic groups. The Bangladeshis in London are one of the most segregated groups, and they are highly concentrated in particular areas in East London. The Greek group appears to be the most segregated group in each of the four areas. However, unlike the Bangladeshi community, the high segregation index values of the Greeks can be mainly attributed to the small size of the Greek community, as the distribution of smaller populations is more prone to randomness in a statistical sense as we demonstrate in the previous section and Table 2. Given their small population size, similar arguments can be applied to segregation levels of the French group in Greater Manchester and Birmingham, as well as all of the ethnic minorities in rural areas like Lincolnshire.
Despite these statistical concerns, the relative, temporal changes of segregation indices remain meaningful for each group. We plot the changes in Dissimilarity Index values by ethnic groups each year relative to 1997 in Figure 2. We can ascertain that although ethnic diversity has been increasing with respect to the proportions of the ethnic minorities, the Dissimilarity Indices of most of the ethnic groups have been dropping, except for ‘White British’ and ‘White Irish’ in the three urban areas and ‘Other White’ in Lincolnshire. Such a decrease suggests that these minority groups are more evenly distributed and less segregated than before. In contrast to these groups with gently declining Dissimilarity Indices, the Indian, Black African and Polish communities have experienced a dramatic fall in the segregation levels in terms of the evenness dimension.
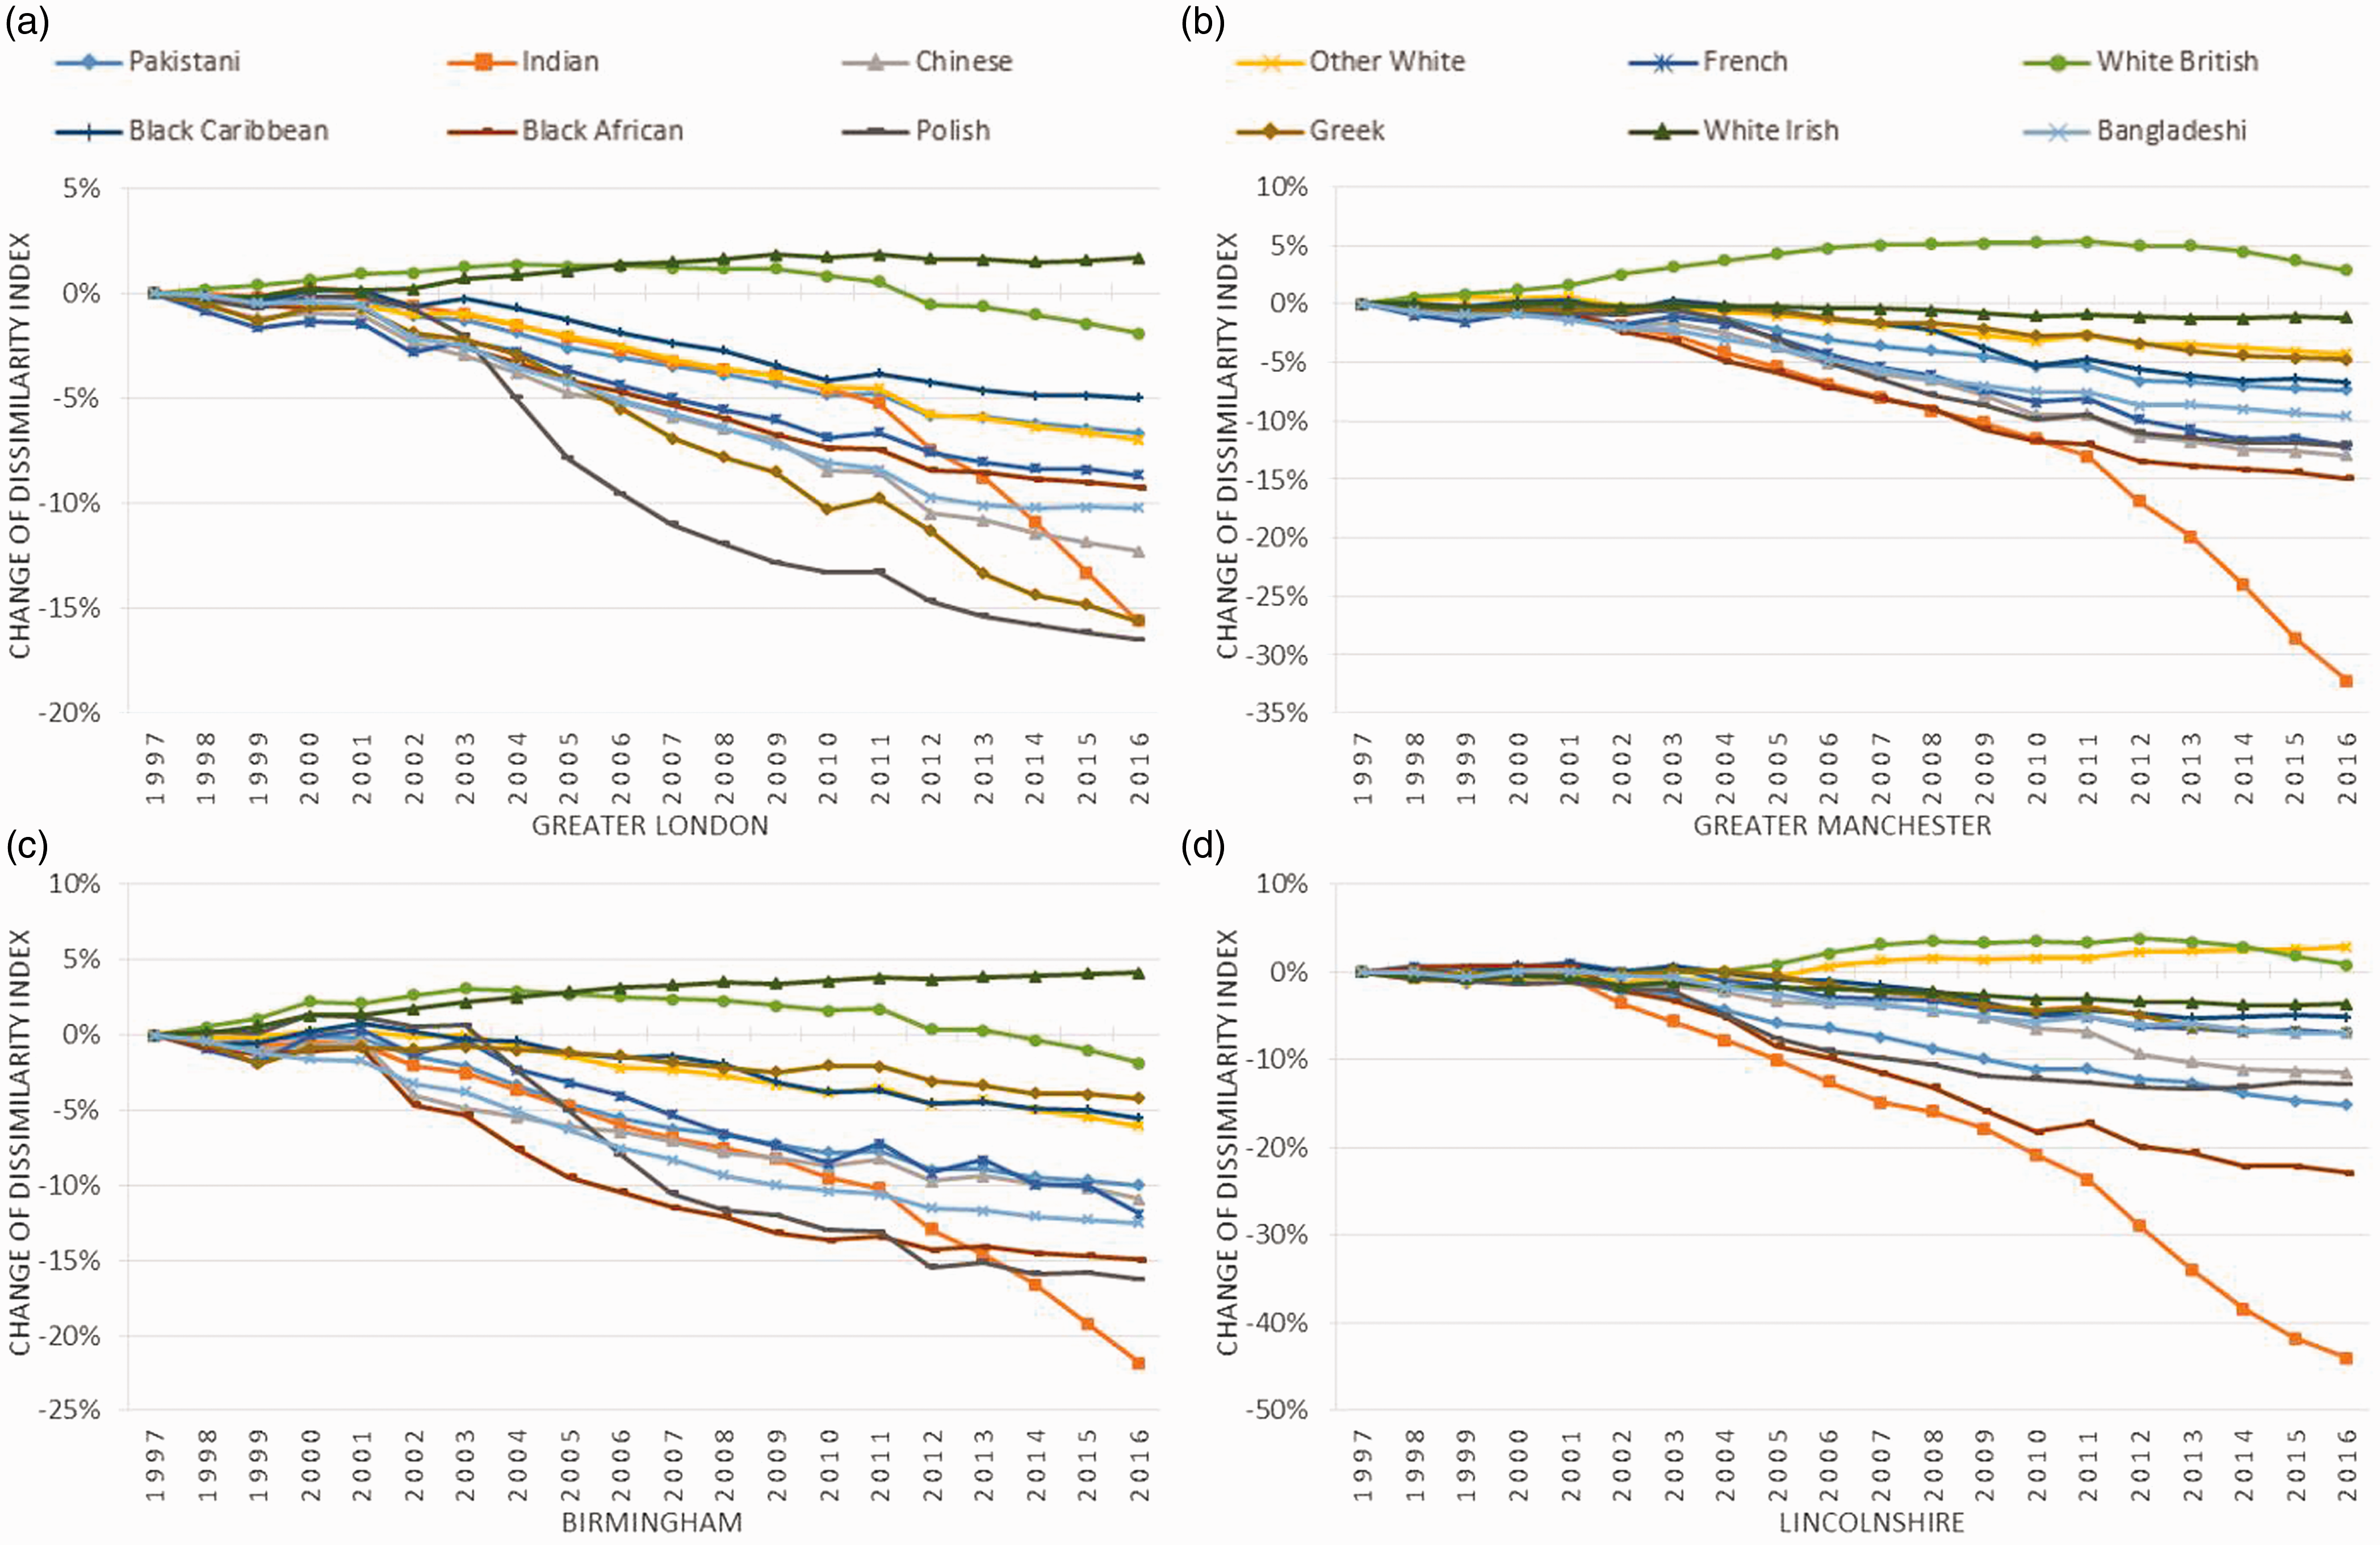
Change of the Dissimilarity Indices with respect to 1997 by ethnic groups in the case study areas, 1998–2016. (a) Greater London, (b) Greater Manchester, (c) Birmingham and (d) Lincolnshire.
In particular, we observe pronounced decreases in the Dissimilarity Indices for the Poles across the four areas from 2004. This trend is consistent with the national trend in urban and rural areas presented in the Supplemental Table S1. The changing pattern of the Polish residents is quite different from the other communities from the EU, particularly the French. We may speculate that the apparent dispersion of Polish residents in Lincolnshire is a result of their settlement in areas of agricultural labour market shortages since the 2004 Polish EU accession. The Indian group appears to be distributed more evenly across Output Areas in the four urban regions, particularly after 2011. Such observations would not be possible with the Census population data until the next Census in 2021.
Measuring the exposure dimension of residential segregation, we find varying levels of Isolation among ethnic groups (Table S4). The south Asian groups – Bangladeshis, Pakistanis and Indians – seem to be more isolated in the four case study areas, which indicates that they tend to live in spatial clusters with less likelihood of meeting people from different ethnic communities in their neighbourhoods. ‘Black Caribbean’, Chinese, Greek and French remain at relatively low levels of Isolation, which may be partly due to their small overall population sizes. Regarding the temporal trend of the Isolation Indices (see Figure S1 in the Supplemental materials), some of these groups have become less segregated along the exposure dimension, for instance the Bangladeshis. Others have experienced increasing levels of Isolation, most notably the ‘Black Africans’ in urban areas and the Polish, Indian and ‘Other White’ groups in Lincolnshire. The Greek and French also exhibit almost identical stability in levels of segregation; conversely, there has been increased Isolation of Poles since 2004, which may reflect the sensitivity of Isolation indices to relative population size. Combining the two measurements, Simpson (2007) has suggested that the Index of Dissimilarity and Index of Isolation can change in opposite directions in response to significant streams of immigration. Such contrary changes are observed in our study as well. For example, the ‘Other White’ group appears to have dispersed with the influx after the EU accession, while earlier generations of the ‘Other White’ group may have moved away from existing concentrations. These trends are reflected in the decreasing Dissimilarity Indices and increasing Isolation Indices.
We use 2001 and 2011 Census population figures broken down by ethnic groups as benchmarks and examine the changes in the composition of the Consumer Registers in the intervening years (see Figure 3). These changes in the four case study areas generally correspond to the national trend of the ethnic composition summarised in Table 1 but with local variations. Mostly, the proportions of ‘White British’ and ‘White Irish’ have decreased in the four case study areas while others have increased. Increases in the proportions of ‘Other White’ groups in London, Manchester and Lincolnshire are very apparent, as are those for Pakistanis in Manchester and Birmingham. The intercensal population changes by ethnic groups are largely mirrored well in Consumer Registers in terms of ethnic composition change between 2001 and 2011, except for the anomalous result for the Chinese in London and Caribbeans in both London and Birmingham.
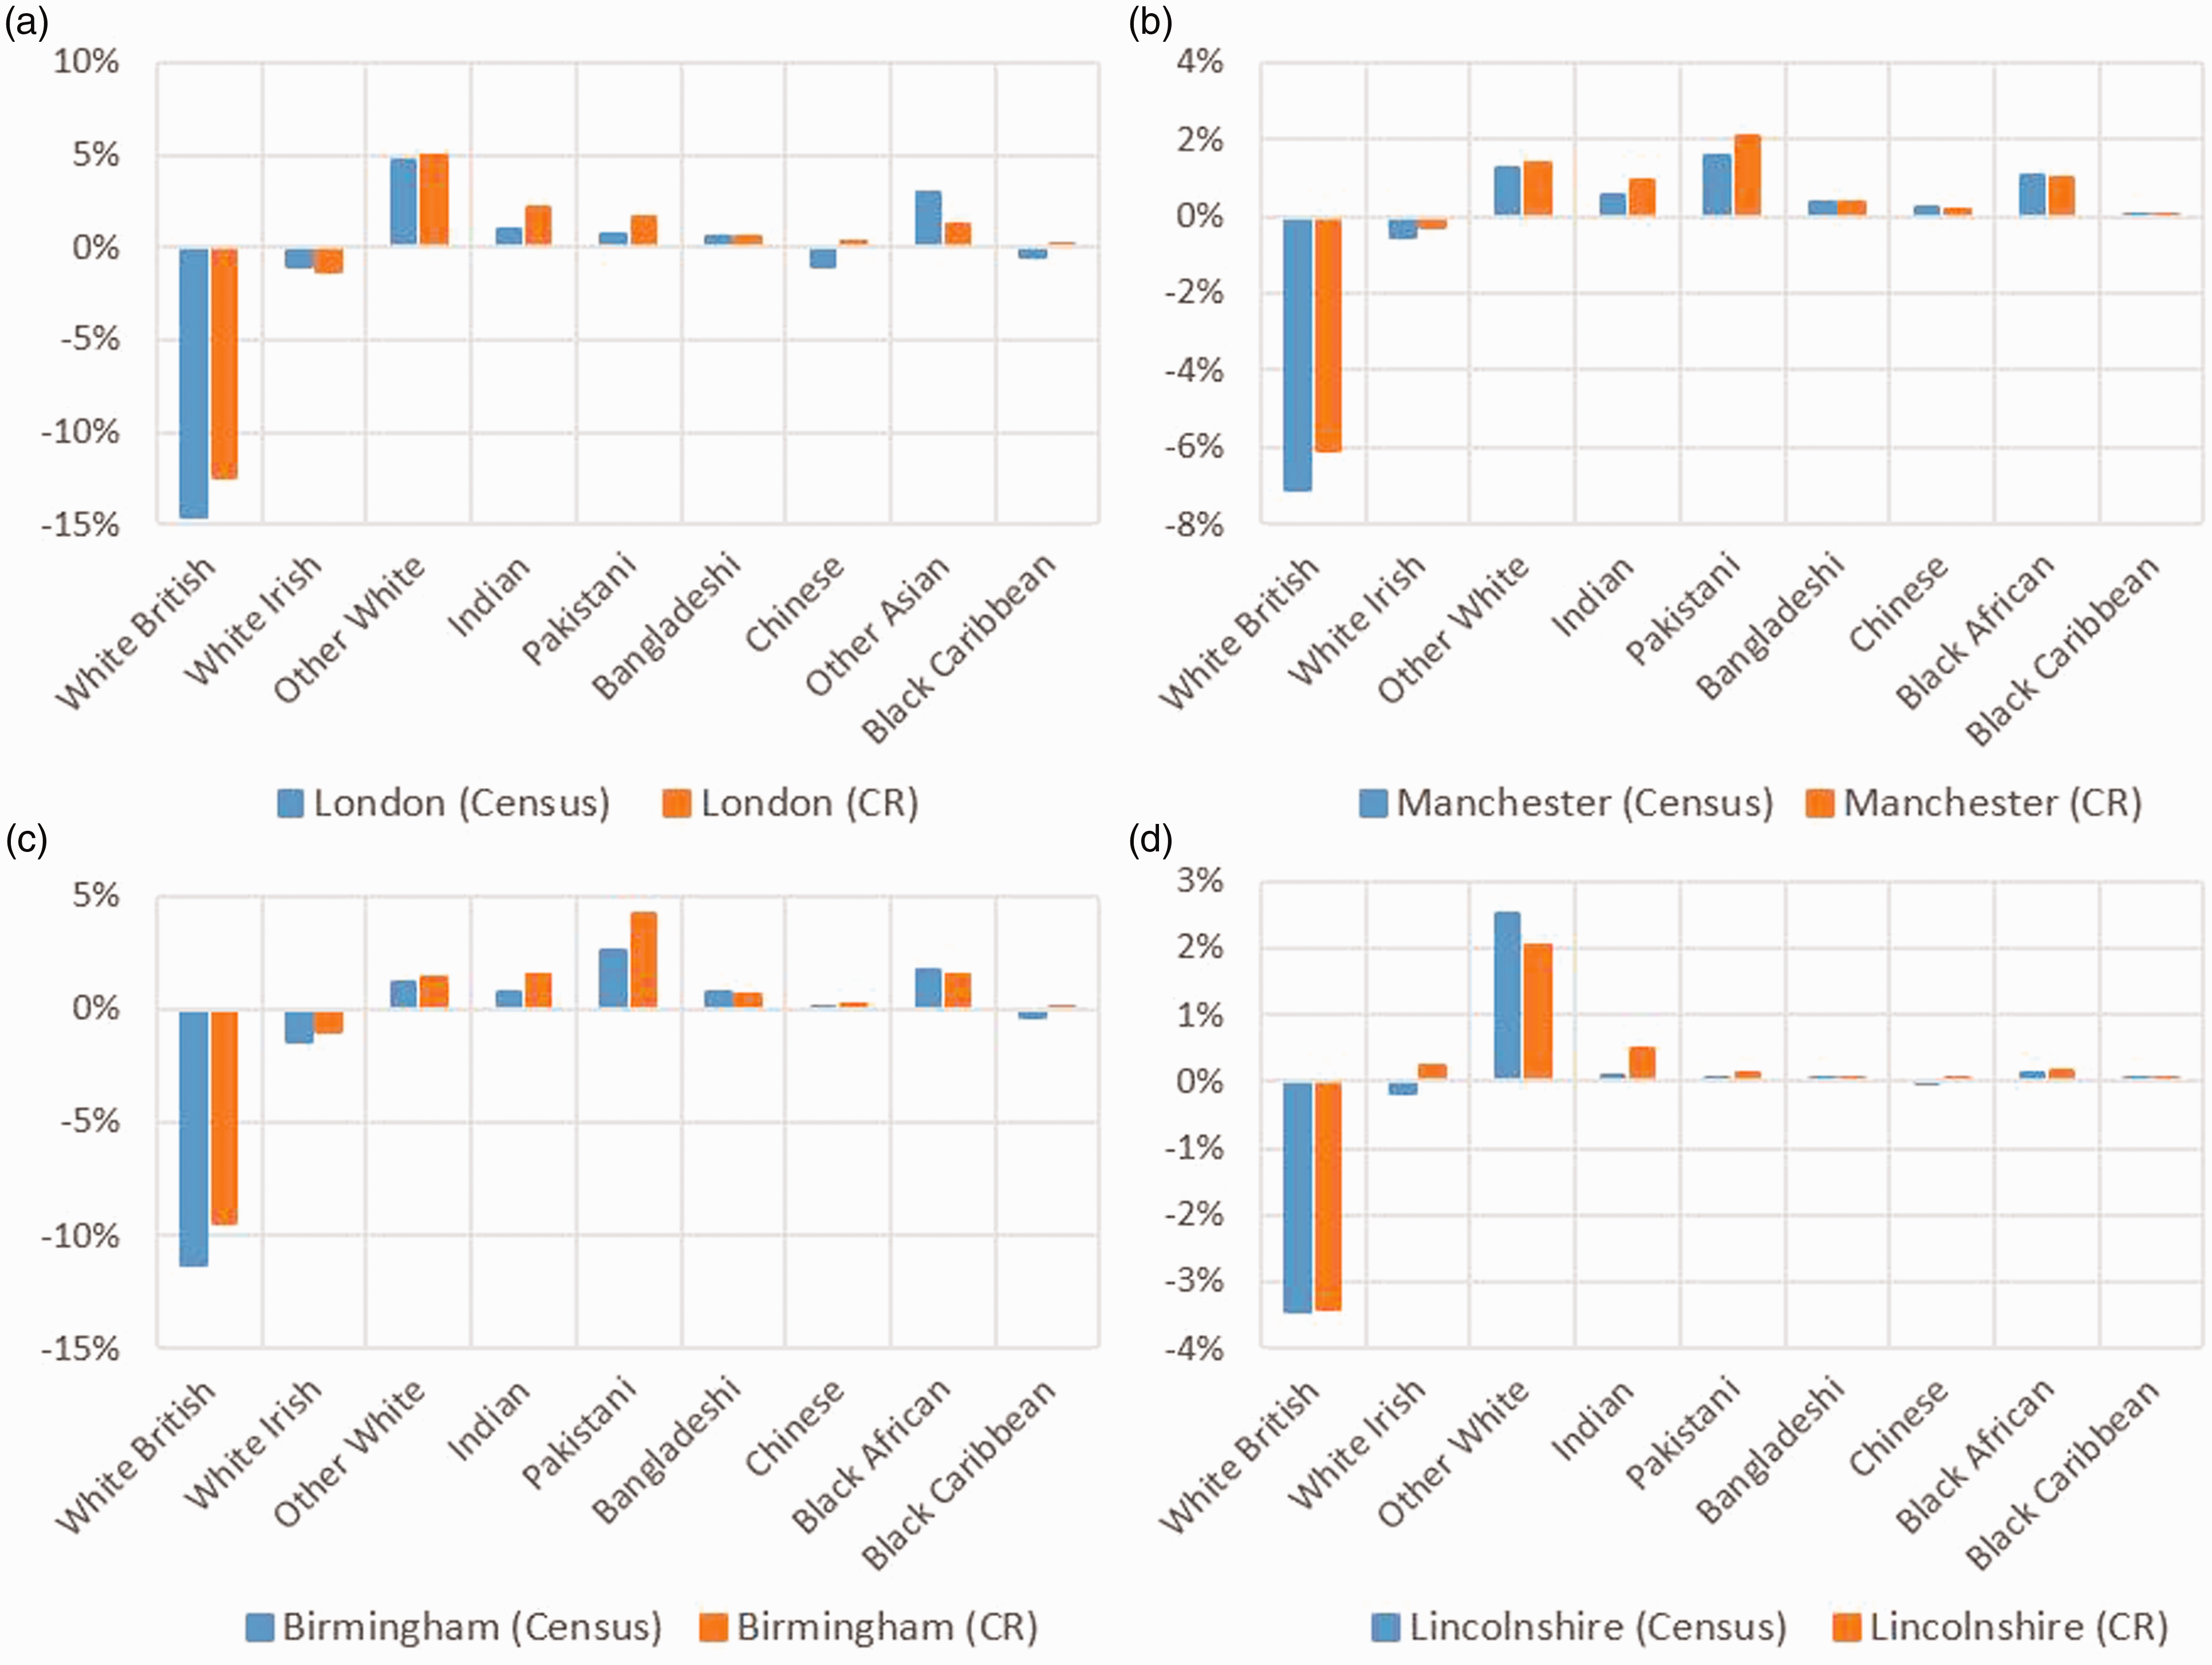
Changes in ethnic composition between 2001 and 2011 as estimated from the Census and Consumer Registers in London (a), Manchester (b), Birmingham (c) and Lincolnshire (d). Source: Authors’ calculations using the 2001 and 2011 Census release.
We also calculate Dissimilarity Indices of the four case study areas using the adult population from the Consumer Registers and compare them to indices calculated from the whole population recorded in the 2011 and 2001 Censuses (see Figure S2 and Figure S3 in the Supplemental material, respectively). The magnitude and trend of the segregation levels of each ethnic group largely correspond between Consumer Registers and Censuses with some nuanced differences. The datasets consistently show that some ethnic minorities, for instance Bangladeshis, Pakistanis, ‘Black Africans’ and ‘Caribbeans’, are more segregated than ‘White British’, ‘White Irish’ and ‘Other White’. A comparison of Figure S2 and Figure S3 in the Supplemental material suggests that segregation levels of most groups have been decreasing in both data sources.
Despite the overall correspondence in segregation measurements from Consumer Registers and from the Census, we notice the degree of correspondence varies among ethnic groups and locations. Segregation levels of most ethnic groups have been underestimated in the Consumer Registers, compared with the two Censuses, except for the Chinese. In addition, the Dissimilarity Indices for both datasets agree more in urban than rural areas. The apparent discrepancies between the segregation indices calculated from the Consumer Registers and those from the Censuses can be partly attributed to the non-identical populations under investigation. Direct comparison between Consumer Registers and published small area Census statistics is not possible since individuals aged under 17 cannot be omitted from the latter; however, with this caveat, the degree of correspondence between the Dissimilarity Indices from the two different data sources is generally high.
Discussion: Uncovering nuanced segregation dynamics
The analysis reported in this paper breaks new ground in both methodological and substantive terms. The refined, names-based ethnic classifications of the spatially precise and longitudinal linked Consumer Registers combined generate a powerful resource for segregation studies.
Advantages of Consumer Registers
Our case studies demonstrate the flexibility and necessity of accessing finer granular categorisations, as illustrated by the noticeable disparities of segregation levels and trends among French, Greek, Polish and ‘Other White’ groups. Ethnic segregation levels depend on the granularities of the ethnic classifications under investigation. Therefore, similar heterogeneities can be anticipated for other Census groups, for example ‘Other Asian’, ‘Other Black’ or ‘Mixed’. Such groups are unlikely to share close cultural affinity and hence common clustering tendencies.
Consumer Registers and the names-based classifications in this study can largely lift restrictions of pre-defined ethnic categorisations based on evidence-based research by offering more flexibility in aggregating or disaggregating ethnic groups. The Census ethnic groups were developed for the main users of Census data and are not versatile enough to target specific ethnic groups of interest for all academic researchers and policymakers. For instance, Coombes et al. (2007) have investigated whether the early A8 2 immigrants to England went to areas of labour shortage using the Worker Registration Scheme dataset. They have also acknowledged the data limitations and pointed out there was no way to estimate the numbers of A8 immigrants in these areas at one point in time.
In substantive terms, the temporal granularity of the analysis illustrates how trends of segregation may differ over the short-term, and these differences can uniquely be detected in the Consumer Registers. For instance, Consumer Registers clearly show the accelerated increase in the Polish population and the decrease in the Dissimilarity Index immediately after the 2004 EU enlargement. Another finding is the increasingly even distribution for the Indian population since 2011, which might otherwise lay undiscovered until the results of the 2021 Census are published.
Apart from the more nuanced segregation trends and patterns revealed by our analysis of Consumer Registers, our findings further support those who assert that Britain is not experiencing an increase in ethnic segregation as a corollary to increasing ethnic diversity. On the contrary, we find that segregation levels are steadily reducing for most ethnic groups and that England and Wales have therefore become both more ethnically diverse and more residentially mixed over time. The populations of most ethnic groups are growing in both urban and rural areas. Larger proportions of ethnic minorities, for instance the Indians, are now observed in rural areas, which suggests that there is a process of dispersion beyond metropolitan regions.
This latter finding resonates with the chain migration process (Catney, 2015), which denotes the process by which earlier immigrants begin to move away from metropolitan gateway areas while subsequent immigration continues to settle in a wider set of urban cores. Observations from the exposure dimension suggest that increased evenness for some ethnic groups does not necessarily accompany increased exposure. Contrary changes in the two measurements of individual ethnic groups, such as those observed in London, may indicate significant immigration involving one or more ethnic groups.
Uncertainties and limitations
We note the nuanced inaccuracies arising from measuring segregation using Consumer Registers by validating our ethnicity estimates with reference to 2001 and 2011 Census data. We identify two major sources of mismatches: the dataset representativeness (e.g. age bias and voting registry eligibility) and systematic bias arising from the use of the Ethnicity Estimator algorithm (e.g. the underestimation of Caribbeans). Despite these discrepancies, values of the Dissimilarity Index and their ranks from Consumer Registers exhibit strong positive correlation with those obtained using Census data. The randomisation tests suggest that all of the Dissimilarity Indices are significant, set against the null hypothesis of randomness. With the caveats of certain bias attributable to the ways in which they are assembled, Consumer Registers appear to be a promising Supplemental source to, rather than a substitute for, Census data.
Additional uncertainty of ethnicity estimates arises because the provenance of the different consumer data sources used to augment the Electoral Registers with non-voters over the 20 year period is unknown, and the potential sources and operation of bias arising from opt-out from the public Electoral Roll post 2003 are also unknown. The methods developed by Lansley et al. (2019) promise to address this in parts, but more research is necessary to fully establish the extent of bias.
Another broad issue is that ethnicity is only inferred from given- and surname pairings, albeit in part using procedures that are more sensitive to the vagaries of self-assignment of identity than purely algorithmic procedures. The merits of names-based analysis would be much reduced if the focus of analysis were upon segregation of individuals from ‘New World’ countries. However, since naming conventions here bear a less clearly identifiable correspondence with geographic origins. Set against these issues, the use of algorithmic procedures to disaggregate the ethnic categories used in UK Censuses allows consideration of more classes than is possible through Census analysis. Consumer Registers also bring greatly enhanced temporal granularity, in that they are updated in real time, crystallised into annual incremental updates.
Concluding remarks
The motivation of this study has been to offer a more granular and comprehensive picture of recent segregation trends and to demonstrate the feasibility of revisiting the topic of ethnic segregation using a novel data source: Consumer Registers. Names-based ethnic classifications applied to consumer data offer an innovative and powerful way to identify nuanced patterns of and trends in segregation. Names remain an under-exploited resource in a variety of applications. In particular, the flexibility of defining finer categories of ethnicity produces detailed representations of the widely established two dimensions of ethnic residential segregation. This method can be extended to explicitly spatial investigations of segregation in future research and has the potential to enhance our understanding of ethnic segregation change both in space and over time (see, e.g. Lan et al., 2019). Removing the constraint of aggregation to Census Output Areas, future research could reconceive segregation as a problem of point pattern analysis subject to restrictions of disclosure control. In view of the high degree of correspondence of segregation patterns with the Census, Consumer Registers are promising resources to uncover new and nuanced dynamics of the complex phenomenon of segregation.
Supplemental Material
sj-pdf-1-epb-10.1177_2399808320919774 - Supplemental material for Measuring the changing pattern of ethnic segregation in England and Wales with Consumer Registers
Supplemental material, sj-pdf-1-epb-10.1177_2399808320919774 for Measuring the changing pattern of ethnic segregation in England and Wales with Consumer Registers by Tian Lan, Jens Kandt and Paul Longley in Environment and Planning B: Urban Analytics and City Science
Footnotes
Declaration of conflicting interests
The author(s) declared no potential conflicts of interest with respect to the research, authorship, and/or publication of this article.
Funding
The author(s) disclosed receipt of the following financial support for the research, authorship, and/or publication of this article: This research was funded by Engineering and Physical Science Research Council grant: UK Regions Digital Research Facility (UK RDRF) [grant number EP/M023583/1]. The research data was supplied by the Economic and Social Research Council Consumer Data Research Centre grant [grant number ES/L011840/1].
Notes
References
Supplementary Material
Please find the following supplemental material available below.
For Open Access articles published under a Creative Commons License, all supplemental material carries the same license as the article it is associated with.
For non-Open Access articles published, all supplemental material carries a non-exclusive license, and permission requests for re-use of supplemental material or any part of supplemental material shall be sent directly to the copyright owner as specified in the copyright notice associated with the article.