
Abstract
The number of electric vehicles in the Netherlands has sharply increased over the past decade. This has caused a need for the allocation of a substantial amount of new electric vehicle chargers around the country, which in turn has been acknowledged by a variety of legislative bodies. However, the approach of how these new charging infrastructures need to be spatially distributed has yet to be decided, including the distance that an electric vehicle charger could be allocated from the final destination of its driver. The hypothesis of this study is that if residents walk a longer distance to/from these charging stations, the chargers could be shared by a greater number of electric vehicle owners, and the total cost of the new charging infrastructure could be reduced. By using linear integer programming, the minimum cost of allocating new fast-charging stations in a central, densely populated area of Amsterdam, accounting for 7% of the city’s population, is calculated. The results show that if residents were to walk for five minutes (roughly 400 metres) instead of two and half minutes (roughly 200 metres), the overall cost of new electric vehicle chargers could be reduced by more than 1 million euros. The study also found that both the cost of new charging stations and their efficiency of use are vastly affected by the portion of the charging infrastructure that is saved for people visiting the area. The findings of this study are discussed in detail, including the proposal of potential further studies.
Keywords
Introduction
Future demand for electric vehicle infrastructure and the necessity of geographic verifications
The number of electric vehicles (EVs) in the member states of both the European Union (EU) and the European Free Trade Association (EFTA) has sharply increased over the last decade. In 2017, the share of EVs existing in the car market reached 1.8%, which is impressive when compared to its marginal share in 2010 (Tsakalidis and Thiel, 2018). By the year 2030, the market share of EVs is expected to exceed 20%, accounting for a projected worldwide annual sale of 3.5 million EVs (Edison Electric Institute, 2018). From 2017 to 2018, the total number of EVs in the Netherlands grew almost 20% (Rijksdienst voor Ondernemend Nederland, 2019). In June and July 2018, EVs also made up 10% of all newly registered cars in the country (Netherlands Enterprise Agency, 2018). The government of the Netherlands aspires to have 50% of newly sold cars in the country have an electric powertrain by the year 2025 (Government of the Netherlands, 2015).
This growing trend urges the need for greater EV charging infrastructural coverage to meet the upcoming demand. Directive 2014/94/EU of the European Parliament, which is a mandate regarding the deployment of alternative fuel infrastructure (Official Journal of the European Union, 2014: L.307/4), requires all EU member states to allocate ‘at least one recharging point per 10 cars’. The installation of this new EV charging infrastructure is of particular importance in the Netherlands, as the country is in serious need of EV charging infrastructure. This need is reflected in the ratio of EVs per every public charger in the Netherlands, which is the fourth highest of all the EU and EFTA member states (Tsakalidis and Thiel, 2018). The urgency for EV infrastructure has been especially emphasized by various Dutch policies, with the first goal being set by the Electric Transport Green Deal, which aims at ‘Improving and expanding the charging infrastructure for EVs’ (Government of the Netherlands, 2015: 4). In addition to this mandate, the Vision on the Charging Infrastructure for Electric Transport also emphasizes the importance of developing a fast-charging infrastructure (Ministry of Economic Affairs and Climate Policy, 2017).
These Dutch policies, however, have a major shortcoming. No policy document proposes a realistic estimation of how many new chargers are needed and how much the actual cost will be. Additionally, these policies remain silent when it comes to how new charging infrastructures need to be spatially distributed. The aspect regarding the spatial distribution of EV chargers leads to a more fundamental question: how far could an EV charger be located from the final destination of its driver? In other words, how far is an EV driver willing to walk to and from their car? The point of departure for this research is that the spatial distribution of EV chargers has a significant impact on the total cost of implementing new charging infrastructures. Therefore, the hypothesis of this study is as follows: if residents were able to walk a longer distance to their charging stations, the total cost of the infrastructure would be drastically reduced, as these stations could be shared by a greater number of EV owners.
This study aims to validate this hypothesis in a central, densely populated area located in the city of Amsterdam, the Netherlands. The study estimates the economic values of walkability, i.e. the reduction in EV infrastructure costs, that are consequent to longer walking distances between charging points and dwellings. In the next sections, previous studies and the knowledge gap in this field are discussed, with the objective and approach of this study being presented afterwards. Subsequently, both the data and the case study area are described. In the third section, the method of the study is explained. In the fourth and final parts, the results are presented and discussed.
Previous studies and knowledge gap
In recent years, the optimal allocation of EV charging stations has been a matter of interest in a variety of research studies. Based on the purpose of optimization, the previous studies could be categorized into two types: single-objective optimization and multi-objective optimization (Rahman et al., 2016). Single-objective studies seek to optimize a single property of the system, given certain constraints, e.g. minimizing the whole price (Pan et al., 2010), or minimizing the distance between charging stations and the final destination of the drivers (Chen et al., 2013). Multi-objective optimization seeks to optimize more than one objective, which are normally in conflict with one another. Huang et al. (2012), for instance, aimed for both minimization of charging costs and maximization of the use of renewable energy. Celli et al. (2012), seeking optimal solutions of a vehicle-to-grid problem, aimed for maximization of the fleet patterns of EV towards aggregators and minimization of total energy loss.
Previous studies have adopted a variety of optimization methods. In the simplest form, i.e. when an objective function of a problem can be written in a linear form, linear programming is used. Franco et al. (2015), for instance, used mixed-integer linear programming (MILP) to minimize the sum of energy costs associated with the charging of EVs. When the objective function or constraints are nonlinear, nonlinear programming methods are used. Sadeghi-Barzani et al. (2014), for instance, adopted a mixed-integer nonlinear optimization model with nonlinear constraints. Heuristic algorithms, such as genetic algorithm (GA), are used for solving large scale optimization models. Tong et al. (2014), for instance, used a non-dominated sorting GA for a multi-objective optimization of PHEV charging stations at different times of the day, subject to a large set of constraints. A variety of previous studies have optimized the fleet of the EVs. Yang et al. (2014), for instance, employing ant colony algorithms, have modelled the so-called charging traffic flow to find the optimal solutions for the spatial and temporal distribution of charging loads. Saber and Venayagamoorthy (2009) have employed particle swarm optimization to schedule a vehicle-to-grid model for parking lots.
Previous studies have searched for the optimal allocation of three types of EV chargers. The Level-1 chargers, i.e. the chargers with a charging power less than 1.9 kilowatt hours, as the most time-consuming facilities for charging an EV, are mostly considered as the charging mode for EV home charging (San Román et al., 2011). The Level-2 chargers, i.e. the chargers with a charging capacity up to 19.2 kilowatt hours, which is enough for charging an EV overnight, are mainly considered to meet charging demands of one household or a relatively small community of households (Rawson and Kateley, 1999). The Level-3 chargers, i.e. the chargers with a charging power of 50 kilowatt hours or more (Smith and Castellano, 2015), are considered as proper facilities for public charging, as such a facility could charge an EV over an hour. The use of Level-3 charging facilities, however, due to imposing a great load on electricity grids, is typically associated with additional costs for electrifying the charging stations. Sadeghi-Barzani et al. (2014), for instance, minimized the cost of cabling between a candidate charging location and its closet electricity substation. They also attempted to cut the cost of grid loss in electricity transition and electricity loss of EVs arriving at charging stations.
This study aims to bridge a knowledge gap in the previous studies, which is found to be that there is no study available that estimates the economic value of walkability. A handful of previous studies have imposed a constraint on maximum walking distance. These studies, however, have not estimated the economic value of walkability and have not taken the status of the electricity grid into consideration. To allocate EV charging stations to public parking, Chen et al. (2013) sought to minimize the total walking distance between the charger infrastructure and the final destination of the drivers, and they imposed a maximum cap on the walking distance. Brandstätter et al. (2017) constrained their solutions based on the principle that ‘Customers are willing to walk from their origin to a charging station and from a charging station to their destination, as long as the associated walking distance (time) does not exceed a given threshold’ (21). By studying a conceptual model involving the vehicle-to-grid charging, Jiang and Fei (2013) imposed a constraint on the maximum acceptable walking distance.
Objective and approach of this study
This study aims to estimate the cost of allocating new, fast EV charging points, in addition to measuring how the walking distance length between both charging points and the drivers’ final destinations affects the overall costs of EV chargers. In accordance with Directive 2014/94/EU set forth by the European Parliament on the deployment of alternative fuel infrastructure (Official Journal of the European Union, 2014), this study is designed based on these seven principles: Principle 1. A densely populated urban area needs to be selected as the case study area (in accordance with Article 2); Principle 2. For every 10 cars, one charging point needs to be provided (in accordance with Article 23); Principle 3. Final solutions need to include the existing charging points (in accordance with Article 24); Principle 4. High power charging points with several plugins can be allocated (in accordance with Article 33); Principle 5. In the development of EV infrastructure, the interaction of that infrastructure with the existing electricity grid needs to be taken into consideration (in accordance with Article 30); Principle 6. Chargers are publicly accessible to the residents of neighbourhoods they are in, as well as to temporary visitors (in accordance with Article 26); Principle 7. Through registration cards and subscriptions, authorities can determine the share of public chargers between ones that serve the residents, and ones that serve visitors (in accordance with Article 26).
Data and case study area
Common EVs, travel behaviour and potential for use of fast charging infrastructure in The Netherlands
To calculate the average consumption of an EV driver, the specifications of the 10 most commonly sold BEVs in the Netherlands (Rijksdienst voor Ondernemend Nederland, 2019) are presented in Table 1. The average battery capacity, driving range and energy consumption per kilometre are derived to be 48.3 kilowatt hours, 252.7 kilometres and 191.1 Watt hours per kilometre, respectively.
The specifications of the commonly bought BEVs in the Netherlands during 2018.
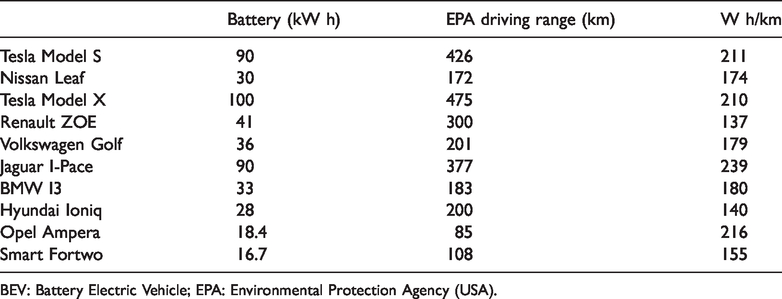
BEV: Battery Electric Vehicle; EPA: Environmental Protection Agency (USA).
The data on travel behaviour in the Netherlands (CBS, 2016) show that, on average, a car in the Netherlands is driven around 13,000 kilometres per year. This means that the average daily consumption of an EV is 6806 Watt hours. Assuming that every driver charges their car when 70% of the battery is empty, an EV needs to be charged once every five days. A fast-charger with the capacity of 50 kilowatt hours, in this respect, could be used by 15 cars during the day, which is from 6 am to 9 pm, and 13 cars during the night, which is from 9 pm to 6 am (Figure 1).
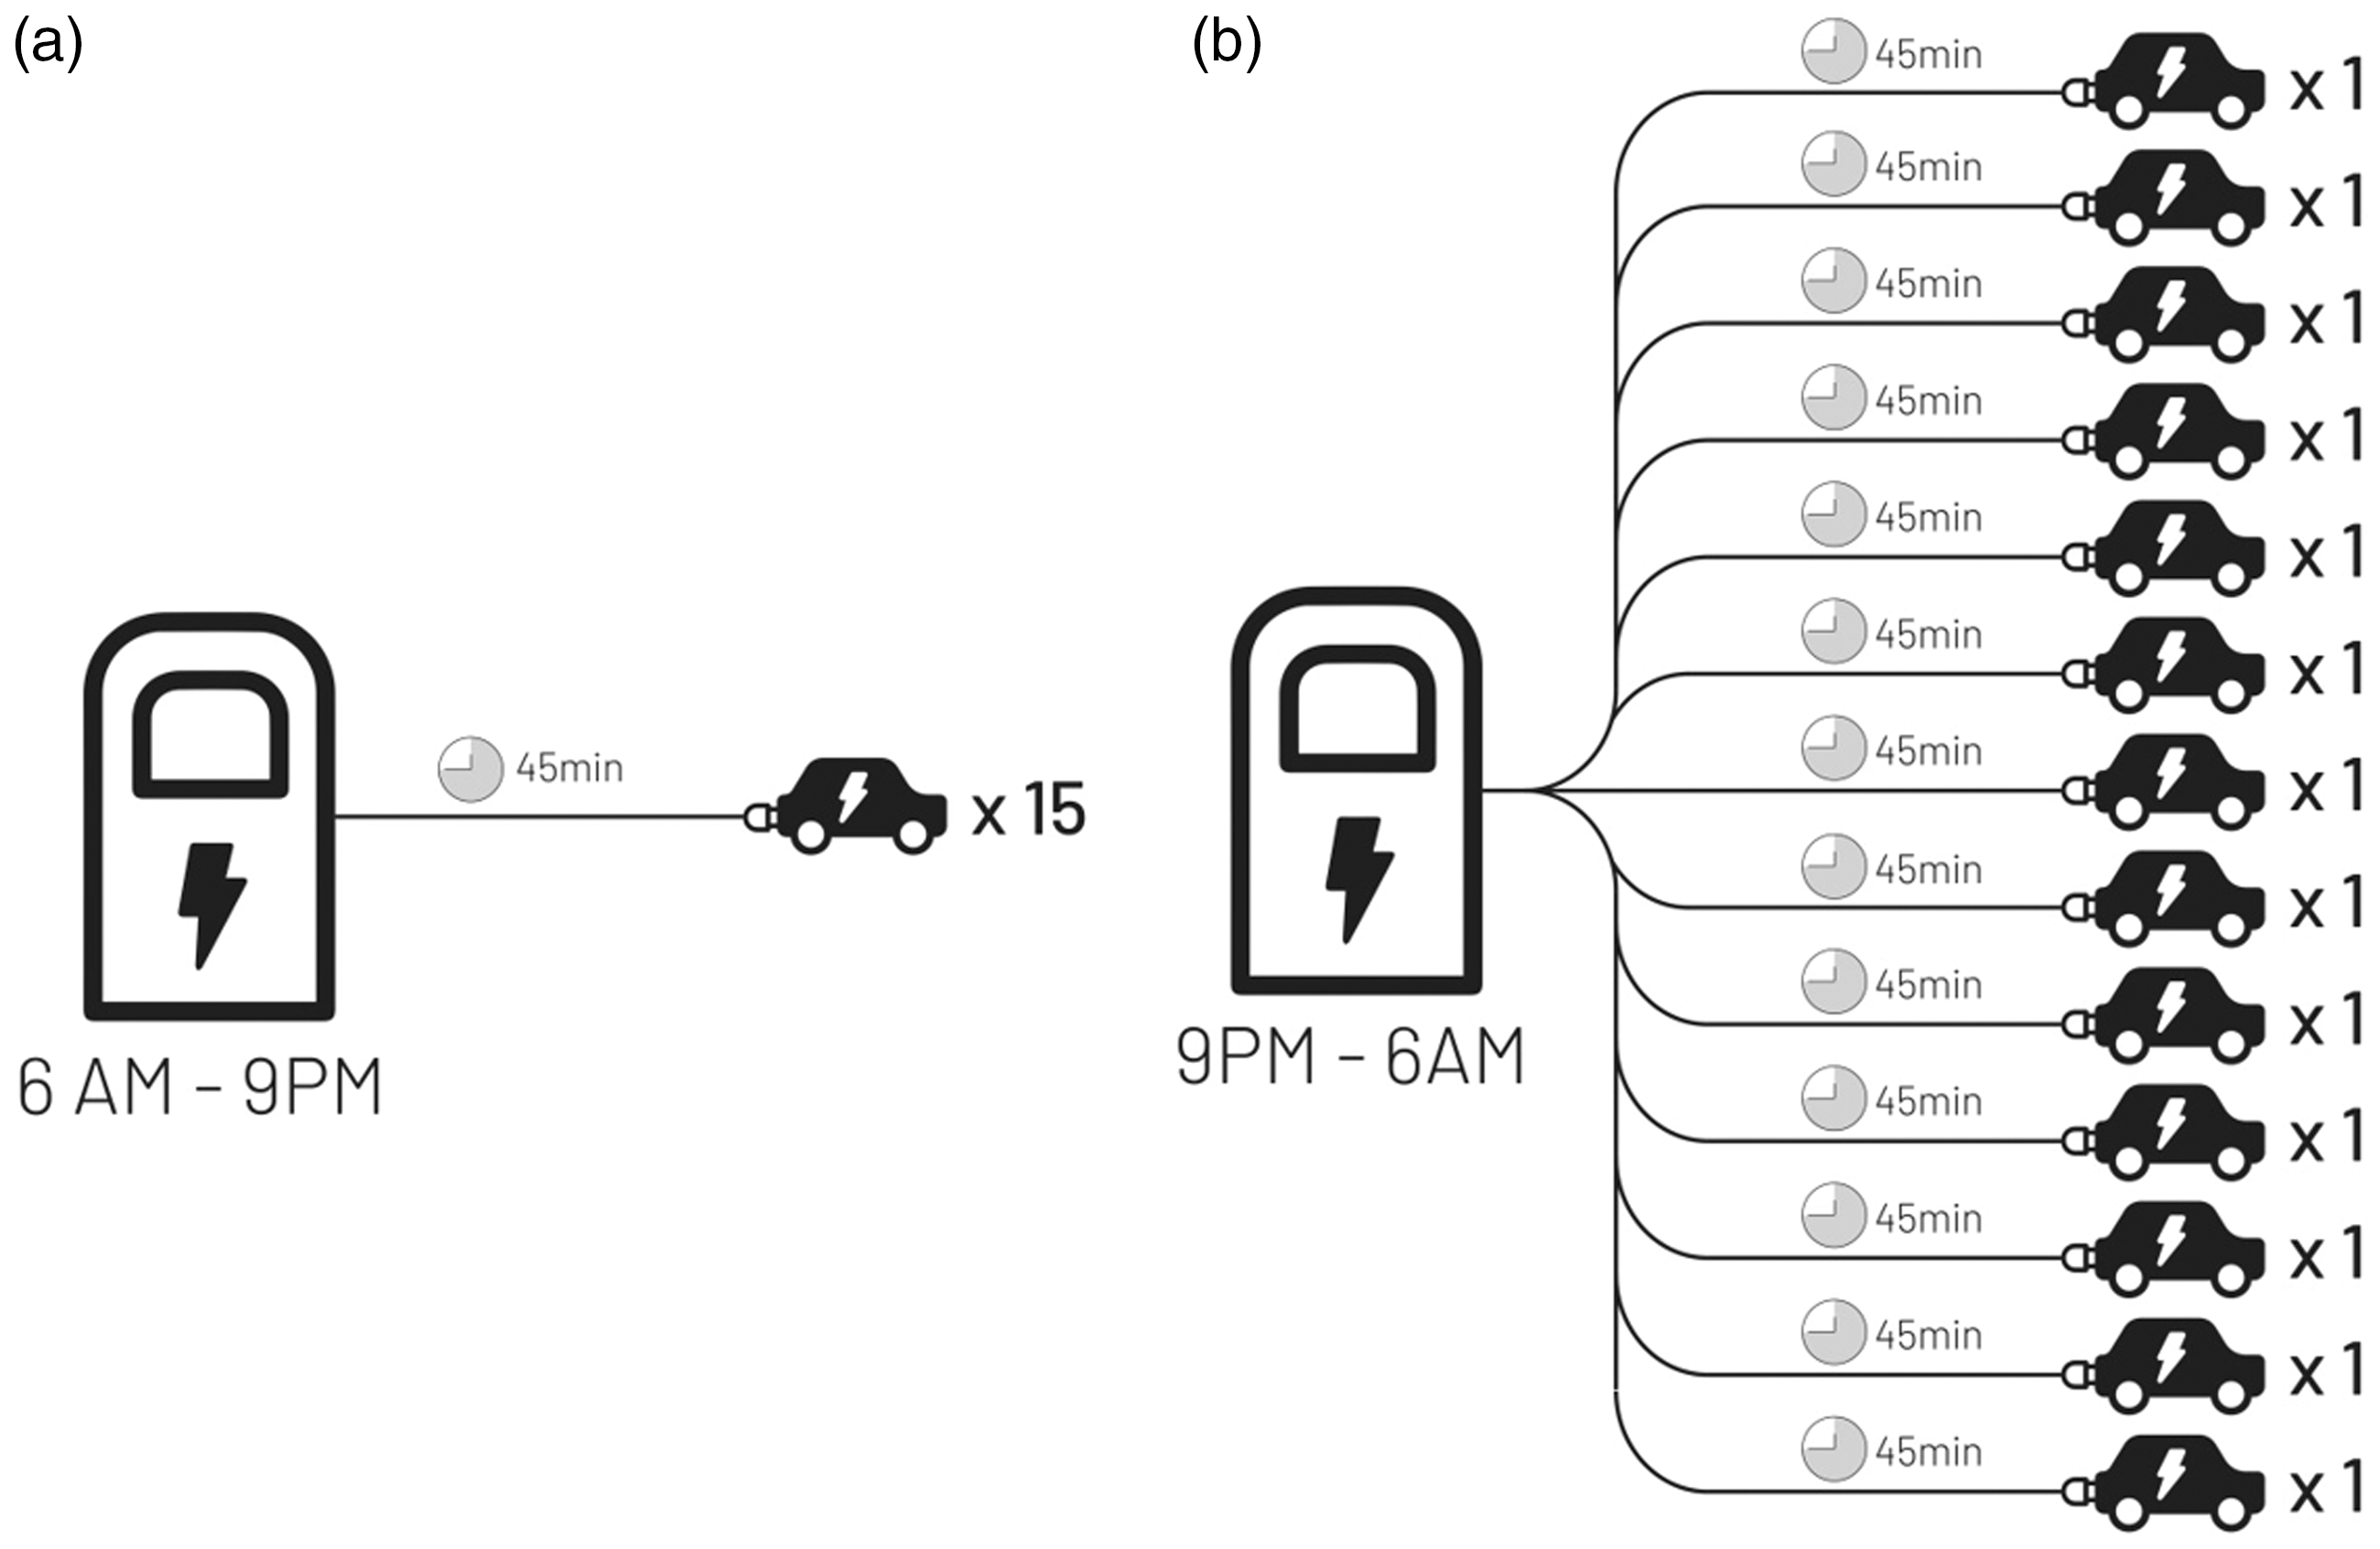
The use of a fast-charging station in the (a) day and (b) night.
Case study area
The location of this study area consists of 17 subdivisions, also called a buurt in the Netherlands, of 428 residential subdivisions in the city of Amsterdam (Figure 2(a)). In 2017, the case study area was home to 57,920 inhabitants (almost 7% of Amsterdam’s population) and 10,838 residential cars (almost 5% of that of Amsterdam). The study area is densely populated (more than 20,000 inhabitants per square kilometre), and most of its buildings are mixed-use. In 2017, the total number of businesses registered in the study area was 6750, which is almost 6% of all the businesses in Amsterdam; among them are 1020 hotels, restaurants, cafes and bars – sector codes G–I based on the SBI classification of businesses, 270 financial businesses – sector codes K–L, 2265 knowledge-based services – sector codes M–N, and 1805 businesses in recreation, art, culture and sports – sector codes R–U (CBS, 2017).
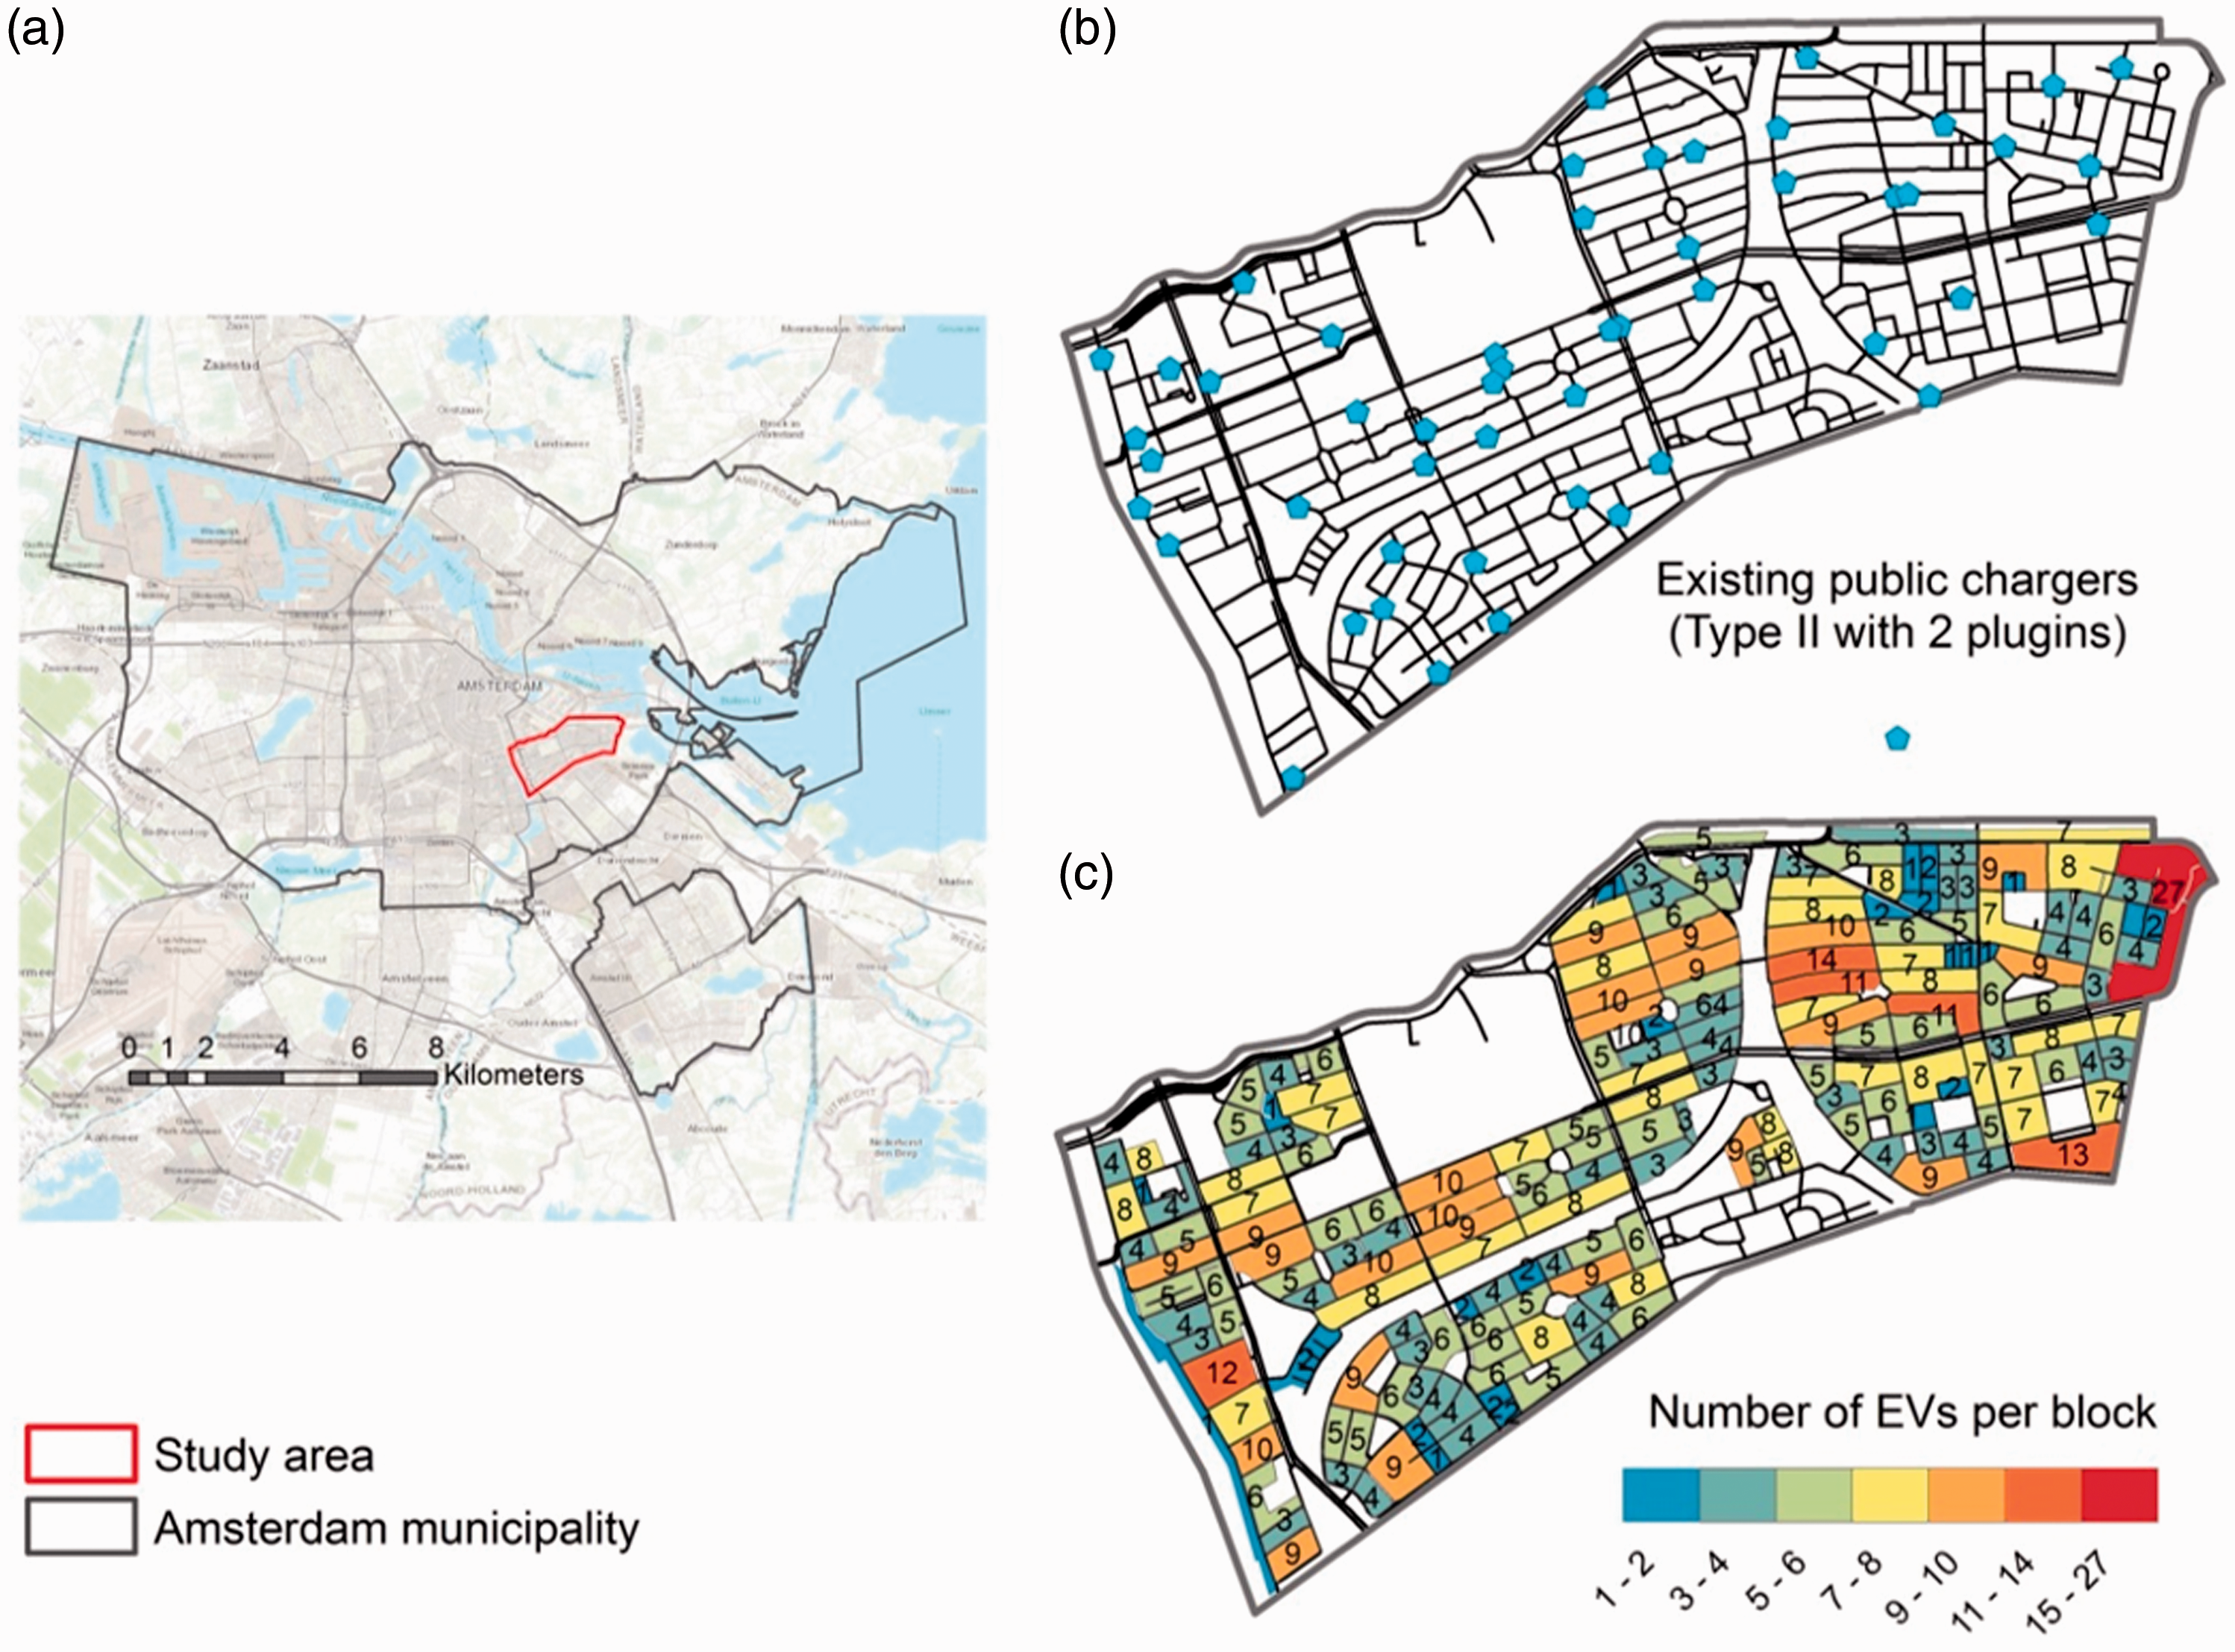
(a) The case study area, (b) the existing public EV chargers and (c) the future number of EVs, which is set as 10% of the current number of cars. EVs: electric vehicles.
Figure 2(b) shows the study area and the location of 51 public Type II EV chargers, which are characterized by both an 11 kilowatt hour capacity of charging and two plugins (Oplaadpunten, 2019). Figure 2(c) illustrates the estimation of future demand for EV infrastructure. The number of EVs in the blocks is calculated based on the assumption that 10% of residential cars will be electric in the near future (which is in line with the second of the Principles on which this study is based, see ‘Objective and approach of this study’ section). To estimate the number of residential cars per block, the total number of cars in each of the 17 subdivisions of the study area (CBS, 2017) is distributed across the blocks of the subdivisions in question. By looking at data provided by a 3D cadastre GIS database of the Netherlands (Esri Netherlands, 2015), the estimated average number of EVs per square metre of residential dwellings is calculated, and accordingly the number of EVs at each block is estimated.
Candidate locations and cost of allocating fast EV chargers
For allocation of fast EV charging infrastructure, 180 candidate locations were designated. These candidate locations were placed in accordance with the location of the medium voltage electricity substations in the area. (Note that at the request of Alliander, the energy provider company of Amsterdam, the location of substations cannot be mapped in a publicly accessible publication.) Connecting EV chargers into the distribution grid can cause congestion in the distribution grid lines as an EV charges around 35 kilowatt hours and every fast charging station could charge up to 28 EVs per day (see Figure 1). Therefore, the installation of a fast charger could result in an additional load of 980 kilowatt hours per day on the electricity grid, which can easily cause congestion. To allocate fast chargers in the case study area, every fast EV charger must be connected directly to a medium voltage substation. The candidate locations, in this respect, are designated based on three underlying rules: (1) the nearest locations to the electricity substations are chosen; (2) the distance between every two candidate locations is at least 65 metres apart, which is enough distance for 13 cars; and (3) every block has access to at least one charger within a two and a half minute walk (i.e. 200 metres). Below, the general formulation of the cost at each of the candidate locations is specified (equation (1)), and the calculated cost at candidate locations is accordingly mapped (Figure 3(c))

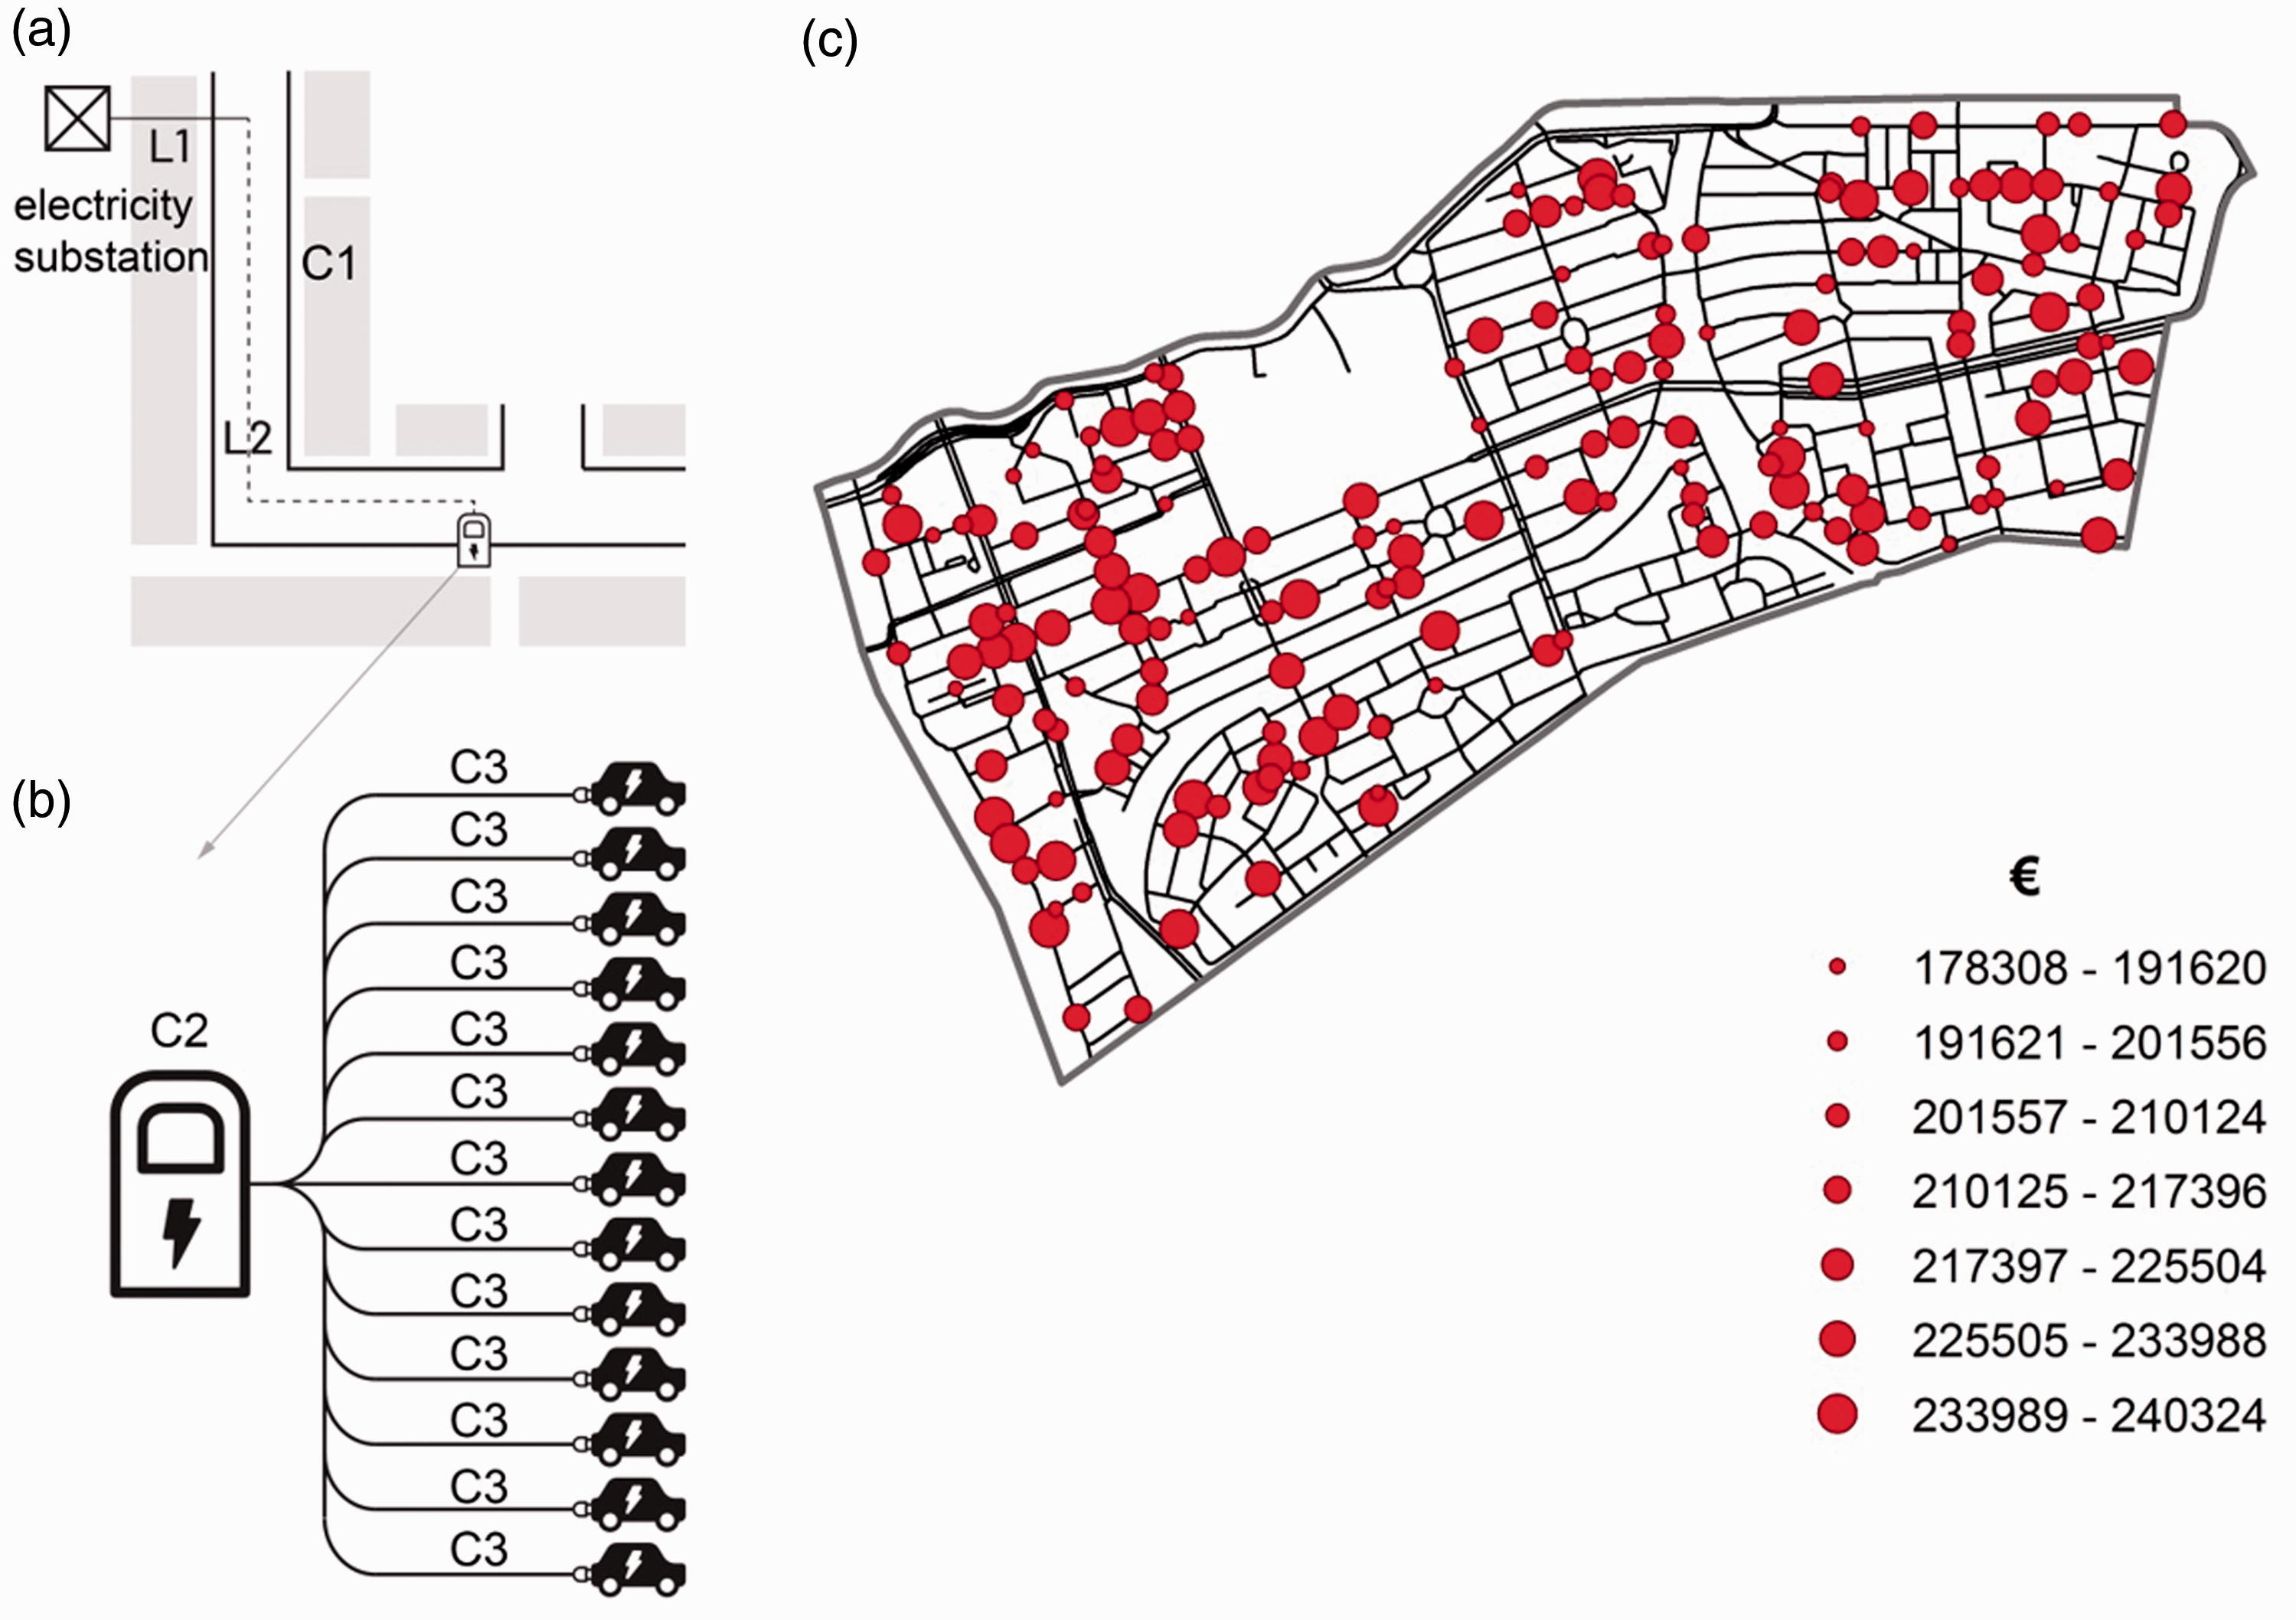
The cost of allocating a new fast-charging station at each candidate location, which consists of (a) the cost of cabling to the closest electricity substation and (b) the cost of a Type III charger with 13 plugins found across, (c) calculated across the study area.
The cost of establishing a fast charger at each of the candidate locations j (Cj) consists of three components. The first component is the cost of underground cabling between the charger in question and the closest electricity substation (Figure 3(a)). This accounts for the cost of construction from the substation to the closest street (L1), and the cost of cabling under the street from that point to the candidate location (L2). In general, there is a structural lack of data considering the cost of underground cabling, as most of the contractors are private companies, and thus keep their prices confidential (Romero and Stolz, 2002). Following the handbook of the U.S. Department of Energy, the cost (C1) of cabling in this study is set at 1200 euros per metre (Warwick et al., 2016). The second component of total cost is the price of purchasing a Type III charger (C2), which is set at the average of the cost range provided by the U.S. Department of Energy, which is 25,000 euros. The third component of cost is that of cords and connectors, the so-called installation cost (C3), which, on average, is around 21,000 euros for every two plugins (Smith and Castellano, 2015). The total cost of installing 13 EVs to a fast charger is, therefore, calculated as half of the price of the N + 1 installation cost, where N denotes the number of EVs (Figure 3(b)).
Method
The optimization model developed in this study is formulated as a linear integer programming problem, where all the decision variables are non-negative integers. The objective function of the model is to minimize the total cost of allocating new fast chargers with multiple plugins (equation (2)). The model also includes three sets of constraints. The first set of constraints ensures that every EV is assigned to a charging station, new or existing, within the maximum walking distance (equation (3)). The second set of constraints limits the number of EVs that can be assigned to a fast charger and its capacity (equation (4)). Every fast charging station can charge 13 EVs per night (9 pm–6 am). Given that every EV needs to charge once every five days, the total capacity of a fast charger during nights is set at 65 EVs. In total, every fast charger can charge 75 (5 × 15) EVs during daytime (6 am–9 pm). Given the share of daily charging capacity of each charger that is saved for visitors to the neighbourhoods (


The model parameters are introduced below:


To estimate the impact of walkability on the overall costs of new EV charging points, 12 scenarios are developed. The underlying assumption of the first six scenarios is that an EV driver uses a charging station only if it is no further than a two and a half minute (200 metres) walk from their dwelling. In the second six scenarios, it is assumed that residents would walk for five minutes (400 metres). The chosen cut-off values of walkability are beyond the 650 metre walking threshold, which is widely accepted as the proper walking distance within a neighbourhood according to Calthorpe’s (1993) urban design guidebook. These scenarios are additionally differentiated by the percentage of charging capacity during the day that is used by visitors/non-residents (Table 2).
The scenarios tested in this study.
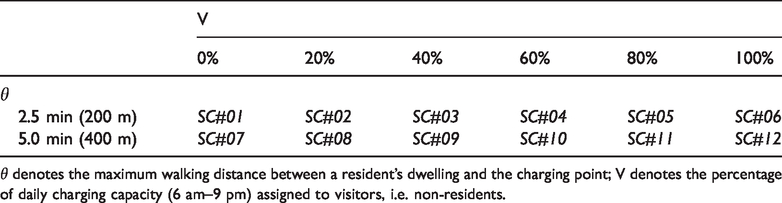
θ denotes the maximum walking distance between a resident’s dwelling and the charging point; V denotes the percentage of daily charging capacity (6 am–9 pm) assigned to visitors, i.e. non-residents.
The suboptimal solutions for each of these 12 scenarios are found using a branch and bound method of optimization, which is achieved through the MILP plugin in MATLAB (MathWorks, 2019). The reason for accepting these suboptimal solutions is because of the large size of the optimization model. The model consists of 424 decision variables and 44,763 constraints, which make finding the optimal solution a very time-consuming, if not impossible, task for a computer. In this respect, a feasible set of results is accepted as a suboptimal solution under these two conditions: (1) the absolute gap between the cost of a found solution and that of the lower bound, which is the result of a linear program that relaxed the assumption of integer decision variables, is smaller or equal to 150,000 euros (i.e. less than the cost of one extra charger); and (2) the branch and bound method has already tested at least half a million nodes.
Results
The results of the optimization models show that if residents of the neighbourhood were to walk for no longer than two and a half minutes between their dwelling and an EV charger, between 7 and 15 new fast chargers are needed. The number of needed chargers increases, while lesser amounts of the daily capacity are saved for the residents. In the case where residents are willing to walk double the amount of time between dwellings and chargers (i.e. for five minutes), the number of necessary chargers becomes significantly lower, ranging between zero and 10 chargers. Most notably, in one of the scenarios that implemented a combination of residents walking for five minutes with no chargers being saved for visitors, the existing chargers are sufficient for meeting future demands for EV charging. Under both scenarios of the two and a half and five minute walking times, when all of the daily capacity of the chargers is assigned to visitors, a sharp increase in the number of chargers needed is observed. By looking at the comparison between the optimal solutions of scenarios SC#05 and SC#06, it is shown that saving 20% of daily charging for residents could decrease the number of new chargers by one-third. In addition to this comparison, a similar comparison between SC#11 and SC#12 showed a 50% decrease in the number of new chargers needed.
By comparing the maps of solutions found for these different scenarios, some similarities could be observed. For instance, in the first six scenarios, it was found that one fast EV charger is always allocated to a similar spot, i.e. in the southwest corner of the study area. To put this observation differently, should residents walk no longer than two and a half minutes, allocating a fast charger at this very spot is essential because the southwest corner of the study area is currently empty of existing chargers. In scenarios 8–12, a charger is allocated to the same spot in the northeast of the study area, which is where one of the arterial streets of the neighbourhood intersects with a local collector street. Looking at this observation from another perspective, it is noted that under these scenarios where the residents are willing to walk for a longer distance (i.e. five minutes), one of the main junctions of the neighbourhood is the first, and in some cases, the only candidate for the allocation of a new charger (Figure 4).
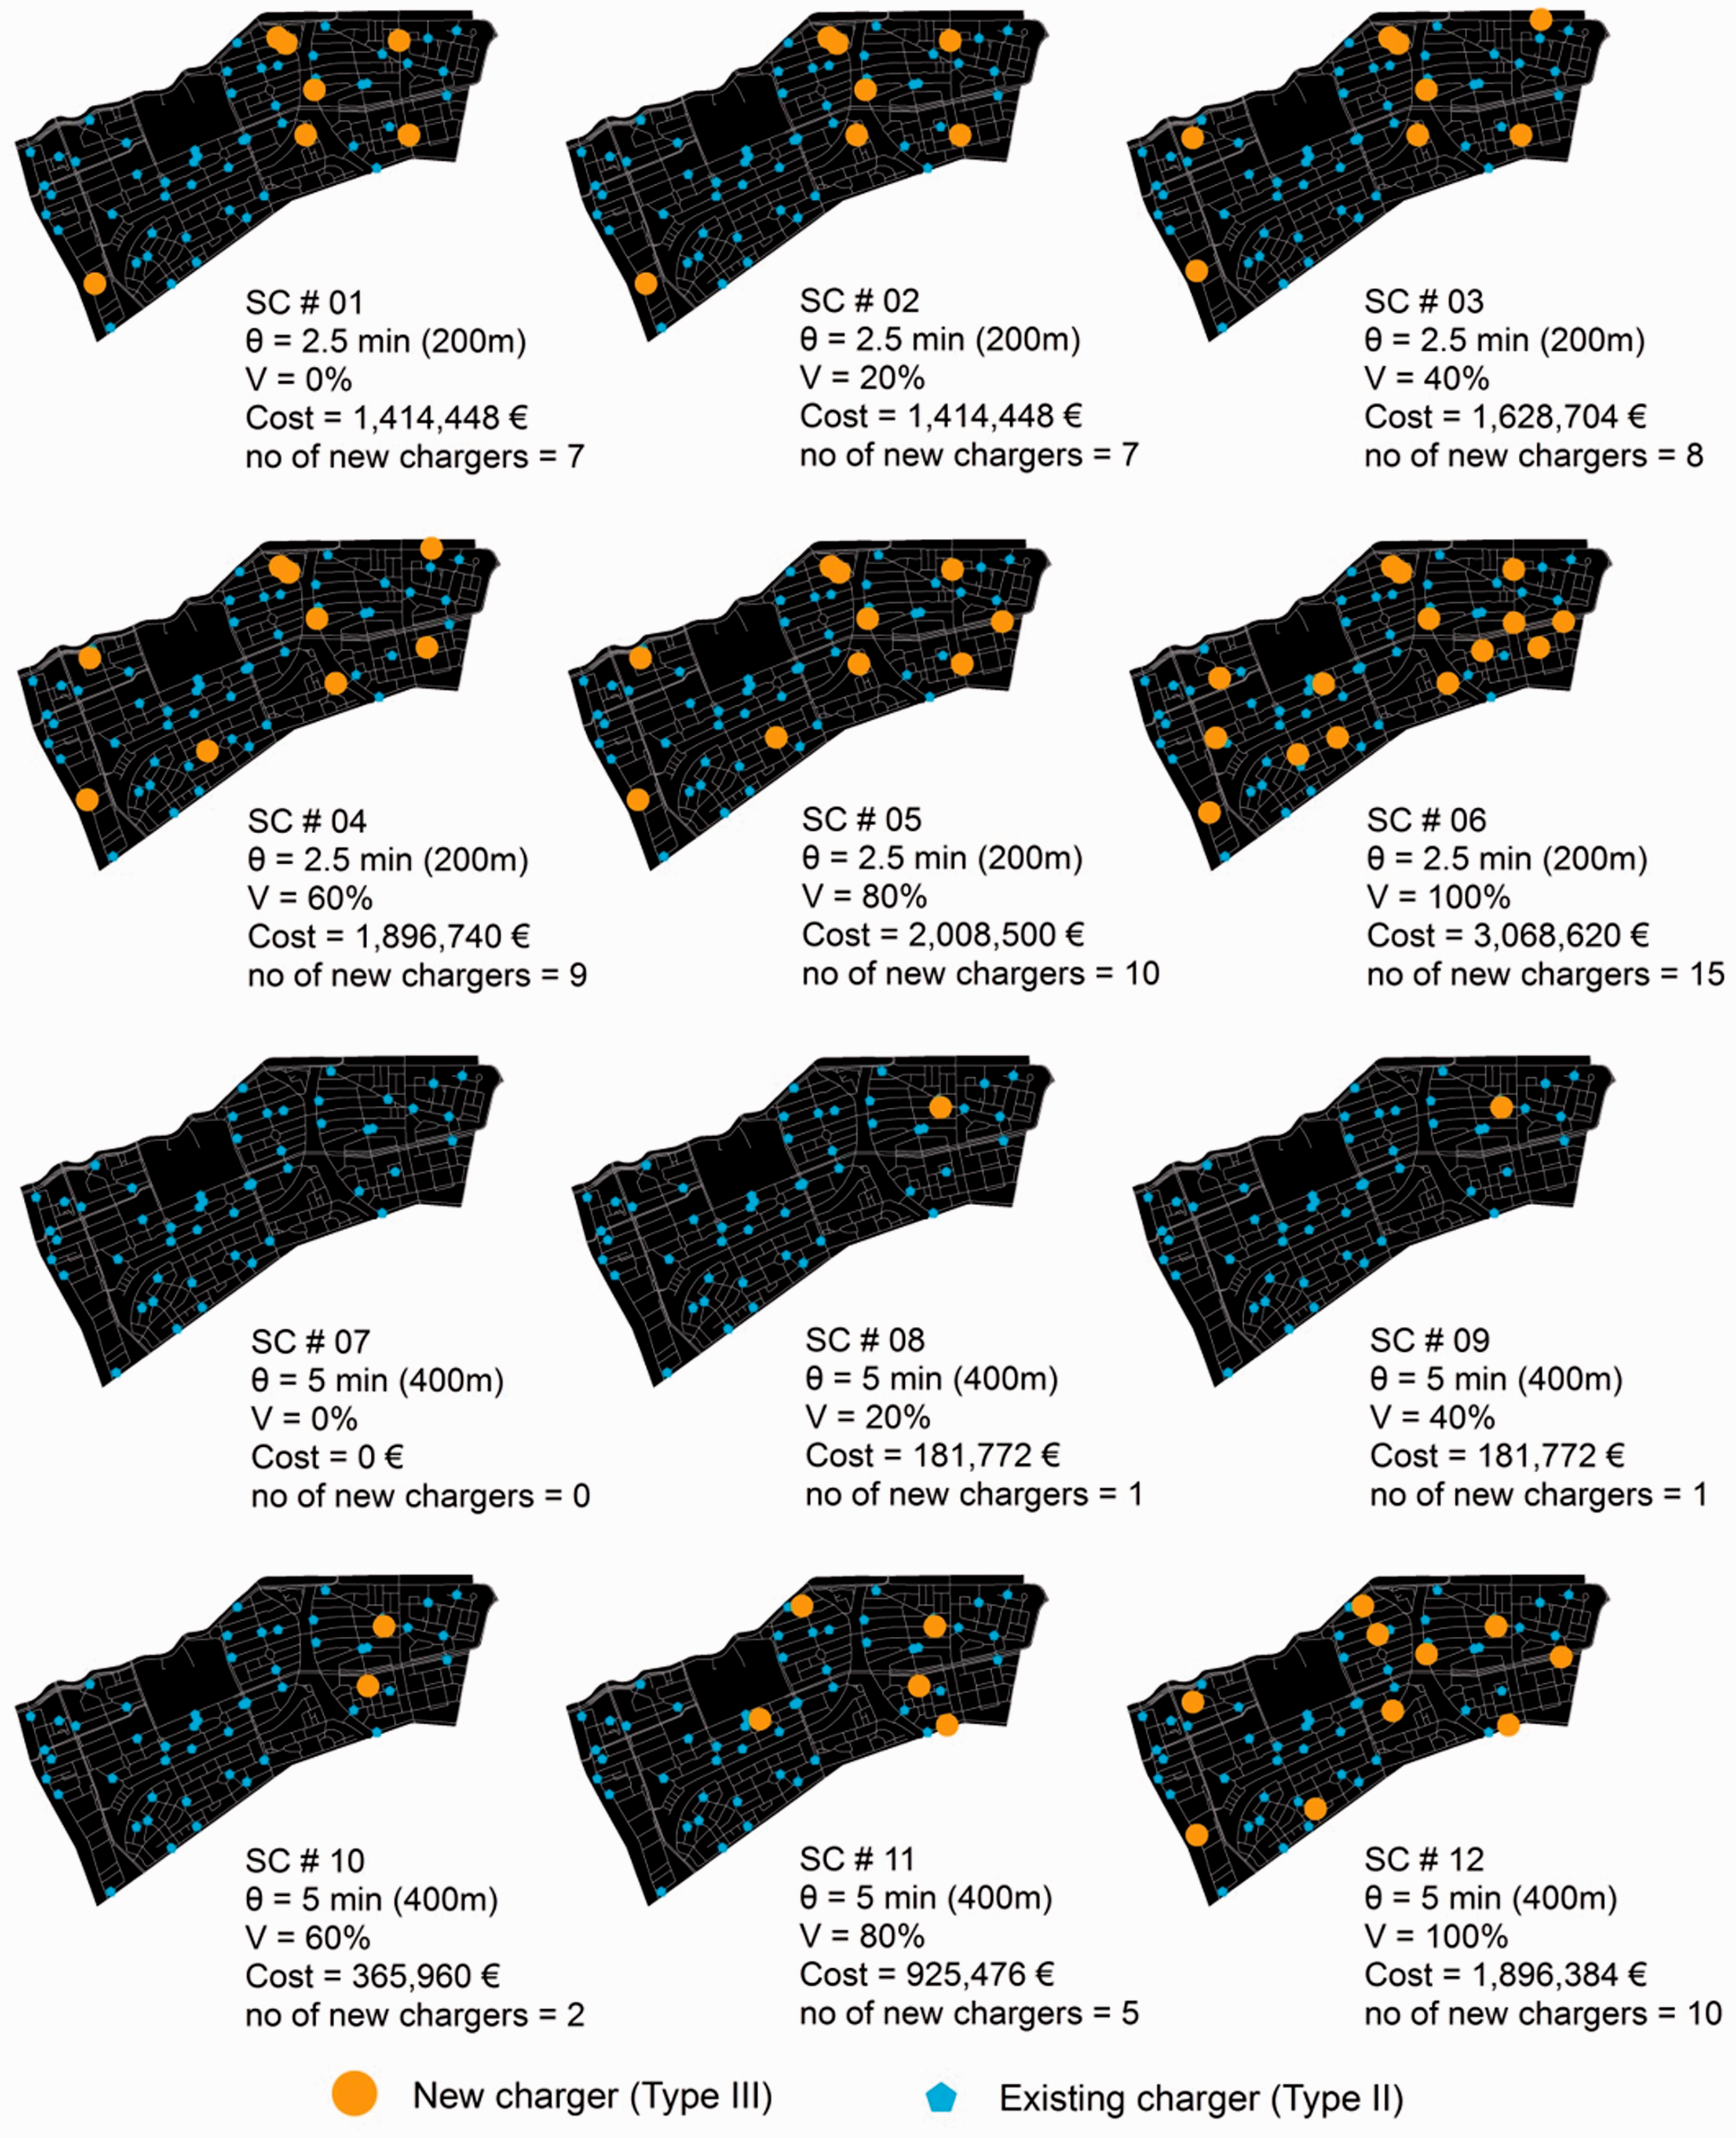
The optimal solution for the 12 scenarios.
The comparison between the overall cost of the scenarios (Figure 5(a)) shows that an extra walk of two and half minutes substantially contributes to a reduction in the overall cost. Most notably, if all the charging capacity were to be saved for just the residents, in combination with them adding two and half minutes of extra walking between their destinations and their charging stations, the cost for new charging infrastructure becomes zero (down from the previously projected 1.4 million euros). In the case where all of the daily charging capacity is assigned to visitors, the extra two and half minute walk is projected to save almost 1.2 million euros, which accounts for 38% of the total costs in new charging infrastructure.
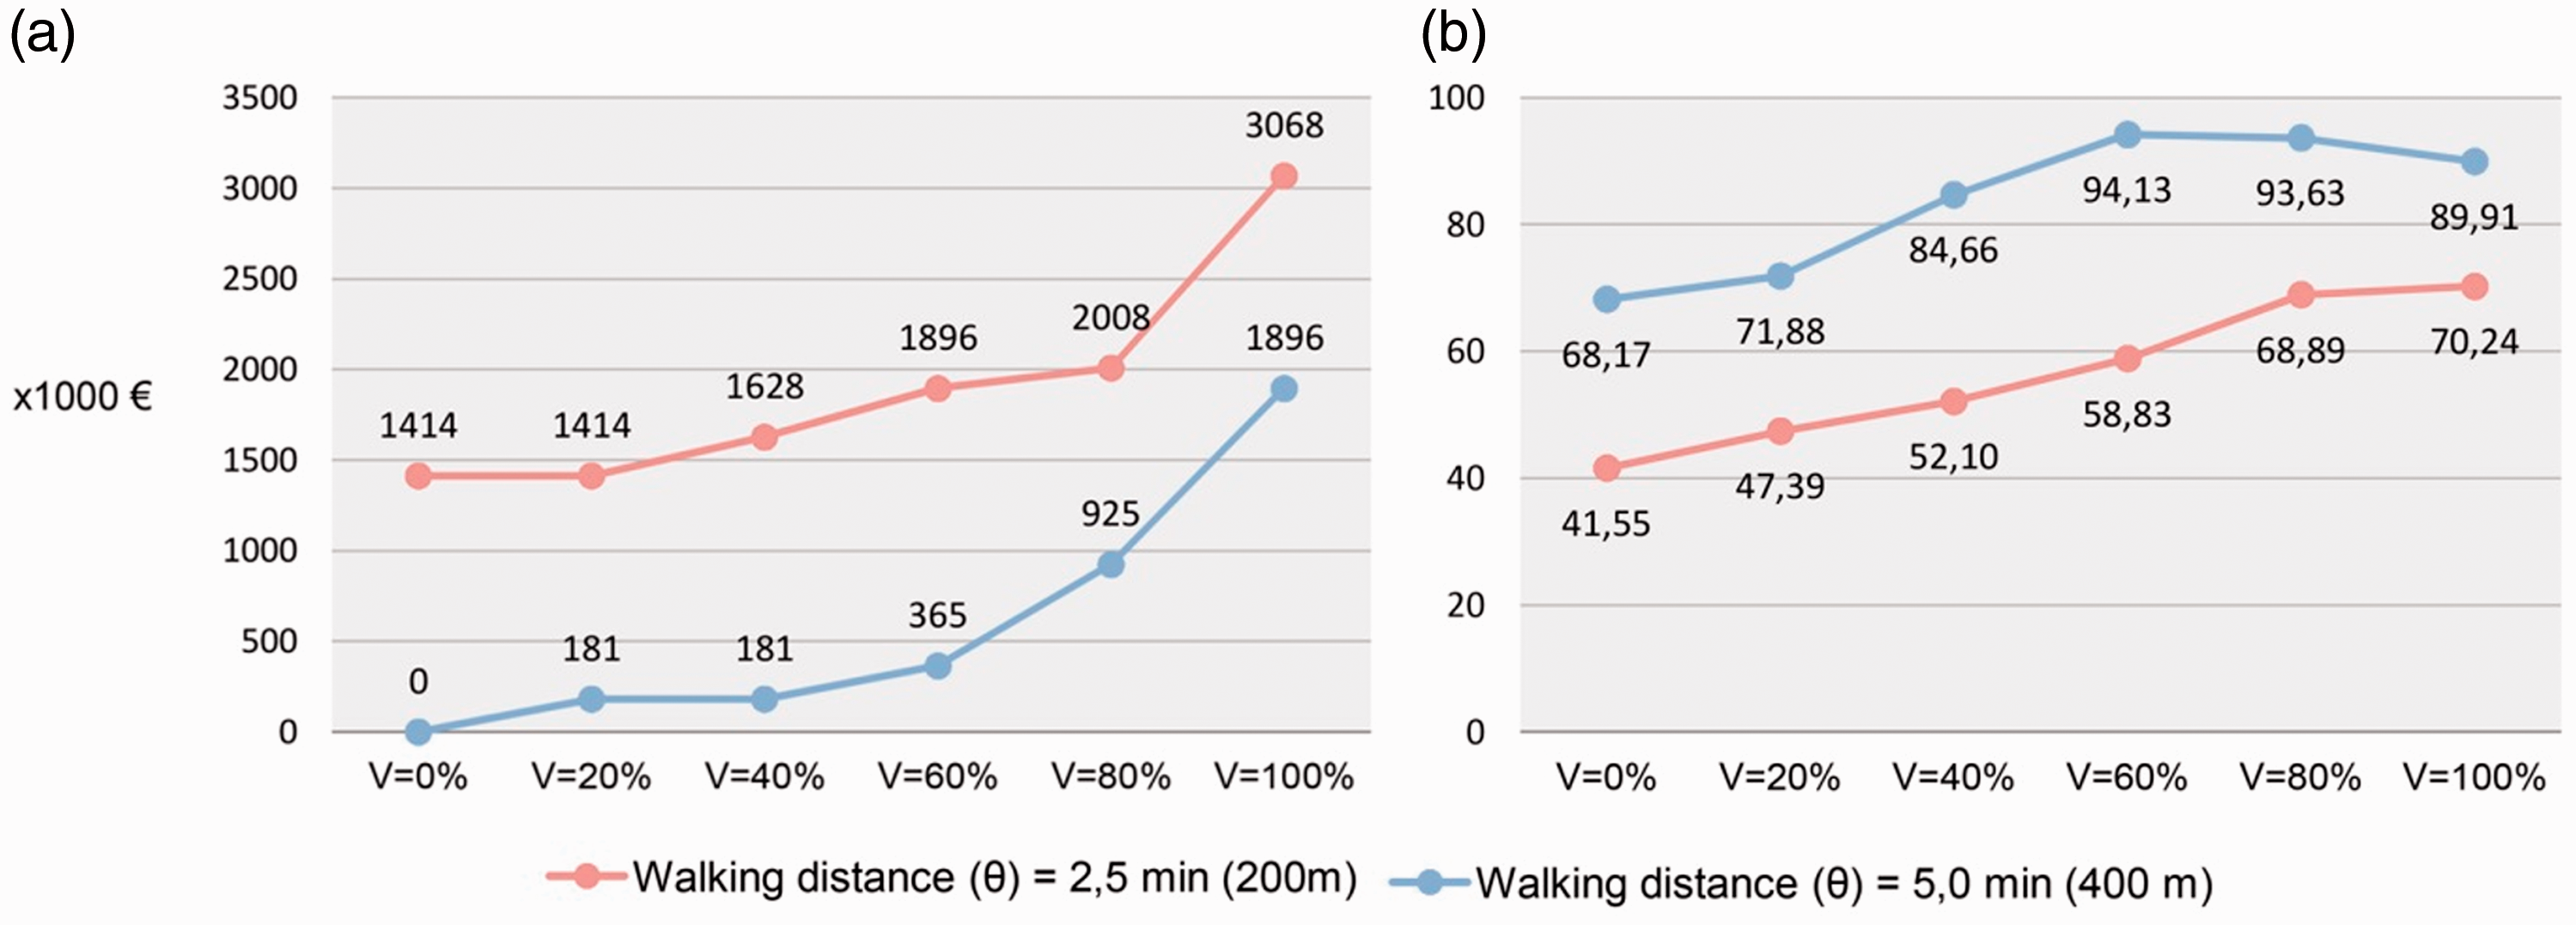
Comparison between (a) total costs and (b) the efficiency of the use of the chargers in the 12 scenarios.
The extra two and a half minute walking time has a significant impact on the efficient use of the charger facilities, the ratio of the charging capacity used by the residents to the total charging capacity available to the residents (Figure 5(b)). In case of scenarios where the residents do not walk longer than two and half minutes, a substantial portion of the capacity could remain unused. For instance, under scenario SC#01, due to the short walking range of the residents, only 42% of the available capacity is used, whereas, should residents walk for five minutes (see scenario SC#07), the efficiency of the EV infrastructure use increases by almost 27%. Saving a part of the daily charging capacity for visitors of the study area has a great effect on the efficient use of the charging infrastructure, particularly in the cases where the walking range of the residents is short. Under the long-range walking scenarios, however, it is possible that providing a higher share for visitors results in lower efficiency of infrastructure use (see the decline from SC#10 to SC#12).
Discussion and conclusion
The results of this study show that an extra walk of two and a half minutes can decrease the cost of EV infrastructure to zero or at least reduce it by 40%. The level of cost reduction, or the so-called economic value of walkability, is influenced by a complicated interplay of a variety of factors: spatial distribution of demand, location of existing chargers, location of electricity substations and street pattern. In the northeast of the study area, for instance, due to the radial street pattern, an extra walk of two and a half minutes contributes to a substantial reduction in the number of new chargers. In the southeast of the study area, however, to a large degree, the economic value of walkability is overshadowed due to the lack of existing chargers and electricity substations. The interplay of the above-mentioned factors may differ at different locations, and so too does the economic value of walkability. The core conclusion of this study is that, as the economic value of walkability could be substantial, through a careful analysis of the above-mentioned factors, a study aiming for allocation of EV infrastructure needs to estimate the economic value of walkability first, and then to set the maximum walking distance between the EV charging infrastructure and the final destination of the EV drivers.
The economic value of walkability can also be seen from a different perspective. The value, in effect, is a measurement of financial gain in return for ‘discomfort’ of a longer walk. In this study, the concept of ‘comfort’ is conceptualized as a binary phenomenon: walking up to 400 metres is comfortable for everybody, and a walk longer than that causes discomfort. Further studies could conceptualize the comfort of walkability as a fuzzy phenomenon, i.e. the shorter the walking distance, the higher the comfort. It also needs to be noted that comfort of walking varies across age groups, family types and people with specific physical conditions. Using high resolution socioeconomic data, which were not available in this study, further studies could accommodate the variation in walking comfortability across EV drivers. For example, an optimization model could ensure that vulnerable citizens, e.g. senior or disabled citizens, are granted an EV charger not further than 50 metres from their residence, while invulnerable citizens would walk for 400 metres. Further studies could also adapt multi-objective optimization models that search for minimization of two conflicting objectives: the total cost of new infrastructure and the total walking distance. To do so, it is necessary to formulate the trade-off between financial cost and walking comfort.
The results of this study indicate that the share of daily charging capacity saved for visitors has a dual impact on the overall cost of new infrastructure: on the one hand, it results in higher infrastructure costs, while on the other hand, it boosts the efficiency of use. Provision of charging facilities for visitors to a neighbourhood calls for further elaboration on two aspects: the final destination of the visitors and the total number of visitors. In this study, as the study area is highly mixed-use and the potential destination of the visitors is spread across the whole area, it is assumed that any new charger, at any location, will benefit the visitors of the neighbourhood. In the case of a less mixed-use area or an area where non-residential buildings are spatially concentrated, the potential destination of the visitors needs to be identified and incorporated into the model. To do so, further studies need to collect data on the number of travelling-with-car visitors at every potential destination. The most accurate, yet time-consuming and expensive, way to collect such data is to conduct a survey. Alternatively, based on the size and type of enterprises, further studies could estimate the number of travelling-with-car visitors at each point of interest.
In order to optimally allocate new EV infrastructure, further studies need to consider the total electricity demand at each electricity substation (i.e. the sum of the load of EV infrastructure and that of the buildings) and search for solutions that prevent any extra pressure being placed on an already congested substation. The incorporation of such a holistic approach is essential, as the Dutch Climate Accord policies aim to phase out gas use for both cooking and heating in all dwellings by 2050 (Ministry of Economic Affairs and Climate Policy, 2019). Supposedly, the spatial pattern of electricity consumption in the dwellings will drastically shift because of these aims (Mashhoodi and van Timmeren, 2018). Therefore, the use of EVs is not about EVs per se. However, it is also related to a wide scope of factors that range from the walkability of neighbourhoods, to how often an EV driver takes a warm bath. To meet the upcoming demand for EV infrastructure, it is essential to accept that EVs are becoming an indispensable part of urban life.
The results of this study call for an integrated approach to the implementation of both EV infrastructure and the quality of public space that promotes the walkability of a neighbourhood. To do so, allocation of EV chargers could be coupled with increases in pedestrian metric reach, i.e. the area of the neighbourhood that could be covered by five minutes of walking (Ellis et al., 2016), provision of wide, easy-to-walk routes (Zhang and Mu, 2019), installation of street lighting and traffic signage in order to promote the feeling of safety in these pedestrian routes (Moeini, 2012), and incorporation of green areas and public gathering spaces on these circulation paths (Koschinsky et al., 2017).
Footnotes
Acknowledgements
The authors wish to thank those responsible from Alliander energy network company for their support and sharing of data regarding the electricity grid.
Declaration of conflicting interests
The author(s) declared no potential conflicts of interest with respect to the research, authorship, and/or publication of this article.
Funding
The author(s) disclosed receipt of the following financial support for the research, authorship, and/or publication of this article: This study is conducted at the Smart Urban Mobility research group of AMS Institute, the Netherlands, as a part of DCSMART project, funded in the framework of the joint programming initiative ERA-Net Smart Grids Plus, with support from the European Union’s Horizon 2020 programme.