
Abstract
This paper presents a cross-sectional analysis of the urban land use patterns of 230 city regions in 34 European countries and an in-depth longitudinal analysis of 10 selected regions. The guiding question is whether the post-socialist transformation of urban spatial structure in Eastern European regions can be interpreted as an adaption process to Western-style urbanisation and how far a process of ‘mimicry’ has reached. Our empirical approach is based on a model designed to measure binary urban land use patterns with respect to spatial dispersion. As cities and city regions vary in spatial pattern and size, we calculate the dispersion index for three different standardised extents: squares of 25 and 50 km around the defined urban centres as well as city-adjusted accessibility isochrones. Our input layers are binary settlement classifications derived from multi-temporal Earth observation data. For the cross-sectional analysis, we cover entire Europe, and for the longitudinal analysis, we cover a sample of 10 cities for Western and Eastern Europe of predominantly capital cities of different sizes at four time steps – 1975, 1990, 2000 and 2010. We found significant differences between Western and Eastern European city regions as they have entered different stages of urbanisation. Eastern city regions are less populated, less urbanised, more dispersed and denser than regions in the West. Processes of post-socialist urban restructuring have definitely resulted in a change in land use patterns similar to that of Western Europe since the late 1950s. We nevertheless do not think that a ‘catch-up’ growth, leading to full convergence with Western-style urbanisation, will be a realistic future scenario. Eastern European urbanisation can best be characterised as hybrid: cities and city regions simultaneously manifest characteristics of convergent adaptation and path-dependency; they prove typical features of capitalist urbanisation, but relics of the socialist past are still omnipresent.
Keywords
Introduction
Even 30 years after the collapse of socialism in Central and Eastern Europe (CEE), the region can still be seen as a laboratory allowing us to learn about the change of urban spatial structure in response to far-reaching shifts in political and social organisation (Stanilov and Sýkora, 2014: 2). The transition from a socialist economy to free-market capitalism did not only result in a political, economic, social and cultural restructuring process but it also implied a large-scale transformation of urban structures.
Looking back at the past three decades, post-socialist transition is usually associated with the introduction of a democratic political system, with economic liberalisation, the privatisation of state assets and opening of local markets to international economic forces, the decentralisation of political power to local governments and the predominance of liberal, rather permissive regulatory planning frameworks (Sýkora and Bouzarovski, 2012). Alongside cultural and social changes, these large-scale restructuring processes have reshaped the institutional framework of urban and regional development as well as the built environment of cities and city regions themselves. The centralised, hierarchically organised planning system of the socialist era was abruptly replaced by a fragmented, local self-government structure where individual communities competed for tax income and economic stakeholders gained influence over land use decisions (Sailer-Fliege, 1999; Smigiel and Brade, 2011; Sýkora and Stanilov, 2014). Whereas socialist urban policies aimed at ‘balancing’ development and reducing spatial disparities (mainly by distributing development over a larger number of industrial hubs and central places), post-socialist development agendas were instead competitive and growth oriented (Hamilton, 2005; Sailer-Fliege, 1999; Smigiel and Brade, 2011). Key features of urban transformation in the 1990s and 2000s include, but are not limited to, the commercialisation, regeneration and densification of inner-city areas and a dynamic expansion of built-up space, largely driven by private actors on the re-established land markets (Sýkora and Bouzarovski, 2012).
A predominant interpretation is that the adoption of Western institutions, cultures, policies and regulative mechanisms has led to a convergent adaptation of spatial structures, implying a profound change in functional, morphological and socio-spatial patterns (Häußermann, 1996). One essential spatial outcome of this ‘catch-up’ process (Ott, 2001) is suburbanisation, a phenomenon that was largely suppressed in CEE countries before 1989 (Smigiel and Brade, 2011; Sýkora and Stanilov, 2014). The relatively compact urban form of the socialist city was, thus, gradually replaced by a more decentralised and dispersed urban structure (Ianos et al., 2016; Sýkora and Bouzarovski, 2012). From this perspective, urban restructuring in post-socialist countries follows a ‘common logic’ that is deeply rooted in institutional, political and social change (Sýkora and Bouzarovski, 2012: 44). Proponents support the ‘convergence’ hypothesis with the observation of similar trends in urban land use change, motorisation and mobility, housing preferences, spatial patterns of retail and office decentralisation, or social segregation.
In contrast, other voices emphasise the path-dependent and unique nature of urban change in CEE countries after the fall of the Iron Curtain (Großmann et al., 2015; Schmidt et al., 2015; Sheppard, 2000; Tosics, 2005). First, scholars claim that post-socialist societies do not follow exactly the same transition track. Differences in privatisation (or more specifically: restitution) policies (Sýkora and Bouzarovski, 2012) and housing policies (Sailer-Fliege, 1999) or in the pace of decentralising the control over land use (Tosics, 2005), as well as the abolishment of rent controls, can be taken as examples. Although all post-socialist nations are moving away from their socialist past, a certain variation in the individual pathways of managing the transitional process might explain different spatial outcomes in terms of land use and urban form. Second, it is self-evident that Eastern European cities still exhibit physical, social and cultural remnants from the pre-capitalist era or even pre-socialist past of urban development. Sýkora and Bouzarovski (2012: 44, see also Großmann et al., 2015), therefore, took a middle position by stating that Eastern European cities are not yet fully developed capitalist cities: ‘Looking at their morphology, land use and social segregation, we can document typically capitalist city areas and districts, while sections of urban landscapes resemble frozen mirrors of socialism’. The reconfiguration of the built environment is – following Sýkora and Bouzarovski – far from being completed. Third, commentators have also considered the specific demographic processes in many CEE countries as an exceptional circumstance for urban development. The massive outmigration from CEE countries, especially in the economically troublesome 1990s, and negative natural population balances have resulted in a strong population decline, affecting in particular economically lagging secondary and small cities. Schmidt (2011) found the so-called sprawl without growth pattern characteristic of East Germany as well as other post-socialist states.
In this paper, we ask whether the transformation of urban spatial structure can be interpreted as an adaption process to Western-style urbanisation and sprawl and – if the answer is ‘yes’ – how far this process of ‘mimicry’ has reached. If the answer is ‘no’, we ask for the kind and intensity of demonstrable differences. Thus, we aim to locate the urban development trajectories of Eastern European countries in a broader context of European and global urbanisation trends by analysing urban land use patterns from both cross-sectional and longitudinal perspectives. Our focus here is on the intensity and form of urban sprawl and dispersion.
For this purpose, a new metric – the ‘dispersion index’ (DI) – was utilised (see Taubenböck et al., 2019 and ‘Measurement of settlement dispersion’ section for details). Within its conceptual framework, this metric allows for an unambiguous ranking of any land use pattern with respect to the dispersion (or compactness) of built-up areas. In accordance with the literature, we understand dispersion as a specific spatial pattern of urban land use. Disperse land use patterns are typically characterised by a less concentrated and less spatially clustered or clumped configuration of urban functions (Schneider and Woodcock, 2008). Against this background, we consider a given land use pattern as being more or less dispersed if the number of contiguous urban patches is higher or lower and the size of the largest (central) patch is lower or higher, respectively. In other words, more compact urban forms are characterised by a larger continuously urbanised core area and a lower number of urban patches. In this paper, we approach the physical configuration of cities using the spatial patterns of urbanised land and assume that they reflect different historical trajectories influenced by political, economic, social and demographic factors as well as topographical factors.
As research on urban restructuring in CEE countries has so far largely focused on a few major cities such as Budapest or Prague (Sýkora and Bouzarovski, 2012; Tosics, 2005), it is our intention to take all cities above a certain population threshold into account. By doing so, we present an analysis of urban land use patterns in 230 European cities and city regions (among them 119 East European cases) and changing land use patterns over time in 10 selected regions. Since conceptually equivalent delineations of functional urban areas are not available for a comparative European study, we develop a spatial concept based on static as well as city-adapted spatial units. First, we employ static 25 and 50 km squares spanned around the centre of the dominant city core as a consistent spatial analysis frame (see ‘Selection of study sites and spatial entities of measurement’ section). We are fully aware that the size of these areas (625 and 2500 km2, respectively) is in many cases larger or smaller than the ‘real’ functional urban area of a particular city (indicating commuter belts or housing market regions); however, these consistent spatial units provide permissible comparative entities. Second, we employ a city-adapted regionalisation in dependence on accessibility by car.
The comparative perspective – taken in this study – demands consistent data sets. Using a spatial approach, remote sensing is a valuable source for providing consistent mapping products across space and time. Recent advancements in data and processing power have resulted in large areas or even global settlement mapping products at resolutions between 30 and 12 metres (Esch et al., 2012).
The remainder is structured as follows. In the next section, we survey the literature on urban restructuring in CEE countries. In the ‘Data sources’ section, we introduce data and materials used. In the ‘Methods’ section, we present the spatial concept, and we review and introduce spatial metrics applied for measuring urban form, and in the ‘Empirical results’ section, the results are presented. The ‘Discussion’ section offers a critical discussion on the results and the capabilities and limitations of these data and methods, and the final section concludes this paper with a perspective.
Urban transformation in CEE countries: Convergent or path-dependent?
Suburbanisation and urban sprawl are often considered global phenomena, expressing a universal pattern of land use change under liberal market regimes (Dielemann and Wegener, 2004; Gordon and Cox, 2012). Key features in this sense are growing physical footprints of cities, the deconcentration and spatial separation of urban functions, and a declining urban density as well as flattening density gradients. Although the ‘European city’ has often been portrayed as a distinct morphology, rooted in a long history and a rich culture (Dielemann and Wegener, 2004 or McNeill, 1999 for a critical debate), European cities and city regions have also witnessed a deep transformation of spatial structures, resulting in a less dense and less concentrated urban form. Salvati and Carlucci (2015) view suburbanisation as ‘the common trait’ of spatial patterns in European cities, ‘regardless of their geographical, economic, or administrative characteristics’ (824). They argue that common drivers, such as rising living standards, growth-oriented development policies, housing preferences in favour of less dense urban environments or changes in mobility behaviour, manifest themselves in convergent land use trends towards less dense and dispersed urban structures.
Against this popular narrative of ‘homogenisation’ or ‘standardisation’, researchers have found a tremendous rate of variation in both structures and structural change across Europe (Kasanko et al., 2006; Schwarz, 2010; Siedentop and Fina, 2012). Based on an analysis of more than 200 European cities, Schwarz (2010) concluded that neither the European compact city nor a clear pattern of urban form in different regions of Europe can be found. Siedentop and Fina (2012: 2779) found ‘substantial differences’ in terms of the scope of urbanisation, the dynamics of urban growth or spatial patterns of land take in their comparison of 26 European countries. Given this diagnosis of variation, regional ‘vernaculars’ of urbanisation processes can be assumed, materialising themselves in highly place-specific urban outcomes.
With a view to the CEE region, there is significant evidence that CEE city regions are still less urbanised and decentralised than their Western European counterparts (EEA, 2016; Sailer-Fliege, 1999; Salvati and Carlucci, 2015; Siedentop and Fina, 2012). Especially for south-eastern countries (Bulgaria, Romania or Albania), low values of dispersion and land consumption were measured when taking Europe as a whole as a benchmark (EEA, 2016: 57).
The diagnosis of a relatively higher concentration and level of compactness can be seen as a legacy of socialist state policies favouring large-scale housing projects at the urban fringe (Musil, 1993; Sailer-Fliege, 1999). Moreover, the concentration of economic and urban development in selected cities prevented the more land-consuming spread of urbanisation across larger territories that is typical for many Western European countries. Finally, the absence of stronger suburbanisation and the reliance on public transport in the socialist era explain the still higher compactness of CEE regions.
Nevertheless, the erosion of the once-compact urban form in CEE cities is an empirical fact, but this transition did not happen overnight. Rather, the first years of transition were marked by economic decline and deindustrialisation, collapsing housing production, massive outmigration (Stanilov and Sýkora, 2014) and, thus, a stagnation of urbanisation. With the emerging economic recovery in the late 1990s, however, a rising demand for new housing and commercial space was obvious, and suburbanisation became the ‘predominant mode of urban growth’ in CEE countries (Sýkora and Stanilov, 2014: 1). The relatively high rates of land consumption (Schmidt et al., 2015; Siedentop and Fina, 2012) implied a further decrease of urban densities (Schmidt et al., 2015). The data presented in Wolff et al. (2018) demonstrate a significant East–West divide in the emergence and dynamics of this phenomenon. Many CEE countries have experienced a much stronger reduction of urban densities than have Western European countries. The main reason for this difference lies in the massive population decline in the majority of cities in CEE countries, driven mainly by outmigration and a negative natural population balance (Haase et al., 2016; Mykhnenko and Turok, 2008). At the same time, scholars have found tremendous regional variation between both Western and Eastern countries and within the group of CEE countries (Siedentop and Fina, 2012; Wolff et al., 2018).
Another major characteristic of urban change in CEE countries is the tremendous contrast in urban size and growth rates between the capital and major industrial cities, on the one hand, and smaller secondary cities on the other hand (Hirt, 2007; Musil, 1993). This development ‘asymmetry’ within the urban system (Sailer-Fliege, 1999) can also be seen as a legacy from the socialist era: based on the idea of economies of scale, the concentration of industrial production in growth poles should gain higher levels of efficiency. The prioritisation of state-led investments in favour of the capital cities and some secondary cities resulted in uneven economic and demographic development. The gaining cities had much stronger employment growth than other cities, and they also became hubs of in-commuting from surrounding areas since housing lagged behind demand (see also the debate about the ‘under-urbanisation’ phenomenon in Tosics, 2005). In accordance, Siedentop and Fina (2012) showed that urban sprawl in CEE countries during the 1990s and early 2000s occurred mainly around a few major cities and growth corridors, whereas a significantly divergent pattern was visible in many Western European countries, where spatially extended processes of suburbanisation resulted in a much more decentralised and land-consuming pattern of urban growth. We, therefore, expect structural differences of compactness according to the size of cities and city regions.
In sum, we assume that the transformation of urban spatial structure in CEE countries is similar, but not necessarily fully convergent, with Western European processes. In other words, urban restructuring in Eastern Europe is expected to demonstrate characteristics of convergence and path-dependency. Suburbanisation and urban dispersion might resemble Western-style features but, at the same time, significant divergence can be hypothesised. For example, there are no signs of a ‘post-suburban’ development in CEE (Sýkora and Stanilov, 2014). Scholars still characterise suburbanisation in the CEE context as a rather unplanned, piecemeal decentralisation of housing, commercial and retail developments in a dispersed spatial arrangement. Moreover, in contrast to many Western European cities, urban areas in CEE countries have not yet experienced a significant regrowth in their city centres (Haase et al., 2017) and sub-centre formation in suburban areas. Eastern European urban spatial structure is, therefore, presumably less polycentric than that of Western regions.
Data sources
Our main data source for analyses is multi-source satellite data. All mapping products understand the term ‘urban’ as the land directly occupied by a particular built physical structure. On the one hand, we capture binary patterns of urban versus non-urban land use on a continental scale for the year 2012. We use the Global Urban Footprint mapping product derived from TanDEM-X data (for methodological details, see Esch et al., 2012; for data access cf. supplemental material-1). On the other hand, we refer to multi-temporal mapping products based on Landsat sensors available since the 1970s. We monitor the evolution of settlement patterns using classifications at the time steps 1975, 1990, 2000 and 2010 for specific areas of interest (for methodological details, see Taubenböck et al., 2012).
We use residential population estimates for the target years 1975, 1990, 2000 and 2015 provided by the Gridded Population of the World (GPWv4data) database (SEDAC, 2018). The input data provide the distribution of human population (counts and densities) on a continuous global raster surface. The data rely on census information, which is disaggregated to grid cells, informed by the distribution and density of built-up areas as mapped in the Global Human Settlement Layer global layer per corresponding epoch (https://ghsl.jrc.ec.europa.eu/).
Methods
Selection of study sites and spatial entities of measurement
Our study site is the European continent. We select all cities that feature a population larger than 250,000 inhabitants at administrative level for the year 2015 (based on an EU Urban Audit for European countries and the World Population Review for Russia and Ukraine). Overall, 230 cities fulfil this criterion, with 111 cities in the West and 119 cities in the East (geographically we divide Europe in West and East along the political system boundaries before 1990). For the multi-temporal analysis, however, we reduce our sample to 10 cities because settlement classifications with documented high accuracies are not available for the entire continent. We chose an even distribution of five cities each for the Western and Eastern regions.
For a consistent and valid comparison of the settlement patterns across time and space, the spatial units of measurement need to be defined. Administrative boundaries are artificial, non-uniform spatial units that are not appropriate for meaningful comparative geographic analysis. So, for reasons of comparability, we develop a two-fold spatial concept based on (1) static and (2) city-adapted spatial units: (1) In the static approach, we use fixed spatial entities: (a) We apply a 25 × 25 km square around the respective city centre, with which we aim to capture the core city pattern; (b) we utilise a 50 × 50 km square around the respective city centre, with which we aim to capture the core city pattern as well as the functional urban area. The city centres are defined as centroids based on the ESRI World boundaries and places. We argue that although these two spatial entities are artificial and are unlikely to fit the specific context of the local urban structure, they are – compared to artificial administrative entities – consistent and thus a permissible comparative entity. (2) In the second analysis, we employ city-adapted extents based on accessibility isochrones to also account for specific regional conditions. For each city, a size-dependent travel time threshold is used. With regard to gravitation theory, we assume that larger cities have larger catchment areas. The resulting isochrone geometry represents a flexible spatial geometry, taking functional interrelations between core cities and their catchments into account. Travel times were derived from network analysis based on the ESRI road network at free flow conditions. We set 20 minutes as the minimum travel time for the city with the smallest population in our sample, and 60 minutes as the maximum for the city with the largest population. The values in between have been transformed proportionally to this range and have subsequently been standardised to values from 0 to 1. In order to reduce impacts of outliers (Moscow, London), we modified the resulting attraction curve with a simple square root function, so that maximum travel times for city catchments were spread more evenly around the value range (see supplemental material-4).
Measurement of settlement dispersion
The main idea is to evaluate the urban land use patterns of cities and city regions. For measurement of settlement dispersion, we rely on a model-based conceptualisation of spatial pattern evaluation suggested by Taubenböck et al. (2019). This model has been developed for a simplistic case of spatial patterns – two-dimensional patterns constituted by two thematic classes, ‘settlement’ and ‘non-settlement’ – and is based on two spatial metrics: (1) the largest patch (LP) of a landscape and (2) the number of patches (NP) of a landscape (see details in supplemental material-2).
Argued from a geographical perspective, the LP is assumed to be a proxy to evaluate whether or not it is – in relation to all other urban patches – dominating an urban landscape. This proxy is inspired by monocentric city models where the LP relates to a dense core city surrounded by a less dense suburban area (Anas and Kim, 1996). Regarding the NP of a landscape, larger numbers around the dominating LP indicate that the landscape is less compact and more dispersed.
These two spatial metrics span a two-dimensional feature space that is defined as the DI. Both parameters are normalised (LPn, NPn) to equal ranges (0 to 100) and weighted equally. Every possible two-dimensional binary (settlement) pattern can be projected in this feature space. One end in this model is marked, if the landscape consists of only one patch (which is then, naturally, the largest one), and the DI is 1 indicating a perfectly compact pattern. Any additional urban patch (increase in NP) around this LP transforms the pattern into a more fragmented, less compact and thus more dispersed one. On the other end, if the LP is minimal and the complete class area is represented by the maximum possible number of non-coalescent individual patches, the pattern is ranked with a DI of 100 (perfectly dispersed). It has been shown that this conceptualisation allows for an unambiguous ranking of patterns in relative and absolute terms between compact and dispersed layouts (for more details, see Taubenböck et al., 2019).
Comparing trajectories of urban land use patterns
In general, we approach the evaluation of urban land use patterns in cities across Europe spatially (cross-sectional) for the year 2012 and temporally (longitudinal) for decadal points in time since the 1970s:
Cross-sectional: We evaluate trends using the DI. We calculate the DI for the static two units of measurement (25- and 50-km rectangles) as well as for the city-adjusted accessibility isochrones. For evaluation, we use boxplots as well as their distributions in the feature space of our model. Furthermore, we test some hypotheses in terms of explaining variation in DI values using regression modelling. We conduct multivariate regressions to allow a deeper understanding of relationships between the DI and relevant covariates. For all spatial units, we employ separate ordinary least squares (OLS) regressions that use a small set of explanatory variables. In both cases, this involves the settlement density as the share of urban land uses within the specific analytical unit. The reference area of the spatial unit is reduced by large water areas such as oceans. Longitudinal: We first evaluate trends across Eastern and Western cities by relative spatial growth rates. Using the spatial extent of settlements per city for the year 1975 as 100%, we calculate relative growth rates until 1990, 2000 and 2010. For the analysis of spatial trajectories of settlement patterns, we use the DI and its evolution over time. Longer paths within the model reflect higher dynamics in settlement patterns. As the multi-temporal analysis street network data for past time steps are not available, we disregard the city adjusted spatial units by travel times.
Empirical results
Cross-sectional analysis of urban land use patterns
Figure 1 illustrates the land use patterns found for three groups of least, most and moderately dispersed city regions according to the conceptual logic of the DI. The LP is displayed in red in all cases. DI values range from 0.7/9.3 (London) to 48.5/55.3 (Kryvyi Rih, Ukraine) for the 25/50 km square. The fascinating diversity of European urban landscapes becomes intuitively apparent. We consider topographical conditions (coastal location, mountains, major rivers), historical settlement structures, economic and cultural factors as well as regulatory frameworks for land use planning as the main factors accounting for this tremendous variation. Supplemental material-3 gives an overview of all 230 city regions and their respective DI values for the three spatial units.
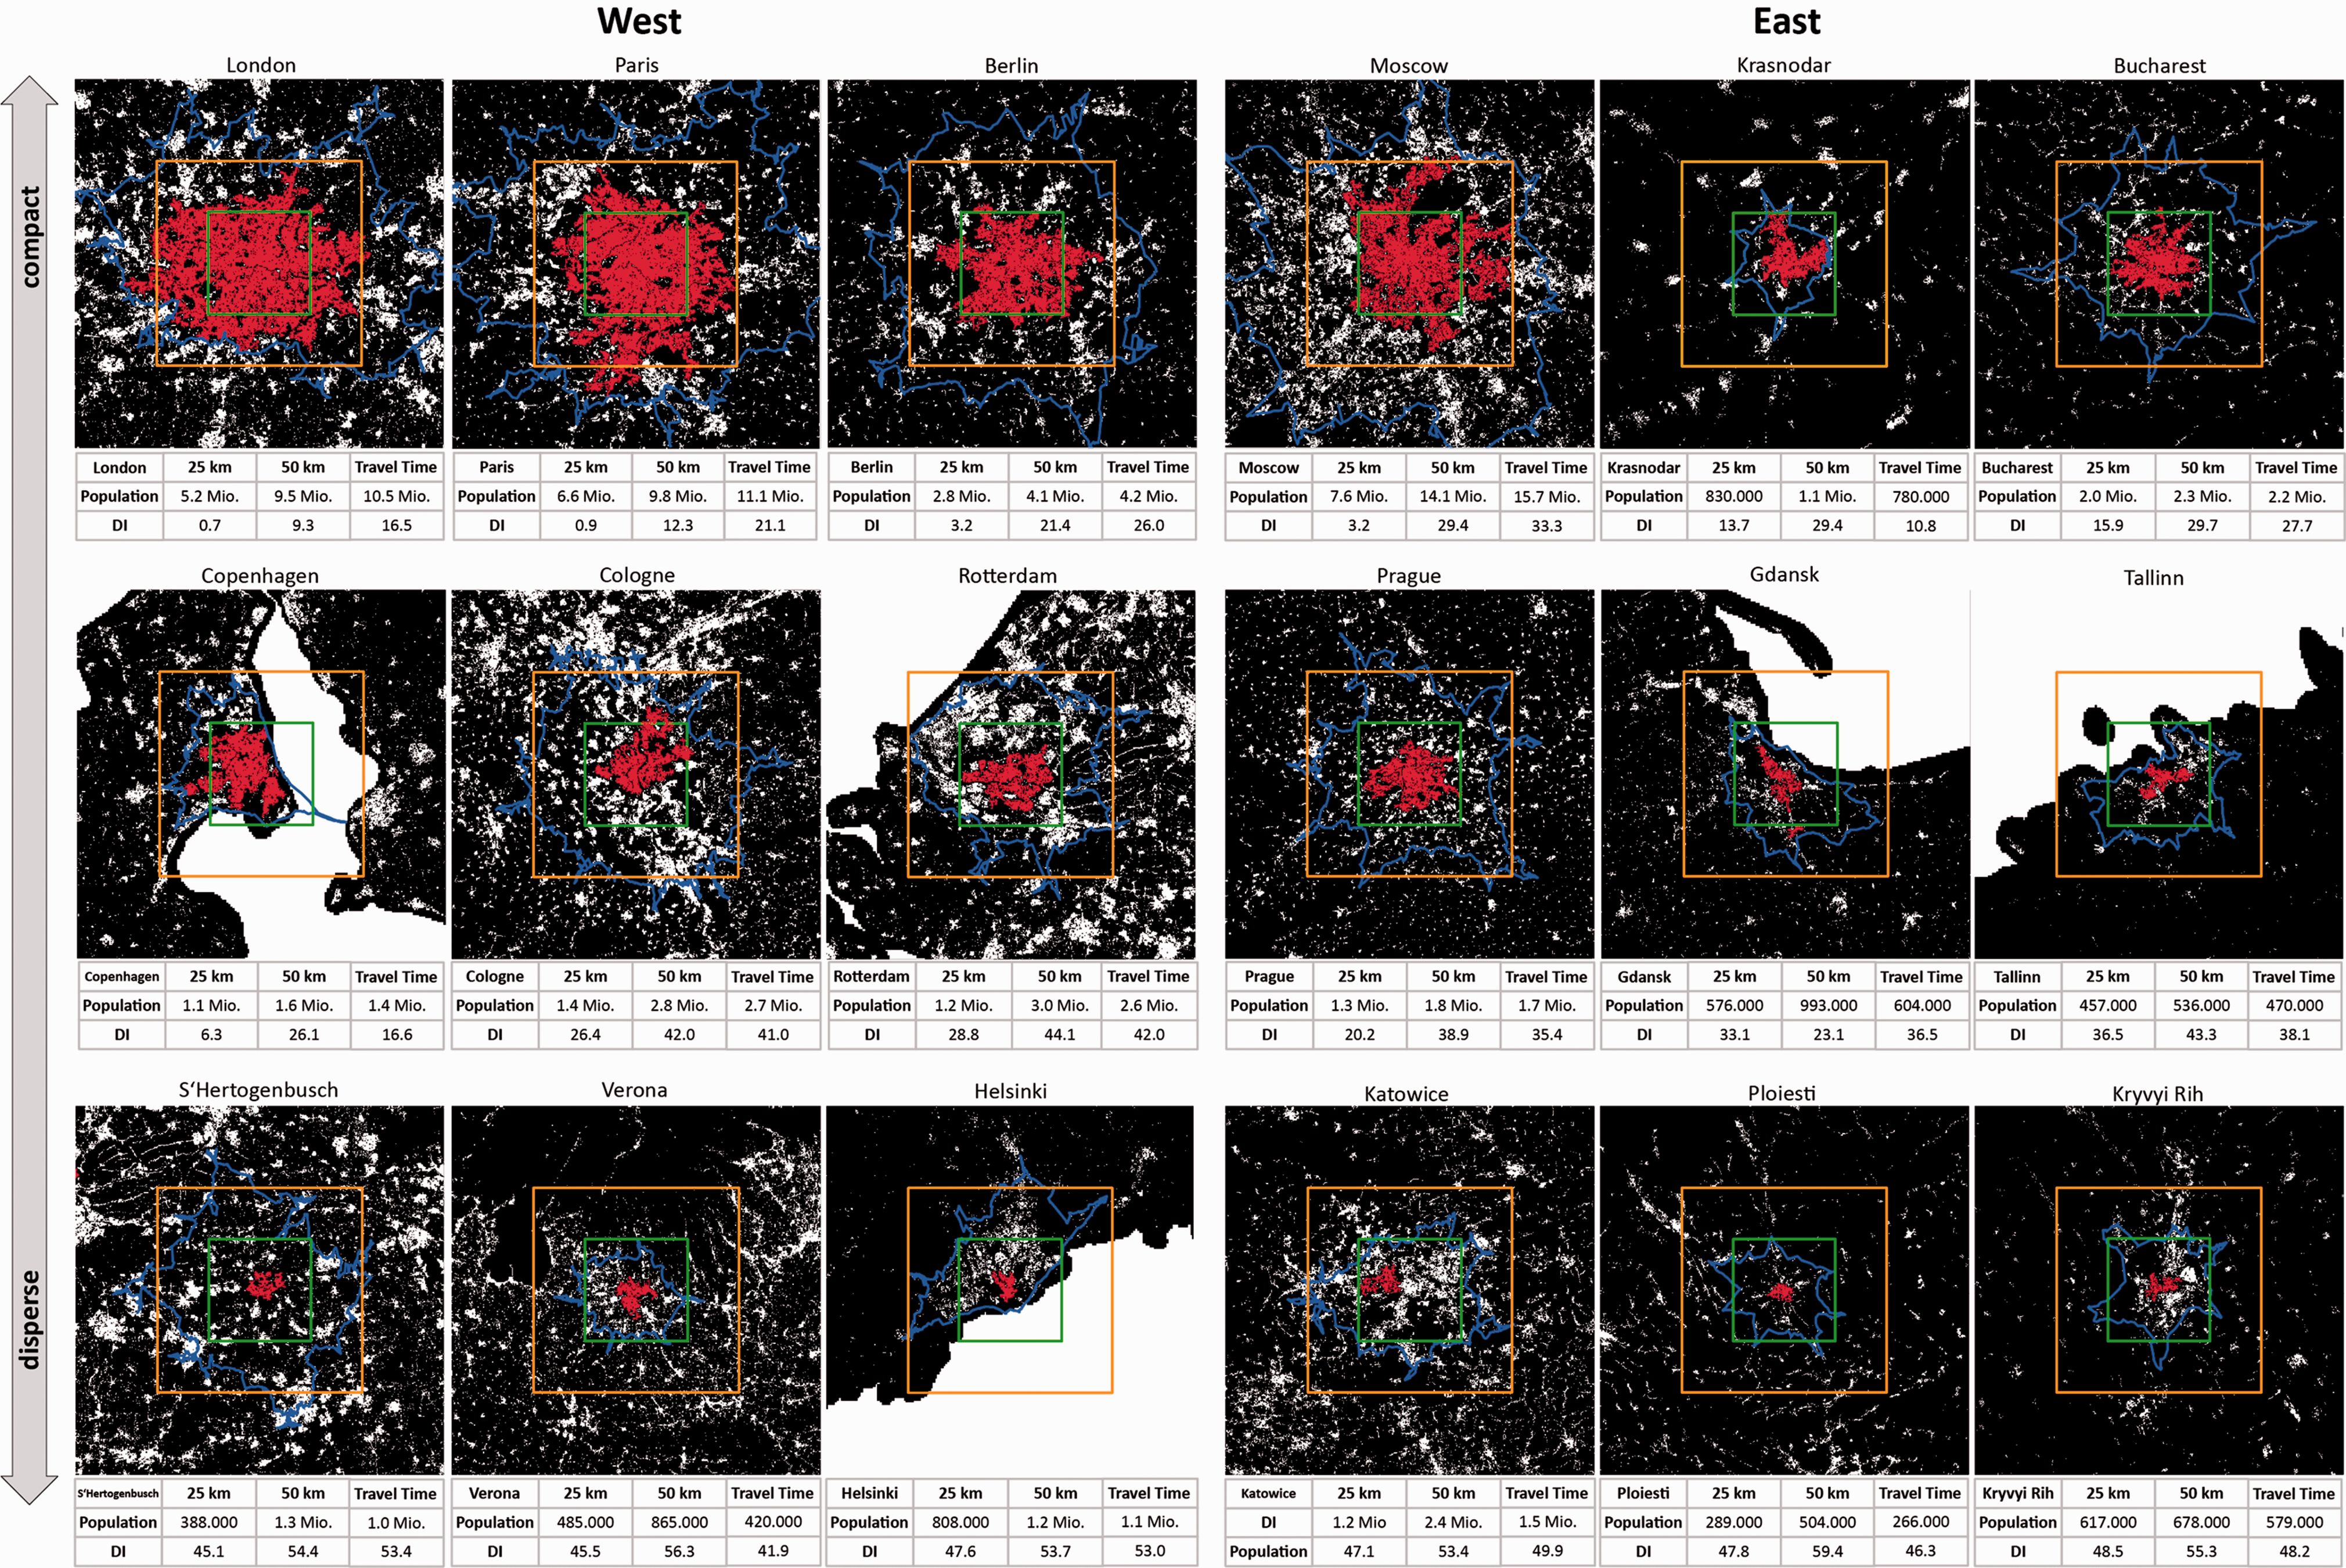
Urban land use patterns in Western and Eastern European city regions (25 km square: green; 50 km square: red; city-adjusted isochrones: blue), grouped by compact to dispersed patterns (LP in red)
Beyond this impression of uniqueness of each individual pattern, our analysis reveals significant differences in land use patterns between the East and West. When considering the individual DI values, we see that among the 20 European regions with the lowest DI, only two Eastern European cases are found (Moscow and Krasnodar for the 25 km square); for the 50 km square, there are five regions (Moscow, Krasnodar, Makhachkala, Bucharest and Cherepovets). By using city-adjusted accessibility isochrones, six Eastern European regions belong to the 20 most compact ones. At all three spatial levels, higher mean values of the DI for Eastern European city regions were measured. This holds true for all city size classes (0.1–0.5, 0.5–1.0, >1.0 million). The Eastern regions are thus considered less compact than their Western counterparts.
This result, unexpected at first glance, can be explained by a lower degree of urbanisation in Eastern European cities or city regions (Tosics, 2005: 51). In general, low DI values are found in larger, densely populated urban regions with an extended core area and a lower NP due to the merging of formerly isolated patches. In contrast, high DI values are typically found in regions with a smaller core (LP) and a larger number of small patches. The latter is characteristic of many Eastern European regions that are still in a relatively early phase of suburbanisation. Such regions are often shaped by a ‘leapfrog’ mode of urban growth and/or the remnants of rural landscapes characterised by smaller cities and villages. This characteristic especially applies to more remote parts of the region – the peripheries of commuter belts – that remain less affected by urban growth and sprawl. The emergence of large conurbations due to the physical merging of settlements is a characteristic feature of Western urbanisation, leading to compactness at higher spatial scales. This trend is confirmed by the fact that the mean LP in Western European regions is more than twice the size of the Eastern regions (114 km2 versus 49 km2 for the 25 km square).
We therefore interpret our results as an indication of a considerable West–East gradient of urbanisation. This appraisal is further confirmed by the widely varying settlement density in Eastern and Western European regions. Whereas the proportion of urban land use to the total land area is only 17.3% (25 km square), 7.2% (50 km square) and 18.2% (city-adjusted isochrones) in Eastern regions, the respective values of Western regions are 32.8, 16.7 and 26.8%.
Another interesting fact is that Western European regions show a much larger range of DI values than Eastern regions (Figure 2). Extremely compact regions with DI values lower than 10 (25-km rectangle) are mainly located in Western Europe, with the notable exception of Moscow (and some smaller regions). At the same time, we identified some ‘high DI’ regions in Western Europe (values > 50). As these regions are located in quite different countries (Spain, Germany, Belgium, the Netherlands), we cannot assume a ‘systematic’ effect of nationally specific regulatory regimes or housing preferences. We rather believe that topographical features as well as historical settlement patterns account for these outliers.
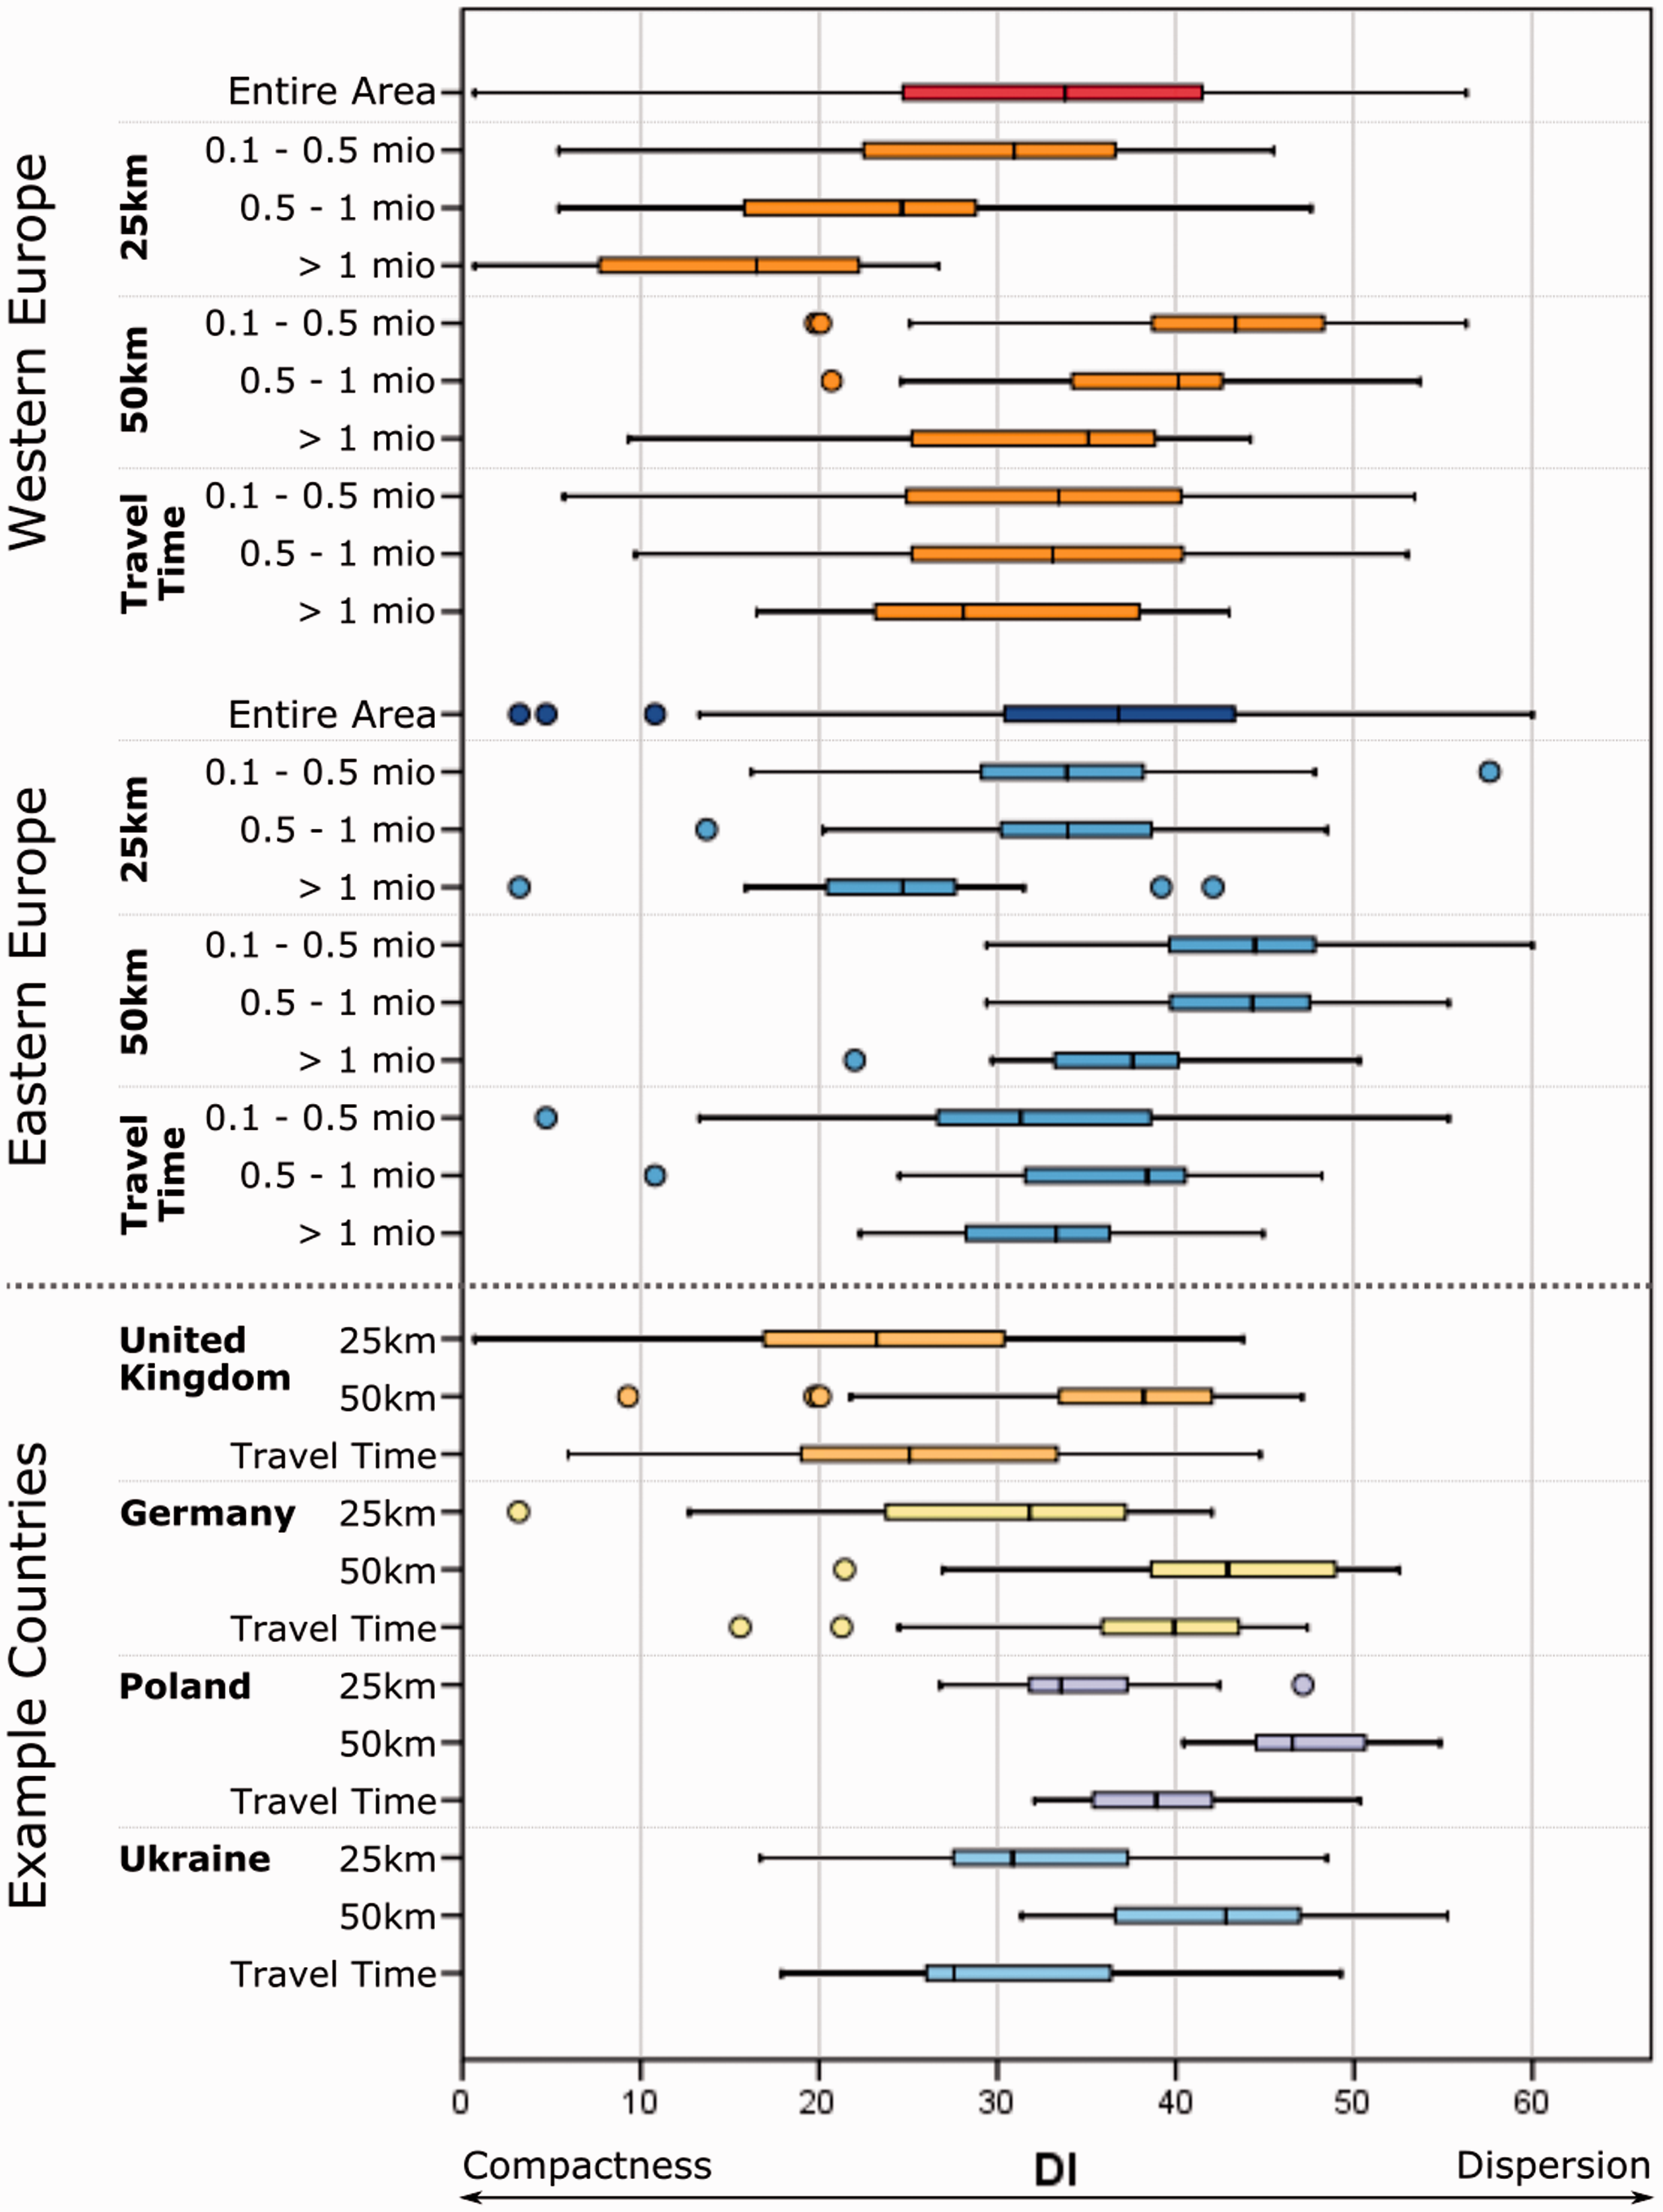
Boxplots illustrating the medians and distribution of the DI across Eastern and Western European cities as well as for sample countries at three spatial units and according to population size.
A further result of our analysis is a correlation of the DI and urban density, here measured as the number of inhabitants per km2 of urbanised land. In general, the more dense regions are also the more compact ones. However, a closer view reveals that Eastern European regions are denser by population while showing a lower compactness. We measured a mean urban density of 6780 inh./km2 (25 km), 5640 inh./km2 (50 km) and 6422 inh./km2 (city-adjusted isochrones) for the East and 5880, 4680 and 5185 inh./km2 for the West. This result clearly demonstrates the legacy of socialist development policies favouring compact urban extensions and housing at higher densities (see ‘Urban transformation in CEE countries: Convergent or path-dependent?’ section). In contrast, long-lasting suburbanisation has led to a strong dedensification of urban areas in most Western European regions (see also Wolff et al., 2018). Thus far, high urban density and a low degree of compactness in a single region do not pose a contradiction in these terms. Both indicators measure different urban attributes and should, therefore, be used in combination.
When differentiating the DI statistics according to nation states, some interesting observations can be made. The lowest DI values were measured in countries with a less decentralised planning system (as in Denmark, France, Greece and the UK; the latter one exemplified in Figure 2). In contrast, considerably higher values can be found in countries like Germany (exemplified in Figure 2), the Netherlands or Switzerland, where local governments have a stronger competence for urban development and communities have a fiscally motivated interest in urban growth. In Eastern Europe, Poland is an example of a country with a rather permissive land use policy. This has led to sprawling suburban landscapes indicated by significantly higher DI values than, for example, their eastern neighbour Ukraine. This variation might be an indication of the general relevance of land use governance and planning systems for the dynamics of urban dispersion (see also OECD, 2017a, 2017b).
For a deeper understanding of relationships between the DI and relevant covariates, we conduct multivariate regressions. We expect that regions with a higher share of built space will showcase lower index values. Furthermore, regressions include urban density (as the number of people per km2 of urbanised land). Density can be seen as a measure of the degree of urbanisation of a region. We expect that city regions with a higher urban density will show a smaller DI value. In addition to these two main covariates, we added a dummy variable that indicates which cities are located in CEE countries. If there were a significantly different pattern in the form of a clear-cut West–East divide, this dummy would capture this effect.
In the course of the specification setup, other relevant variables were tested (e.g. population size, geographical coordinates) but they did not add relevant information to the regression results, i.e. the coefficients of the other variables remained significant, and newly included variables did not raise the explanatory power of the regressions. We tested level-level, log-level and log-log specifications, among which the log-level setup delivered the most robust results.
Table 1 lists the results of the OLS calculations. For all models, the regression diagnostics are similar. The degree of multicollinearity in both cases is low (condition number under 10, variance inflation factors all under 2), the variable setup is significant as a group according to the F tests and both regressions have an average level of explanatory power. Nevertheless, the adjusted R2 for the 50-km unit and the city-adjusted accessibility isochrones is considerably lower than for the 25-km unit. Standard errors and significance levels are based on white standard errors because the basic OLS setup in both cases had problems of remaining heteroscedasticity in the regression residuals. Altering the estimation type for the variance–covariance matrix did not considerably change the values for the heteroscedasticity-consistent results. In addition, residuals are non-normal due to a skewness caused by a few extreme values of some city regions. Based on central limit theorems, asymptotic normality can still be assumed.
Results of the OLS calculations.
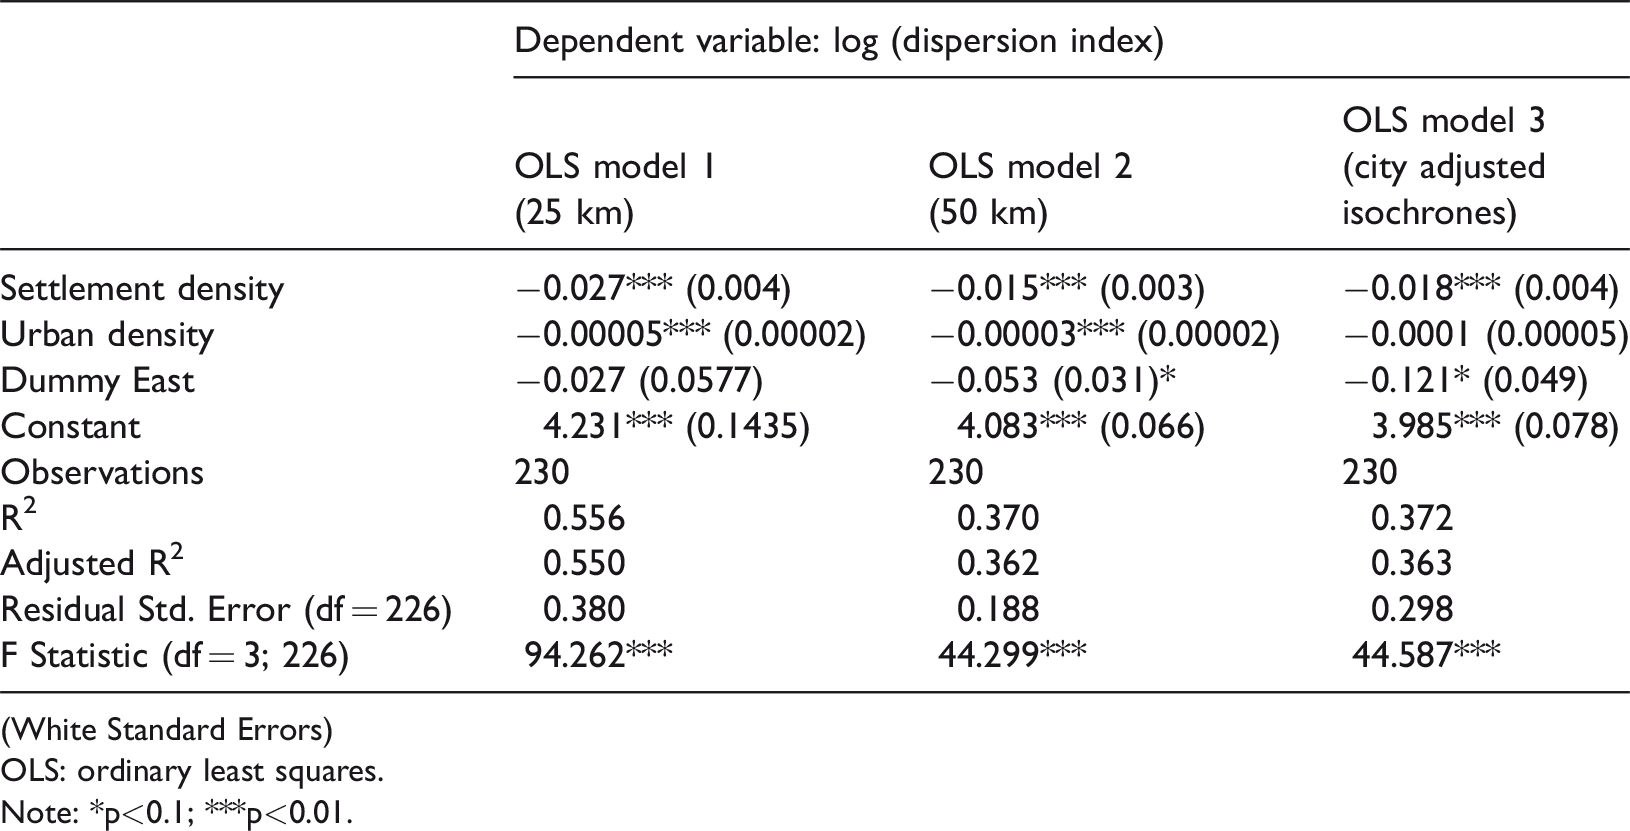
(White Standard Errors)OLS: ordinary least squares.Note: *p<0.1; ***p<0.01.
Looking at the results of model 1 (25 km), we see that all main covariates are significant and show the signs we expected. Regions with a higher settlement density have lower DI values. Furthermore, regions that have a denser urban form are ceteris paribus less dispersed. Importantly, the dummy variable for CEE regions is not significant, which leads to the conclusion that, based on this spatial lens, it is not a specific political or historical difference that explains the difference between the dispersion values but rather the different stages of urbanisation.
For the case of the 50-km model (model 2), the results are very similar for settlement density and urban density. Strikingly, in this wider scale, the dummy variable becomes weakly significant (p value of 0.08). Therefore, on this level, there is a weak structural difference (of around 5%) between DI values that cannot be explained only by structural indicators. The same applies to the model based on an accessibility delineated regionalisation (model 3). In this case, however, the settlement density becomes non-significant, while the dummy variable is again gaining significance. To further test the validity of our results, we ran regressions that excluded the big city regions from the sample, i.e. London, Paris and Moscow. Importantly, this did not alter the results significantly.
Taken together, our cross-sectional analysis indicates that patterns of urbanisation still exhibit a significant East–West divide. East European city regions are less urbanised, less populated and more dispersed than their Western counterparts. We assume that the suburbanisation process of the last 25 years has considerably narrowed the gap between the East and the West.
Longitudinal analysis of urbanisation patterns
The comparison of temporal trajectories of urbanisation patterns also reveals differences between the categories of East and West. Figure 3 illustrates growth patterns since 1975 for five selected cities per geographical category. Here, we disregard the spatial entities generated via accessibility isochrones, as road networks are not available for past time steps. Two differences appear to be particularly relevant: (1) The urban growth dynamics, and the expansive growth in areas that were characterised as rural or suburban in the 1970s in particularly, are very pronounced in Eastern European city regions, and (2) the spatial change of the LP, i.e. the extensive expansion of the dominating urban patch, is much more pronounced in Eastern European regions.
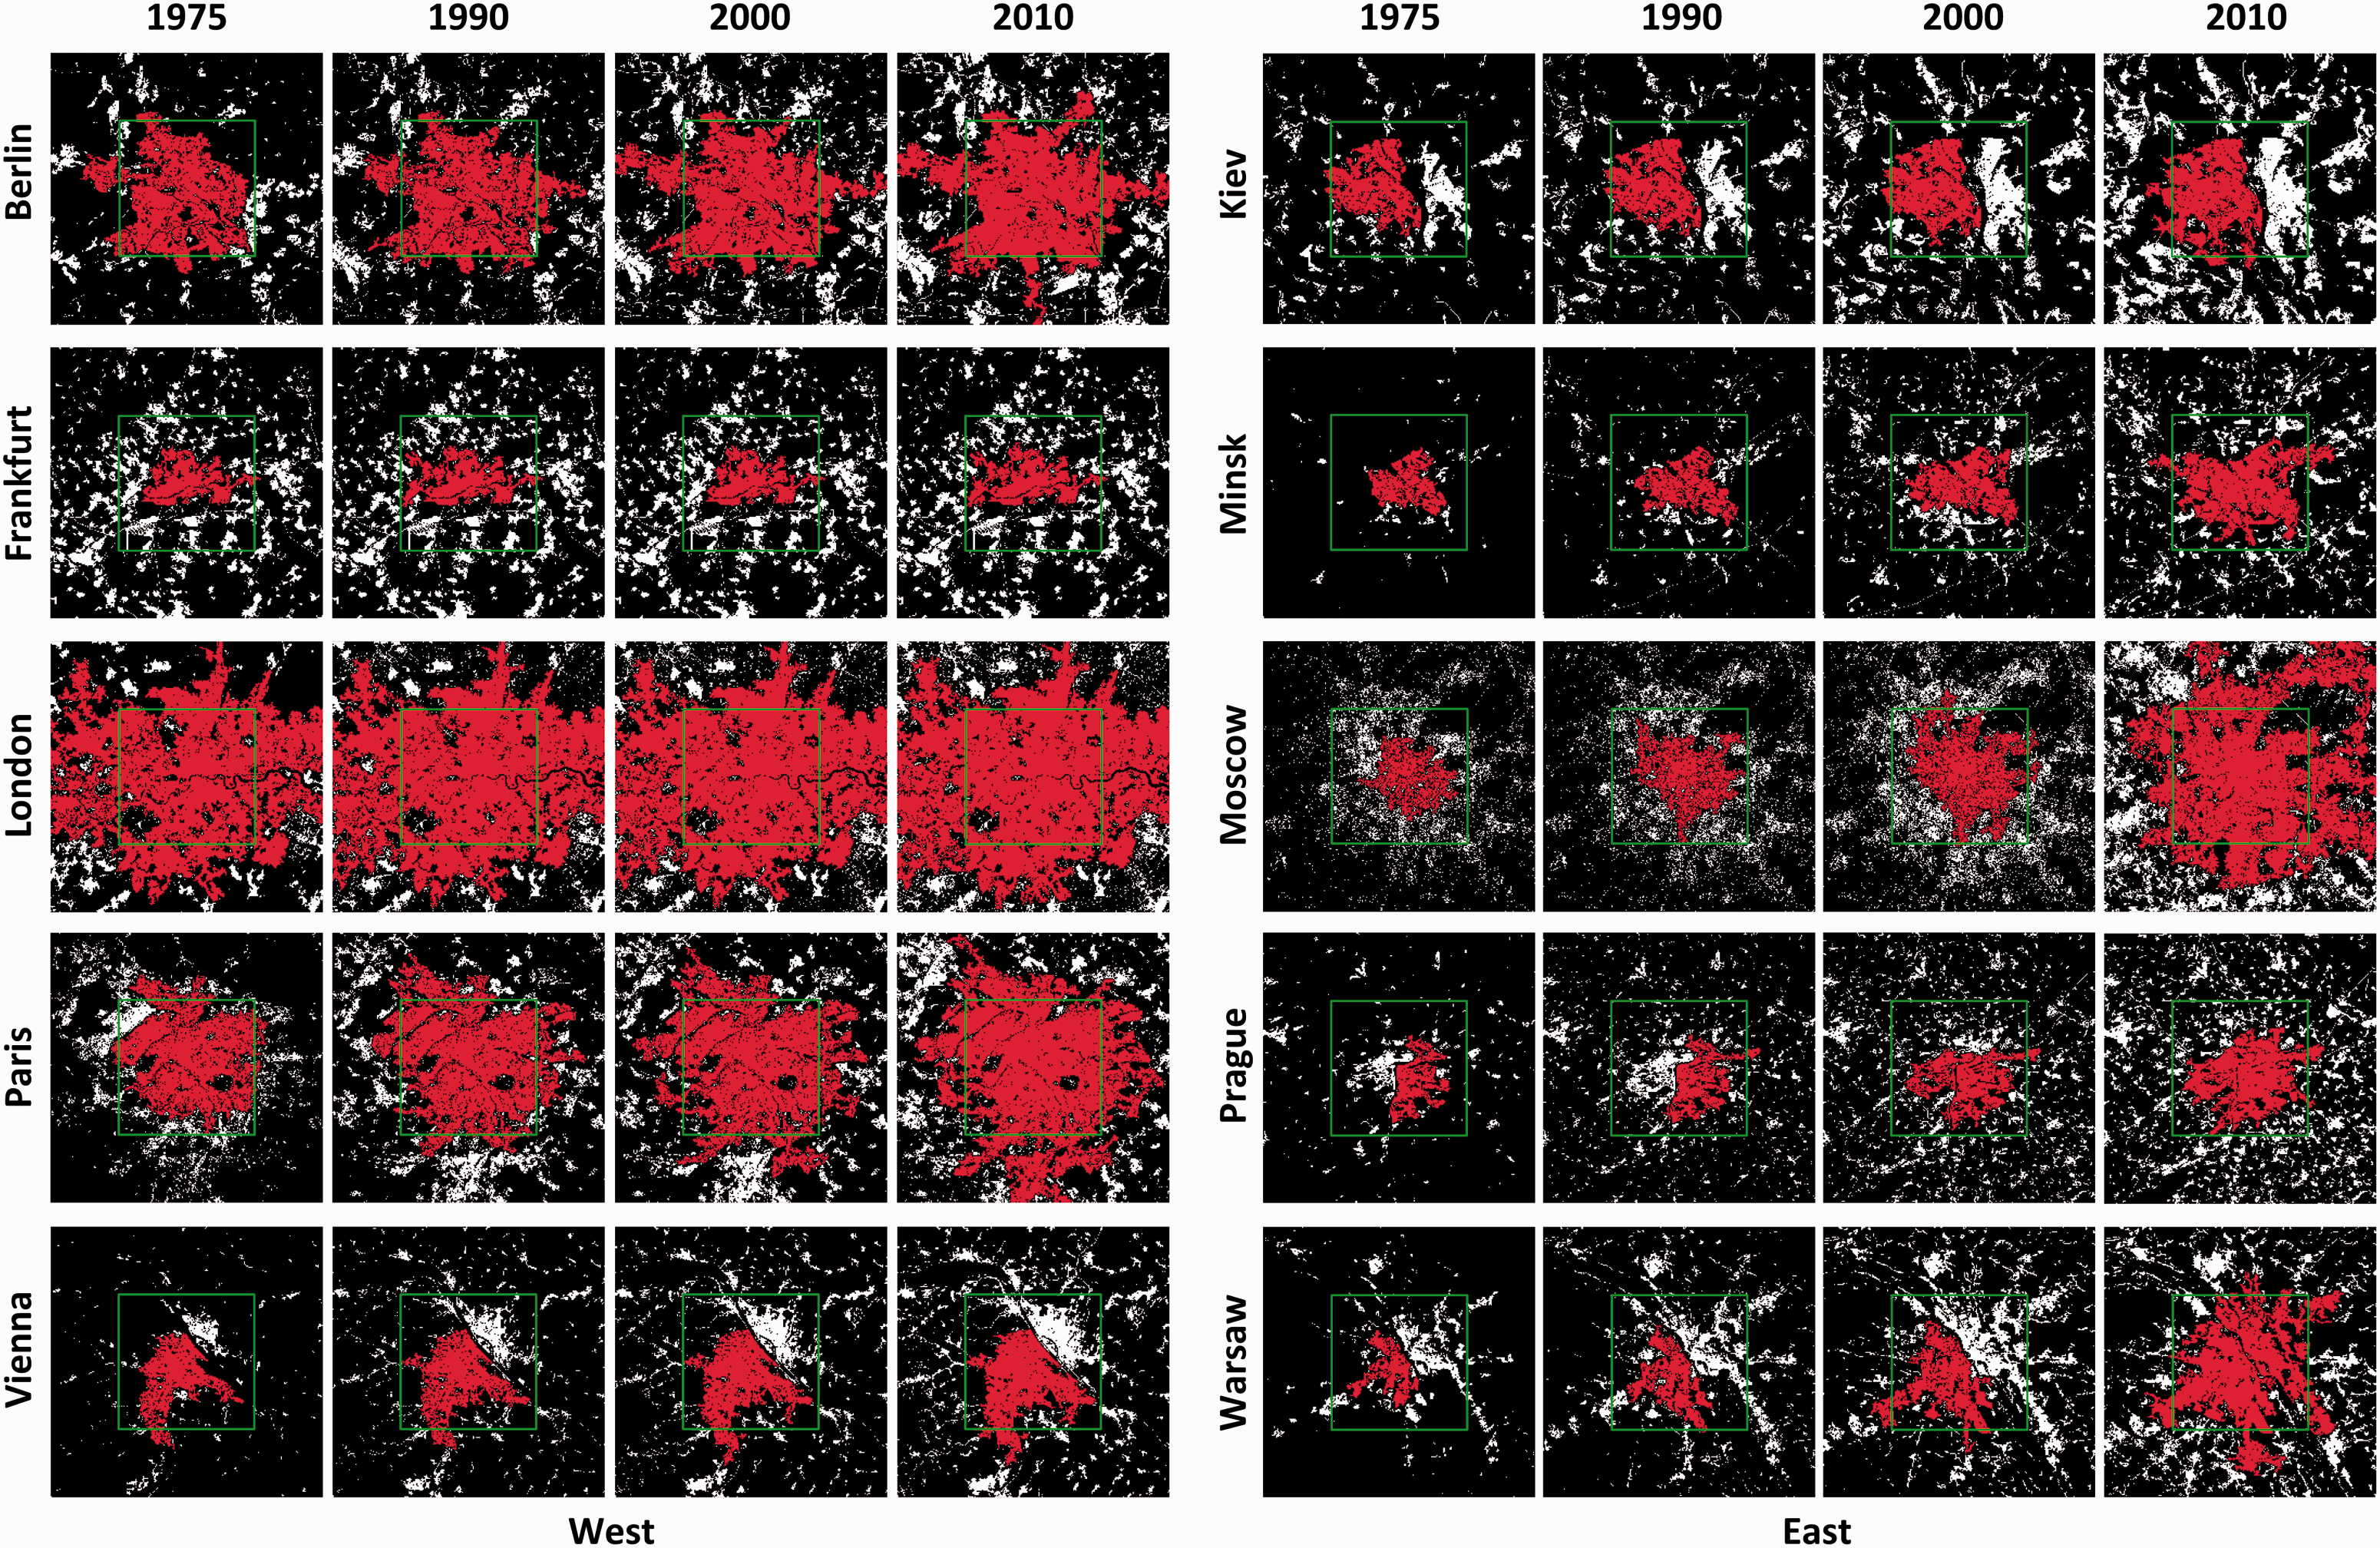
Settlement pattern evolution from 1975 to 2010 in Western and Eastern European cities. Settlements are displayed in white and red (LP). The spatial extent of each frame is 50 × 50 km; the green square visualises 25 × 25 km; the geometric resolution is 200 metres.
The calculation of two-dimensional growth rates of urbanised areas confirms these differences (cf. Figure 4). Eastern regions show a substantially higher rate of urban expansion. In general, we measured, for the core cities (25 km square) in the East, dynamics from 1.6 times as large as in 1975, in Kiev, to 3.1 times as large, in Minsk. These growth rates are considerably higher than in the West: they range from 1.1 times as large as in 1975, in Frankfurt, to 1.9 times as large, in Vienna. For the larger city regions (50 km square), similar differences in dynamics were measured: in Eastern regions, the range is from 2.4 times as large as in 1975, in Kiev, to 5.1 times as large, in Minsk. In comparison, Western regions range from 1.1 times as large as in 1975, in Frankfurt, to 2.7 times as large, in Vienna.
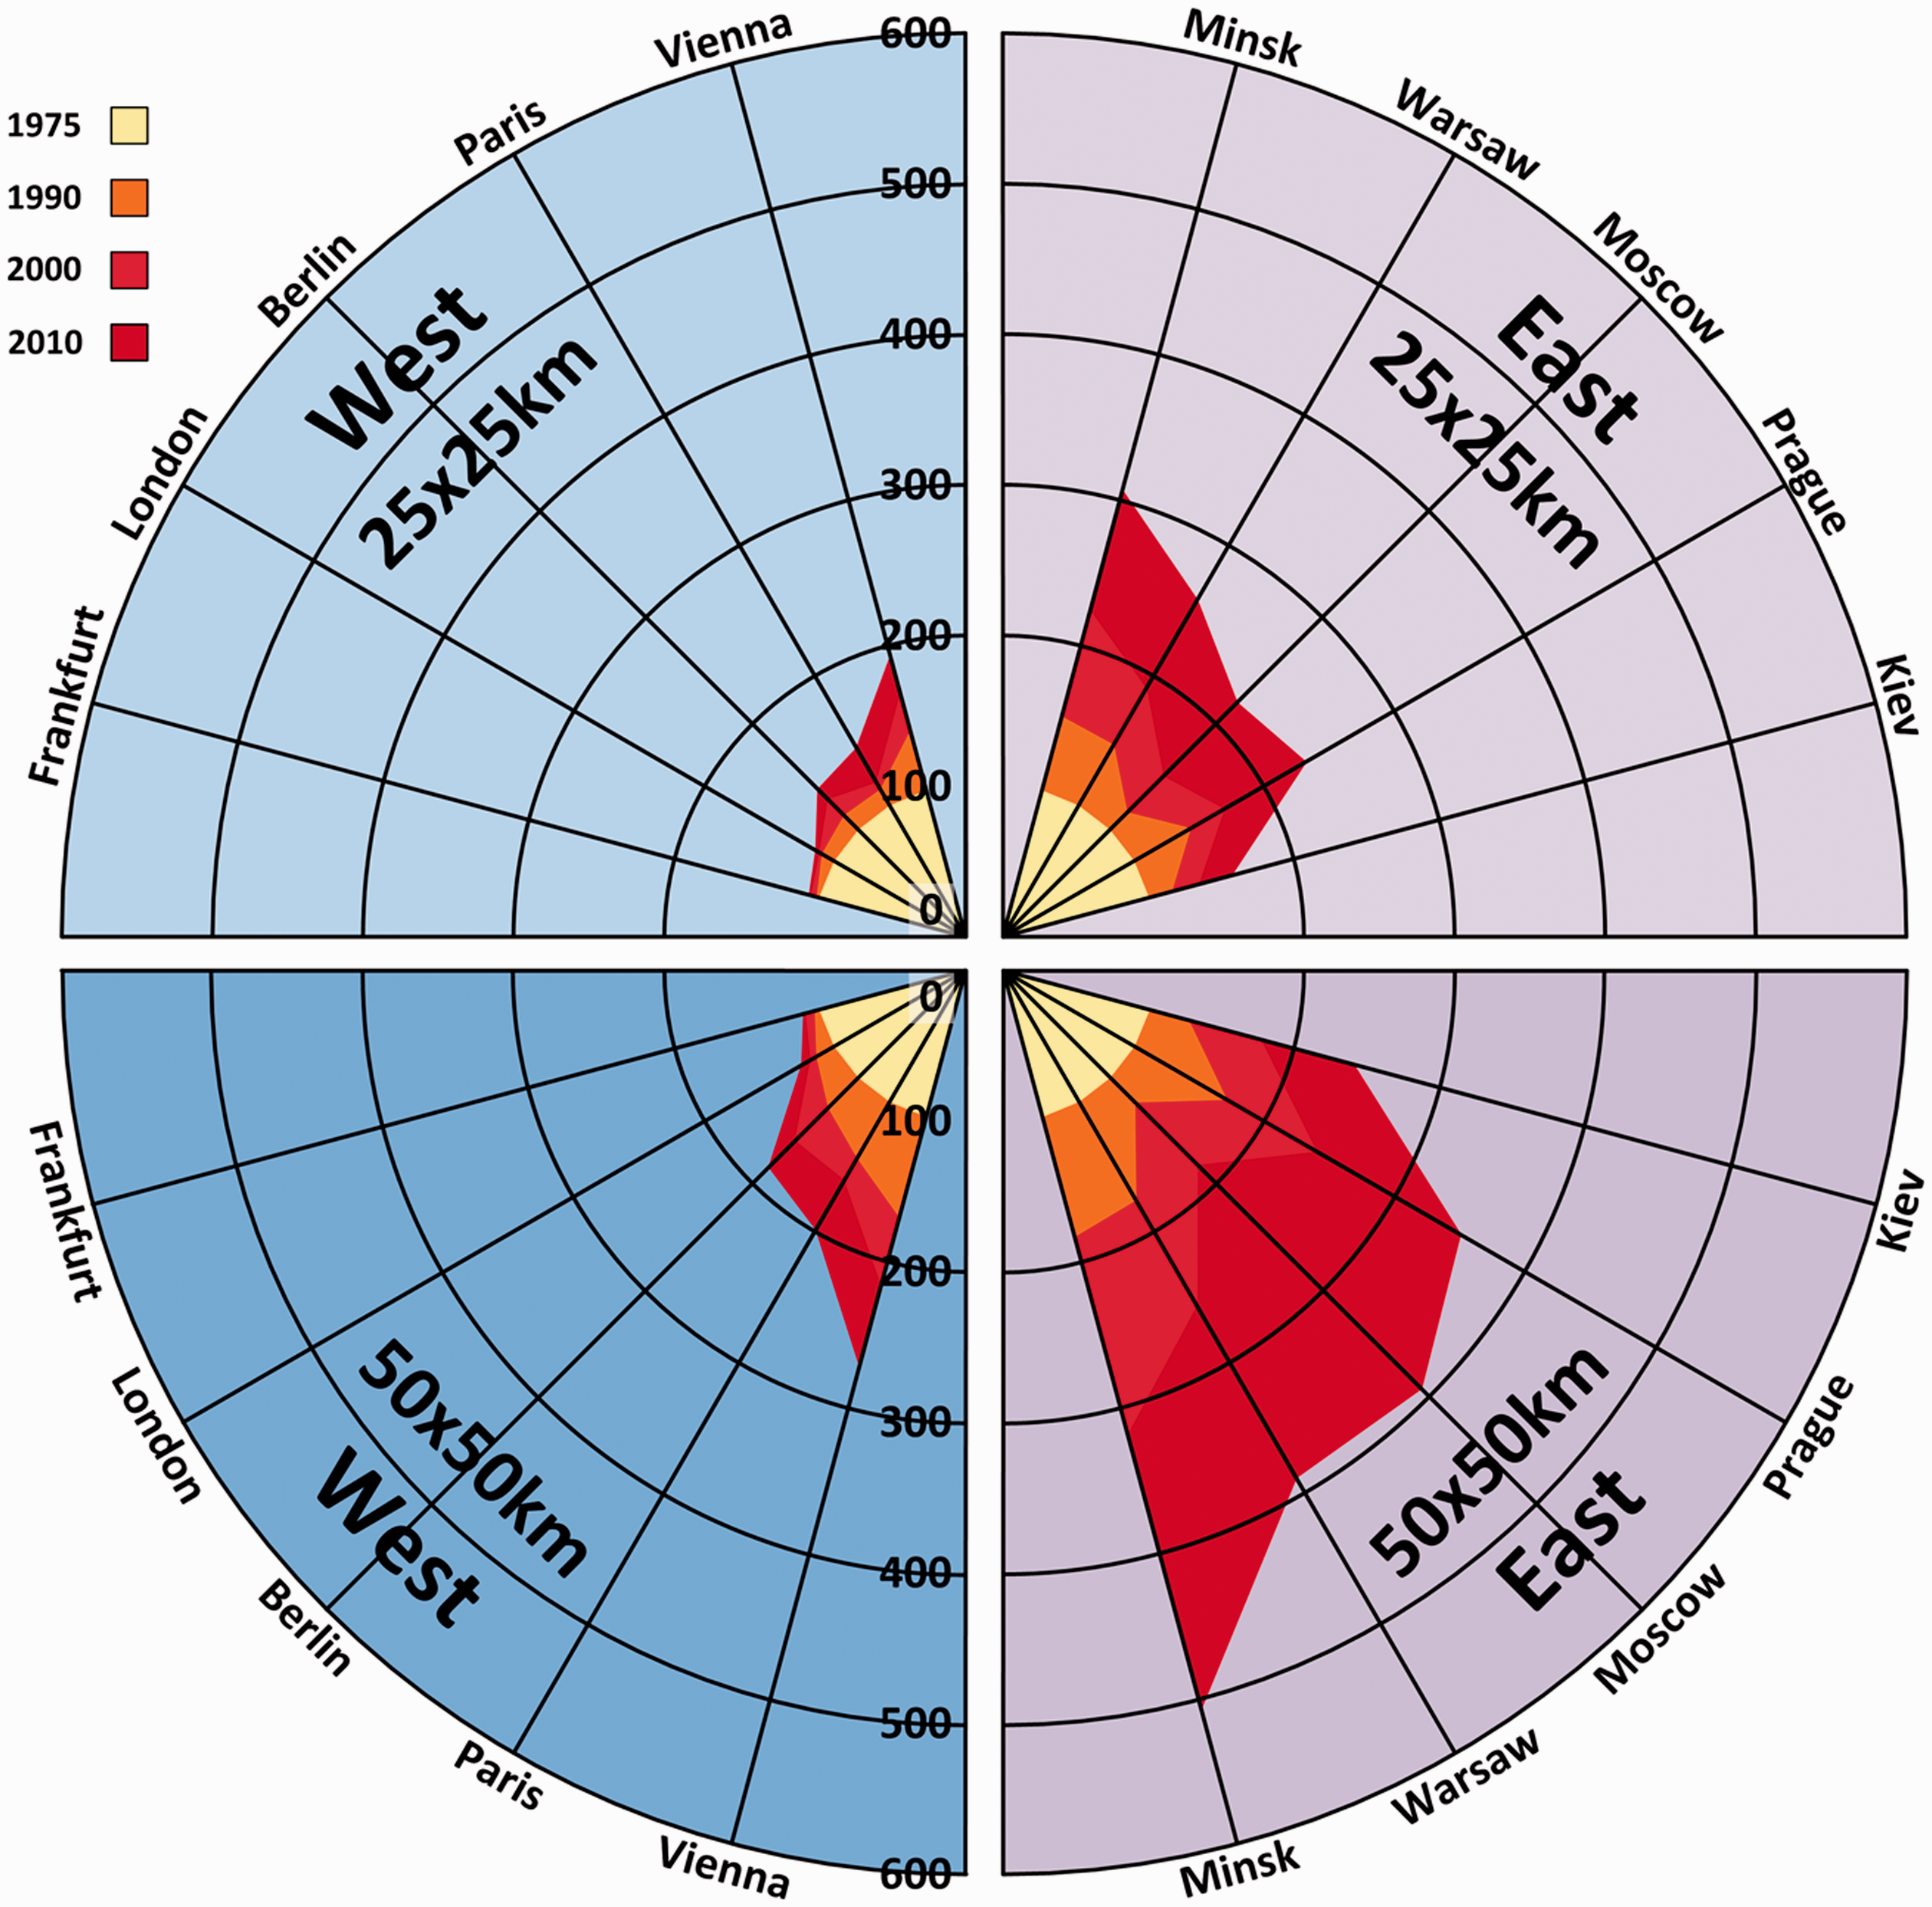
Relative spatial settlement expansion for the selected cities in Eastern and Western Europe for the 25 and 50 km units.
Beyond the spatial growth dynamics, we measured the development of the DI across space and time and compared the pattern evolution between East and West (Figure 5). In general, we found larger changes in urban land use patterns, for the smaller as well as for the larger city regions (25, 50 km square), in Eastern Europe. The trend is towards more compact cityscapes, and the larger changes in Eastern regions can be related to a much more dispersed starting position in 1975. For the core city areas, we measured 7 out of 10 cities, with a trend towards more compact cityscapes (decreasing DI). The highest dynamics were measured for Moscow (DI 1975 of 34.4 to 1.7 in 2010) as a result of densification and merging of urban patches in central areas. Two cities can be considered stable over time, and only one shows a reverse trend towards dispersion (Vienna from DI 13.7 in 1975 to 19.4 in 2010). For the larger spatial entity (50 km), which includes peripheral areas, we measured relatively stable conditions in three Western regions (Berlin, Frankfurt and London). Vienna turns out to be an outlier here, too, as it marks the only Western region with increasing dispersion (from 21.1 to 33.5). In Eastern regions, the settlement patterns reveal high dynamics, with three city regions developing towards dispersion (Minsk from 16.0 to 30.5, Kiev from 31.2 to 36.2 and Prague from 34.0 to 37.0). The comparatively large and dynamic regions of Moscow, Warsaw and Paris are developing towards more compact urban configurations.
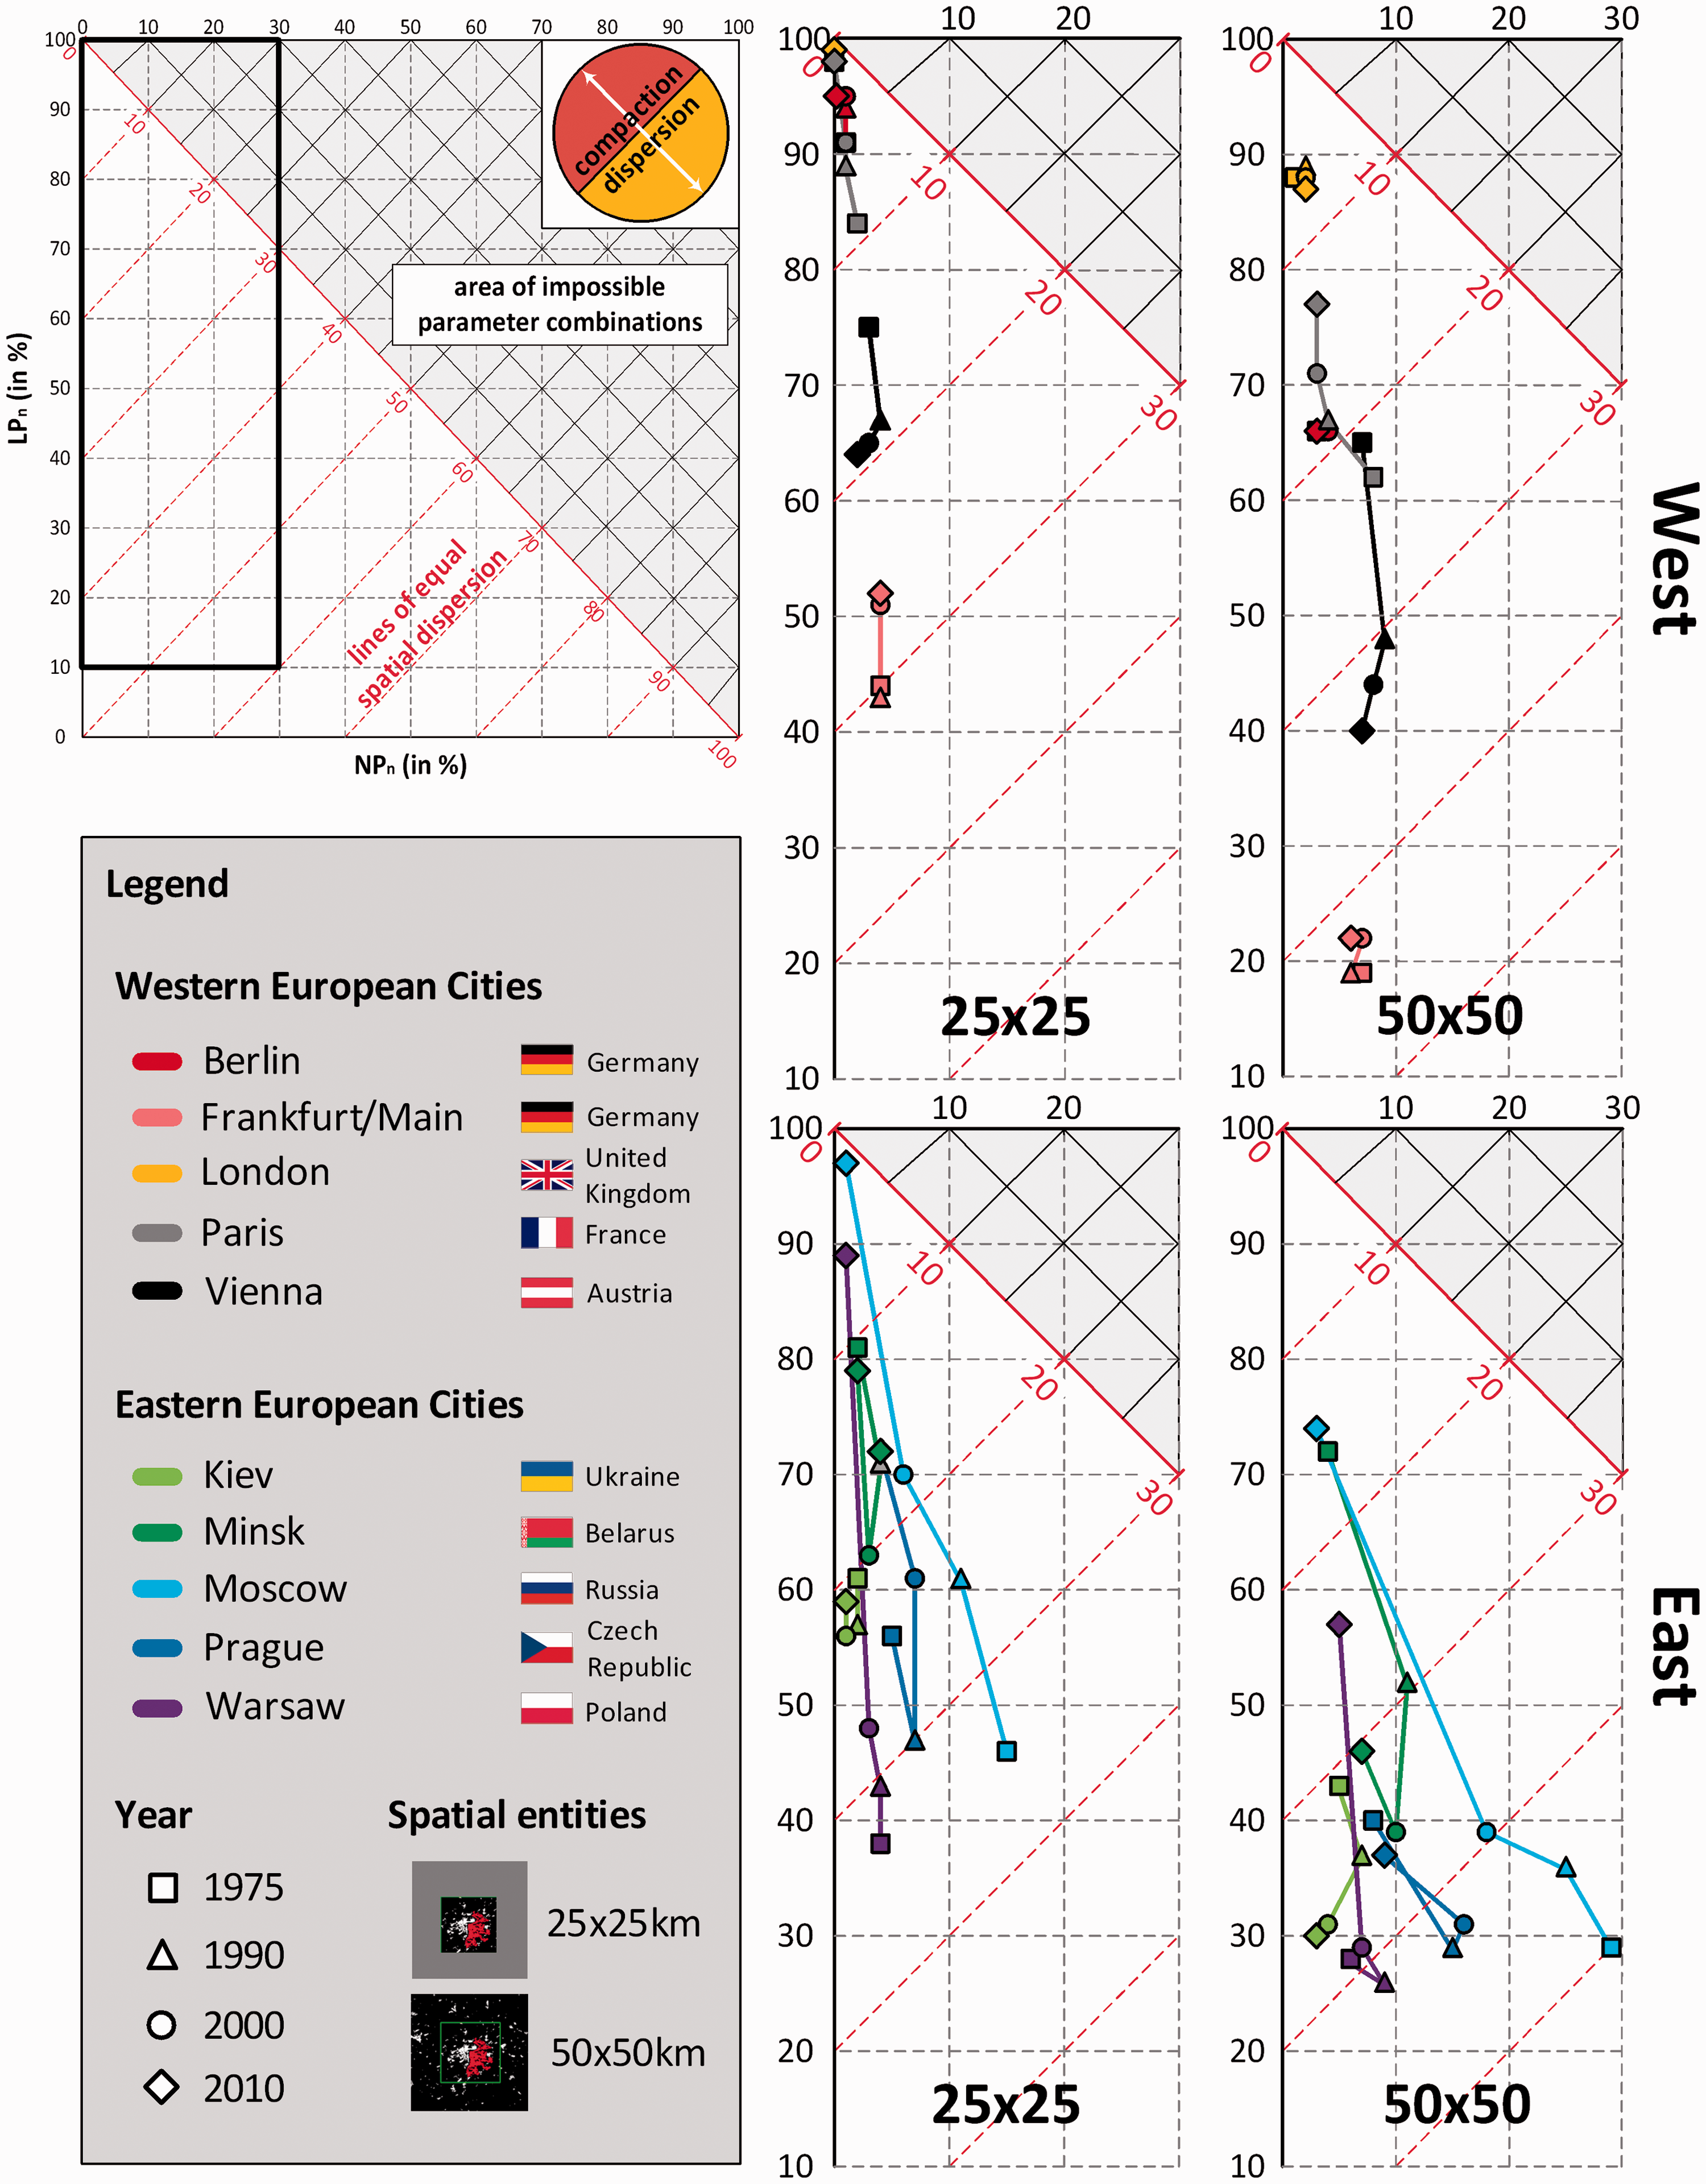
The evolution of spatial settlement patterns measured by the DI for selected cities in Eastern and Western Europe at the two units of measurement (25 and 50 km).
Discussion
Our investigation offers a wide-ranging overview of the state and process of spatial urbanisation in European cities and city regions. The longitudinal analysis over 35 years suggests that a trend towards compaction at higher spatial scales might be a robust scenario of future urbanisation in Europe. Following this thought, urban sprawl – often considered as the archetype of urban land use change in the developed world – is simply an intermediate stage of a long-term spatial transition process. Peiser (1989, 2001) has argued that undistorted land markets tend to fill the leapfrogged, scattered territories along the urban periphery. Rising land prices and the availability of urban services and infrastructure in neighbouring developments create incentives for infill development on formerly undeveloped land. What has been portrayed as a ‘scattered’ or ‘discontinuous’ form of development will be – according to Peiser – contiguously urbanised and thus ‘compact’ at a higher spatial scale. Some scholars even think that ‘mega-urban’ forms of functionally connected and spatially merged networks and clusters of formerly individual cities represent the future of human habitats (Lang and Knox, 2009).
With a view to examining urbanisation in CEE countries, our analysis revealed that Eastern European city regions still find themselves in a relatively early phase of suburban expansion. In this historically specific transition phase, a higher degree of dispersion is characteristic. In the rapidly growing capital regions, however, a process of dynamic compaction is evident. Two counteracting processes are, thus, in interplay: on the one hand, new urban development in suburban locations (so-called leapfrog development) increases the NP; on the other hand, new development also results in the merging of spatially isolated settlements so that the LP gains in size, and the NP decreases over time. The urbanisation trajectories of regions such as Moscow or Warsaw are characterised by both trends, but the latter was obviously more distinctive. We nevertheless assume that not all city regions follow this trajectory because many CEE regions demonstrate rather weak economic development and lower urban growth pressure. Against this background, the authors believe the East–West ‘urbanisation gap’ will decrease in the future, but it will likely not – even in a long-term view – diminish.
The indicator utilised, i.e. the DI, is not a one-size-fits-all approach to characterising patterns of urban land use systems. Within its conceptual structure, the DI allows a quantification of dispersion as the degree of centralisation and spatial clustering of urban functions (here addressed in the form of land use patches). We are aware that this metric is incomplete, i.e. other spatial features such as distances between patches remain disregarded. However, the general spatial patterns – as Taubenböck et al. (2019) have shown – can be quantified reliably.
The spatial concept applied must also be subject to careful consideration. The spatial baseline for comparison does influence the DI and thus, the interpreted results. We are aware that our static as well as our city-adjusted spatial entities do not provide results that can be evaluated as general for all possible spatial entities. However, the employment of static spatial entities as well as city-adjusted accessibility zones enables both an equal spatial baseline and a context sensitive spatial approach.
The data sets applied must be subject to careful consideration. When land use patterns are used for interpretation, the initial satellite data source and image analysis provide a product of a certain degree of abstraction. The geometric resolution of satellite images has impact on the measured DI, e.g. lower image resolutions can lead to a smaller number and larger sizes of patches because non-urban areas such as rivers may be suppressed in the data. However, Taubenböck et al. (2019) showed that the relative relation of the DI remained generally stable across image resolutions. The accuracy of classifications based on remote sensing data in general is subject to errors, which may also alter the DI. In some cases, small errors may transmit to large effects with respect to LP. Although this source of error is difficult to identify in the results, we assume that the tested high accuracy of the input data (80–90% agreement with reference data; see Klotz et al., 2016) keeps this error comparatively low.
Conclusions
Our cross-sectional and longitudinal analysis of urban land use patterns of 230 city regions in 34 European countries indicates a tremendous amount of variation as the outcome of unique topographical conditions, path-dependency of historical settlement systems, varying economic and demographic trajectories, different housing preferences or growth management and land use policies. We, nevertheless, see some structural differences between Eastern and Western city regions. Eastern regions are less populated, less urbanised, more dispersed and denser than in the West. Processes of post-socialist urban restructuring have definitely resulted in a change of land use patterns similar to that of Western Europe since the late 1950s. Suburbanisation has led to a strong increase in urbanised land as well as to reductions in urban density. We, nevertheless, do not think that ‘catch-up’ growth, leading to full convergence with Western-style urbanisation, will be a realistic future scenario. Returning to the question in the title of this article, i.e. whether Eastern European urbanisation can best be characterised as hybrid: cities and city regions manifest characteristics of convergent adaptation and path-dependency at the same time; they prove typical features of capitalist urbanisation, but relics of the socialist past are still omnipresent.
Supplemental Material
Supplemental Material1-2 - Supplemental material for Patterns of Eastern European urbanisation in the mirror of Western trends – Convergent, unique or hybrid?
Supplemental material, Supplemental Material1-2 for Patterns of Eastern European urbanisation in the mirror of Western trends – Convergent, unique or hybrid? by H Taubenböck, C Gerten, K Rusche and M Wurm in EPB: Urban Analytics and City Science
Supplemental Material
Supplemental Material3 - Supplemental material for Patterns of Eastern European urbanisation in the mirror of Western trends – Convergent, unique or hybrid?
Supplemental material, Supplemental Material3 for Patterns of Eastern European urbanisation in the mirror of Western trends – Convergent, unique or hybrid? by H Taubenböck, C Gerten, K Rusche and M Wurm in EPB: Urban Analytics and City Science
Supplemental Material
Supplemental Material4 - Supplemental material for Patterns of Eastern European urbanisation in the mirror of Western trends – Convergent, unique or hybrid?
Supplemental material, Supplemental Material4 for Patterns of Eastern European urbanisation in the mirror of Western trends – Convergent, unique or hybrid? by H Taubenböck, C Gerten, K Rusche and M Wurm in EPB: Urban Analytics and City Science
Footnotes
Declaration of conflicting interests
The author(s) declared no potential conflicts of interest with respect to the research, authorship, and/or publication of this article.
Funding
The author(s) received no financial support for the research, authorship, and/or publication of this article.
Supplemental material
Supplemental material is available for this article online.
References
Supplementary Material
Please find the following supplemental material available below.
For Open Access articles published under a Creative Commons License, all supplemental material carries the same license as the article it is associated with.
For non-Open Access articles published, all supplemental material carries a non-exclusive license, and permission requests for re-use of supplemental material or any part of supplemental material shall be sent directly to the copyright owner as specified in the copyright notice associated with the article.