
Abstract
Urban compaction policies have been widely adopted in developed countries in pursuit of more sustainable cities. Compactness is achieved through a process of ‘densification’, of developing and using land and buildings more intensively. However, empirical evidence on the processes and outcomes of urban densification is lacking. The paper addresses this lacuna. It considers densification in England, a country that has long experience of applying policies of urban containment and consolidation; and one where new data sources allow the analysis of recent land use change at a level of detail not hitherto possible. In England between 2001 and 2011, the bulk of additional dwellings were accommodated within urban areas, increasing their density. Yet, there were wide inter- and intra-regional variations in the pattern of densification: for example, in the contributions of large scale, formal development and of small scale, informal, gradual change – of ‘hard’ and ‘soft’ densification – to the process. The significant differences in local experiences of densification that result raise major issues for policy.
Introduction
A key aim of the UK land use planning system introduced by the Town & Country Planning Act 1947 was ‘… to contain urban areas…’ (Simmie et al., 1992: 36). This was to be achieved through the establishment of green belts around larger towns and cities and the strict control of extra-urban development elsewhere (Hall, 1974). Urban containment has been pursued with remarkable persistence ever since, despite fundamental changes in its context. Initially, an anti-urban narrative coupled a more dirigiste approach to planning with the need to protect the countryside from the city. ‘Overspill’ of housing and other development from existing settlements was to be accommodated in planned new towns or town extensions (Cullingworth et al., 2014).
The year 1979 marked a fundamental shift in strategy. State intervention – whether related to planned settlements, housing provision or infrastructure investment – was reduced or withdrawn in favour of private, market-driven provision (Allmendinger and Thomas, 1998). At the same time, demand for housing continued to increase, underpinned by population growth and reductions in household size. 1 In the face of continued constraints on the physical extent of existing settlements, the bulk of additional dwellings required to meet this demand would need to be accommodated in those same settlements. This posed a challenge for policy-makers.
By the mid-1980s, the value of complementing containment policy by encouraging residential development on previously developed sites had become evident to central government planners in England. New arrangements for monitoring land use introduced in 1985 (the Land Use Change Statistics (LUCS)) demonstrated that more than two-fifths of new housebuilding occurred on brownfield sites; and that there was little tendency for this proportion to fall in subsequent years. The rate of brownfield development became the main measure of success in avoiding rural to urban land conversion and a key indicator of local planning authority (LPA) performance. In 1998, an explicit target for the planning system was introduced: to ensure that, by 2008, 60% of all new development in England would be accommodated on brownfield sites. The pragmatic assumption was that urban containment would be achieved through intensification.
Given its popular appeal, government did not seek to justify containment policy. The practical concern lay in regulating incremental private sector development rather than in laying out cities. Intensification could only be achieved through the agency of more than 350 LPAs working within a framework set by central government. Planning policy guidance was therefore revised in 2000, reinforcing the presumption for brownfield development and strongly advising against allowing new development at densities of less than 30 dwellings per hectare. These two requirements would be used to control development either by being embedded within the statutory plans of LPAs or standing alongside them. They applied in principle to all LPAs, regardless of local economic conditions or the physical configuration of their urban areas.
However, urban ‘intensification’ – or ‘densification’ or ‘consolidation’ – (Burton, 2000) ‘… is a complex process, with many components…’ (Williams et al., 1996: 83) that may be considered at three levels. The first is that of the basic elements of the city: urban land and built structures. The intensification of activities within buildings (or on land) should be distinguished from the intensification of built form (or land) through physical change (Burton, 2002; Williams et al., 1996). Such increased use of existing buildings or land may occur without a change of use or consequent upon a change of use. 2 Most forms of densification involve physical works. Some do not add to urban built form; for example, sub-divisions and conversions of existing buildings, and the re-use of vacant buildings. Others do so add. Examples include extensions to existing properties, the development of vacant or derelict open land, infill on back land or gardens involving plot sub-division, and re-development or new development at higher densities, using more intensive building types such as apartment blocks, town houses and terraces.
The second level of consideration is the interplay between factors that reinforce or detract from the process of densification. Gains resulting from new development, extensions, conversions to residential use, sub-division of dwellings, and so on must be balanced against losses from part or full demolition, conversions from residential use, re-consolidation of previously sub-divided houses, and so on. Gains from the construction of additional buildings must be distinguished from gains from the more intensive use of existing accommodation. Gains from the development of more intensive built forms must be offset by the development of more extensive types of scheme. Thus, whatever the spatial scale of consideration, the net outcome will embody a mix of actions that support or undermine densification. Where the former outweigh the latter, development density will increase, but the converse may also apply. 3 Consequently, the pattern of densification is likely to display wide inter- and intra-urban variations.
The particular mix of components of densification to which an area is subject and the way in which densification occurs have major implications for local resident and business communities. This is the third level of consideration. Formal planning policy and practice focuses on promoting relatively large-scale re/development involving major developers, investors and infrastructure providers. This results in a significant change in urban form and much disruption during the development period (Pinnegar et al., 2015; Touati-Morel, 2015, 2016). In contrast, densification may occur incrementally through the actions of local contractors and, to a lesser extent, of the owners of small sites and buildings. Such gradual change is more difficult for planners to control and usually prompts limited local resistance 4 but, cumulatively, may result in substantial neighbourhood change (Pinnegar et al., 2015). Touati-Morel (2015, 2016) labels the former ‘hard’ densification and the latter ‘soft’ densification.
These outcomes are indicative of complex processes and patterns of densification. Such complications and their nature and significance have yet to be explored because detailed empirical evidence on the physical outcomes of urban containment and densification is lacking (Burton, 2000; Colomb, 2007; Orenstein et al., 2014). 5 The paper addresses this gap in knowledge by considering the following question. In the context of extant central government planning policy in England, what has been the pattern of residential development and its contribution to urban densification between 2001 and 2011? While the balance between development within the boundaries of urban areas and that beyond is considered, the focus is on the intensification of single-family residential neighbourhoods (SFRNs) and especially upon ‘soft’ densification. We proceed in three stages. First, the methodology for defining and analysing densification and for distinguishing between its ‘hard’ and ‘soft’ elements is briefly outlined. Next, the results of the analysis are presented and the key aspects of the findings are identified. Finally, we discuss the implications of the results.
Methodology: Measuring densification in England 6
The principal data on which the measurement of residential densification is based are drawn from two sources. The first is Royal Mail’s Postcode Address Files (PAFs) for April 2001 and April 2011 that provide, for the respective times, a comprehensive listing of properties for the purposes of mail delivery. The second is the LUCS collected for the Department of Communities and Local Government that indicate new house building, usually at individual land parcel level. These data enable analysis to proceed at a much finer grain than output area (OA) level and allow change to be represented hectare by hectare and results to be provided for broader areas by aggregation. In combination, they provide an unrivalled resource for examining densification.
The estimation of the scale and pattern of residential densification was undertaken in five stages.
The overall net addition to the residential building stock was derived by applying elementary natural language processing to the 2001 and 2011 PAFs. The number of new dwellings built hectare by hectare for the period 2001–2011 was estimated from the LUCS at individual land parcel level. Estimates of the number of net additional dwellings resulting from change of use and conversion of existing buildings to/from residential use are derived directly from PAF (via changes between residential and non-residential types of address). The number of additional dwellings realized through internal division of houses is assessed as the residue of the foregoing categories; that is, 1−(2+3). Finally, a size threshold was used to distinguish between ‘hard’ and ‘soft’ densification of each type (with the latter defined as development that did not require the creation of a new unit postcode or that occurred on a site of less than 0.4 hectares).
The following picture of residential densification emerged.
Densification and ‘soft’ densification in England
Increase in dwellings by settlement class, England, 2001–2011.
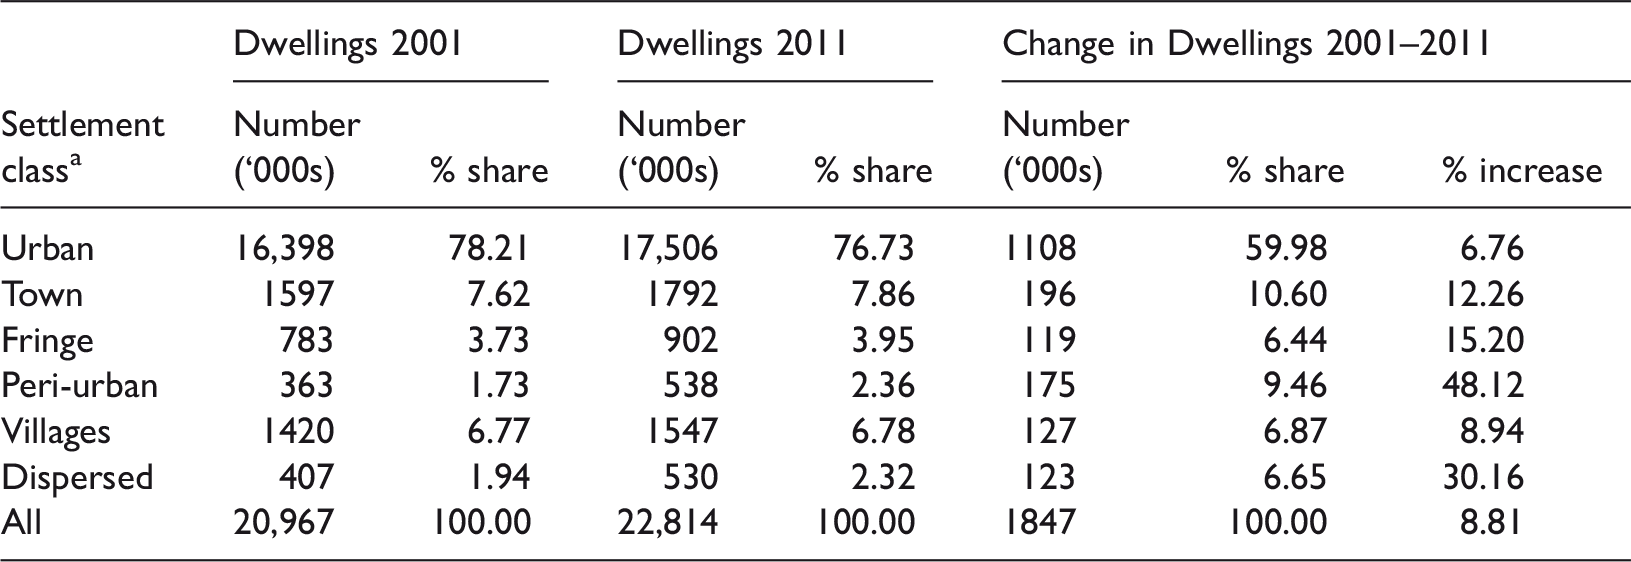
As defined in 2001.
Dwelling units gained by soft densification, English urban areas, 2001–2011.
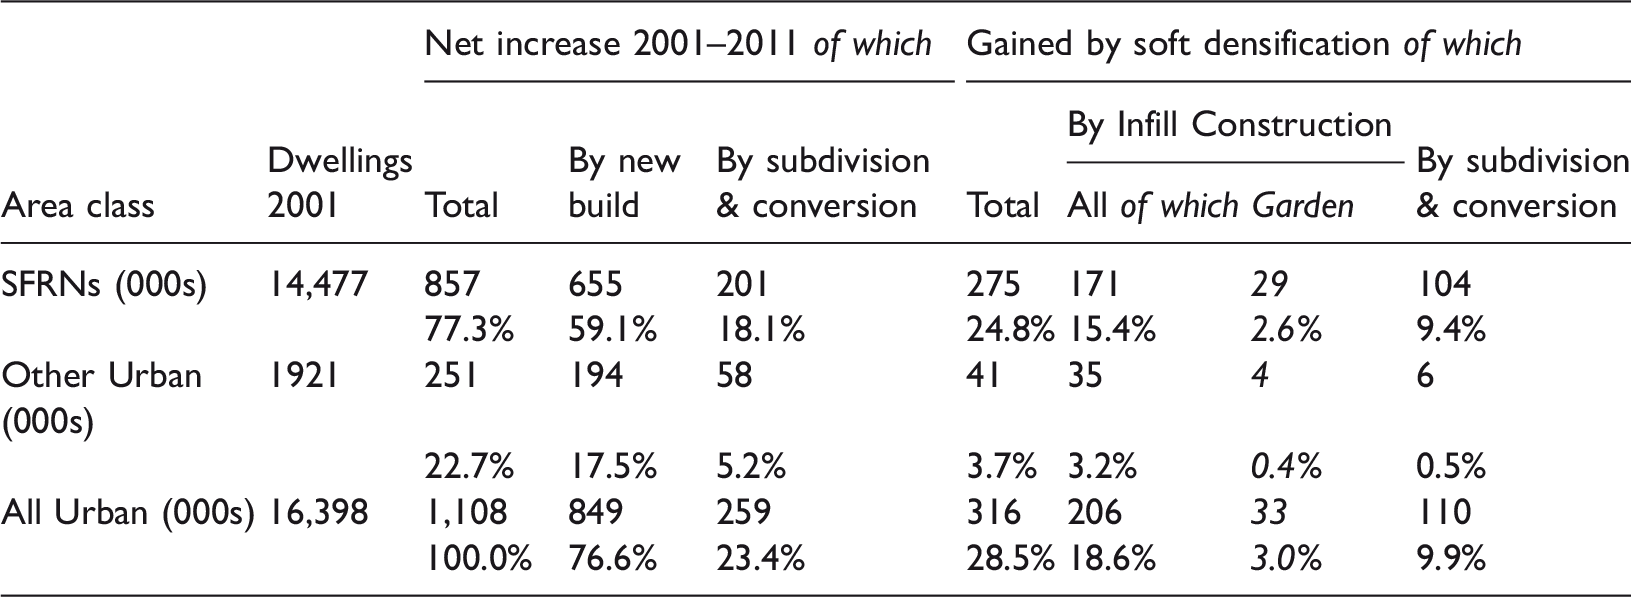
As the physical extent of both the urban areas and the SFRNs is known, in addition to the estimated number of units gained by soft densification, it is possible to gauge the extent to which this has increased ambient density 8 : by an additional 0.32 dwellings per hectare in SFRNs, 0.46 dwellings per hectare in other urban areas and 0.33 dwellings per hectare in urban areas overall.
At this general level, it is possible to distinguish different forms of soft densification in broad terms and to establish its significance in different contexts; 110,000 dwellings, 9.9% of the net increase in dwellings (column 8) and 34.8% of units attributable to soft densification (column 8/column 5), were generated through internal reorganisation of buildings (including conversion and subdivision of buildings formerly in non-residential use where this did not involve major change). More substantial forms of conversion and subdivision contributed 149,000 dwellings (column 4 – column 8) to the housing stock of urban areas between 2001 and 2011.
In interpreting Table 2, it should be understood that subdivision of existing dwellings is treated as a form of soft densification not involving new construction, but conversion involving subdivision of buildings such as offices, substantial factories, and so on is defined as part of hard densification even though it is not treated as part of new construction. For this reason, not all conversion and subdivision activity is considered to involve soft densification.
This leads to two important conclusions at the level of England as a whole. First, more than two-thirds (71.5%; column 2–column 5) of the overall densification of English urban areas was achieved through new construction or large-scale conversion projects involving major change. Second, the experiences of SFRNs and of other urban areas relating to soft densification are markedly different. Within SFRNs, soft densification accounted for almost a third of all properties gained through densification overall (32.1%; column 5/column 2). That proportion is much smaller in other urban areas (16.3%). In contrast, compared with other urban areas, a significantly smaller proportion of additional dwellings attributable to soft densification in SFRNs was generated through infill construction rather than from the reorganization of existing buildings (62.2%, column 6/column 5, for the former, and 85.4% for the latter).
Soft densification, infill and ‘garden grabbing’
Soft densification produced more additional units through construction than through alteration of existing buildings (Table 2, columns 6 and 8). Only a small proportion of this infill construction was accommodated on subdivided house plots or, more generally, on land previously in residential use. A larger proportion of these new units, their location in essentially residential areas notwithstanding, were built on vacant plots or plots that had previously been in non-residential use. 9
Nevertheless, beyond maintaining a distinction between new dwellings arising from forms of soft-densification traditionally described as ‘infill development’ and those created by subdividing buildings already part of the townscape, Table 2 attempts a disaggregation of the infill element by including a proxy for ‘garden infill’ (column 7). Such development retains the existing dwelling or dwellings – that is, no units are demolished – while new units are built on rear gardens (or back land) generating ‘derived plots’ by subdivision. 10 Although any form of infill development tends to have similar consequences by virtue of its location relative to existing dwellings (such as pressure on infrastructure, additional traffic, and loss of light and intrusion caused by new buildings), ‘garden infill’ may have a sharper impact, on biodiversity or neighbourhood character, for example. This point is especially significant because although infill development in England has not been particularly contentious historically, after 2005 opposition to some forms of densification crystallized around the pejorative term ‘garden grabbing’. 11
‘Garden infill’ activity (part of soft densification) accommodated an estimated 33,000 dwellings in urban areas in the inter-censal decade, of which 29,000 were within SFRNs. This represents 15.9% of all soft densification infill or 10.5% of all soft densification within these areas (that is, 29,000/275,000; Table 2, column 7/column 5). It is equivalent to 0.2% of their stock in 2001 (that is, 29,000/14,477,000; Table 2, column 7/column 1). This might be thought of as the rate of residential plot subdivision per decade. Also of note is the character of garden infill development. This remained markedly different from other housing development. Although there was a tendency for the density of property built on sites tracked by the garden proxy to increase over time, development densities were consistently well below those found in other contexts. As a result, the amount of residential space 12 secured by a household moving into a garden infill property was typically double that in other new built dwellings (16.6 dwellings per hectare compared with 30.6 dwellings per hectare between 2001 and 2011). Garden infill, while contentious, broadened the portfolio of high status properties in an area. 13
These summary figures allow concerns about ‘garden grabbing’ to be set in context. If the principal beneficiaries of garden infill were those who were able to realise the capital value of the land that they had made available for development, the derived plots undoubtedly afforded unusually large portions of residential space to their new occupiers. It is thus difficult to sustain the argument that ‘tens of thousands of gardens across the country were being dug up, and replaced with blocks of flats and high density buildings that spell disaster for the local environment and local infrastructure’ (Goldsmith, 2010, np). 14
Spatial variation in densification in England 2001–2011
Overall spatial variation in the tendency to accommodate additional dwellings between 2001 and 2011 is illustrated in Figures 1 and 2.
15
Figure 1 has been produced by comparing counts of dwellings at the 100 m × 100 m cell scale for 2001 and 2011 and generalising the results using geographic moving averages at the 400 m scale. At this level of resolution, it is possible to see not only the intensity of densification in much of London and the cores of cities such as Bristol, Manchester and Leeds but also the very uneven nature of densification within midland and northern cities. Densification characterized the cores of those cities rather than their suburbs and the centres of provincial conurbations rather than their satellite towns.
Absolute growth in dwelling stock; England, 2001–2011 (400 m moving average). Contains OS data © Crown copyright [and database right] 2015. Absolute growth in dwelling stock; England, 2001–2011 (10 km moving average). Contains OS data © Crown copyright [and database right] 2015.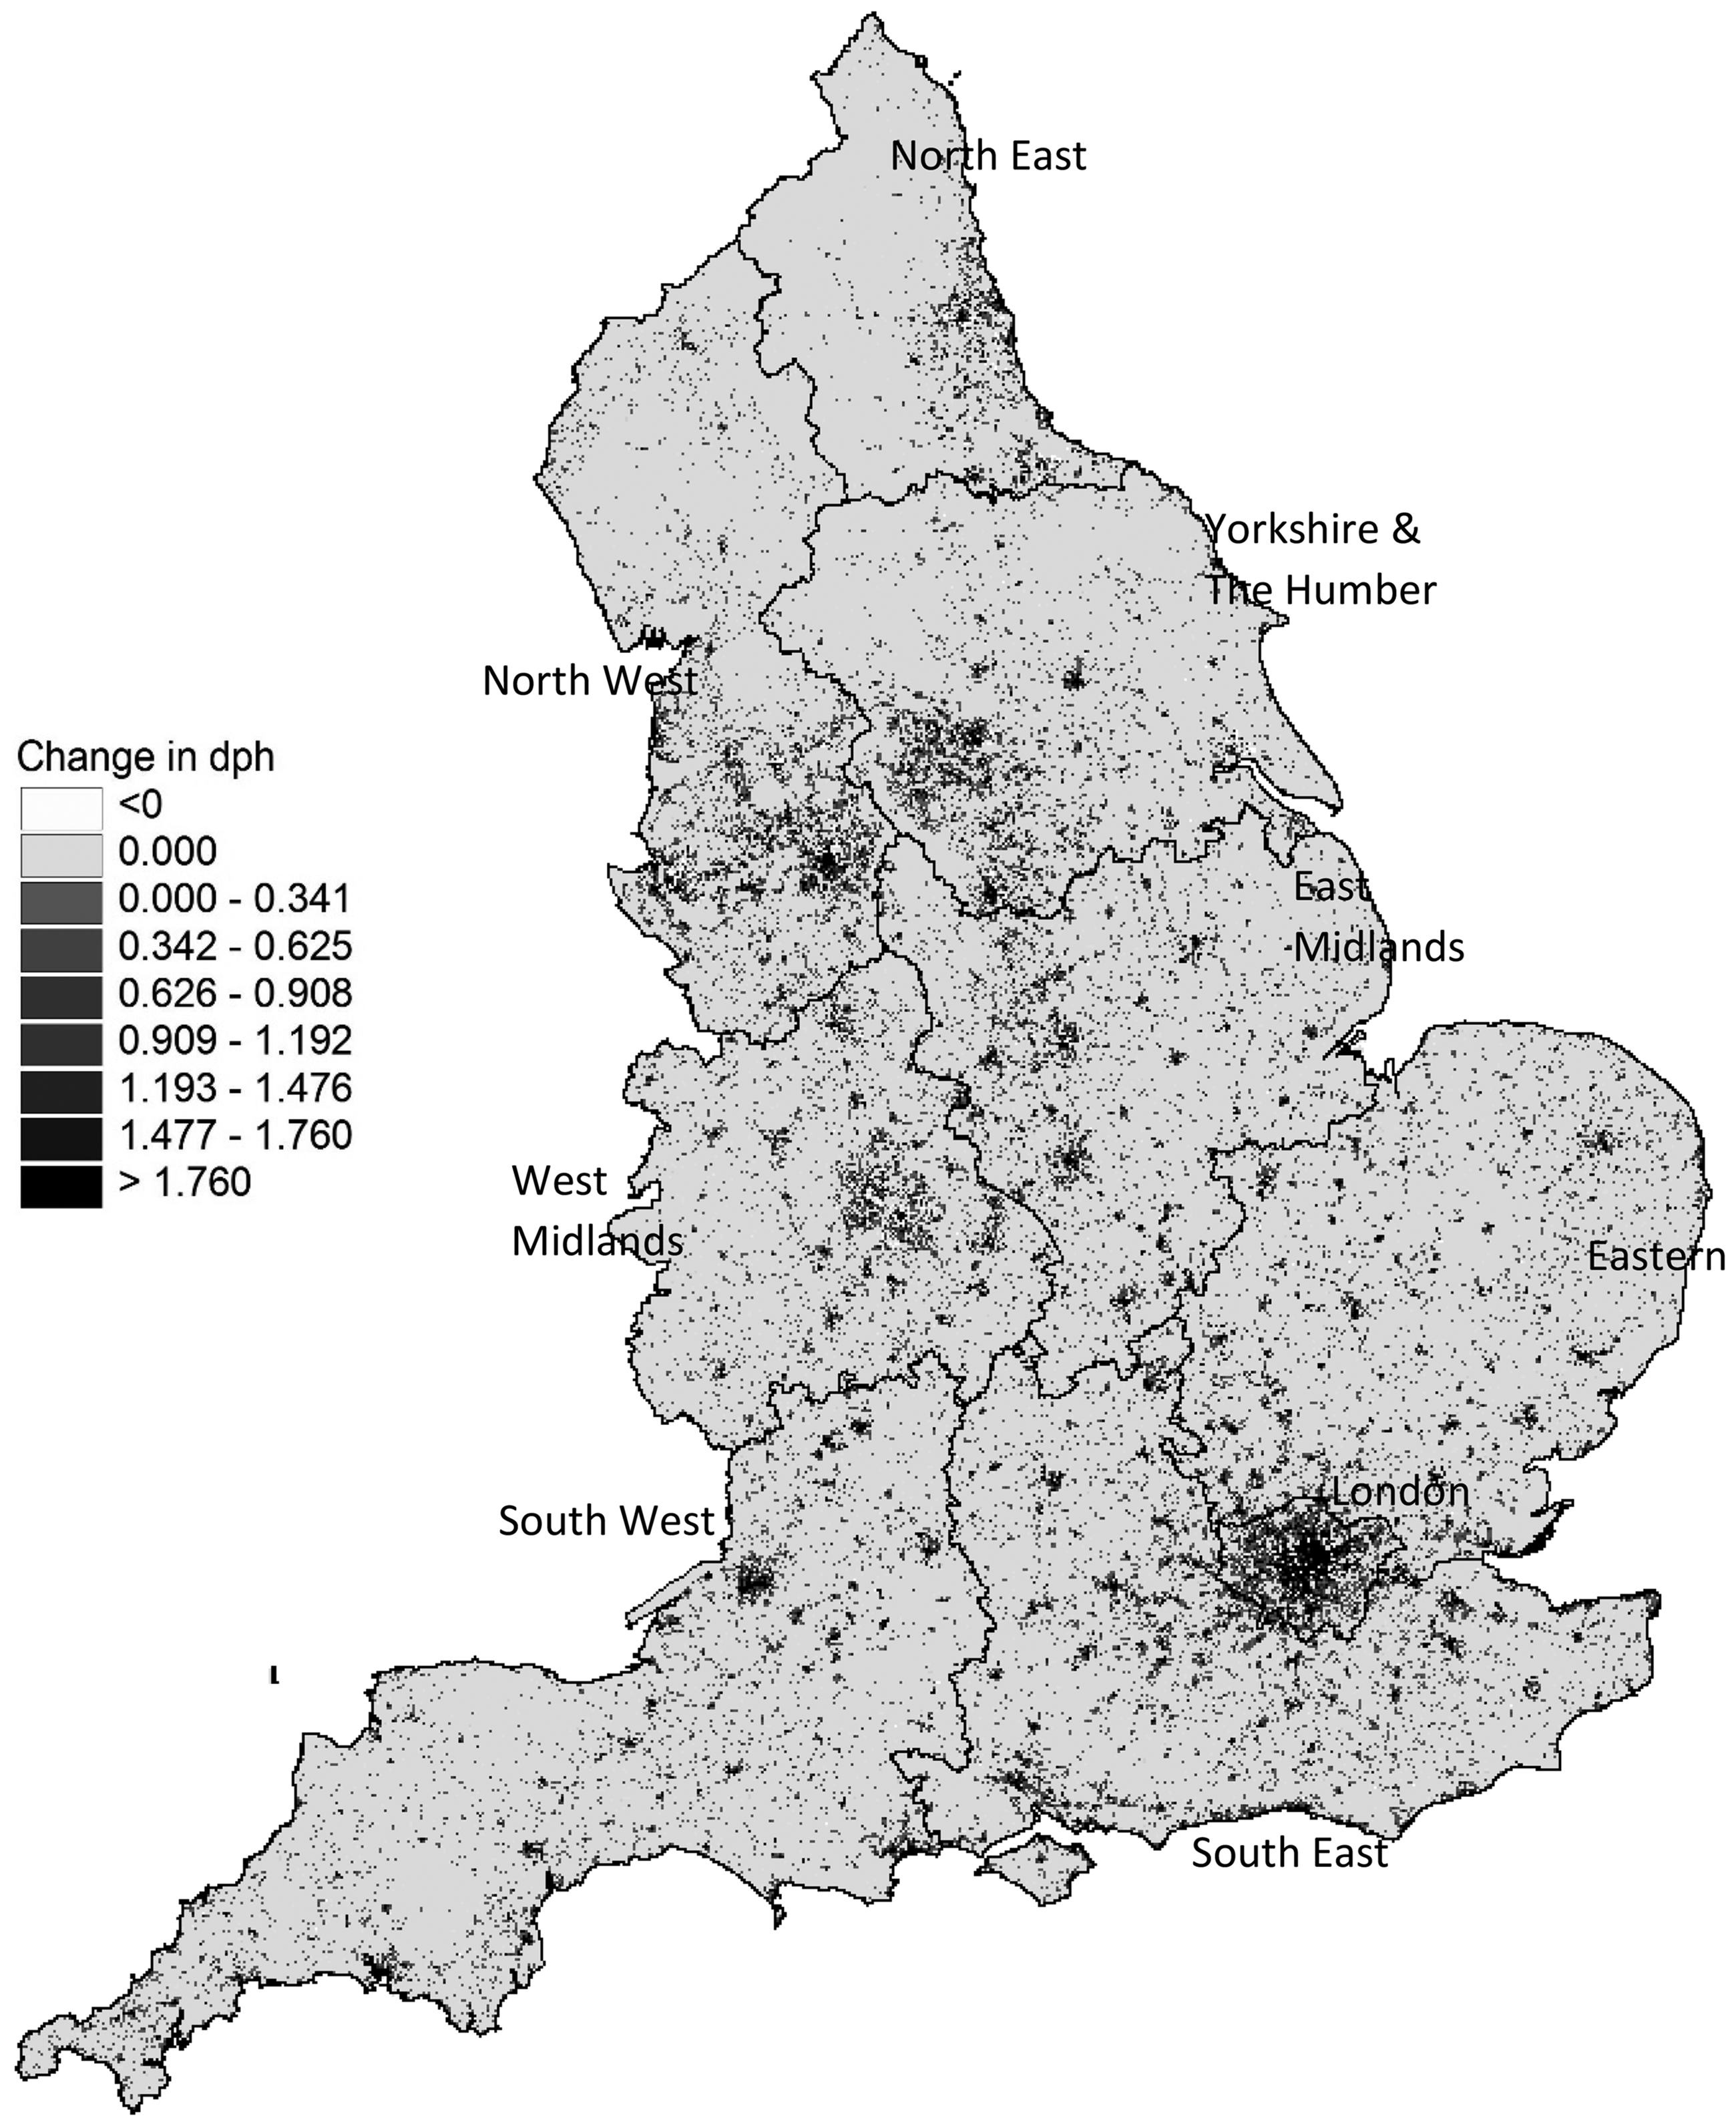
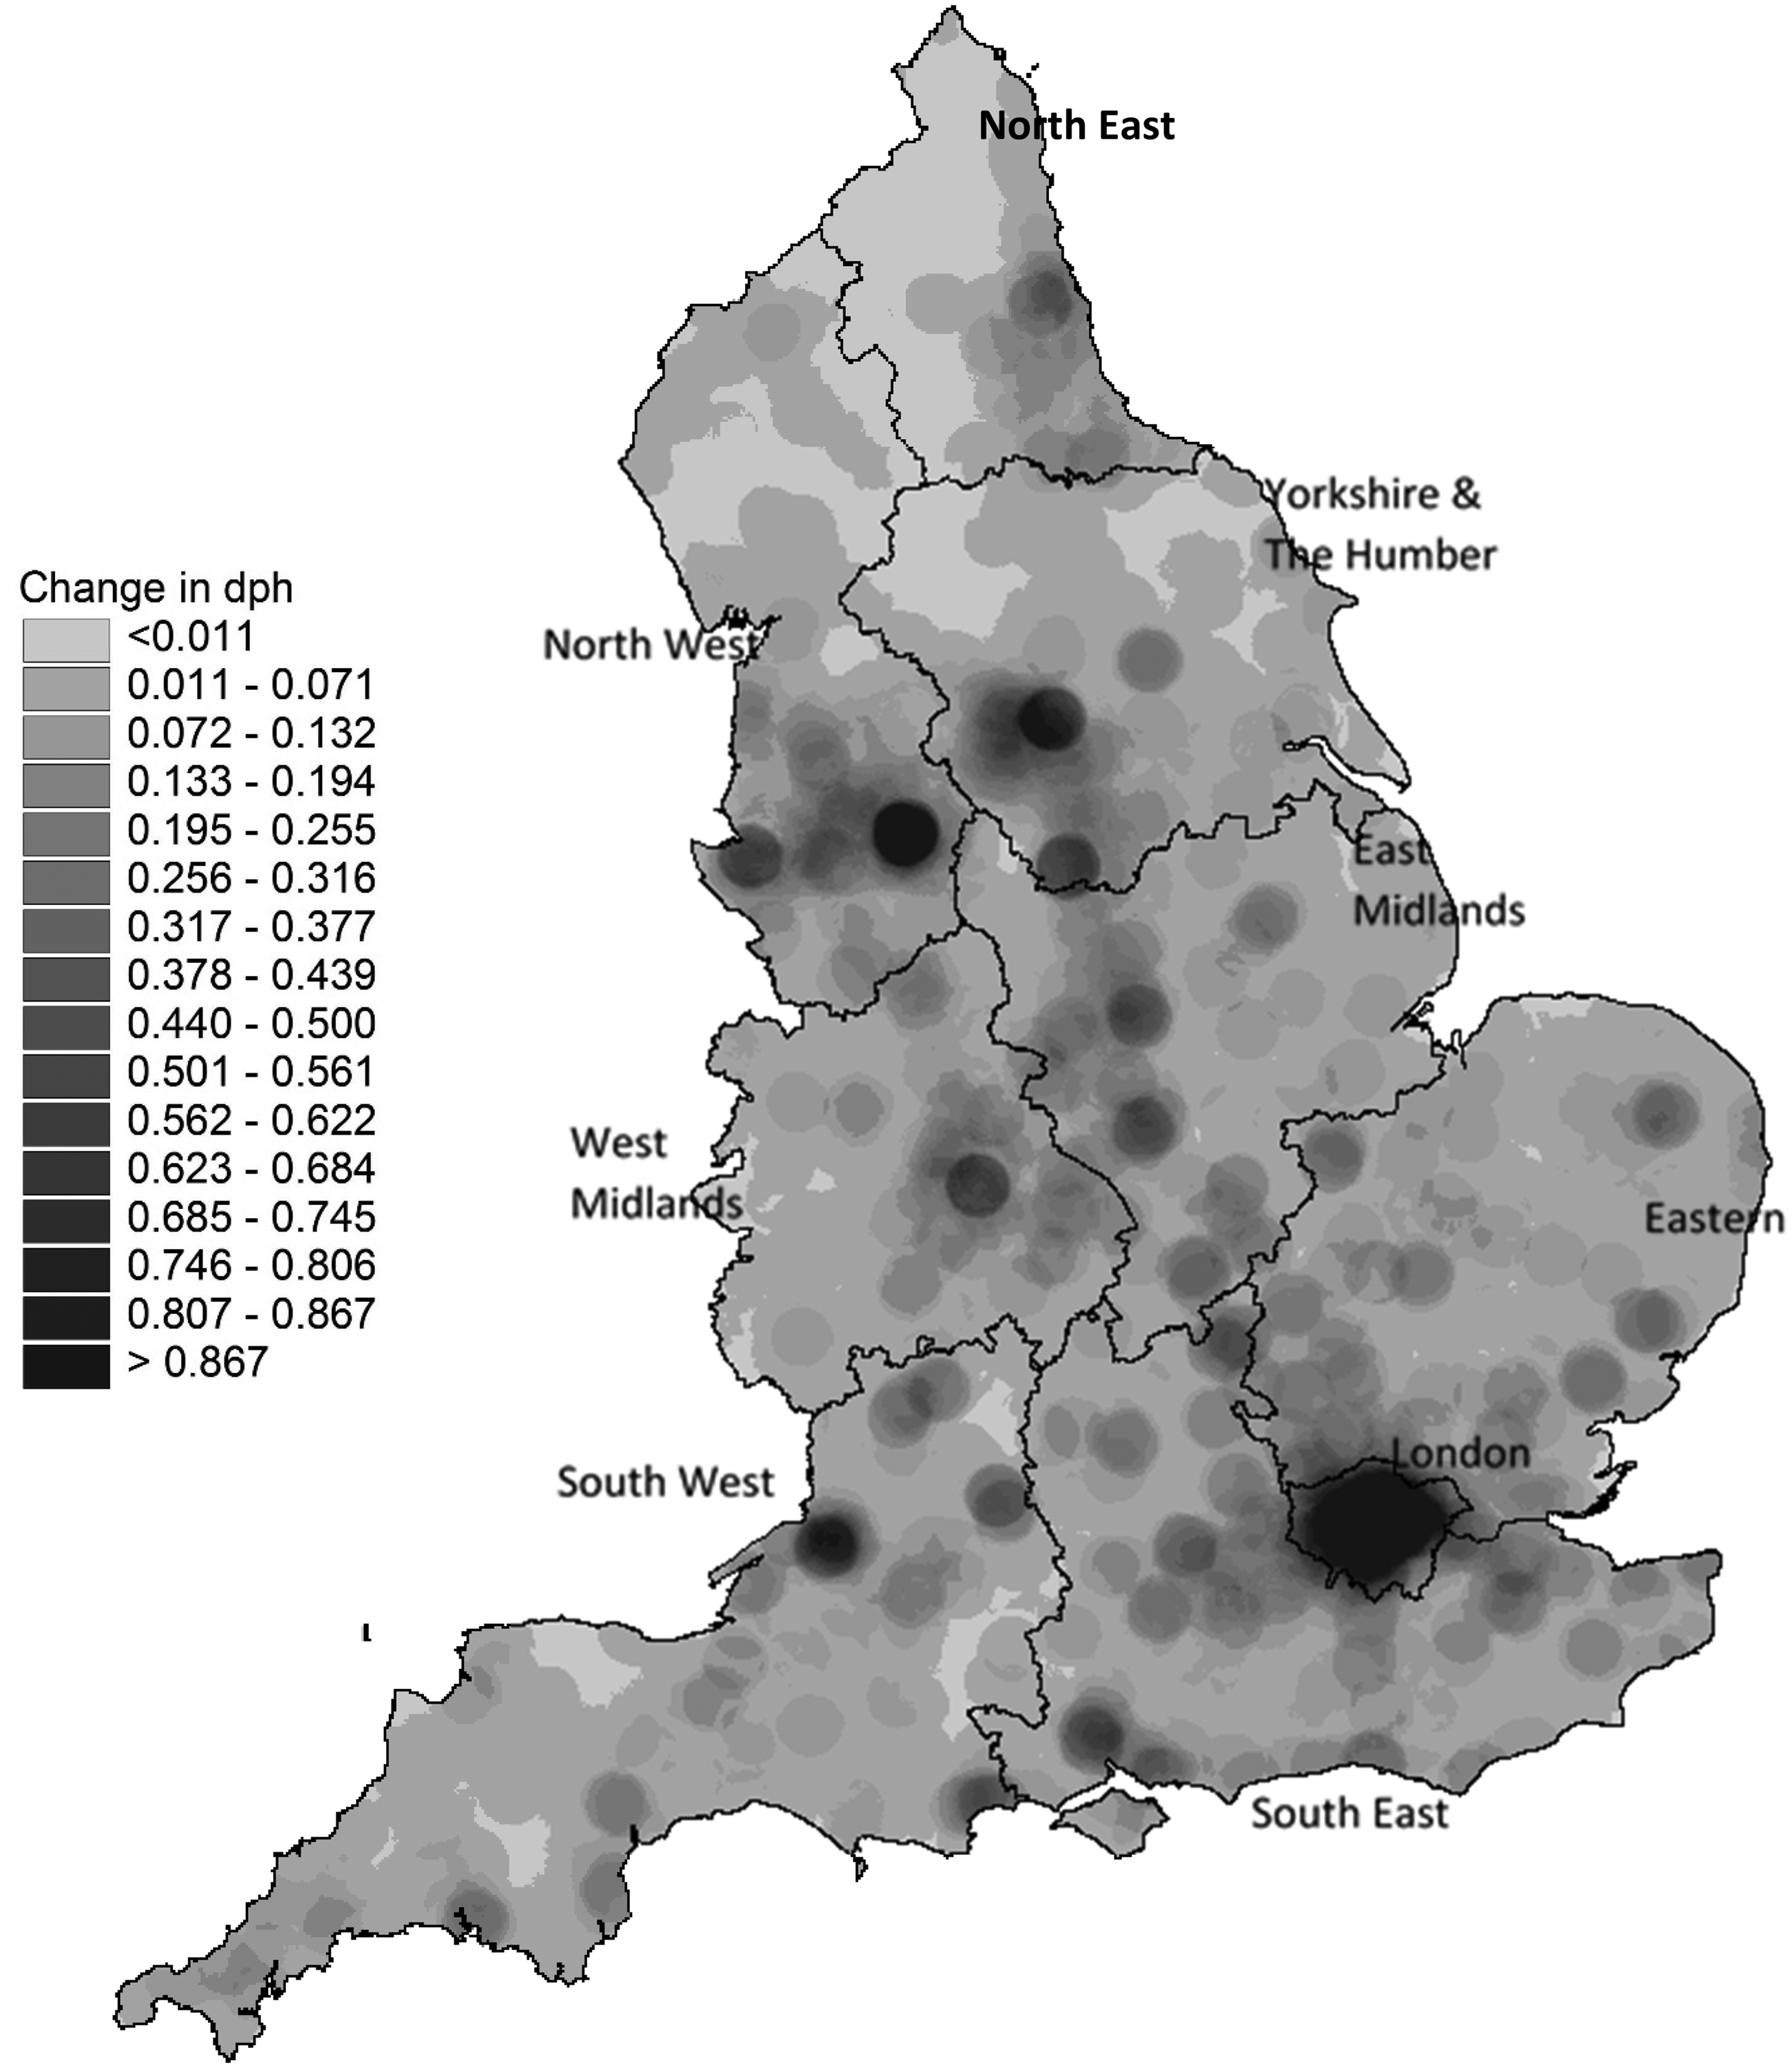
Figure 2 uses the same underlying data to show absolute change over the decade in the number of dwellings within 10 km of any point. It highlights the importance of the cities in absorbing additional dwellings and the overall extent of densification generally. The dominant pattern reflects the series of cities that runs from London, through the West Midlands conurbation to the Mersey Belt extending from Liverpool to Manchester in the North West. A second ridge of marked densification runs from the cities of Leicester and Nottingham in the East Midlands to Sheffield and Leeds (within Yorkshire and the Humber). The mature urban areas of the North East also accommodated very substantial numbers of additional dwellings.
Regional variation in ‘soft’ densification
Despite the remarkable extent to which urban areas proved capable of absorbing additional dwellings after 2001 (Table 1) and the substantial contribution of soft densification to that process (Table 2), the latter’s geographic incidence was very patchy. Figure 3 shows the effect of soft densification on ambient density, hectare by hectare across the country. The increasing densities so evident in London are reflected in Bristol (Bs), in certain south coast towns and in many cities and towns in the East Midlands. The effect of soft densification on the major urban areas of the North West was clearly also important, but its impact on the conurbations of Yorkshire and the Humber was a little less clear, and that on the West Midlands conurbation faltering. Soft densification would appear to have had a limited effect on densities in the North East region. Finally, in parts of the South East and most of the South West, some combination of demolition, amalgamation of dwellings and de-conversion
16
cancelled out any tendency to soft densification, and reduced densification overall.
Absolute growth in dwelling stock due to soft densification: England, 2001–2011 (10 km moving average). Contains OS data © Crown copyright [and database right] 2015.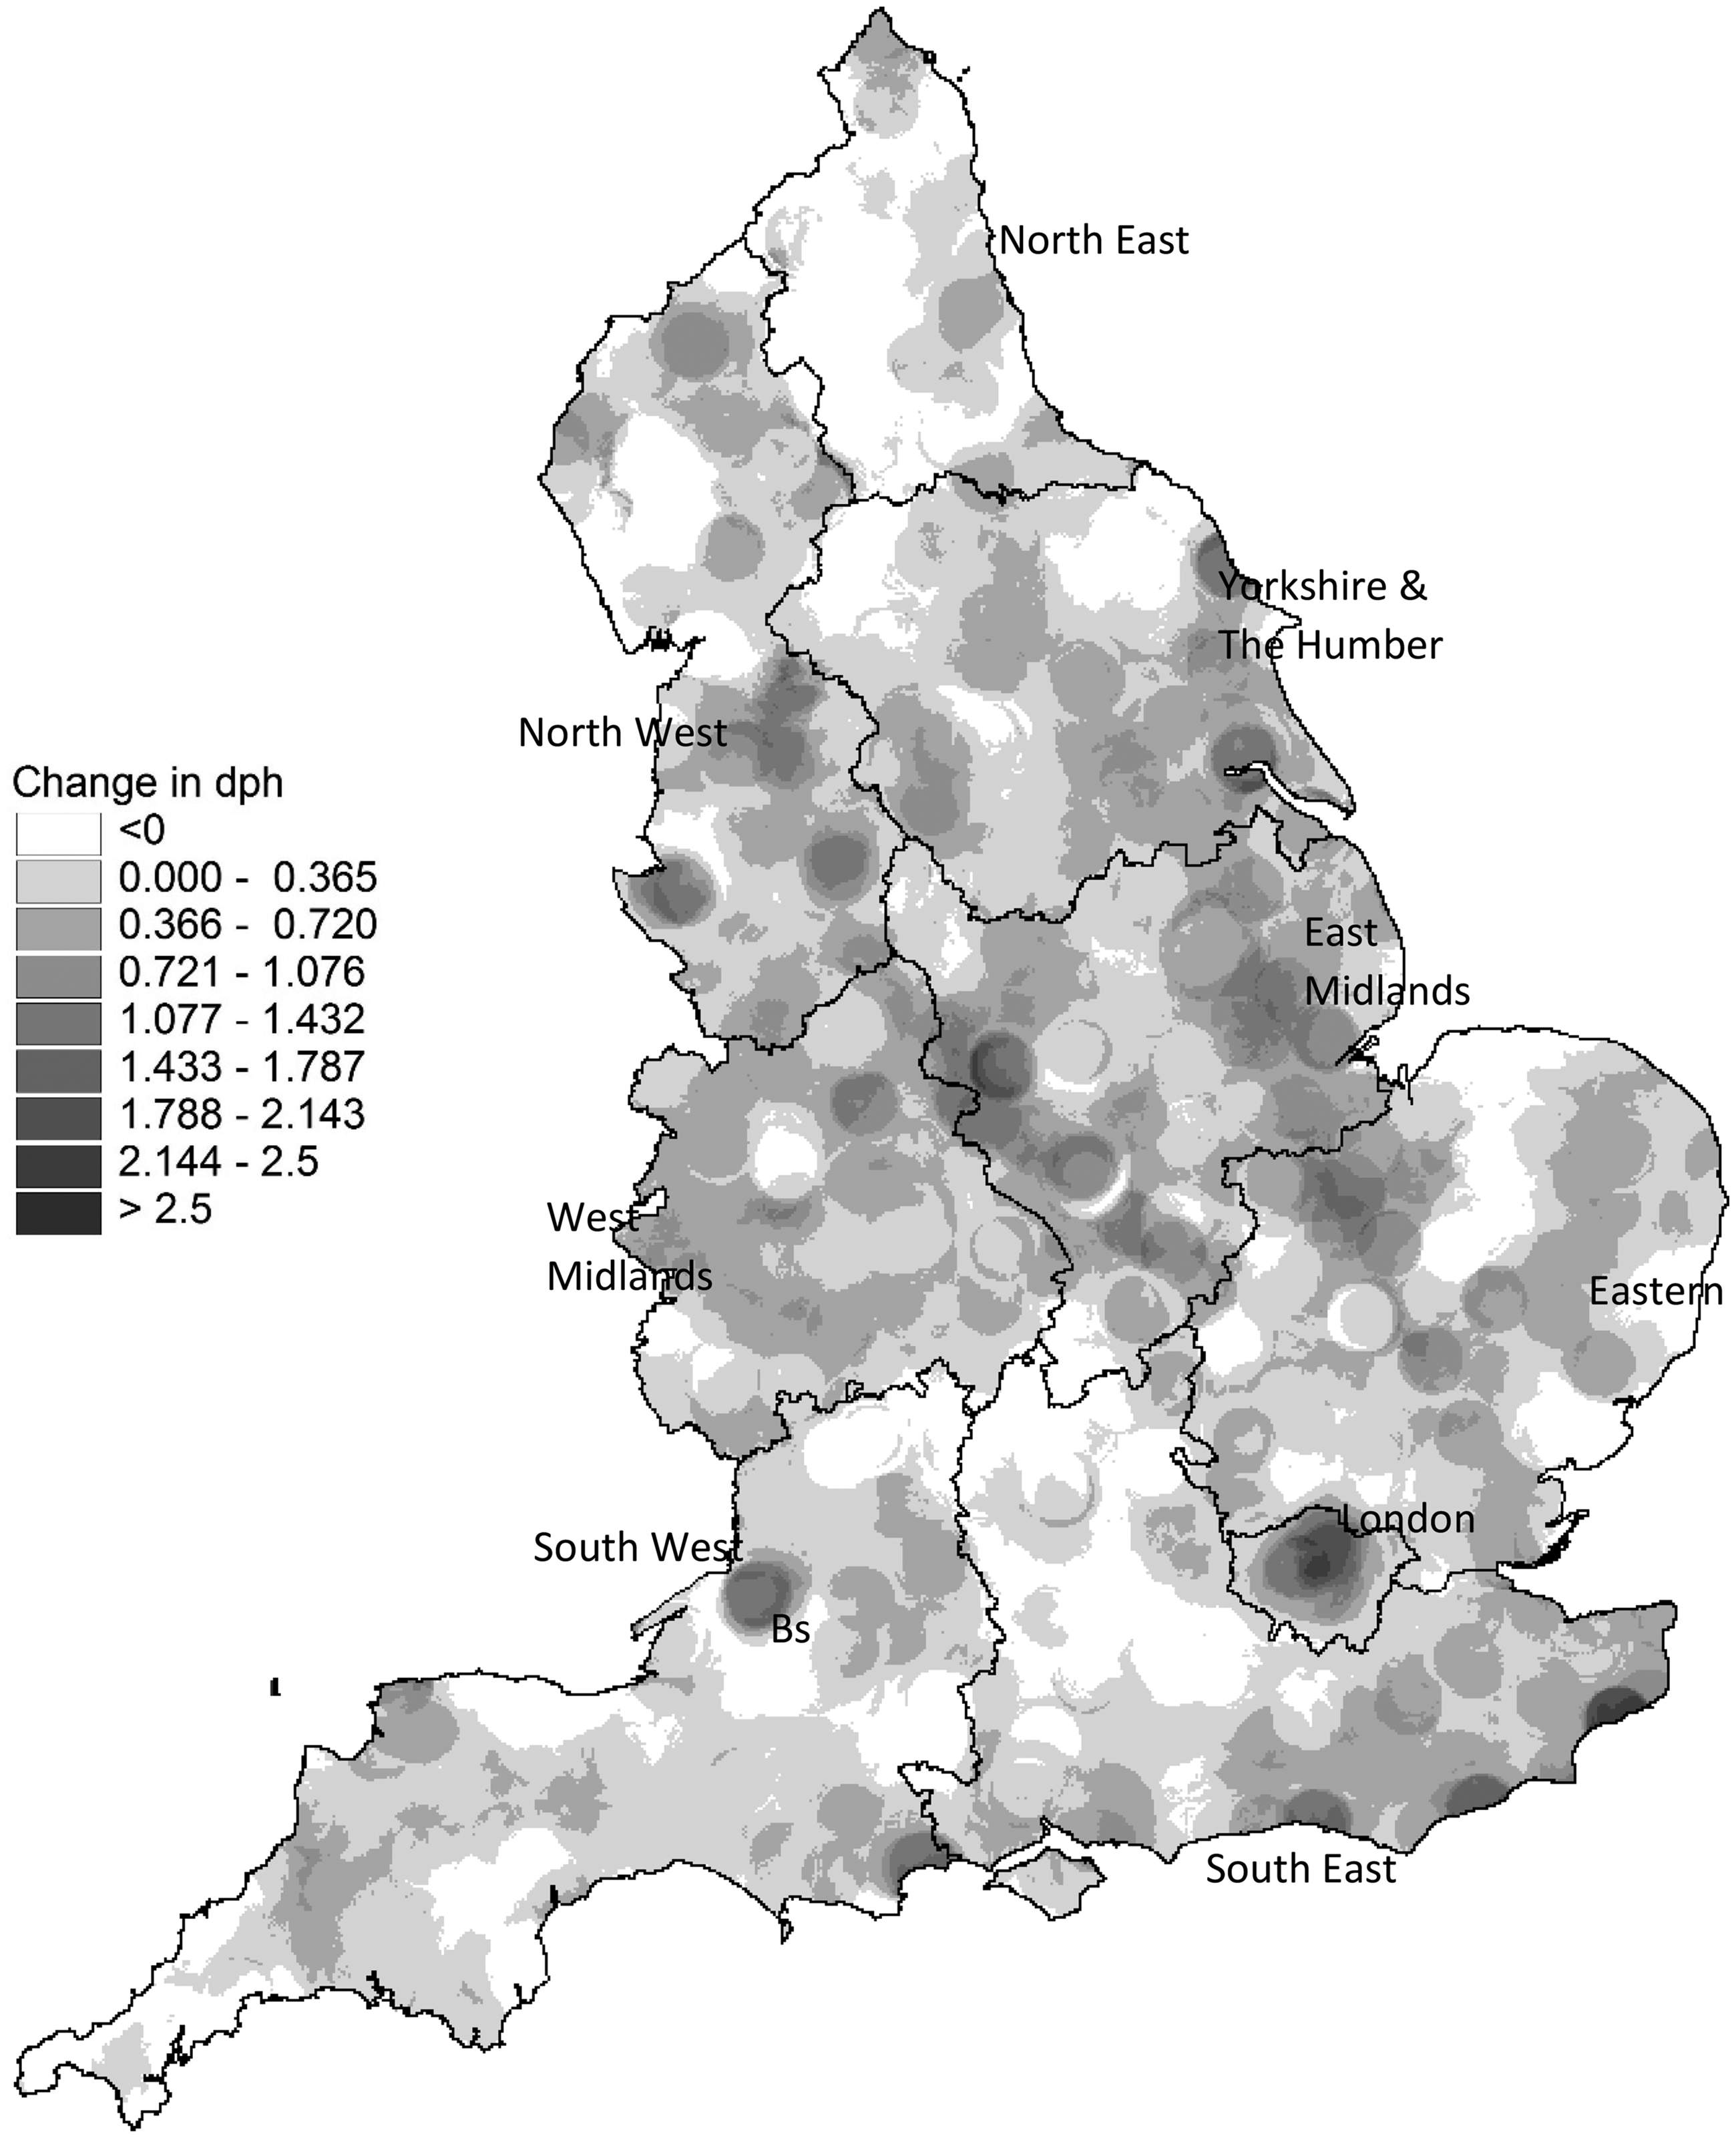
Soft densification, English urban area SFRNs only, by region 2001–2011.
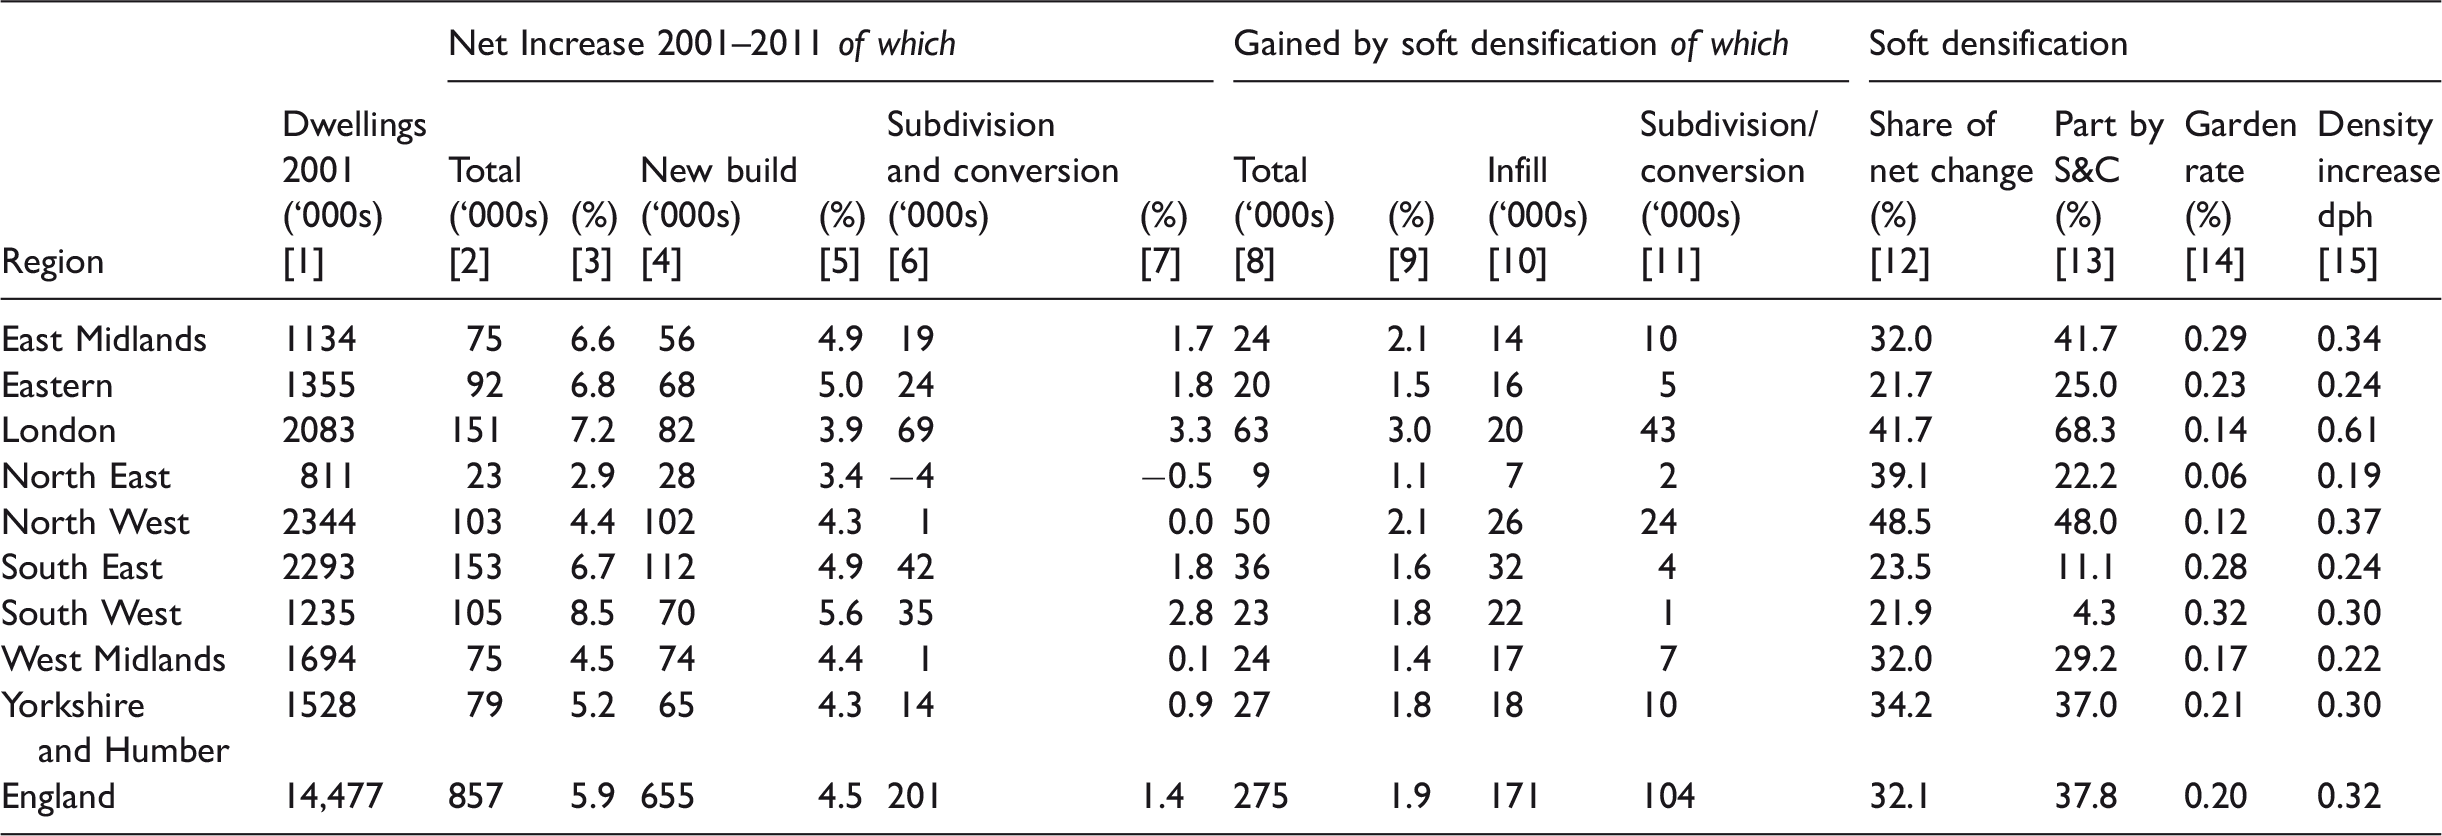
At NUTS1 region level, London combines the second-highest growth in the dwelling stock in absolute terms (see column 2 of Table 3) with the second-highest rate of growth (column 3). Soft densification accounted for over two-fifths (41.7%; column 12) of growth in London’s dwelling stock and increased ambient density by 0.61 dwellings per hectare (column 15). This was achieved overwhelmingly through internal subdivision of buildings. Two-thirds (68.3%; column 13) of soft densification came from this source. The opportunities for recycling urban land and buildings, supported by continuing economic, population and household growth in the context of the very strict containment regime of the Metropolitan Green Belt combined to produce a soft densification rate of 3% per decade (column 9), almost half as great again as in any of the other regions.
The two NUTS1 regions with rates of soft densification closest to that of London (the East Midlands and the North West, both at 2.1%) embody very different combinations of circumstances. The rate of growth of dwellings in SFRNs in the East Midlands was 6.6%; that in the North West was 4.4% (column 3). The factor underlying the high rate of soft densification in the North West was the large stock of urban land. Green Belt constraint beyond the urban areas, coupled with local policies guiding developers towards recycling the many small sites through urban infilling, ensured that soft densification accounted for a large portion of the additional units created. It represented a larger part of the net increase in dwellings in the North West (48.5%) than in London (41.7%), the East Midlands (32.0%) or any other region (see column 12).
More generally, reference to the rate of growth of the dwelling stock and the settlement structure of each NUTS1 region provides a way of beginning to understand place-to-place variation in soft densification. The West Midlands and the North East with relatively low rates of growth experienced the lowest rates of soft densification (column 9). The South West with a relatively small dwelling stock displayed the highest rate of growth (at 8.5% over the decade; column 3), but its urban structure – lacking major conurbations – did not favour soft densification, and the overall rate was a moderate 1.8% (column 9).
The components of soft densification vary in importance across different regions. This is particularly clear in the case of garden infill. The rate of residential plot subdivision (the ‘Garden Rate’, see column 14) is associated with high demand. Division of this rate by the overall rate of soft densification (column 9) shows that garden infill accounted for 18% of all soft densification in the South East and South West but only 5% in the North East.
Soft densification in London
London’s physical extent has been constrained by a green belt for longer than any other English city
18
and it has been subject to continually high levels of demand for housing. In these circumstances, it is not surprising that the scale and rate of soft densification in London are the highest of any region (Table 3, columns 8 and 9). For these reasons, a more detailed consideration of London was undertaken to provide an initial indication of the varying character of intra-regional soft densification. Figure 4 illustrates how the average number of units gained through soft densification varied in different parts of London. It is an absolute measure. The most obvious areas of soft densification are attributable to dwelling subdivision and are found in locales such as Willesden (W), Tottenham (T) and Edmonton (E).
Intensity of soft densification: Greater London, 2001–2011 (hectare cells). Contains OS data © Crown copyright [and database right] 2015.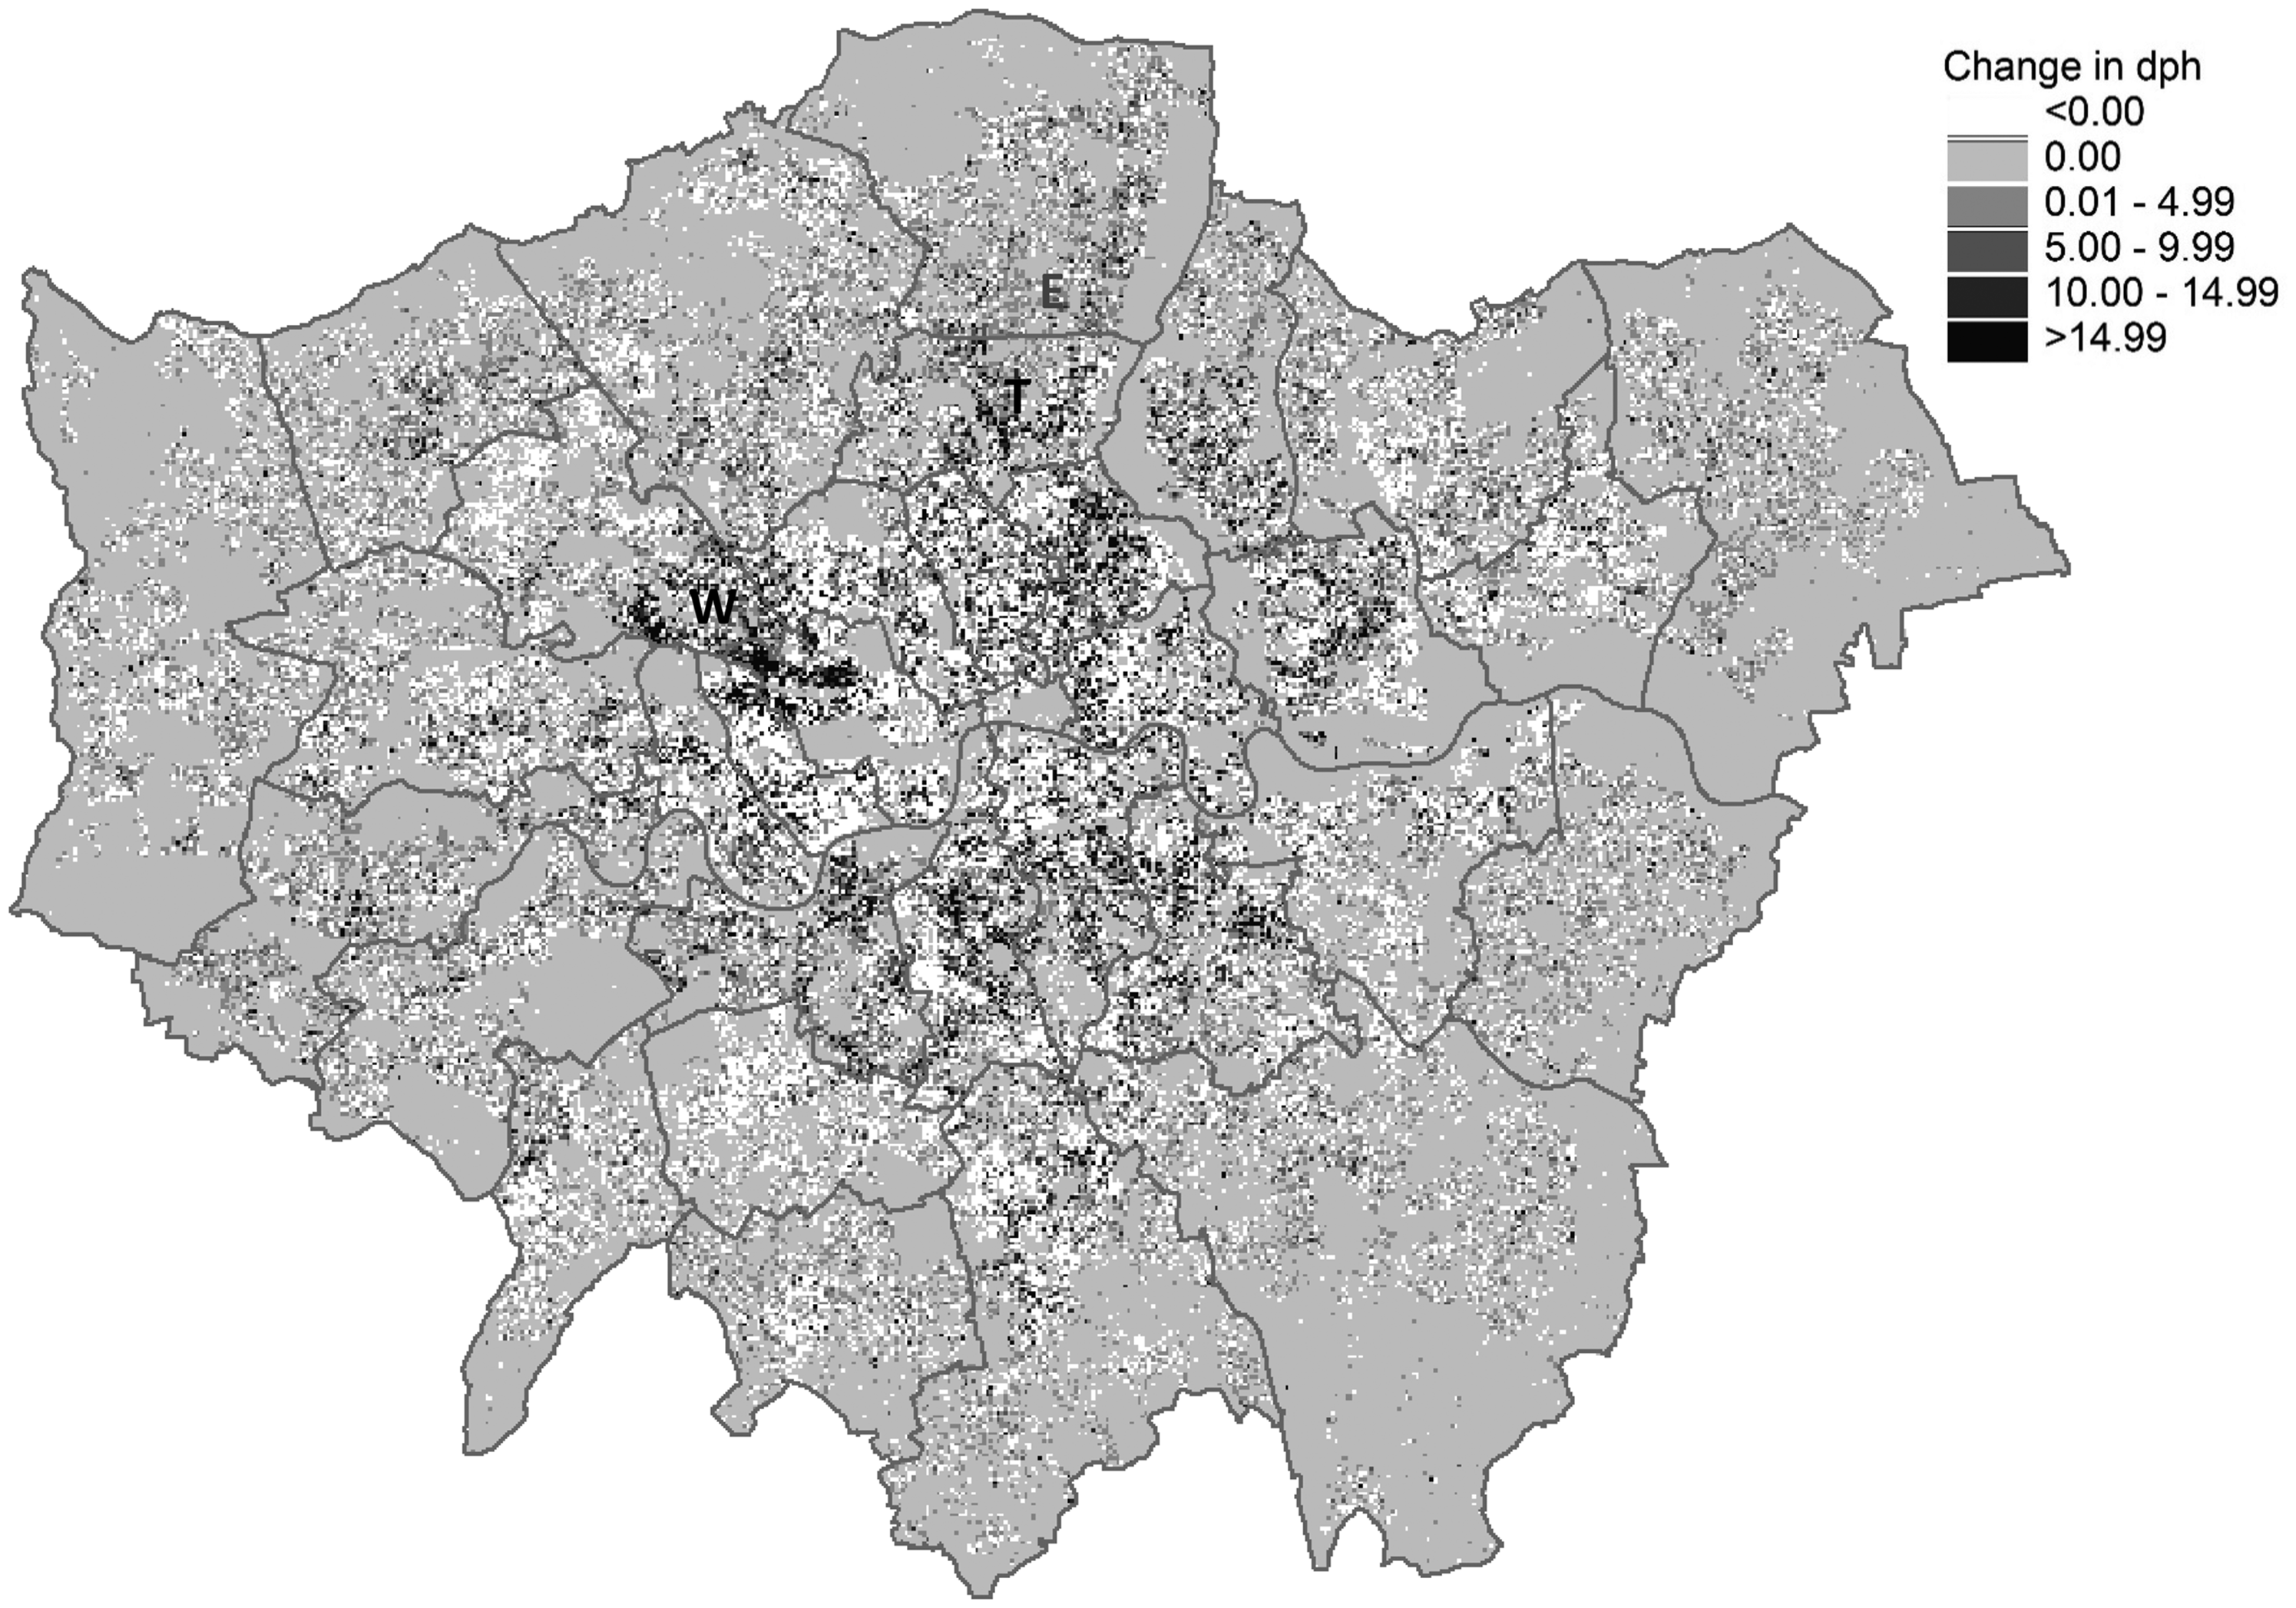
While Figure 4 illustrates the effect of soft densification almost street by street, Figure 5 provides a starker impression of the net effect of small-scale adjustments to the dwelling stock within a 2 km radius of any point. This again highlights the scale of soft densification in Willesden (W), Tottenham (T) and Edmonton (E). Net effects in other areas become clearer. The limited role of soft densification is evident in a group of localities such as Southwark (S) where large-scale change is taking place. Here, as in the inner core of Westminster (C), the tendency to soft densification is weak, because change is controlled by major property interests. Figure 5 also highlights stable suburban areas such as Wimbledon, where the net effect of small-scale adjustments is strongly negative. Finally, comparison of Figures 4 and 5 draws attention to contexts where there is substantial small-scale activity but little net effect. This is exemplified by the eastern part of the London Borough of Ealing where conversion of family dwellings into flats appears to be almost exactly offset by deconversion on a similar scale (a trend whose continuation since 2011 is confirmed in monitoring by the Greater London Authority, 2014: 44)).
Intensity of soft densification: Greater London, 2001–2011 (2 km moving average). Contains OS data © Crown copyright [and database right] 2015.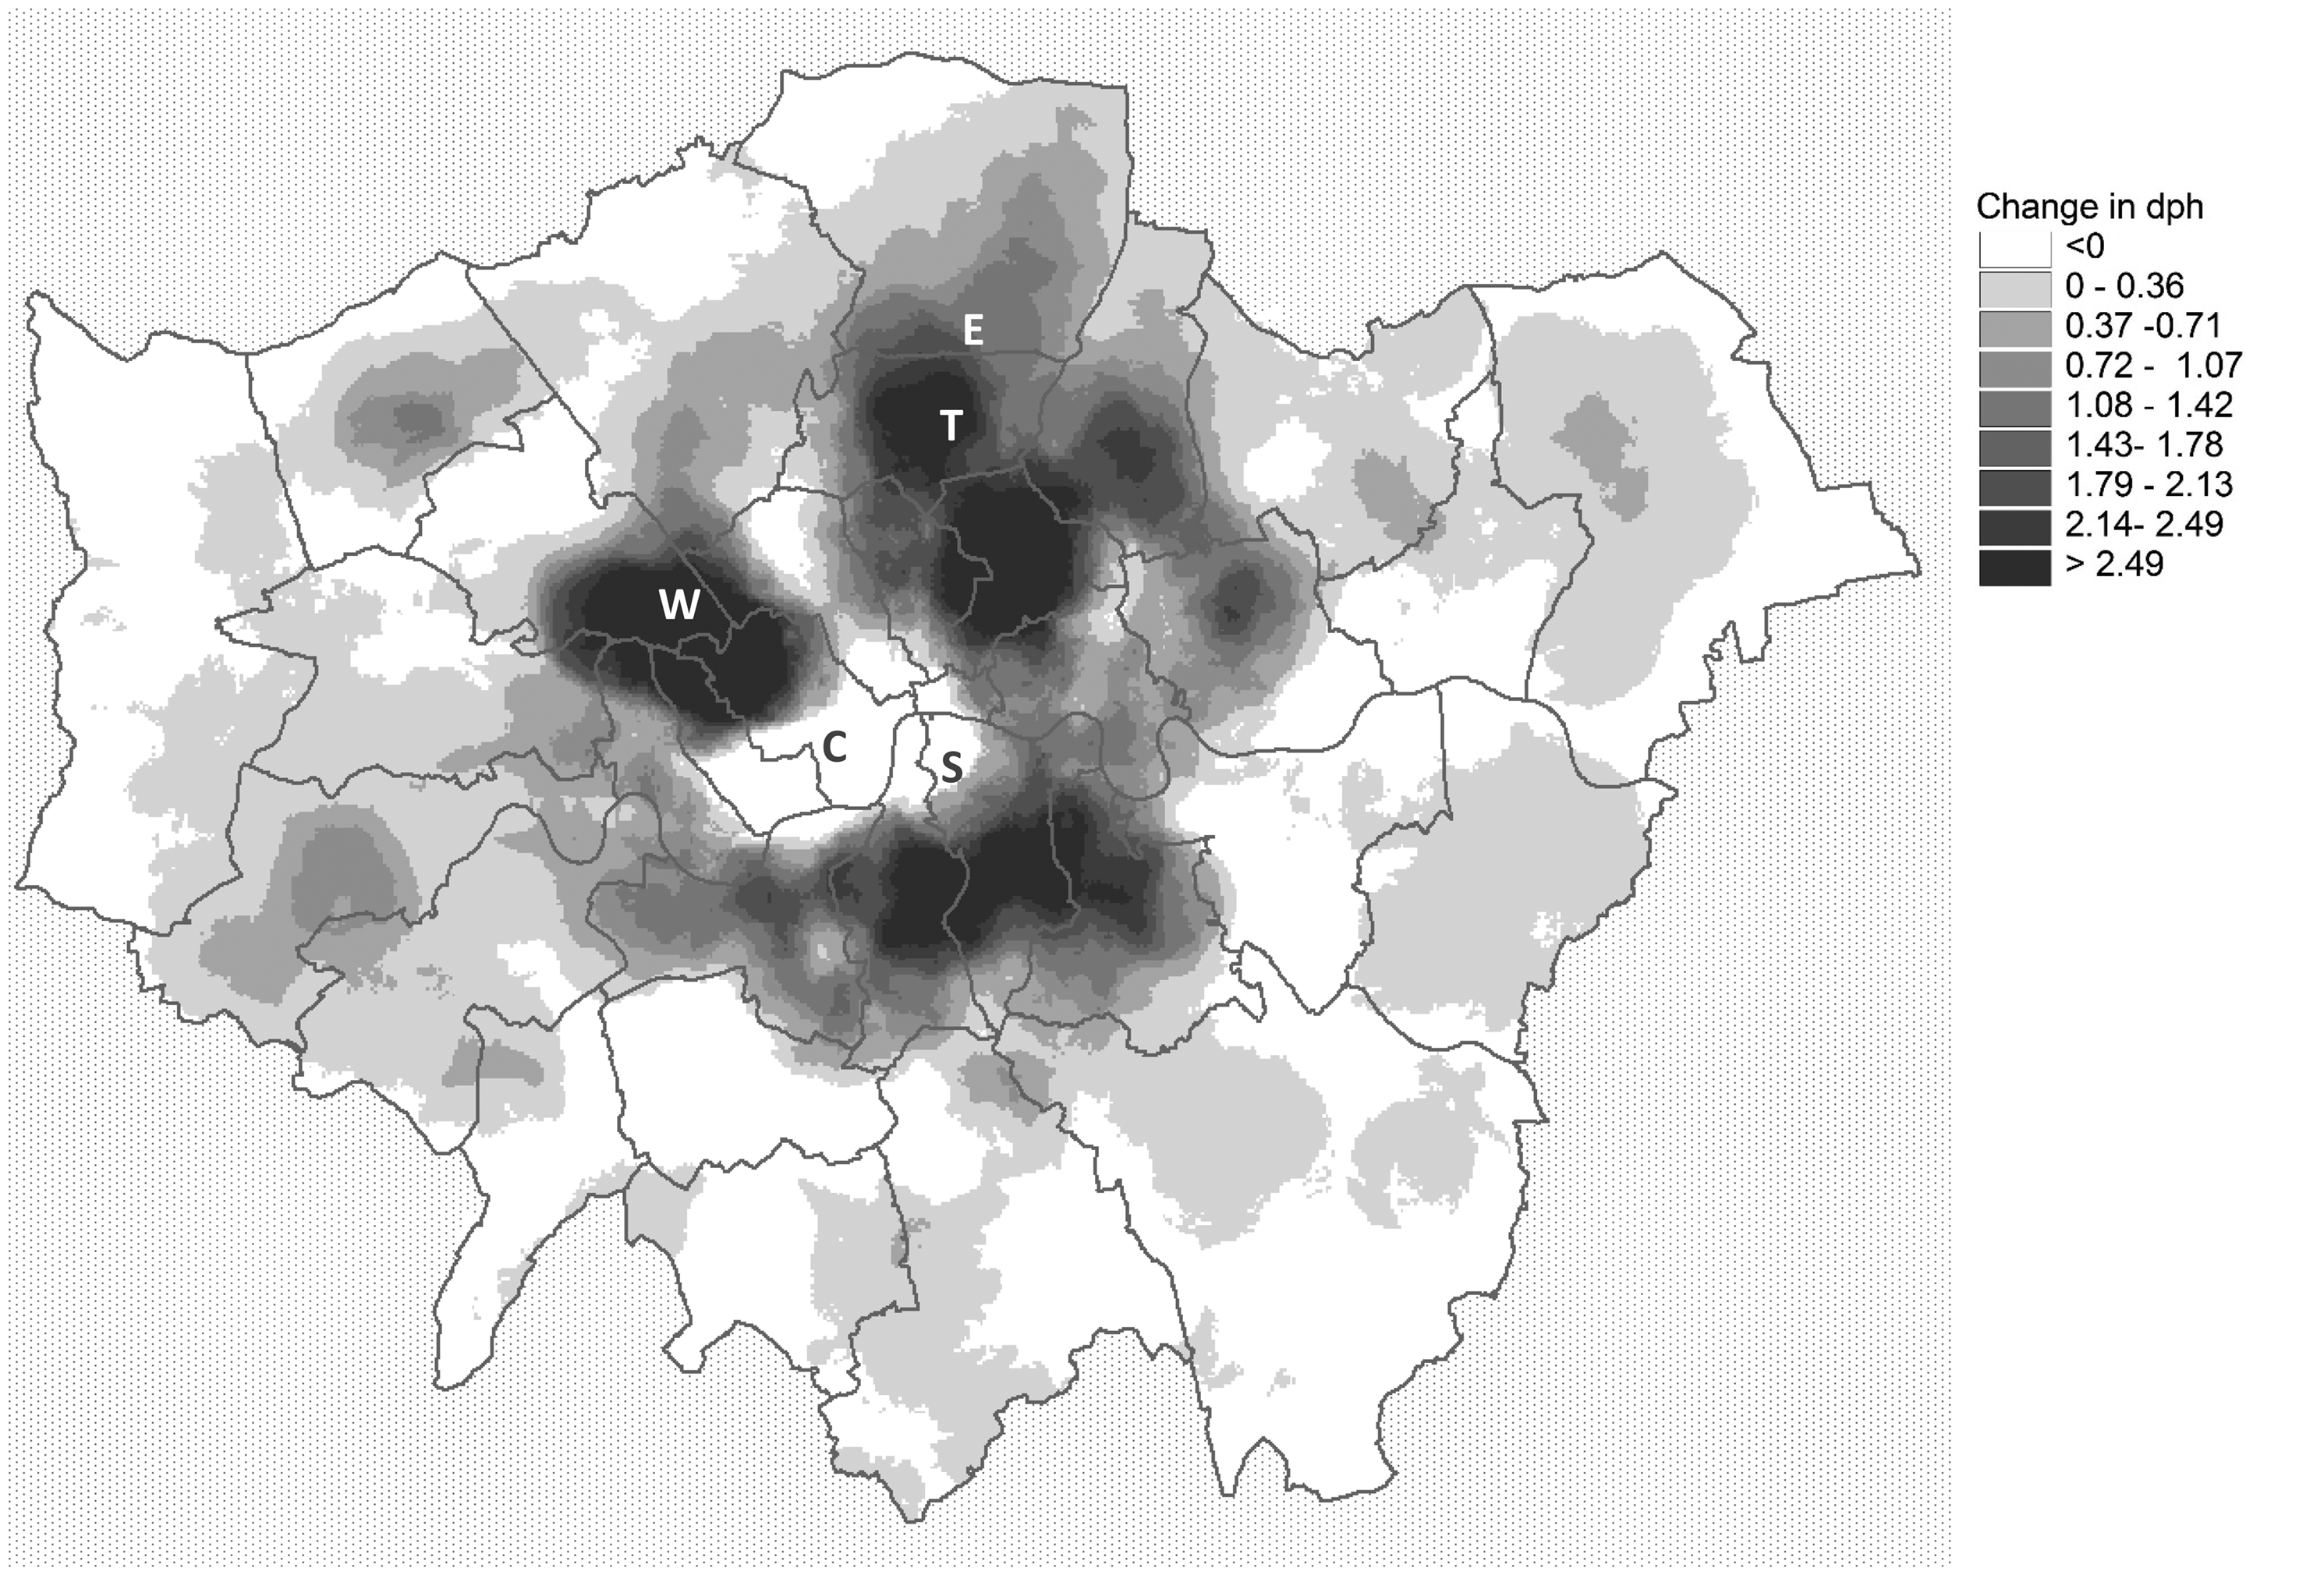
The extent of garden infill in London was relatively limited over the decade; a reflection of the generally high density of building on existing residential plots and a consequent emphasis on building extensions rather than plot subdivision. On the definitions used here, there are some areas of London where the rate of garden infill was relatively high – Southall in the London Borough of Ealing was one such area, an area centred on Childs Hill impinging on the London Boroughs of Camden and Barnet was another and Kingston-on-Thames, a third. Higher rates were typical of suburban towns beyond the limits of Greater London, particularly in an arc stretching from Reading in the West to St Albans in the North.
This initial consideration of London and its environs illustrates clearly that the welter of individual actions through which agents adjust the housing stock may and frequently do move in opposite directions. For example, not only are conversions and de-conversions closely balanced in much of Ealing, but also the relatively high rate of plot subdivision in Southall (Ealing) is not evident in the overall pattern of soft densification. In a similar way, a tendency towards densification evident in infill development may be negated by de-conversions or amalgamation of dwellings. Within Greater London, the high rate of infill construction found in much of Croydon is offset by adjustments to the existing stock that tend to create fewer, larger dwellings. This particular balance has also reduced or even negated any tendency to soft densification in areas to the South and West of Greater London, such as Reading, Guildford and Crawley.
Conclusions
Urban England has been well contained. Three in every five additional dwellings developed between 2001 and 2011 were accommodated within extant urban areas. Three quarters of these dwellings were produced by new construction and one quarter by the conversion and subdivision of existing buildings. Three quarters of this activity was in SFRNs – ‘the suburbs’ – and one quarter elsewhere in urban areas. Three quarters of the additional dwellings were accounted for by formally planned ‘hard’ densification and one quarter by informal ‘soft’ densification occurring ‘under the radar’. But these overall trends, while important, mask myriad experiences of densification that vary greatly between and within English cities.
Interaction between settlement forms, economic structures and performance, demographic trends and policy regimes, past and present, combine locally to produce a wide range of outcomes. Soft densification accounts for more than 40% of additional dwellings in both London and the North West. But a lack of available sites in the face of high demand results in conversion and subdivision producing twice as many dwellings as infill development in London. In the North West’s cities, with much post-industrial vacancy and lower demand, land supply is much less constrained and the two sources of additional dwellings are in balance. Intra-urban patterns of densification are even more complex. In the London Boroughs, various combinations of large, formal development schemes that substantially increase site density and others that reduce it, less intrusive infill developments, and the deconversion of larger existing houses may all be proceeding simultaneously. The extent to which development density in an area increases or decreases is determined by the balance between these factors. Indeed, the local built environment may be substantially re-structured but with little net effect on overall density, as in Ealing or Croydon.
Clearly, the process of urban densification is complex and its workings are contingent on local circumstances. This produces great variation in the types of physical change that are pursued and the character of the built environments that result. Despite their heterogeneity, these findings have implications for cities more generally. The first is the importance of the scale at which density and densification are considered. Research at the metropolitan level may conceal as much as it reveals. Similar (trends in) densities between cities may be the only thing that they have in common if these have been achieved in different ways and take different intra-urban forms. More detailed analysis is required to uncover variations in local conditions. Secondly, in the absence of such analysis, there is the risk of inappropriate policy responses. For example, moves to remove land from a city’s green belt where this is not justified, wholly or in part. Thirdly, the existence of substantial variation in intra-urban densification raises questions about the assumption that more dense and compact cities are also more socially just and equitable cities (Burton, 2000; Touati-Morel, 2016). Different patterns of intra-urban densification affect different neighbourhoods in different ways, some good and some bad, and their net effect is not clear. Finally, densification challenges the urban stereotype of central areas surrounded by a ring of relatively stable, homogeneous suburbs that expands outwards as cities grow (Phelps and Wood, 2011). It disrupts current assumptions and relations, perhaps particularly in the suburbs. Therefore, ‘… density matters… Through the various forms it may take, density reveals power relations. It also mediates between different interests, favouring some and disadvantaging others’ (Charmes and Keil, 2015: 10).
In this paper, we have focused on the forms of densification in England, hitherto not established empirically. Subsequent analysis will consider its theoretical, social and policy implications.
Data Sources
This paper is based on the analysis of data drawn from the following sources: the Land Use Change Statistics (LUCS), managed by the Department for Communities and Local Government (for details see <https://www.gov.uk/government/collections/land-use-change-statistics>); and the Royal Mail's Postcode Address File (PAF) (for details see <http://www.postcodeaddressfile.co.uk/products/postcode_address_file_paf/paf_product_detail.htm>).
Supplemental Material
sj-pdf-1-epb-10.1177_2399808318772842 - Supplemental material for Under the radar? ‘Soft’ residential densification in England, 2001–2011
Supplemental material, sj-pdf-1-epb-10.1177_2399808318772842 for Under the radar? ‘Soft’ residential densification in England, 2001–2011 by Peter Bibby, John Henneberry and Jean-Marie Halleux in Environment and Planning B: Urban Analytics and City Science
Footnotes
Acknowledgements
The research for this paper was undertaken in the context of an international research consultation on ‘Towards “soft” densification and intensification policies? Interests, limitations and opportunities’. This consultation was financed by the French Ministry of Planning (Ministère de la Cohésion des territoires (Ministry of Territorial Cohesion) – Ministère de la Transition écologique et solidaire (Ministry for the Ecological and Inclusive Transition)) and managed by PUCA (Plan Urbanisme Construction Architecture). The authors are grateful for PUCA’s support.
Declaration of conflicting interests
The author(s) declared no potential conflicts of interest with respect to the research, authorship, and/or publication of this article.
Funding
The author(s) disclosed receipt of the following financial support for the research, authorship, and/or publication of this article: The research upon which this article is based was funded by the French Ministries of Planning and of Ecological and Inclusive Transition.
Notes
References
Supplementary Material
Please find the following supplemental material available below.
For Open Access articles published under a Creative Commons License, all supplemental material carries the same license as the article it is associated with.
For non-Open Access articles published, all supplemental material carries a non-exclusive license, and permission requests for re-use of supplemental material or any part of supplemental material shall be sent directly to the copyright owner as specified in the copyright notice associated with the article.