
Abstract
Win-paired cues drive maladaptive decision-making in laboratory-based gambling tasks. However, humans prefer these cued games that facilitate gambling addiction. Whether rats prefer tasks that employ win-paired cues is unknown, yet this has consequences for the validity of using rodent models to investigate problem gambling. Here, we allowed rats to choose on a trial-by-trial basis whether to work for cued or uncued rewards on the rat gambling task. We also performed computational modelling to investigate individual differences in decision-making strategies. Rats could be grouped based on preference for task type, which became more pronounced across training, or preference for risky options, as is standard for the rat gambling task. Risk-preferring rats increasingly preferred the cued task over time. Decision-making was marginally riskier on cued trials, particularly in risk-preferring rats, but this was independent of task preference. Pairing of rewards with audiovisual cues accelerated response times and enhanced impulsivity in both cue- and risk-preferring rats. Cued wins also resulted in greater post-reinforcement pauses in risk-preferring animals only. Diffusion model analyses revealed optimal decision-makers have longer non-decision times before risky or impulsive choices, yet this is absent in risk-preferring animals. As such, lapses in cognitive control could be responsible for maladaptive trial outcomes in optimal, but not risk-preferring, rats. Collectively, these data support the use of high-risk preference at baseline as a proxy for vulnerability to problem gambling. Furthermore, diverse computational mechanisms could be responsible for the negative impact of win-paired cues on gambling-like behaviour in at-risk versus resilient individuals.
Introduction
Environmental stimuli linked to rewards, often termed ‘cues’ in psychological research, can strongly impact behaviour, particularly in gambling and other addictions. Salient cues capture attention, motivate and incentivise cue-linked actions, and thereby drive craving and other addictive behaviours (Robinson and Berridge, 1993). Electronic gambling machines make use of complex, salient audiovisual cues, and are linked to high prevalence of disordered gambling (Dowling et al., 2005). These types of gambling-related cues increase arousal and enjoyment ratings during gambling tasks, but also lead to inaccurate representations of earned reward (Dixon et al., 2010, 2014, 2015). This suggests that humans prefer the stimulation of these cues, but may not realise the potential for them to negatively drive gambling behaviours.
Animal models serve as invaluable tools for studying the neurobiological and behavioural aspects of gambling disorder, providing insights into its underlying mechanisms and potential therapeutic interventions (Winstanley and Clark, 2016). The use of valid, reliable models ensures animal research is relevant to human gambling experiences, thereby enhancing translatability to clinical settings. The rat gambling task (rGT) incorporates multiple complex schedules of reinforcement to model gambling-related decision-making (Barrus and Winstanley, 2016; Zeeb et al., 2009). While most animals adopt an optimal decision-making profile to maximise reward, a subset exhibit risky decision-making, much like data from humans on the conceptually similar Iowa Gambling Task (IGT; Brevers et al., 2013). The neural circuits and neurotransmitter systems underlying rGT performance appear similar to those underpinning the IGT in humans (Winstanley and Clark, 2016), indicative of construct validity.
When trained on a cued variant of the rGT, in which rewards are accompanied with flashy lights and jingles inspired by those used in commercial gambling products, significantly more rats prefer risky options (Barrus and Winstanley, 2016; Ferland et al., 2019). This has been replicated in humans (Cherkasova et al., 2018; Spetch et al., 2020), indicating the rGT has predictive validity. Computational modelling of rodent data indicates cue-induced increase in risky choice is driven by greater insensitivity to punishment (Langdon et al., 2019), again matching decision-making biases in humans (Jean-Richard-Dit-Bressel et al., 2021, 2023). In previous work, rGT task variant (cued or uncued) has been a between-subjects variable, such that rats only experience one paradigm. The question of whether rats, like humans (Blanchard et al., 2000), also prefer a cued environment is impossible to determine with this experimental design. If rats find the frequent delivery of audiovisual stimuli aversive or stressful, and this stress subsequently guides decision-making, then increase in risky choice on the cued versus uncued rGT could result from very different neurobiological mechanisms, potentially irrelevant for our understanding of problem gambling.
We therefore developed a novel behavioural task, the choice rGT, to test the hypothesis that rats would prefer cued gambles. Similar to IGT analyses, we previously classified rats as optimal or risk-preferring based on their net preference for advantageous vs disadvantageous options (e.g. Ferland et al., 2019; Zeeb and Winstanley, 2011), with this decision score serving as a proxy for problematic gambling behaviour. However, it is possible that preference for cued games may be another, or better, predictor of addiction-relevant behaviours. Post-reinforcement pauses (PRPs) have also been reliably reported in humans and rodents when engaged in gambling games (Peters et al., 2010; Schreiber and Dixon, 2001), with longer PRPs associated with greater game enjoyment (Dixon et al., 2019). PRPs cannot be measured in the original rGT versions due to the way in which trials are initiated. We therefore examined whether classifying animals based on preference for the cued task vs decision score resulted in unique behavioural profiles in terms of task engagement, impulsivity and PRP magnitude.
Methodology
Subjects
Testing and housing procedures were in accordance with the standards of the Canadian Council of Animal Care, and all experimental protocols were approved by the Animal Care Committee of the University of British Columbia. The subjects of this experiment consisted of 32 male and 32 female Long Evans rats, obtained from Charles River Laboratories (St Constant, Quebec). Subjects were peer housed and the housing room was maintained at 21° Celsius on a 12-hour reverse light-dark cycle. All experiments took place during the dark cycle. Rats were weighed every day for 3 days prior to the start of the experiment in order to reduce handling stress. Rats were food-restricted to 85% of their free-feeding weight over 2 weeks prior to behavioural training, and then males were fed 14 g rat chow and females 9 g per day in addition to the sugar pellets earned in the task for the rest of the experiment. Water was always available ad libitum.
Apparatus
Choice rGT training and testing took place in a bank of 16 standard five-hole operant chambers. Each chamber was housed within a ventilated sound-attenuating cabinet. The left wall was fitted with a stimulus array consisting of five response apertures, each containing a stimulus light and fitted with an infrared beam to detect nose poke responses (Med Associates, St. Albans, VT). A food tray was located on the opposite wall, equipped with a tray light, and connected to a pellet dispenser holding sugar pellets (45 mg pellets, Bio-Serv, Flemington, NJ). A retractable lever was located on either side of the food tray. Each chamber was also equipped with a house light, centrally located on the right wall, and a multiple tone generator. Chambers were controlled by custom software written in Med-PC IV by CAW.
Behavioural testing
Training phases
Food-restricted rats were first habituated to the operant chamber for 30 min. During habituation, 2 sugar pellets were placed in each aperture, and 10 were placed in the food magazine. Rats were then trained on a modified version of the five-choice serial-reaction time task in which rats nose poked in one of four apertures, as indicated by 10 s illumination of hole 1, 2, 4, or 5 in a pseudo-random order. A nose poke within the 10 s illumination period resulted in the delivery of 1 sugar pellet. Each session lasted 30 min, or until 100 trials were reached. Subjects performed daily sessions until they met the criteria of ⩾50 correct response, ⩾80% accuracy, and ⩽20% omissions. All rats then underwent two sessions of lever training, one for each lever, during which one lever press corresponded to a one sugar pellet reward.
Following the completion of these training stages, the rats began training on forced choice variants of the choice rGT, depicted in Figure 1. The food tray illuminated at the start of each trial. A nose poke response at the food tray triggered presentation of the left or right lever. A lever-press response would trigger a cued or uncued rGT trial, and whether the right or left lever was assigned to the cued or uncued condition was kept constant for each rat throughout the experiment but counterbalanced across the cohort. Rats were first exposed to a series of training sessions in which only one lever was presented at the start of each trial (5 sessions each, cued or uncued) and only one aperture was illuminated, such that rats received equal exposure to all reinforcement contingencies (‘forced lever forced choice’ sessions). Rats were then allowed to choose freely between the four illuminated apertures, but only one lever was presented throughout the session, with this lever alternating each day (forced lever free choice). Rats received 30 such sessions in total, 15 cued, and 15 uncued rGT. After sessions 10 and 20, rats received a choice rGT probe trial, in which they could choose freely between the cued and uncued lever on each trial. Once all pre-training had been complete, rats were tested daily on the choice rGT until behavioural performance was statistically stable.
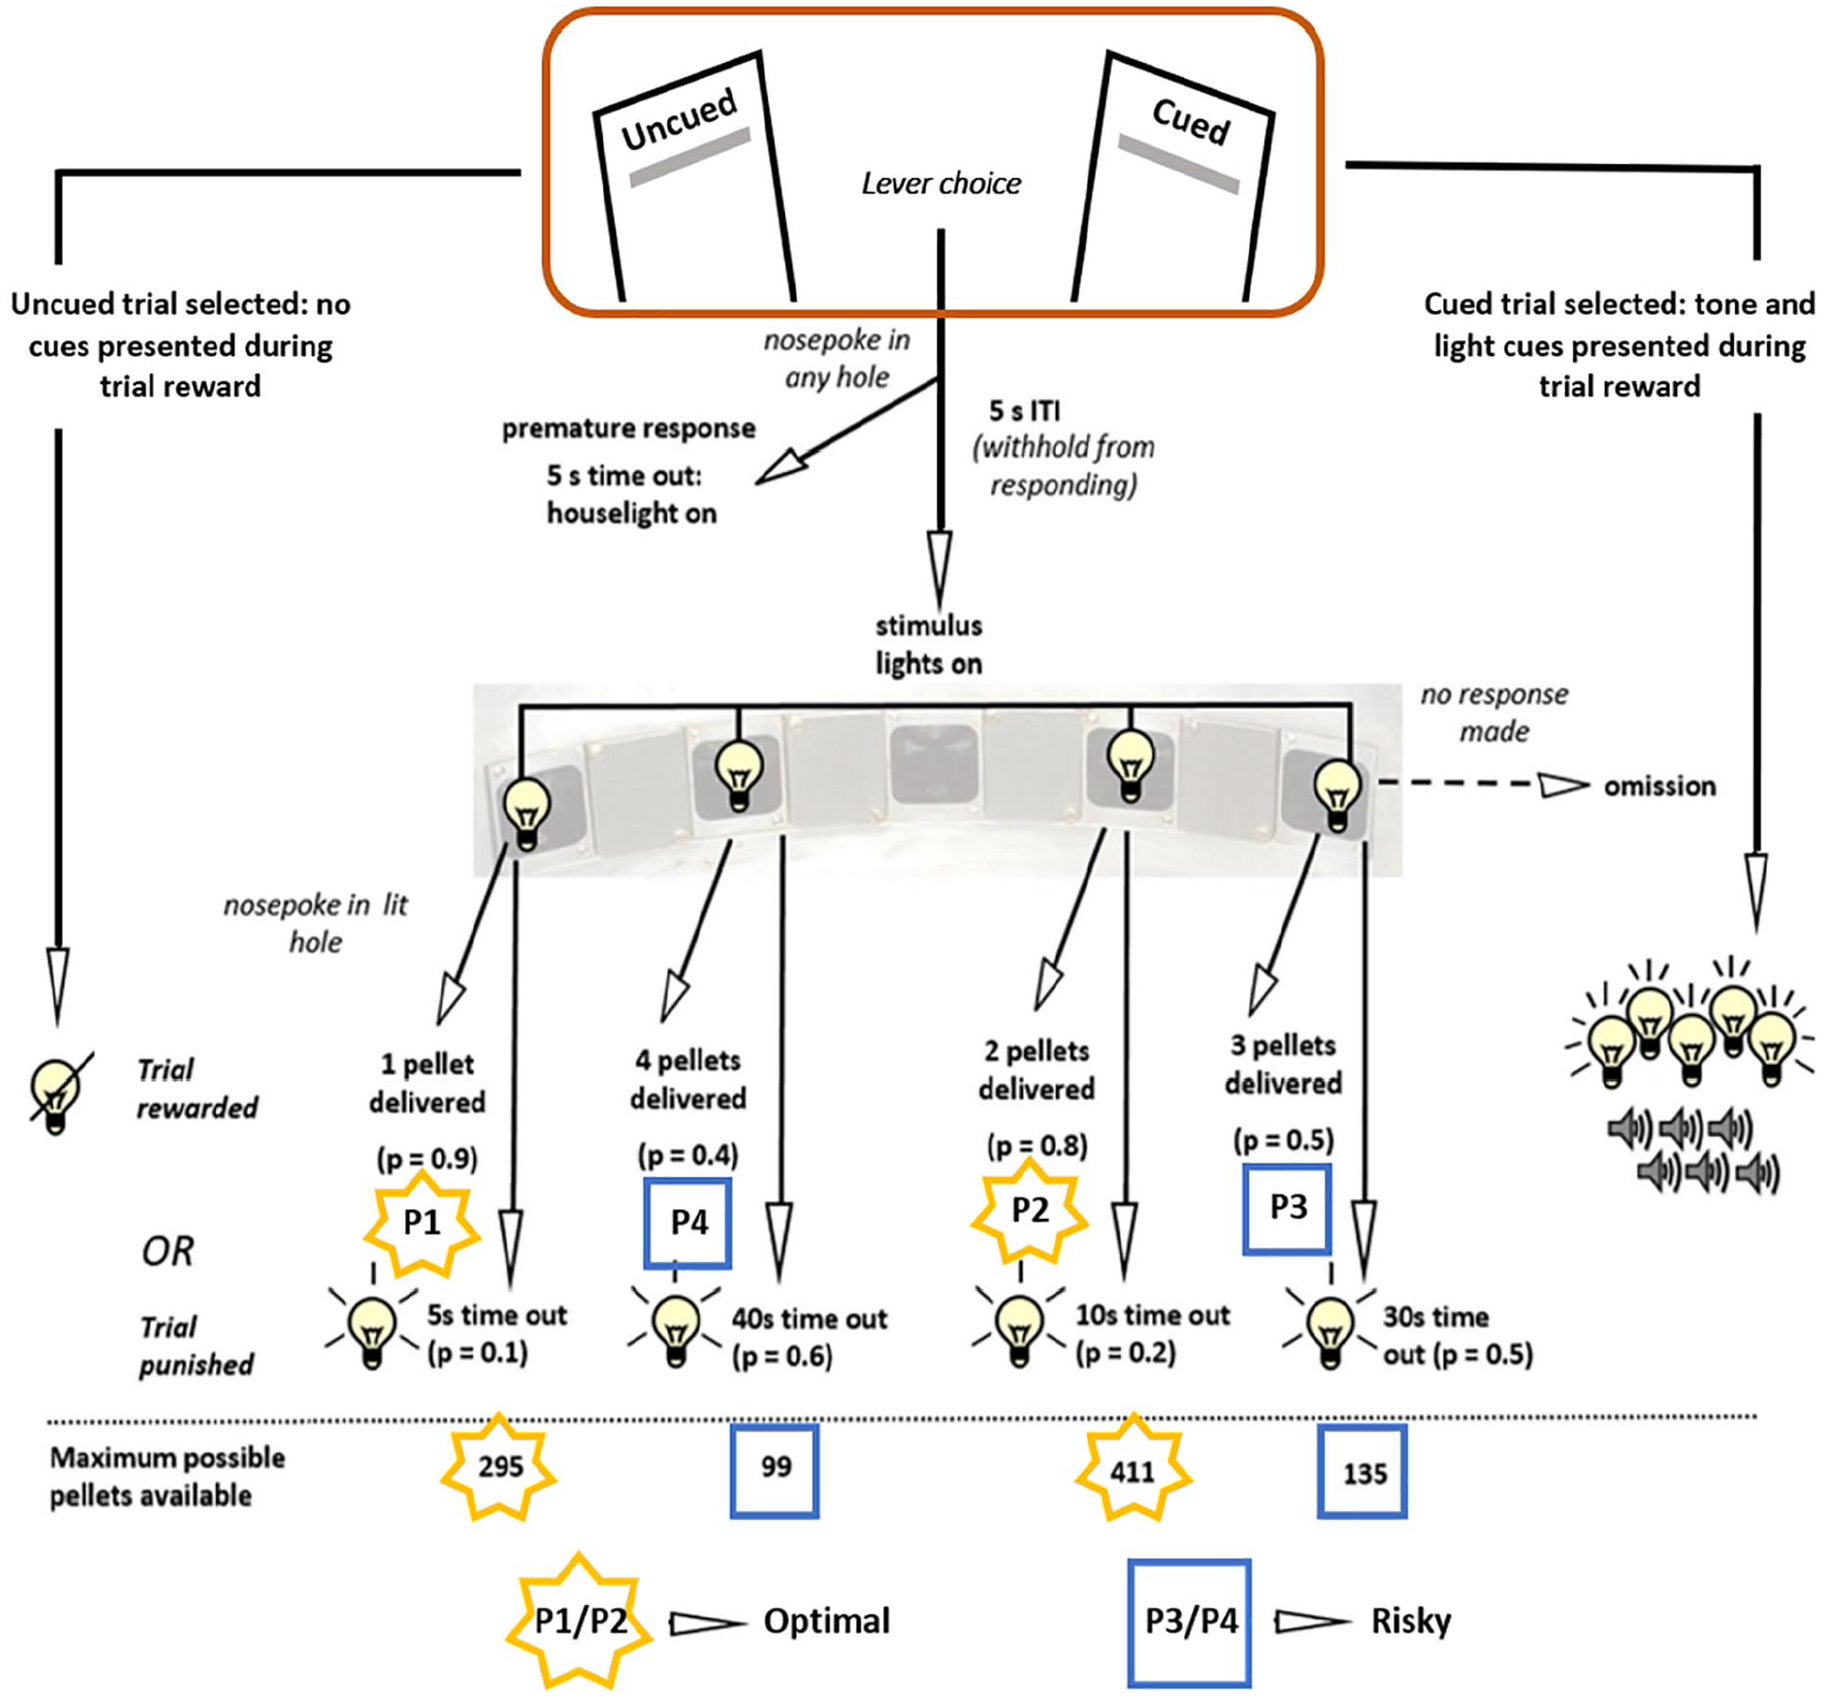
Schematic of the choice rat gambling task. Male (n = 32) and female (n = 32) Long Evans rats were trained on a novel version of the rGT, where on each trial the rat can select whether that trial will be a ‘uncued’ or ‘cued’ trial. On cued trials, a salient light and tone cue plays concurrent with reward delivery (if a reward rather than a timeout occurs) after the rat nose pokes to make a P-choice. On uncued trials, these audiovisual cues are absent. Reward contingencies for the P1-P4 options match those previously used in the separate uncued and cued versions of the rGT (Barrus and Winstanley, 2016; Zeeb et al., 2009). Choice for the cued/uncued lever and the response time to choose a lever (lever latency), indicated with a round-edged rectangular box, were the behavioural measures input into the diffusion model. Figure adated from Adams et al. (2017).
The choice rGT
A nose poke response in the illuminated food tray turned off the tray light and triggered presentation of the left and right lever, thereby allowing rats to choose on a trial-by-trial basis to perform either the cued or uncued rGT. A lever-press response triggered the start of an rGT trial, identical in structure to that previously published. After a 5 s intertrial interval (ITI), apertures 1, 2, 4, and 5 were all illuminated for 10 s. A nose poke at one of the illuminated response holes was either rewarded with sugar pellets or punished with a time-out penalty as per the reinforcement schedule associated with that aperture (see Figure 1, P1–P4; 1–4 sugar pellets, 0.9–0.4 probability of reward, 5–40 s time-out duration). Punished responses triggered the light inside the chosen aperture to flash at 0.5 Hz throughout the time-out period, and any responses made during this time had no programmed consequences. At the end of the time-out, the food tray was illuminated, signalling the rat could initiate the next trial. Rewarded responses initiated the delivery of pellets in the food tray and were accompanied by concurrent 2 s tone/light cues on cued rGT trials. The complexity and variability of these sensory cues scaled with reward size (single tone and illumination of aperture for P1 cue, multiple tones and four patterns of flashing lights for P4 cue). Reward collection triggered the start of the next trial.
The most optimal selection was P2 followed by P1, due to the relatively high probability of reward and low probability of shorter time-outs. In contrast, selection of P3 and P4 were classified as risky choices due to the larger but less likely per-trial gains and longer, more frequent time-outs. The theoretical maximum number of pellets available per session following exclusive choice of each option, assuming constant choice and collection latencies, and no premature or omitted trials, are P1: 295; P2: 411; P3: 135; P4: 99. Side bias was prevented by counterbalancing the P1–P4 aperture array such that half the subjects performed version A or version B (left to right – A: P1, P4, P2, P3; B: P4, P1, P3, P2).
If the rat failed to respond on either lever within 10 s, the trial was scored as a lever omission. Both levers retracted, and the tray light was once again illuminated signalling the rat could initiate the next trial. If the rat responded at the nose poke array during the 5 s ITI, a premature response was recorded. The house light was illuminated for 5 s during which responses had no programmed consequences, after which the rat could initiate a new trial by responding at the illuminated food tray. If the rat failed to respond in any illuminated aperture within 10 s, the trial was scored as a P-choice omission. All response apertures went dark and a nose poke response was required at the illuminated food tray to trigger the next trial.
Analysis of variance (ANOVA) confirmed stable baseline performance for all variables across the final five test sessions (no significant effects of the within-subjects variable ‘session’). All male rats reached stability by session 24, and females by session 44.
Computational modelling
The diffusion model was fit to behavioural data from the choice rGT using fast-dm-30.2 (Voss and Voss, 2007, 2008; Voss et al., 2010). The diffusion model is a model of two-choice decision making that uses both choice and response time (RT) data to separate different cognitive processes that together contribute towards decision making. The model posits that decision making begins at a particular point – the decision starting point (zr) – between two boundaries (a) which each correspond to one of the two choices. The decision process proceeds towards a boundary with a rate denoted by the drift rate (v), and once one or other boundary is crossed a decision for that choice is made. The total RT is made up of evidence accumulation for the decision, and a factor that incorporates aspects unrelated to the decision process, such as sensory and motor processing and other extraneous elements – the non-decision time (t0). The relative values of these four main parameters provide information about how specific aspects of the decision-making process differ between individuals.
Lever choice, corresponding to selection of a uncued or cued trial, and RTs for these choices were input to the model. Figure 1 shows the task structure, and which behavioural measures from the task were used for modelling. Fast-dm calculates predictive cumulative distribution functions (CDFs) for choices and RTs, and then uses a partial differentiation equation solver to model the evolution of the probability distribution forward in time. Parameters are optimised by using an implementation of the Nelder-Mead method (Nelder and Mead, 1965). Further details about diffusion modelling using fast-dm can be found by Voss et al. (2015). Multiple models were tested using different combinations of parameters, and were fit to all trials in which a lever choice was made, to identify the parameter combination that produced best model fits. Validation of this best fitting model was carried out on behavioural data from the final five stable sessions for all rats (n = 64). Data from individual rats and sessions were modelled separately. As carried out previously (Hales et al., 2016, 2017, 2024), and following recommendations given in Voss et al. (2015), model fit was assessed using Kolmogorov–Smirnov (KS) test statistics output by fast-dm-30.2. The KS test statistic is the maximum absolute vertical distance between the empirical and the predicted CDFs of the RT distributions. For multiple trials in a task, n, it is computed as:

where
Descriptive statistics for rGT behavioural data used for computational modelling.
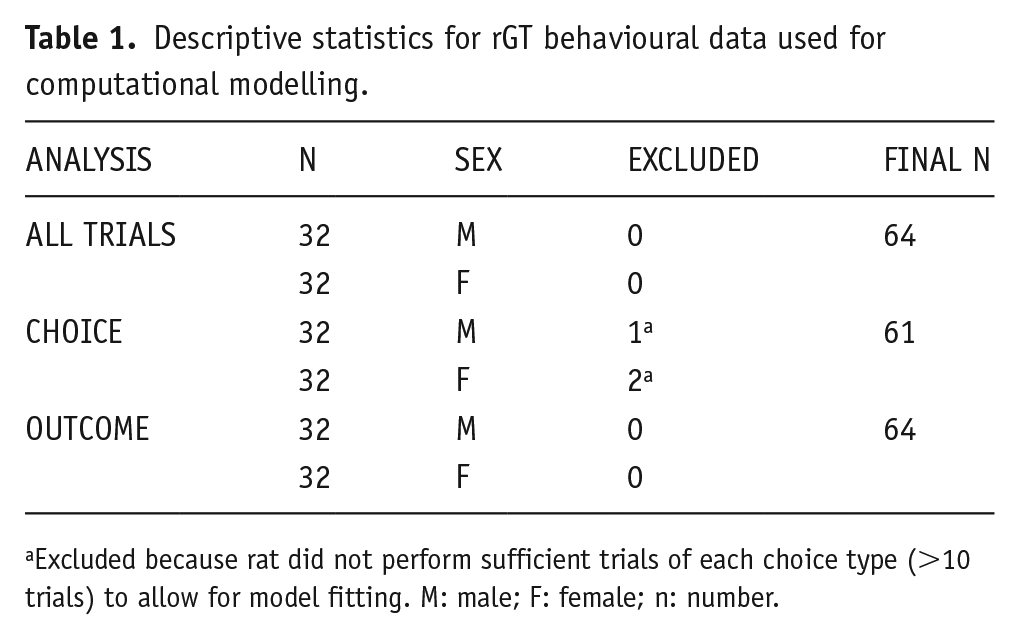
Excluded because rat did not perform sufficient trials of each choice type (>10 trials) to allow for model fitting. M: male; F: female; n: number.
The parameter combination that produced the best model fit was selected and used to model the behavioural data. All parameters combinations tested, along with average KS test statistics for that parameter combination are listed in Table 2. This best fitting model had six parameters: starting point (zr), boundary separation (a), drift rate (v), non-decision RT (t0), the difference in speed of response execution between the two responses (d), and the variability in the starting point (szr). The other parameters that can be fit within fast-dm-30.2: variability in drift rate (sv), variability in non-decision RT (st0) and percentage of contaminants (p); were set to 0. To ensure this parameter combination adequately explained behavioural data, model parameter recovery was carried out using the construct-samples tool in fast-dm. This function allows for simulation of behavioural data using specific parameter combinations found through model fitting for each individual rat. Simulations were run for the final five stable sessions for all rats using the average number of trials completed for those sessions. Simulated data values for lever choices and lever latencies were then averaged, and compared to averaged behavioural data for those same five sessions (Supplementary Figure S2). For both measures, simulated model datapoints and actual behavioural datapoints lie close to the main diagonal, indicating good model fit.
Parameter combinations tested for model fitting.
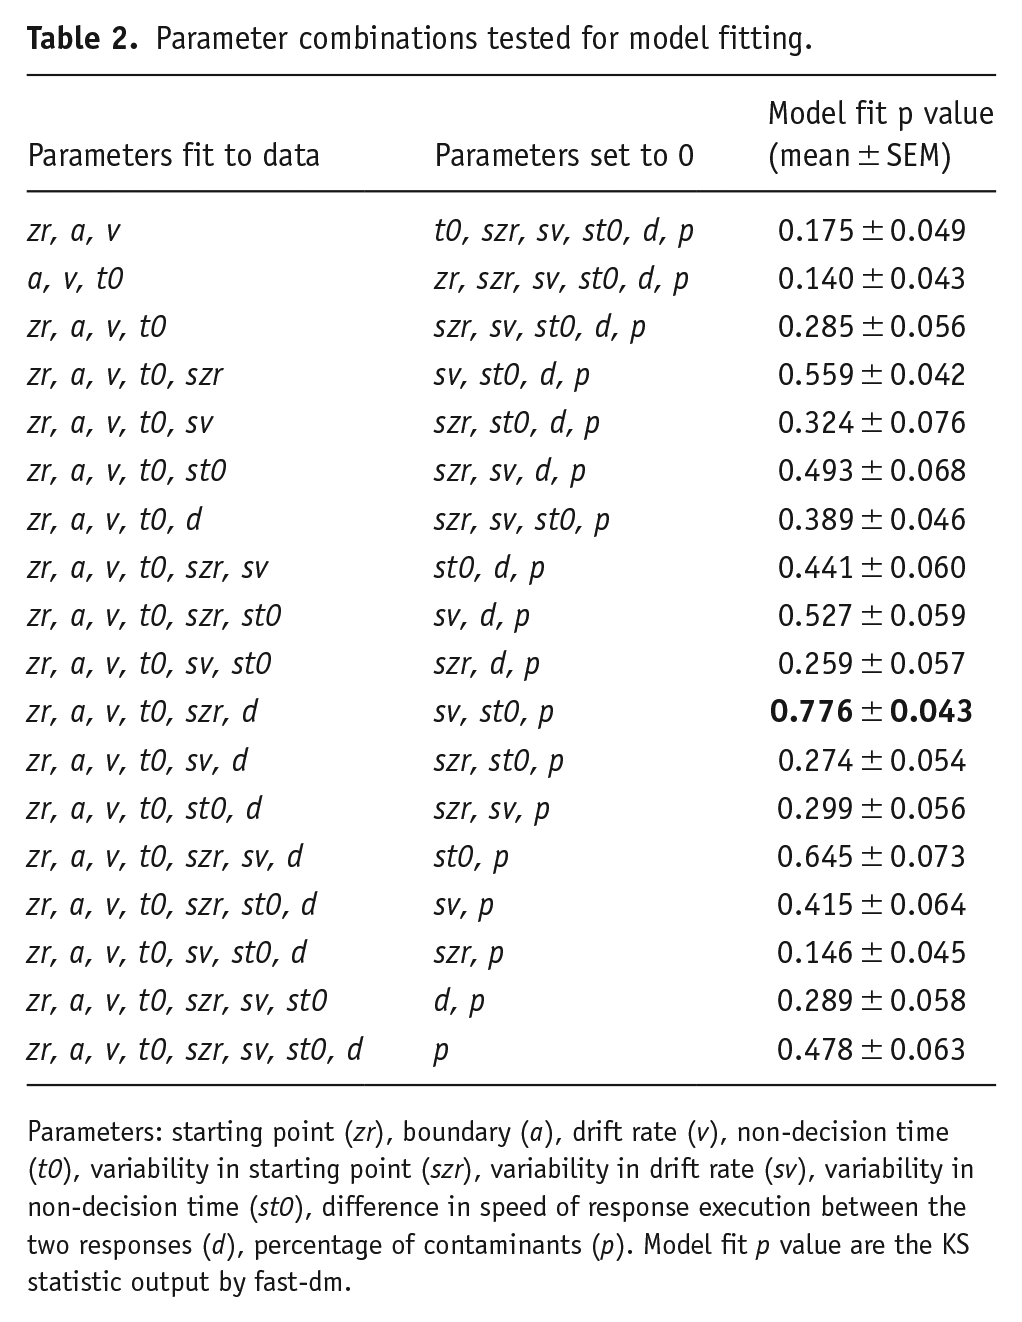
Parameters: starting point (zr), boundary (a), drift rate (v), non-decision time (t0), variability in starting point (szr), variability in drift rate (sv), variability in non-decision time (st0), difference in speed of response execution between the two responses (d), percentage of contaminants (p). Model fit p value are the KS statistic output by fast-dm.
For the first analysis all six parameters (zr, a, v, t0, d and szr) were fit to all trials within a session (all trials condition). For the choice analysis, all parameters except d and szr were fit to trials split by whether the rat proceeded to make an optimal choice (defined as either a P1 or P2 choice) or a risky choice (a P3 or P4 choice). The outcome analysis was the same, except for trials were split by whether the rat went on to make a valid P choice (P1, P2, P3 or P4), or made a premature response. For both the choice and outcome conditions, trials for the five consecutive stable baseline sessions were combined for each individual rat to allow sufficient trial numbers for model fitting. In the model, the upper boundary represents a decision for a cued trial, while the lower boundary represents a decision for an uncued trial.
Statistical analyses
All statistical analyses were conducted using SPSS 28.0.0.0 for Windows (IBM SPSS Statistics), and all graphs produced using GraphPad Prism 10.4.0 for Windows (GraphPad Software, USA). All data are expressed as mean ± Standard Error of the Mean (SEM). Differences were considered significant where p < 0.05; trend level differences where p ⩽ 0.07 are also reported.
Behavioural variables
Primary dependent variables of interest were score [(P1 + P2) – (P3 + P4)], which provides an overall index of how optimal versus risky decision-making was during a given session, and percent cued trials chosen, corresponding to preference for cues (number of cued trials chosen/total lever choices × 100, calculated for free choice sessions only). Percentage of premature responses (number of premature responses/total number of trials × 100) provided an index of motor impulsivity. We also calculated and analysed lever omissions (number of lever omissions/total number of lever choices × 100) and P-choice omissions (number of P-choice omissions/total number of P-choices × 100) which can provide indirect evidence of task engagement. The average latency to choose a P-choice, and average latency to collect a reward were also analysed and likewise provide secondary confirmation of motivation and response vigour. The average latency to initiate a lever press was also analysed for similar reasons, and to assess whether rats showed evidence of the stereotypical slowing in trial initiation times after a winning outcome that has been observed in other laboratory-based assessments of gambling behaviour in both humans, rats, and pigeons: PRPs.
Data from forced lever sessions, (in which only one lever was presented during the session, so all trials were either cued or uncued) and free choice sessions (in which rats could freely select between cued and uncued trials) were analysed separately. We wanted to evaluate data across multiple weeks, but outside of the test for statistical stability (see above), we were not concerned with session-by-session variability. All measures were therefore calculated for each rat for each session, and then for forced lever sessions were averaged across blocks of five sessions, and for free choice sessions were averaged across five sessions per week for analysis.
Categorising rats based on task-preference (cued vs uncued)
We used an unsupervised clustering approach to determine in an unbiased way whether individual preference for cued vs uncued trials parsed animals into different groups. K-means clustering (using the k-means function in MATLAB) was carried out using data from the final five, statistically stable choice rGT sessions. Data were averaged across session to reduce the effect of individual variation across sessions within the clustering approach. Behavioural measures (% cued trials chosen, % lever omissions and % premature responses) and model parameters (drift rate, starting point, boundary, and non-decision time) were included. Decision score was deliberately excluded from the parameters entered into the k-clustering algorithm. When included, this factor dominated rats’ assignment into clusters so strongly that animals were effectively classified as optimal or risk-preferring, similar to typical rGT analyses. This undermined the purpose of the current analysis, which was to investigate how task performance varied as a function of preference for cued trials. The optimal number of clusters was determined using the evalclusters function in MATLAB, with the Silhouette value as a criterion, and confirmed using evalclusters with the gap value criterion. This approach parsed rats into three distinct groups based on their task-preference. We describe these groups as cue-preferring (CP), neutral preference (NP) and uncued-preferring (UP; see Table 3 for descriptive statistics of the numbers of rats in each group). Preference for the cued rGT per group is shown in Figure 4(a) (CP > 70% trials, NP 45-70%, UP < 45%).
Descriptive statistics for task-preference in the choice rGT.

Categorisation of rats based on degree of risk-preference
As per previous reports (e.g. Ferland et al., 2019; Zeeb and Winstanley, 2011), decision scores were calculated for each rat based on the final five stable acquisition sessions as follows: choice of [(P1 + P2)–(P3 + P4)]. Rats with positive scores were classified as optimal, while rats with negative scores were classified as risky.
Switch scores
To investigate whether rats generalised across cued and uncued ‘forced lever free choice sessions’ during learning, we performed a custom trial-by-trial analysis using the first and last 10 trials of each cued and uncued session. If the rat made an optimal (P1 or P2) choice, the trial was scored as +1, and as −1 if the rat made a risky choice (P3 or P4). These trial scores were then summed, giving a value between -10 and 10, whereby −10 corresponds to consistent risky choices, +10 to exclusively optimal choices, and 0 corresponds to an equal mix of optimal and risky. We then carried out the following comparisons by taking the difference between the two scores for the following options:
End of cued session vs start of following uncued session (incongruent)
End of uncued session vs start of following cued session (incongruent)
End of cued session vs start of the following cued session (congruent)
End of uncued session vs start of the following uncued session (congruent)
These difference scores were then made absolute to make them agnostic to whether choice became more risk or optimal, and summed for each rat over all forced lever sessions to create an overall ‘switch score’. Higher scores indicate a more pronounced switching of choice strategy between the end of one session and the start of another. If rats’ decision-making is sensitive to the presence/absence of cues during this training stage, then incongruent switch scores should be greater than congruent. Conversely, if rats are generalising across cue conditions, incongruent and congruent switch scores should be similar.
PRPs
The average lever choice latency was calculated based on the previous trial outcome:
Any win (a rewarded P-choice) compared to any loss (a non-rewarded P-choice)
Wins compared to losses parsed by whether the animal had chosen a cued vs uncued trial
Wins compared to losses parsed by whether the animal had made an optimal (P1, P2) or risky (P3, P4) choice
Data from the final five consecutive stable baseline sessions were combined for each individual rat to maximise the chances that sufficient choices of each option were present. Nevertheless, data from one optimal male and one risky female were excluded due to a lack of data for risky or optimal wins, respectively (final n = 62).
Behavioural data analyses
Data from free choice rGT sessions were analysed by repeated measures ANOVA using week (5 levels: weeks 1 to 5) and task type (2 levels: cued or uncued; this factor was omitted for analyses of % cued trials chosen and % lever omissions as these data cannot be parsed by task type) as within-subjects factors, and sex (2 levels: male or female) as a between-subjects factor. Either risk-preference (2 levels: risky, optimal) or task-preference (3 levels: CP, NP, UP) were also included as between-subjects factors, in order to independently examine the behavioural pattern associated with each categorisation approach. For forced lever sessions, data analysis followed a similar structure, except only 15 sessions of data per task type were available, which were grouped into three blocks each containing five sessions (to match the analysis for free choice sessions). To meet normality assumptions, data were transformed for analyses as appropriate: behavioural variables expressed as percentages were arcsine transformed. Untransformed data are graphed for clarity. Following significant main effects or interactions, one-way ANOVAs, paired t-tests or independent samples t-tests were performed as post hoc tests as appropriate. Huynh–Feldt corrections were used to adjust for violations of the sphericity assumption, and the Bonferroni correction was applied for multiple pairwise comparisons.
To investigate whether PRPs were present and/or modified by win-paired cues or reward magnitude, paired-sample t-tests were conducted to compare lever choice latency after wins vs losses, cued wins vs uncued wins, and optimal versus risky wins. Repeated measures ANOVA were then conducted with previous outcome (win or loss for analysis 1; cued win, uncued win, cued loss or uncued loss for analysis 2; optimal win, risky win or loss for analysis 3) as a within-subjects factor, and sex as a between-subjects factor. Either task-preference or risk-preference were included as an additional between-subjects factor, as per other behavioural analyses.
Computational modelling data analysis
For analysis of data from all trials, the model was fit separately to the final five stable sessions for individual rats, and then parameter values were averaged across these five sessions to match the analysis for the behavioural data. Model parameters were analysed by two-way ANOVAs with sex and task-preference/risk-preference as between-subjects factors. Mixed ANOVAs with choice/outcome (optimal P1/P2 vs risky P3/P4 choice/valid choice vs premature response) as the within-subjects factor, sex and task-preference/risk-preference as between-subjects factors were used for the choice and outcome analyses.
Results
Behavioural performance during interleaved cued or uncued rGT sessions (forced lever free choice)
On cued sessions, rats completed more trials, were quicker to choose a lever and collect rewards, and made fewer lever omissions (task type -trials completed: F1,62 = 6.600, p = 0.013, block 1 vs 2 and 3: ps < 0.002; -lever latency: F1,62 = 13.557, p < 0.001; -collection latency: F1,62 = 30.290, p < 0.001; -lever omissions: F1,62 = 18.120, p < 0.001, Supplemental Figure 1). Females appeared most sensitive to the presence vs absence of cues on reward collection latency as training continued, becoming slower to collect uncued rewards and faster when cues were present (task type*sex*block: F2,124 = 4.874, p = 0.009; Supplementary Figure 1(f)). Decision score increased across sessions, but this did not vary across task type (block: F1.476,91.517 = 6.099, p = 0.007, block*task type: F1.754,106.974 = 2.582, p = 0.087, Supplementary Figure 1). As expected, animals completed more trials, while lever latencies, P-choice latencies, premature responses, and lever omissions decreased as training progressed, and this was similar across both task types (block: all Fs > 3.522, all ps < 0.043; block*task type: all Fs < 1.930, all ps > 0.157; full statistics for each behavioural measure in Supplemental Figure 1 legend). Across both task types, males were slower to make P-choices and made fewer premature responses (sex -P-choice latency: F1,62 = 9.842, p = 0.003; -premature responding: F1,62 = 15.066, p < 0.001; Supplemental Figure 1). There were no other main effects or interactions including sex for any other behavioural measures.
Previous reports have repeatedly shown that levels of risky choice, as indicated by negative decision scores, are greater in rats trained on the cued rGT as compared to those trained on the uncued task. However, whether animals would form different preferences for the risky vs safe options across task variant when the same animals were trained on the cued and uncued version pseudo-concurrently was uncertain, and would arguably depend on how readily animals generalised what they learned under one cue condition to the other. We therefore calculated a ‘switch score’ to determine how similar the decision score was as calculated from the first 10 trials of each session (sx) compared to the last 10 trials of the preceding congruent (same cue condition; sx-2) or incongruent session (different cue condition, sx-1).
Switch scores generally declined with training, suggesting choice became more homogeneous across sessions as animals learned the task (block: F2,124 = 43.903, p < 0.001; Figure 2(a)). As training progressed, congruent and incongruent switch scores diverged, and became significantly different from block 2 (congruency*block: F2,124 = 10.127, p < 0.001; Figure 2(a)). However, this difference was not large in magnitude. In order to confirm whether this represented a meaningful discrimination between cued and uncued sessions, we calculated switch scores in the same way, over the first 10 sessions, from a similar number of rats (n = 32 males, n = 32 females) that learned either the cued or uncued rGT (n = 64 per task). These subjects were drawn at random from our large archival database of over 800 rats. Mean switch values in the choice rGT were comparable to those in the cued rGT, but were significantly higher than for the uncued rGT (group: F3,252 = 3.055, p = 0.029, uncued vs congruent: p = 0.016, uncued vs incongruent: p = 0.051, uncued vs cued: p = 0.006; Figure 2(b)). It would therefore appear that on the choice rGT, learning across successive cued and uncued sessions is comparable to that seen over consecutive sessions on the cued rGT, suggesting there is considerable generalisation between the cued and uncued conditions. However, training in the complete absence of reward-paired cues encouraged more continuous learning across sequential sessions.

Switch scores during the forced lever stage of the choice rat gambling task. (a) During forced lever training where on each session only one task type is experienced, rats switch how often they choose optimal/risky choices more between sessions of different types (incongruent: cued-uncued or uncued-cued) than the same session types (congruent: cued-cued or uncued-uncued). Rats also switch less by block 3 of training. Switching was similar between male and female rats. (b) Switch scores on the choice rGT are not different from the cued rGT, but are higher than switch scores on the uncued rGT. Data shown are mean ± SEM, with individual datapoints overlaid on (b).
Behavioural performance of choice rGT
Comparison of behaviour on cued and uncued trials
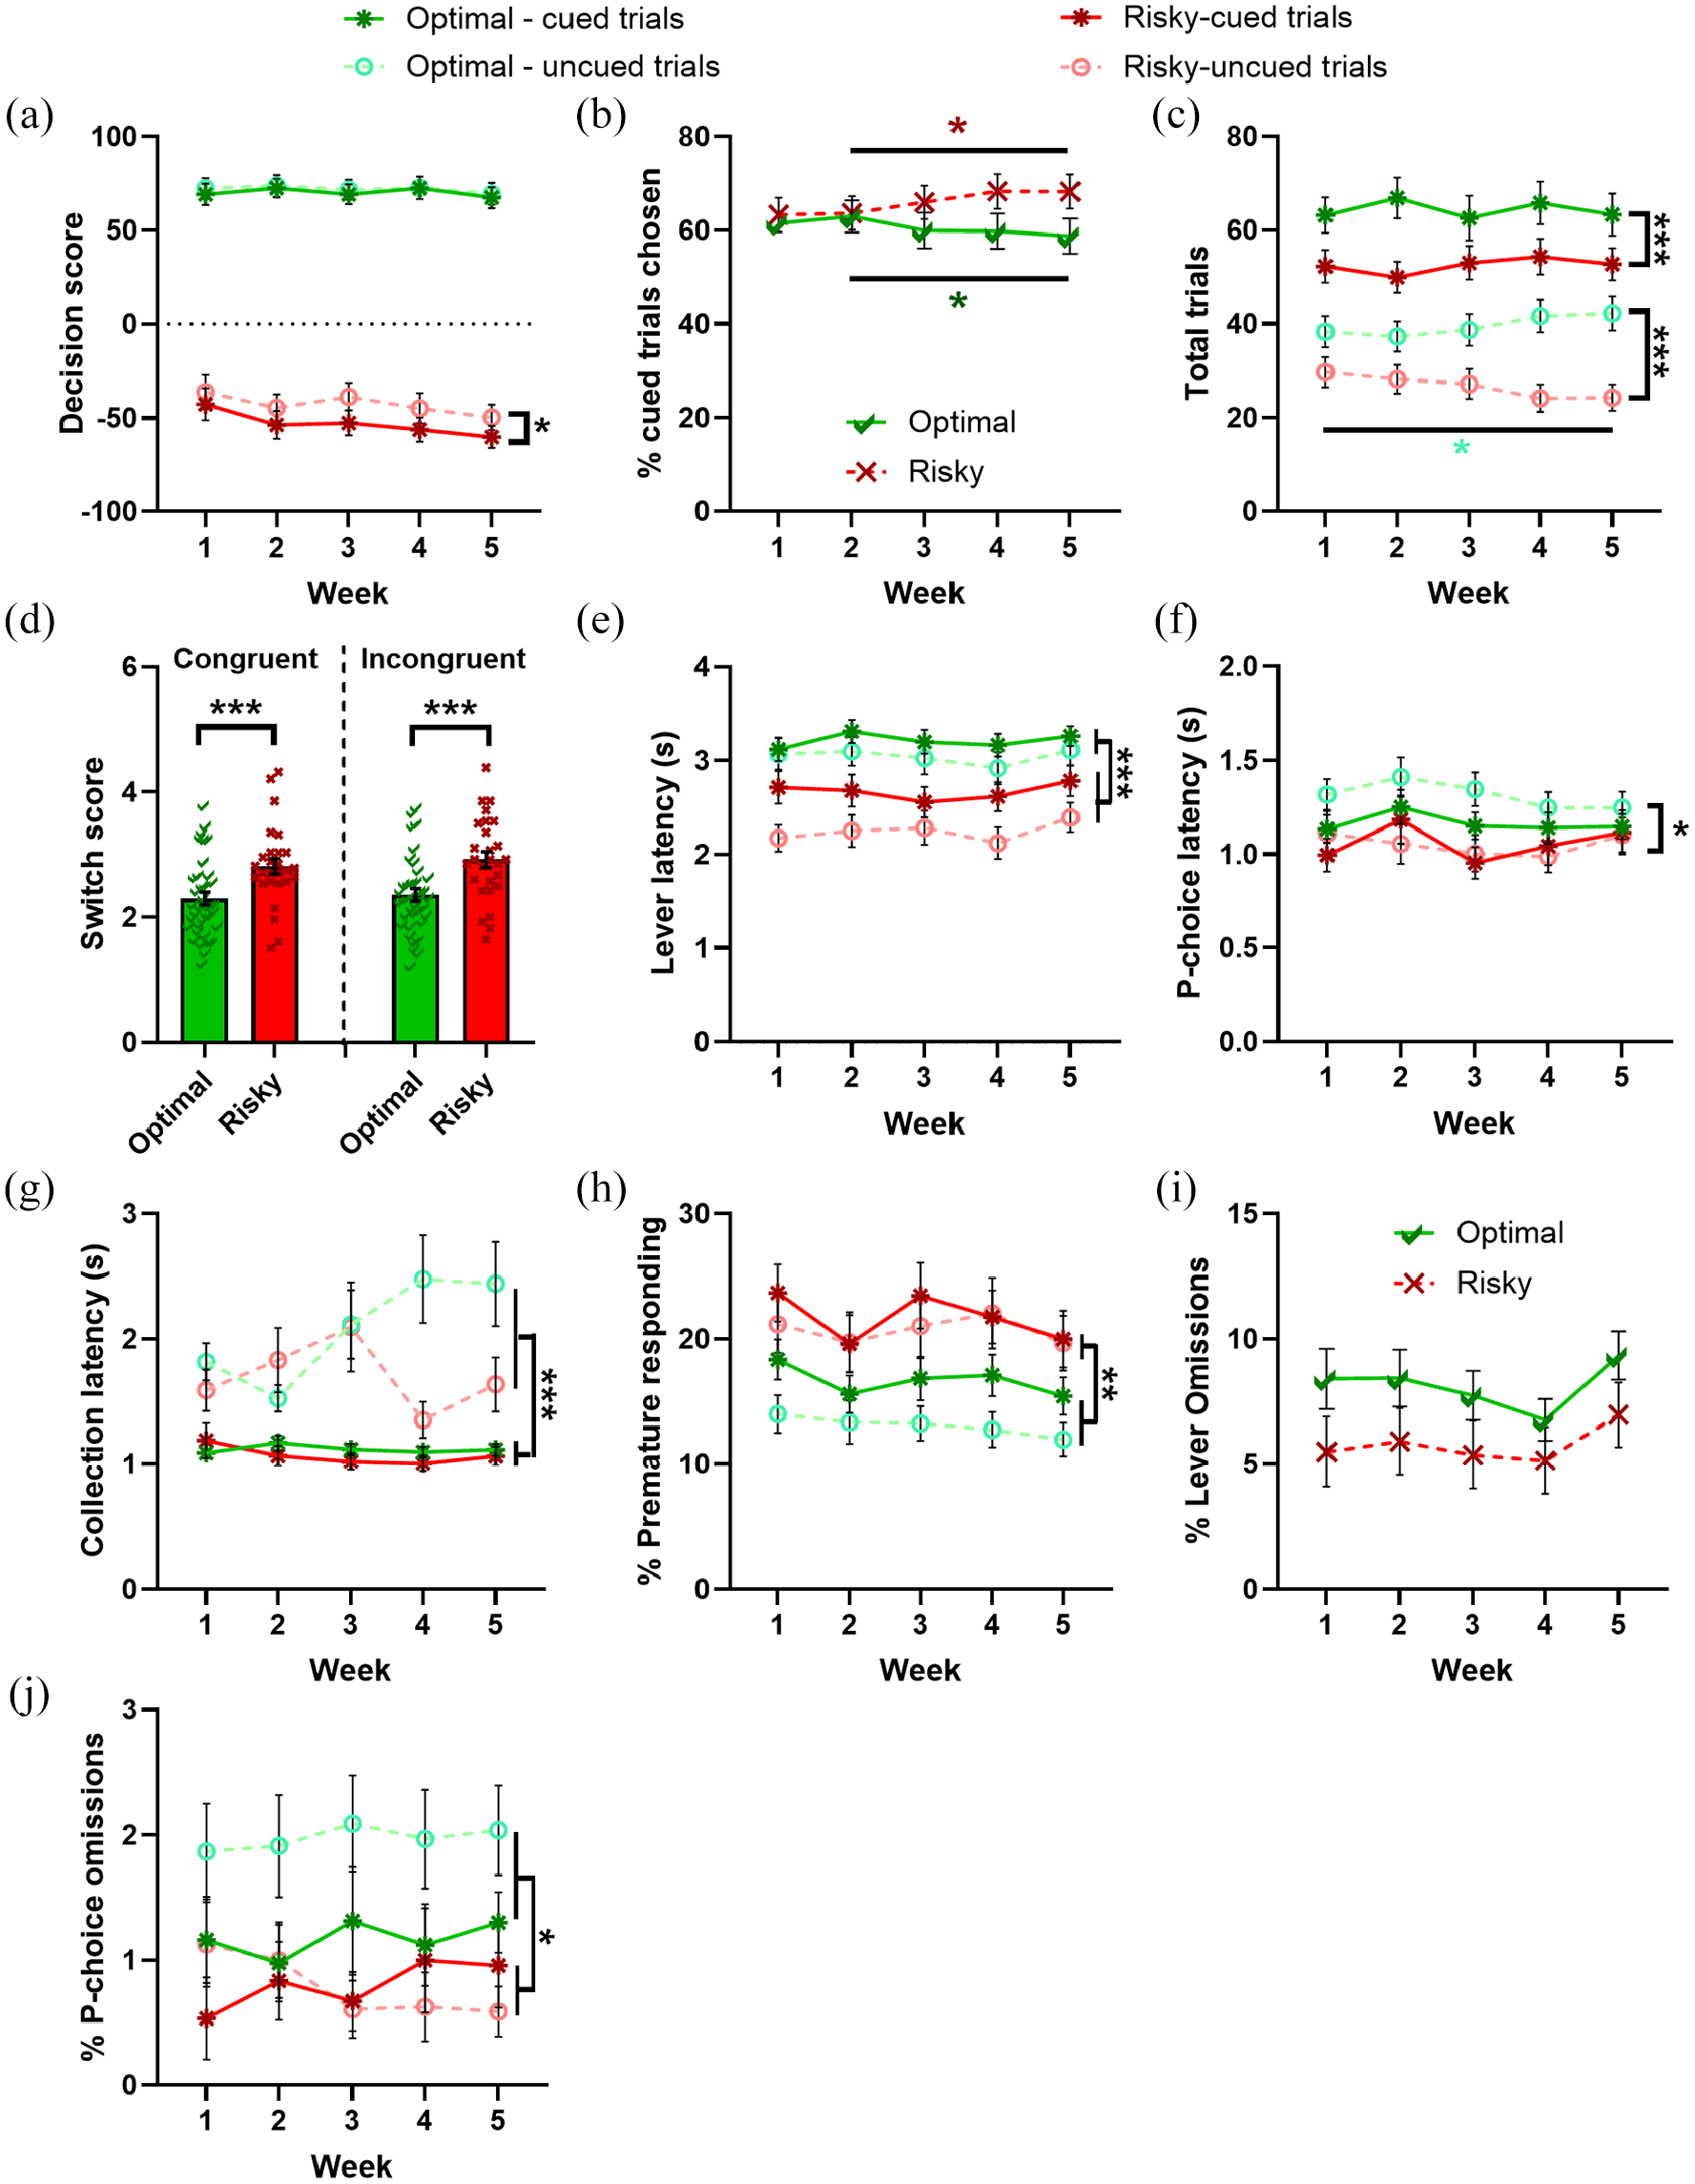
Decision score tended to be lower on cued vs uncued trials, indicative of slightly greater risky choice (F2,244 = 3.643, p = 0.061; Figure 3(a)). In general, the decision score from cued and uncued trials was strongly inter-correlated, such that most rats showed comparable levels of risky choice regardless of task type (Pearson correlation coefficient: r62 = 0.898, p < 0.001; Figure 3(b)).

Comparison of behaviour on cued and uncued task types. (a) Rats have a tendency towards picking more risky options on cued trials. (b) Most rats are similarly risky across uncued and cued trials. (c) Rats complete more cued than uncued trials. (d) Lever latencies get longer towards the end of training. (e) Rats are quicker to select a P-choice on cued trials, and (f) quicker to collect reward. (g) Premature responses are higher on cued trials, and decrease across training. (h) Rats make very few P-choice omissions, and this is stable across weeks. (i) Lever omissions increase at the end of training. (a, c–i) Data shown are mean ± SEM. #p = 0.061.
However, this does not mean that animals treated cued and uncued trials as equivalent. Rats completed more cued than uncued trials (task type: F1,58 = 67.526, p < 0.001; Figure 3(c)). Metrics of response vigour were uniformly higher on cued trials: animals made significantly more premature responses, and were faster to both choose between P1 P4 and to collect rewards (task type- premature: F1,58 = 9.801, p = 0.003;–P-choice latency: F1,58 = 6.393, p = 0.014;–reward collection latency: F1,58 = 50.078, p < 0.001; Figure 3(e)–(g)). As is typical for the rGT, levels of P-choice omissions were uniformly low across both cued and uncued trials (task type: F1,58 = 2.038, p = 0.159; Figure 3(h)). Premature responses dropped progressively across training, yet lever choice latency and lever omissions increased at the end of testing (week- premature: F3.621,209.993 = 3.714, p = 0.008;–lever choice latency: F3.268,189.258 = 3.889, p = 0.008;–lever choice omissions: F3.154,182.904 = 6.860, p < 0.001; Figure 3(d/g/i)).
Effect of preference for cued task
Unsupervised k-clustering resulted in the classification of animals into three groups which differed significantly in their preference for the cued task (task-preference: F2,58 = 140.476, p < 0.001; see Table 3 for cluster size). We labelled these clusters as cued-preferring (CP), those showing a neutral preference (NP) or uncued-preferring (UP). As training continued, preferences became more pronounced in the CP and UP group, whereas NP rats maintained a relatively weak bias towards the cued task across all sessions (week*task-preference: F4.339,112.050 = 4.136, p = 0.003; Figure 4(a)).

Effect of task preference I (a) Clustering revealed three distinct groups for preference in choice of cued trials. Cue preferring (CP) and uncued preferring (UP) rats increase their choice of their preferred task type across training. (b) Decision scores are not different between cue-preferring groups. (c) Switch score does not differ by cue preference. (d) Total trials completed increases for CP rats on cued trials over training, but decrease for UP rats, and vice versa for uncued trials. (e) CP rats are slower to choose cued trials. Overall, lever latencies are slower for uncued trials than cued trials, and UP rats are slowest on both task types. (f) Collection latencies were slower on uncued trials, with high CP rats being quickest to collect reward on both task types. CP: cue preferring; NP: neutral preference, UP: uncued preferring.
We did not observe any effect of task-preference on decision score (F2,58 = 0.296, p = 0.745, Figure 4(b)), suggesting that the degree to which rats preferred the cued task was independent from the degree of risky decision-making they exhibited. Switch scores calculated from the cued lever free choice sessions did not vary by group (task-preference: F2,61 = 0.323, p = 0.725; Figure 4(c)), suggesting how much rats altered their choice strategies between session types did not predict task-preference.
Total trials scaled as expected with cue preference. CP rats performed most cued trials and fewest uncued trials, with the opposite pattern for UP rats, and this became more pronounced across weeks (week*task type*task-preference: F4.591,133.141 = 2.811, p = 0.022; Figure 4(d)).
Perhaps surprisingly, rats with the strongest preference for the cued task were significantly slower to initiate a cued vs uncued trial (lever press latency -task type*task-preference: F2,58 = 3.461, p = 0.038; -task type: CP: F1,27 = 9.045, p = 0.006, NP: F1,21 = 0.452, p = 0.509, UP: F1,13 = 1.299, p = 0.275; Figure 4(e)). Although all rats collected cued rewards more quickly, CP rats were faster to collect reward on both task types (task-preference: F2,58 = 4.825, p = 0.018; CP vs NP: p = 0.050, CP vs UP: p = 0.009; task-preference*task type: F2,58 = 0.937, p = 0.397; Figure 4(f)).
Conversely, rats that preferred the uncued task were significantly slower to respond on either lever to initiate a trial (task-preference: F2,58 = 4.175, p = 0.020; CP vs UP: p = 0.003, NP vs UP: p = 0.020; Figure 4(e)). UP rats also made significantly fewer premature responses on uncued trials, suggesting these rats were significantly less impulsive than CP rats when cues were not present (task-preference*task type: F2,58 = 3.001, p = 0.057; CP vs UP, uncued trials: p = 0.042; Figure 5(b)). P-choice latency, lever choice omissions, and P-choice omissions did not vary by task-preference (task-preference, task-preference*task type: all F’s < 3.146, p’s > 0.081; Figure 5(a/c/d)).

Effect of task preference II (a) There is no difference in P-choice latency between groups. (b) More premature responses are made on cued trials, driven by UP rats. On uncued trials, CP rats make more premature responses than UP rats. (c) Lever omissions were variable across weeks for the different groups. (d) CP rats make more P-choice omissions on uncued trials. CP: cue preferring; NP: neutral preference; UP: uncued preferring.
Effect of preference for optimal/risky choices
As is common for analysis of the cued and uncued versions of the task, we also analysed behavioural measures based on rat’s preference for optimal or risky choices. Positive decision scores indicate a net preference for the optimal (P1/P2) choices, while risky rats prefer P3/P4 and have a negative decision score.
Risky rats tended to make riskier choices on cued trials compared to uncued trials (risk-preference*task type: F2.840,176.097 = 2.440, p = 0.069; risky rats only: cued vs uncued: p = 0.022; Figure 6(a)). Risky rats also chose cued trials more as training progressed (week*risk-preference: F1.958,121.386 = 4.659, p = 0.012; optimal rats: weeks 2 vs 3/4/5: ps < 0.049; risky rats: weeks 2 vs 4/5: ps < 0.036; Figure 6(b)).
Effect of risk preference on behavioural measures (a) Risky rats tend to pick riskier options more often on cued trials. (b) Optimal rats select fewer cued trials over time, whilst risky rats pick more cued trials. (c) Optimal rats complete more trials across weeks, and completed more trials overall than risky rats. (d) Switch scores are greater for risky compared to optimal rats for both session-type comparisons. (e/f). Optimal rats are slower to make lever choices on all trials, and P-choices on uncued trials only. (g) All rats are quicker to collect reward after cued trials. (h) Risky rats make more premature responses than optimal rats. (i/j) Lever omissions do not differ by risk preference, but optimal rats make more P-choice omissions.
Optimal rats completed more trials (both cued and uncued) than risky rats (risk-preference: F1,62 = 39.397, p < 0.001), and optimal rats completed more uncued trials as training progressed (week*risk-preference*task type: F2.045,126.771 = 3.037, p = 0.050, weeks 2/3 vs 4/5: ps < 0.028; Figure 6(c)). Both congruent and incongruent switch scores during forced lever free choice training were significantly higher in risky rats, suggesting decision-making patterns changed more from the end of the previous training session to the start of the next (risk-reference: F1,62 = 12.028, p < 0.001; Figure 6(d)).
In terms of response vigour, risky rats were faster to make lever choices than optimal rats across both task types (risk-preference: F1,62 = 19.139, p < 0.001; Figure 6(e)). Risky rats were also faster to make a P-choice, but only on uncued trials (risk-preference*task type: F1,62 = 6.118, p = 0.016, uncued trials: p = 0.019; Figure 6(f)). Similar to the analyses above, all rats were quicker to collect reward on cued trials, but this was independent of risk-preference (task type: F1,62 = 45.311, p < 0.001; Figure 6(g)).
In accordance with previous reports (e.g. Barrus et al., 2015), risky rats made more premature responses and this was evident across both task types (risk-preference: F1,62 = 8.211, p = 0.006; Figure 6(h)). There were no differences in lever choice omissions (F1,62 = 2.239, p = 0.140; Figure 6(i)), but risky rats made fewer P-choice omissions on both cued and uncued trials (risk-preference: F1,62 = 6.373, p = 0.014; Figure 6(j)).
Effects of sex on choice rGT performance
There were no interactions between sex and either task-preference or risk-preference. Females showed a greater preference for the cued task than males (% cue preference- sex: F1,58 = 5.827, p = 0.019; Table 4). As per the forced lever free choice data, females were also quicker to collect rewards on cued trials (sex*task type: F1,58 = 5.769, p = 0.020, Table 4). Decision score did not differ between males and females overall (sex: F1,58 = 0.109, p = 0.742; Table 4), but males became progressively riskier on cued trials over time (week*sex*task type: F4,232 = 2.455, p = 0.047; Table 4). Although there was no overall effect of sex on lever choice latency, this was more variable across weeks in males (sex: F2,58 = 3.294, p = 0.075; week*sex: F3.268,189.258 = 3.500, p = 0.014; Table 4). In females only, P-choice omissions decreased across weeks (week*sex*task type: F3.888,225.506 = 2.545, p = 0.042, weeks 1 and 2 vs 3: ps < 0.013, week 2 vs 4: p = 0.036; Table 4). No main effects of sex or interactions with sex were found in analyses of premature responding, P-choice latency, or lever choice omissions (all F’s < 3.146, ps > 0.081; Table 4).
Behavioural measures split by task type (TT) and sex.

Data shown are mean ± SEM. C: Cued trials; U: uncued trials.
PRPs in rats
The design of the choice rGT allowed us to investigate whether rats exhibit PRPs in this task, a common phenomenon seen in humans and animals whereby response latencies are longer on trials following gain of reward. Across both task types, rats display large PRPs, with much longer lever latencies on trials following a win than a loss (t63 = -31.543, p < 0.001; Figure 7(a)). PRPs tended to be longer following a cued win (t63 = 1.907, p = 0.061; Figure 7(b)), and were longer following a larger risky win (t61 = -6.021, p < 0.001; Figure 7(c)). PRP magnitude did not differ by task-preference between either cued/uncued trials, or between optimal/risky wins (previous outcome*task-preference: Fs < 1.287, ps > 0.266; Figures 7(d) and (e)). However, the ability of reward-paired cues to potentiate PRPs was only seen in risky rats (previous outcome*risk-preference: F1.980,118.796 = 4.198, p = 0.018; Figure 7(f)). Although both optimal and risky rats showed greater PRPs to larger risky wins, smaller optimal wins elicited lower PRPs in risky rats (previous outcome*risk-preference: F1.727,100.142 = 4.086, p = 0.048; Figure 7(g)). There were no effects of sex on PRPs across any analyses (all Fs < 3.056, all ps > 0.085).

Post-reinforcement pausing in rats (a) Rats show post-reinforcement pauses (PRPs; longer latencies to select a trial type) on trials following a win. (b) PRPs tend to be longer after a cued win, and (c) are longer following a risky win. (d) Magnitude of PRPs does not differ following cued or uncued wins across cue preference groups. (e) As in (c) all rats display longer PRPs following risky wins, and there is no difference by cue preference cluster. (f) Risky rats have longer PRPs on trials following a cued win. (g) The difference in latencies following optimal and risky wins is larger in risky rats, driven by them responding more quickly after an optimal win. CP: cue preferring; NP: neutral preference; UP: uncued preferring. W-C: win on cued trial, W-U, win on uncued trial, L-C: loss on cued trial, L-U: loss on uncued trial; W-O: win following an optimal (P1 or P2) choice; W-R: win following a risky (P3 or P4) choice.
Applying the diffusion model to data from choice rGT
Preference for cued task
All trials analysis
Drift rate differed between CP, NP and UP rats (task-preference: F2,58 = 36.175, p < 0.001; Figure 8(a)), with CP rats having the most positive drift rates (i.e. steepest rate of approaching the cued boundary) and UP rats having the most negative. Starting point did not vary based on task-preference (F2,58 = 0.929, p = 0.401; Figure 8(b)). CP rats had wider decision boundaries (task-preference: F2,58 = 6.433, p = 0.003; NP vs CP: p = 0.002; Figure 8(c)), suggesting CP rats only were integrating more evidence before deciding between cued and uncued trials. UP rats had longer non-decision times (task-preference: F2,58 = 3.730, p = 0.030; UP vs NP, CP: ps < 0.051; Figure 8(d)).
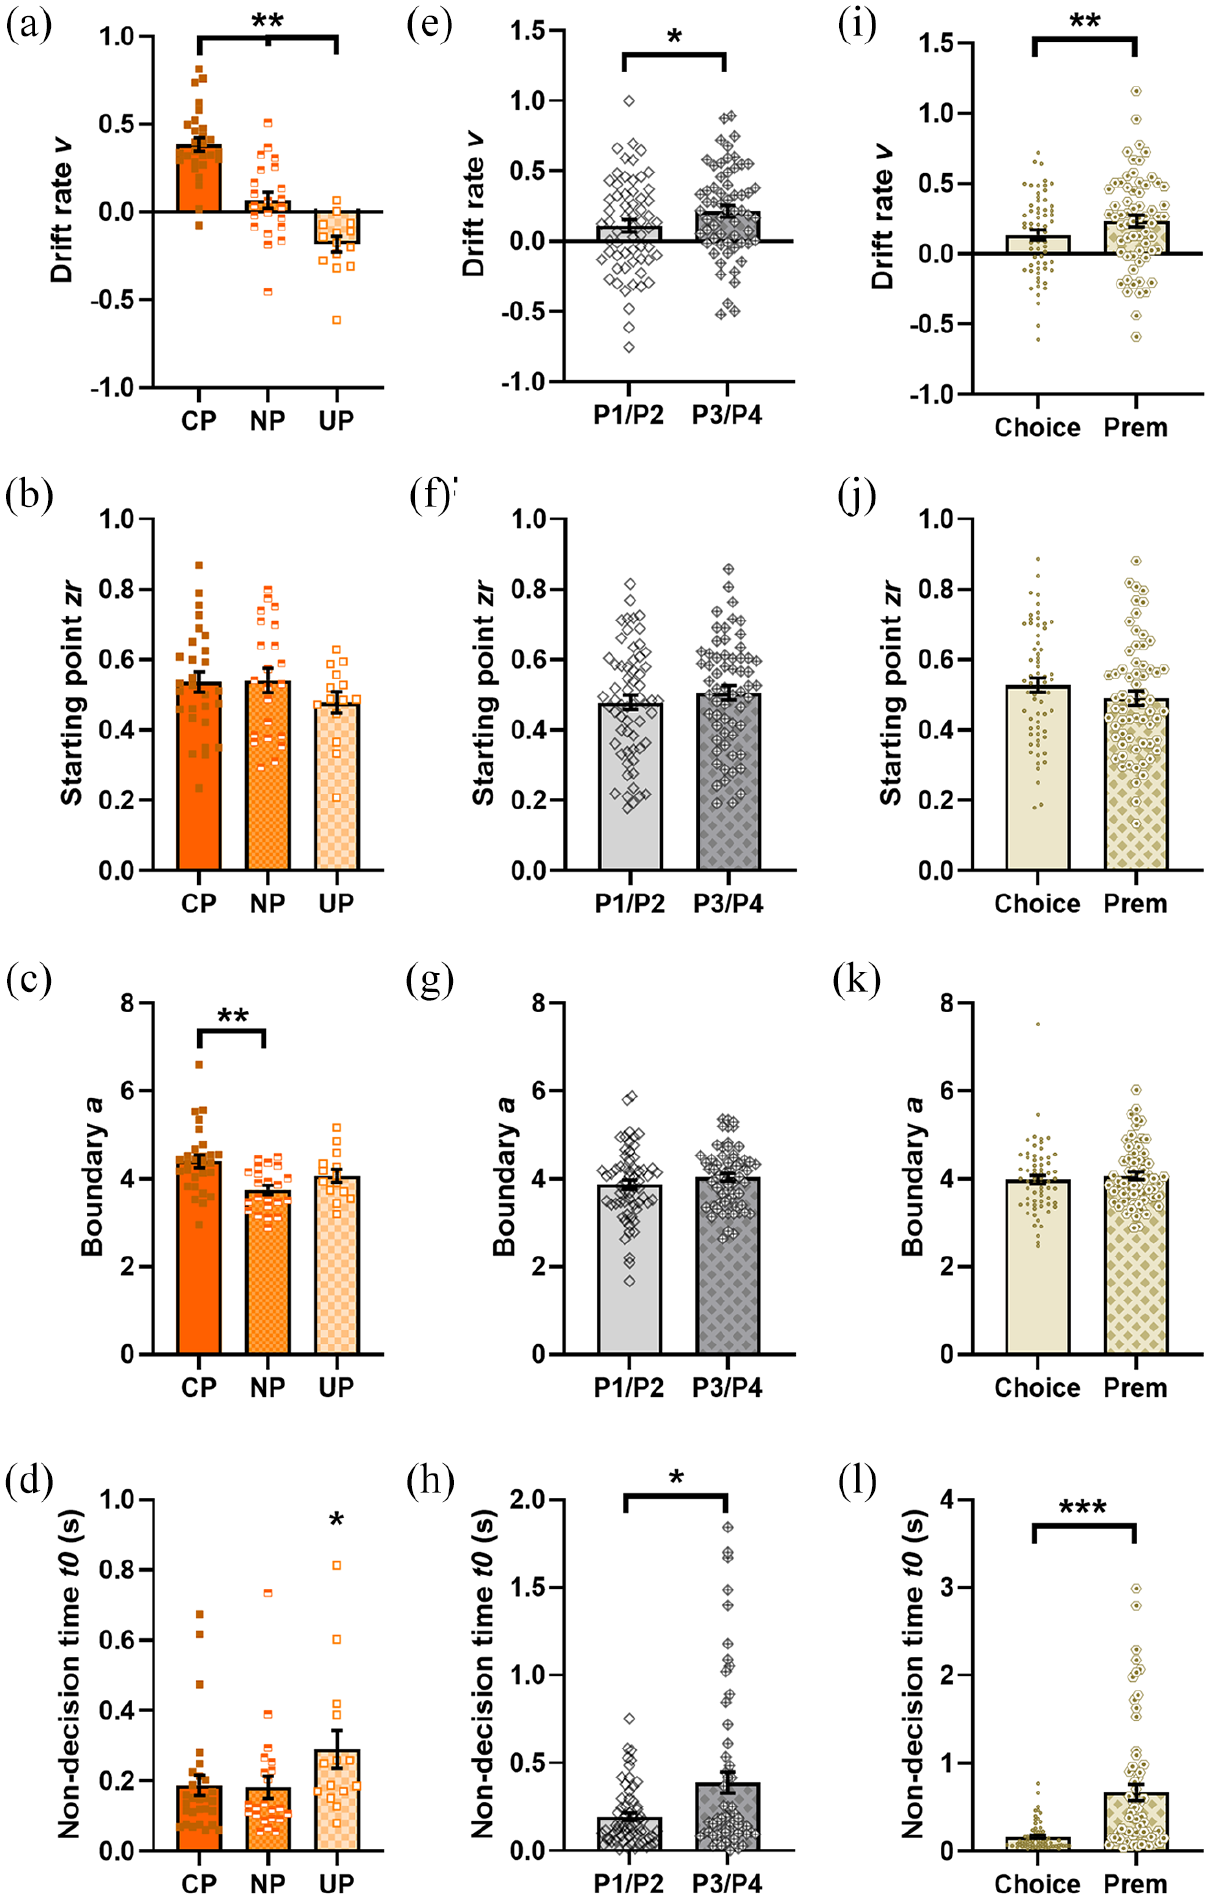
Diffusion model parameters by cue preference (a-d) Model parameters were fit to all trials. (a) Drift rates track with cue preference, i.e. CP rats have the most positive drift rates, while UP rats have the most negative. (b) Decision starting point does not differ by cue preference. (c) CP rats have wider decision boundaries than NP rats. (d) Non-decision times are longer in UP rats. (e–h) Model parameters were fit separately to trials split by whether the rat went on to make an optimal (P1/P2) or risky (P3/P4) choice. (e) Drift rates are more positive on trials where the rat then makes a risky choices. (f) Decision starting points and (g) boundaries are not different. (h) Non-decision times are longer on lever choices preceding a risky choice. (i–l) Model parameters were fit separately for trials where the rat went on to make a P-choice (Choice) or a premature response (Prem). (i) Drift rates are also steeper on trials where the rat goes on to make a premature response. (j/k) Starting points and boundaries do not differ. (l) There are longer non-decision times on trials where a premature response is made. CP: cue preferring; NP: neutral preference; UP: uncued preferring.
Female rats had longer non-decision times than males (sex: F1,58 = 5.416, p = 0.027; Table 5). No main effects of sex or interactions between sex and task-preference were observed for any other variable (Fs < 1.107, ps > 0.296).
Diffusion model measures split by sex and risk-preference.

Values shown are mean ± SEM. M: male; F: female.
Analysis of lever choice parameters split by whether rats made risky or safe choices on that trial
Drift rates were more positive (towards selecting a cued trial) when a lever choice was followed by a risky P-choice (choice type: F1,55 = 6.224, p = 0.016; Figure 8(e)), which matches the behavioural data indicating risky choice was greater on cued trials. CP rats had more positive drift rates than NP or UP rats, matching the all trials analysis (task-preference: F2,55 = 35.671, p < 0.001; CP vs NP, UP: ps < 0.001). Starting point was similar regardless of whether animals went on to make a risky or safe choice, or exhibited a particular task-preference (all F’s < 2.634, all p’s > 0.080; Figure 8(f)). Choice type did not influence decision boundaries which were again wider in CP rats (choice type: F1,55 = 2.429, p = 0.125; task-preference: F2,55 = 8.321, p < 0.001, high vs medium CP: p < 0.001; Figure 8(g)). Non-decision times were longer when the subsequent P-choice was risky (choice type: F1,55 = 5.625, p = 0.021; Figure 8(h)), but specifically this effect was driven by males (choice type*sex interaction F1,55 = 4.475, p = 0.039; optimal vs risky choices in males: p = 0.002; Table 5).
Analysis of lever choice parameters split by whether rats made a P-choice or premature response on that trial
Drift rates were more positive on trials on which a lever choice was followed by a premature response (F1,58 = 13.803, p < 0.001; Figure 8I), supporting behavioural data showing rats make more premature responses on cued trials. As in previous analyses, drift rate also tracked task-preference (F2,58 = 27.063, p < 0.001). Decision starting points and boundaries were not linked with trial outcome (F’s < 2.769, p’s > 0.101; Figure 8(j) and (k)), but non-decision times were longer on trials followed by a premature response (F1,58 = 25.088, p < 0.001; Figure 8(l)).
Preference for optimal / risky responding
All trials analysis
Drift rates were positive in both optimal and risky rats, but were not different between these groups (risk-preference: F1,60 = 0.780, p = 0.381; Figure 9(a)). There was also no difference in starting point or boundary between optimal and risky rats (Fs < 3.026, ps > 0.086; Figure 9(b) and (c)). Optimal rats had longer non-decision times than risky rats (risk-preference: F1,60 = 12.061, p < 0.001; Figure 9(d)). This effect was driven by female rats only (sex*risk-preference: F1,60 = 4.108, p = 0.047), with female optimal rats having longer non-decision times than female risky rats (p < 0.001; Table 5), or optimal male rats (p = 0.002; Table 5). There were no effects of sex on any other variable (Fs < 1.287, ps > 0.260; Table 5).

Diffusion model parameters by risk preference (a–d) Model parameters were fit to all trials. (a) Drift rates, (b) decision starting points, and (c) boundaries are not different between optimal and risky rats. (d) Non-decision times are longer in optimal rats. (e–h) Model parameters were fit separately to trials split by whether the rat went on to make an optimal (P1/P2) or risky (P3/P4) choice. (e) Drift rates are more positive on trials where the rat then makes a risky choice, but do not differ between risk preference groups. (f) Decision starting points and (g) boundaries are not different. (h) Non-decision times are longer specifically for optimal rats when they go on to make a risky choice. (i–l) Model parameters were fit separately for trials where the rat went on to make a P-choice (Choice) or a premature response (Prem). (i) Drift rates are also steeper on trials where the rat goes on to make a premature response, but do not differ between optimal and risky rats. (j/k) Starting points and boundaries do not differ. (l) There are longer non-decision times on trials when an optimal rats goes on to make a premature response, and a trend towards the same for risky rats.
Analysis of lever choice parameters split by whether rats made risky or safe choices on that trial
As with the all trials analysis, drift rate, starting point and boundary did not differ for optimal or risky rats when trials were split by optimal or risky choices (Fs < 2.850, ps > 0.098; Figures 9(e)–(g)), but drift rates were more positive for risky choices across all rats (F1,57 = 7.894, p = 0.007), as with the cue preference analysis. However, splitting rats by risk-preference revealed that long non-decision times specifically occur when optimal rats go on to make risky choices (choice type*risk-preference: F1,57 = 11.541, p = 0.001; Figure 9(h)).
For this analysis there was a choice type*sex*risk-preference interaction for drift rate (F1,57 = 5.504, p = 0.022), indicating that female risky rats have more positive drift rates on trials when they go on to make a risky choice (p = 0.014), while the same is true for male optimal rats (p = 0.009; Table 5).
Analysis of lever choice parameters split by whether rats made a P-choice or premature response on that trial
This analysis showed a similar pattern to the choice type analysis, whereby drift rate, starting point and boundary did not differ between optimal and risky rats (Fs < 2.190, ps > 0.143; Figures 9(i)–(k)), but as seen in the cue preference analysis, drift rates were more positive for premature trials in all rats (F1,60 = 11.389, p = 0.001). Non-decision times were longer on trials followed by a premature response, but only for optimal rats (outcome*risk-preference: F1,60 = 14.581 p < 0.001; Figure 9(l)). There were no sex specific effects in this analysis.
Discussion
Here we show for the first time that a majority of rats, similar to humans, preferentially choose to gamble for rewards that are accompanied by audiovisual cues. Furthermore, we show that rats make more risky choices, are more impulsive, and are faster to make P1-4 choices and collect rewards on cued trials. These findings mirror previous observations comparing the behaviour of rats trained on the cued versus uncued rGT. By demonstrating these behavioural effects using a within-subjects design, we can confirm that these decision-making and impulse control deficits are driven specifically by audiovisual cues, rather than any latent between-subjects variance. We also show that audiovisual cues enhance PRPs, as indicated by slower initiation of the next trial following a win than a loss, suggesting a more robust reaction to rewarding outcomes. However, this was also accompanied by lower PRPs after optimal wins, indicating animals were relatively more sensitive to large, less predictable rewards, and less reactive to smaller but more certain gains. Cued rGT trials therefore exacerbate a number of behavioural measurements of problematic gambling-like engagement.
A major goal of the current study was to determine whether preference for the cued task was associated with a stronger effect of cues on decision-making or impulsivity. Although we were able to identify a cue-preferring group that was statistically distinct from those that preferred the uncued task or showed a neutral preference, these CP rats did not exhibit greater levels of impulsivity, speed of decision-making, or risky choice on cued trials. In contrast, rats categorised as risk-preferring based on their net decision score across both task types made significantly more risky choices and impulsive responses on cued vs uncued trials. PRPs were significantly greater in risk-preferring animals overall, and also greater after cued wins while attenuated after optimal wins. It appears that rats classified as risky, rather than CP, drove the effect of reward-paired cues on this measure of reward sensitivity evident at the cohort level. Risky rats also increased their preference for the cued task over time. Indeed, risky rats appeared much more sensitive to the nefarious effects of win-paired cues, bolstering the use of this metric as a proxy for vulnerability to gambling disorder.
In addition to looking for signs of susceptibility to the risk-promoting or disinhibitory effects of win-paired cues, we can also approach vulnerability from the inverse perspective: a lack of resilience in their absence. As such, we can ask whether the behaviour of rats classified as risky or CP on the uncued task resembles the stereotypical effect of the cues: risky, impulsive, and quicker to respond. Interestingly, both CP and risky rats were significantly more impulsive and faster to collect rewards on uncued trials as compared to their UP or optimal peers, and also faster to initiate uncued trials. Risky rats were also faster to make P-choices. Rats that fell into either of these groupings therefore appeared generally more motivated to engage in the task even when cues weren’t present, as if the somewhat protective effect of performing the task in the absence of cues was weaker in these rats.
Diffusion modelling also revealed subtle differences between classifying rats based on preference for, rather than risky decision-making during, the cued task. CP rats had more positive drift rates, indicating more rapid evidence accumulation in favour of choosing the cued rGT as would be expected, but also wider decision boundaries, suggesting relatively greater decision confidence. In contrast, there were no differences in drift rates between risky and optimal groups, even though risky rats tended to show increased choice of cued trials over time. This subtle shift in behaviour can therefore not be attributed to a fundamental difference in evidence accumulation processes between risky and optimal rats.
Model parameters fit purely to lever choice data varied according to trial outcomes during the rGT portion of the trial, indicating that selection of cued/uncued trials was not independent from later P-choice or premature responding. In general, drift rates were higher on trials in which rats made risky or premature responses, but this is largely expected given that these outcomes were more common during cued trials. However, non-decision times were also generally longer on these trial types. While this effect did not track task-preference, this association between subsequent counter-productive behaviours and longer non-decision times was seen exclusively in optimal decision-makers.
Non-decision time captures the part of the reaction time distribution that cannot be attributed to the evaluative process of decision-making itself, such as motor readiness or encoding of the response options (Mulder and van Maanen, 2013). The fact that non-decision times are longer on trials in which optimal decision-makers ultimately make a maladaptive response could tell us something critical about how these generally well-performing animals make mistakes. We have yet to develop more sophisticated models of non-decision times, but they could include actions governed by conditioned Pavlovian approach behaviours, such as stimulus-response and stimulus-outcome associations, or slips in attention or distraction. Visualising animal behaviour during lever choice and processing it using machine-learning programmes such as DeepLabCut may provide additional information that could be quantified and modelled to study these phenomena further. Given that this association between longer non-decision times and subsequent risky or impulsive responses was absent in risky rats, a better understanding of what drives this association in optimal rats may help us understand how behavioural control diverges in risky animals, findings that could help those struggling with gambling problems.
Risky rats also exhibited greater switch scores, indicating a bigger change in decision-making strategy between the end of one session and the start of the next. This may be evidence of an altered and perhaps maladaptive learning pattern. The magnitude of switching did not differ from rats trained exclusively on the cued version, suggesting that learning on cued sessions dominated the overall training process. This analysis also suggests that choice volatility early in training and later risk-preference may be linked. Theoretically, rats that switch more between choice options during training are likely to end up experiencing more risky, large wins, which may drive further risky choice. However, applying reinforcement learning models to data from early training sessions in the cued and uncued rGT did not find any links between the parameter governing choice randomness and later risk-preference (Langdon et al., 2019), potentially suggesting a more complex interaction.
Although risky choice was higher on cued trials, the magnitude of this was much smaller compared to when animals are trained exclusively on the cued or uncued rGT (Barrus and Winstanley, 2016). Despite the generalisation in learning across cued and uncued sessions, the interleaving of uncued with cued sessions did appear to attenuate the risk-promoting effects of the cues, even in rats that subsequently chose cued trials the most frequently. While this finding points to the powerful ability of win-paired cues to promote risky choice in general, it also speaks to a way to partially negate their effects by intermittent experience of the same reinforcement contingencies without concomitant sound and light cues.
This observation may also influence how we think about the neurobiological mechanism underlying the cues’ effects. Based on extant literature, we suggested previously that cue-induced risky choice, at least in males, can be driven by plasticity within the mesolimbic dopamine system as a result of iterative, chronic exposure to reward-cue pairings (Winstanley and Hynes, 2021). Inserting uncued rGT training sessions would presumably dampen any chronic, cue-induced effects on dopaminergic function, thereby weakening their ability to drive risky decision-making. However, on the choice rGT, animals still showed a significant bias towards the risky options on cued trials, as well as faster and more impulsive responses. As such, win-paired cues may cause these effects through other mechanisms, independent of their ability to promote long-lasting plasticity in the dopaminergic system. Serotonergic and cholinergic drugs certainly modulate decision-making differently when cues are present (Adams et al., 2017; Betts et al., 2021; Silveira et al., 2015), indicating distinct recruitment of these neurotransmitter systems. Although speculative at present, these hypotheses could be readily tested in future work using fibre photometry and chemo/optogenetics.
Ensuring the most valid behavioural assays are used to model gambling-like behaviour is essential if they are ever to achieve predictive validity. This novel behavioural paradigm, in which animals choose between cued and uncued rGT trials, clearly shows that pairing rewards with audiovisual cues potentiates impulsivity, PRPs, and speeds responding. While preference for the cued task did not scale with risky decision-making, rats that favoured risky options on both task types were more negatively impacted by cues, supporting use of this categorisation as an endophenotype for gambling disorder vulnerability. Although interleaving uncued and cued trials weakened the ability of cues to promote risky choice, it was not abolished entirely. Further work characterising how performance on this task is related to traits such as risk assessment, sensation seeking and novelty preference would provide valuable insight into the interactions between cue influenced risky decision making and other vulnerability traits relevant to addiction disorders. Diffusion model analyses suggest non-decision times are longer in optimal decision-makers before subsequent risky or impulsive actions, yet this pattern is lacking in risk-preferring animals. These results provide important clues as to how win-paired cues may facilitate problematic engagement with gambling products, information that may ultimately prove useful in the search for better treatments for gambling addiction.
Supplemental Material
sj-docx-1-bna-10.1177_23982128251352235 – Supplemental material for Most rats prefer gambling opportunities featuring win-paired cues that drive risky choice: Synergistic interactions between choice of and choice during the cued rat gambling task
Supplemental material, sj-docx-1-bna-10.1177_23982128251352235 for Most rats prefer gambling opportunities featuring win-paired cues that drive risky choice: Synergistic interactions between choice of and choice during the cued rat gambling task by Claire A. Hales, Kelly M. Hrelja, Sapeeda Ansary, Erin Chong, Brittney Russell and Catharine A. Winstanley in Brain and Neuroscience Advances
Footnotes
Acknowledgements
This work took place at a UBC campus situated on the traditional, ancestral, and unceded land of the xʷməθkʷəy̓əm (Musqueam), sə̓lílwətaʔɬSelilwitulh (Tsleil-Waututh) and Sḵwx̱wú7mesh (Squamish) Peoples. The authors thank their stewardship of this land for thousands of years.
Funding
The author(s) disclosed receipt of the following financial support for the research, authorship, and/or publication of this article: a Canadian Institutes of Health Research project grant (PJT-162312) and a Michael Smith Health Research BC Trainee Award (grant no. RT-2020-0564).
Declaration of conflicting interests
The author(s) declared no potential conflicts of interest with respect to the research, authorship, and/or publication of this article.
Supplemental material
Supplemental material for this article is available online.
References
Supplementary Material
Please find the following supplemental material available below.
For Open Access articles published under a Creative Commons License, all supplemental material carries the same license as the article it is associated with.
For non-Open Access articles published, all supplemental material carries a non-exclusive license, and permission requests for re-use of supplemental material or any part of supplemental material shall be sent directly to the copyright owner as specified in the copyright notice associated with the article.