
Abstract
Nanofluids are regarded as promising heat transfer fluid due to their ultrafast cooling capability. However, stability analysis of nanofluids is very critical before its application in heat transfer .The present paper reports about an investigation on the stability of water-based Al2O3 and TiO2 nanofluids at ambient temperature. Nanoparticles, namely Al2O3 and TiO2 at different concentrations of 1, 0.5, 0.1, 0.05, and 0.01 wt.% respectively were directly dispersed in water without adding any dispersant and placed in a static container to observe gravitation settling. Change of sedimentation height with respect to time was measured using the sedimentation photograph capturing method. DLS (Dynamic Light Scattering) and zeta potential analysis were also executed to examine the stability of nanofluids. The results show that the visualization method, DLS and zeta potential analysis are in good correspondence to each other. Sedimentation velocity increases with an increase in nanoparticle concentration and aging. Brownian motion of nanoparticles resist the sedimentation in nanofluids. It is observed that TiO2nanofluid is more stable as compared to Al2O3 nanofluid due to its smaller particle size. Finally authors recommend smaller particle size, optimized sonication time, low nanoparticle concentration and use of surfactant to obtain better dispersion stability of nanofluids
Introduction
The emergence of nanofluids in the last two decades has pioneered a new generation of heat transfer fluids due to their rapid cooling ability. Nanofluid has attracted a huge number of researchers because of its excellent thermo-physical properties1–12 and outstanding thermo-fluidic characteristics13–27 as compared to basefluid. An incredible amount of researches in various aspects of nanofluids have been carried out to explore new areas of their utilization in various fields such as thermal sciences, fuels engineering, energy and biological systems, etc.28–33 However, certain limitations such as sedimentation, clogging, erosion, and pumping power increment resist its efficient applicability in various fields.34–37 These limitations are influenced by the stability of nanofluids significantly. Stability is a vital property of nanofluids by virtue of which nanoparticles remain suspended in the dispersion medium. A stable nanofluid shows enhanced thermophysical and heat transfer properties as compared to an unstable nanofluid. 38 The extreme stability with high thermal conductivity makes nanofluids an efficient heat carrier fluid. 39 Hence, the proper understanding of nanofluids in terms of their stability is very crucial before any kind of heat transfer applications, where the excellent thermophysical properties of the material are very essential. It is observed from various literature that the stability of nanofluids varies drastically with the variation of size, shape, and concentration of nanoparticles, preparation methods and types of base fluids, additives, mechanical mixing, and various physical treatments. In the current scenario, enhancement of stability of nanofluids by optimizing various process parameters is a most demanding and interesting area of research in the domain of nanomaterials and nanofluids.
Different characterization techniques such as the Sedimentation method, sedimentation balance method, zeta potential analyzer, UV-Visual spectrometer, TEM/SEM, DLS have been used to analyze the stability of various nanofluids at different conditions and reported in the literature as listed and shown in Table 1.
Reviews on research in stability of nanofluids.
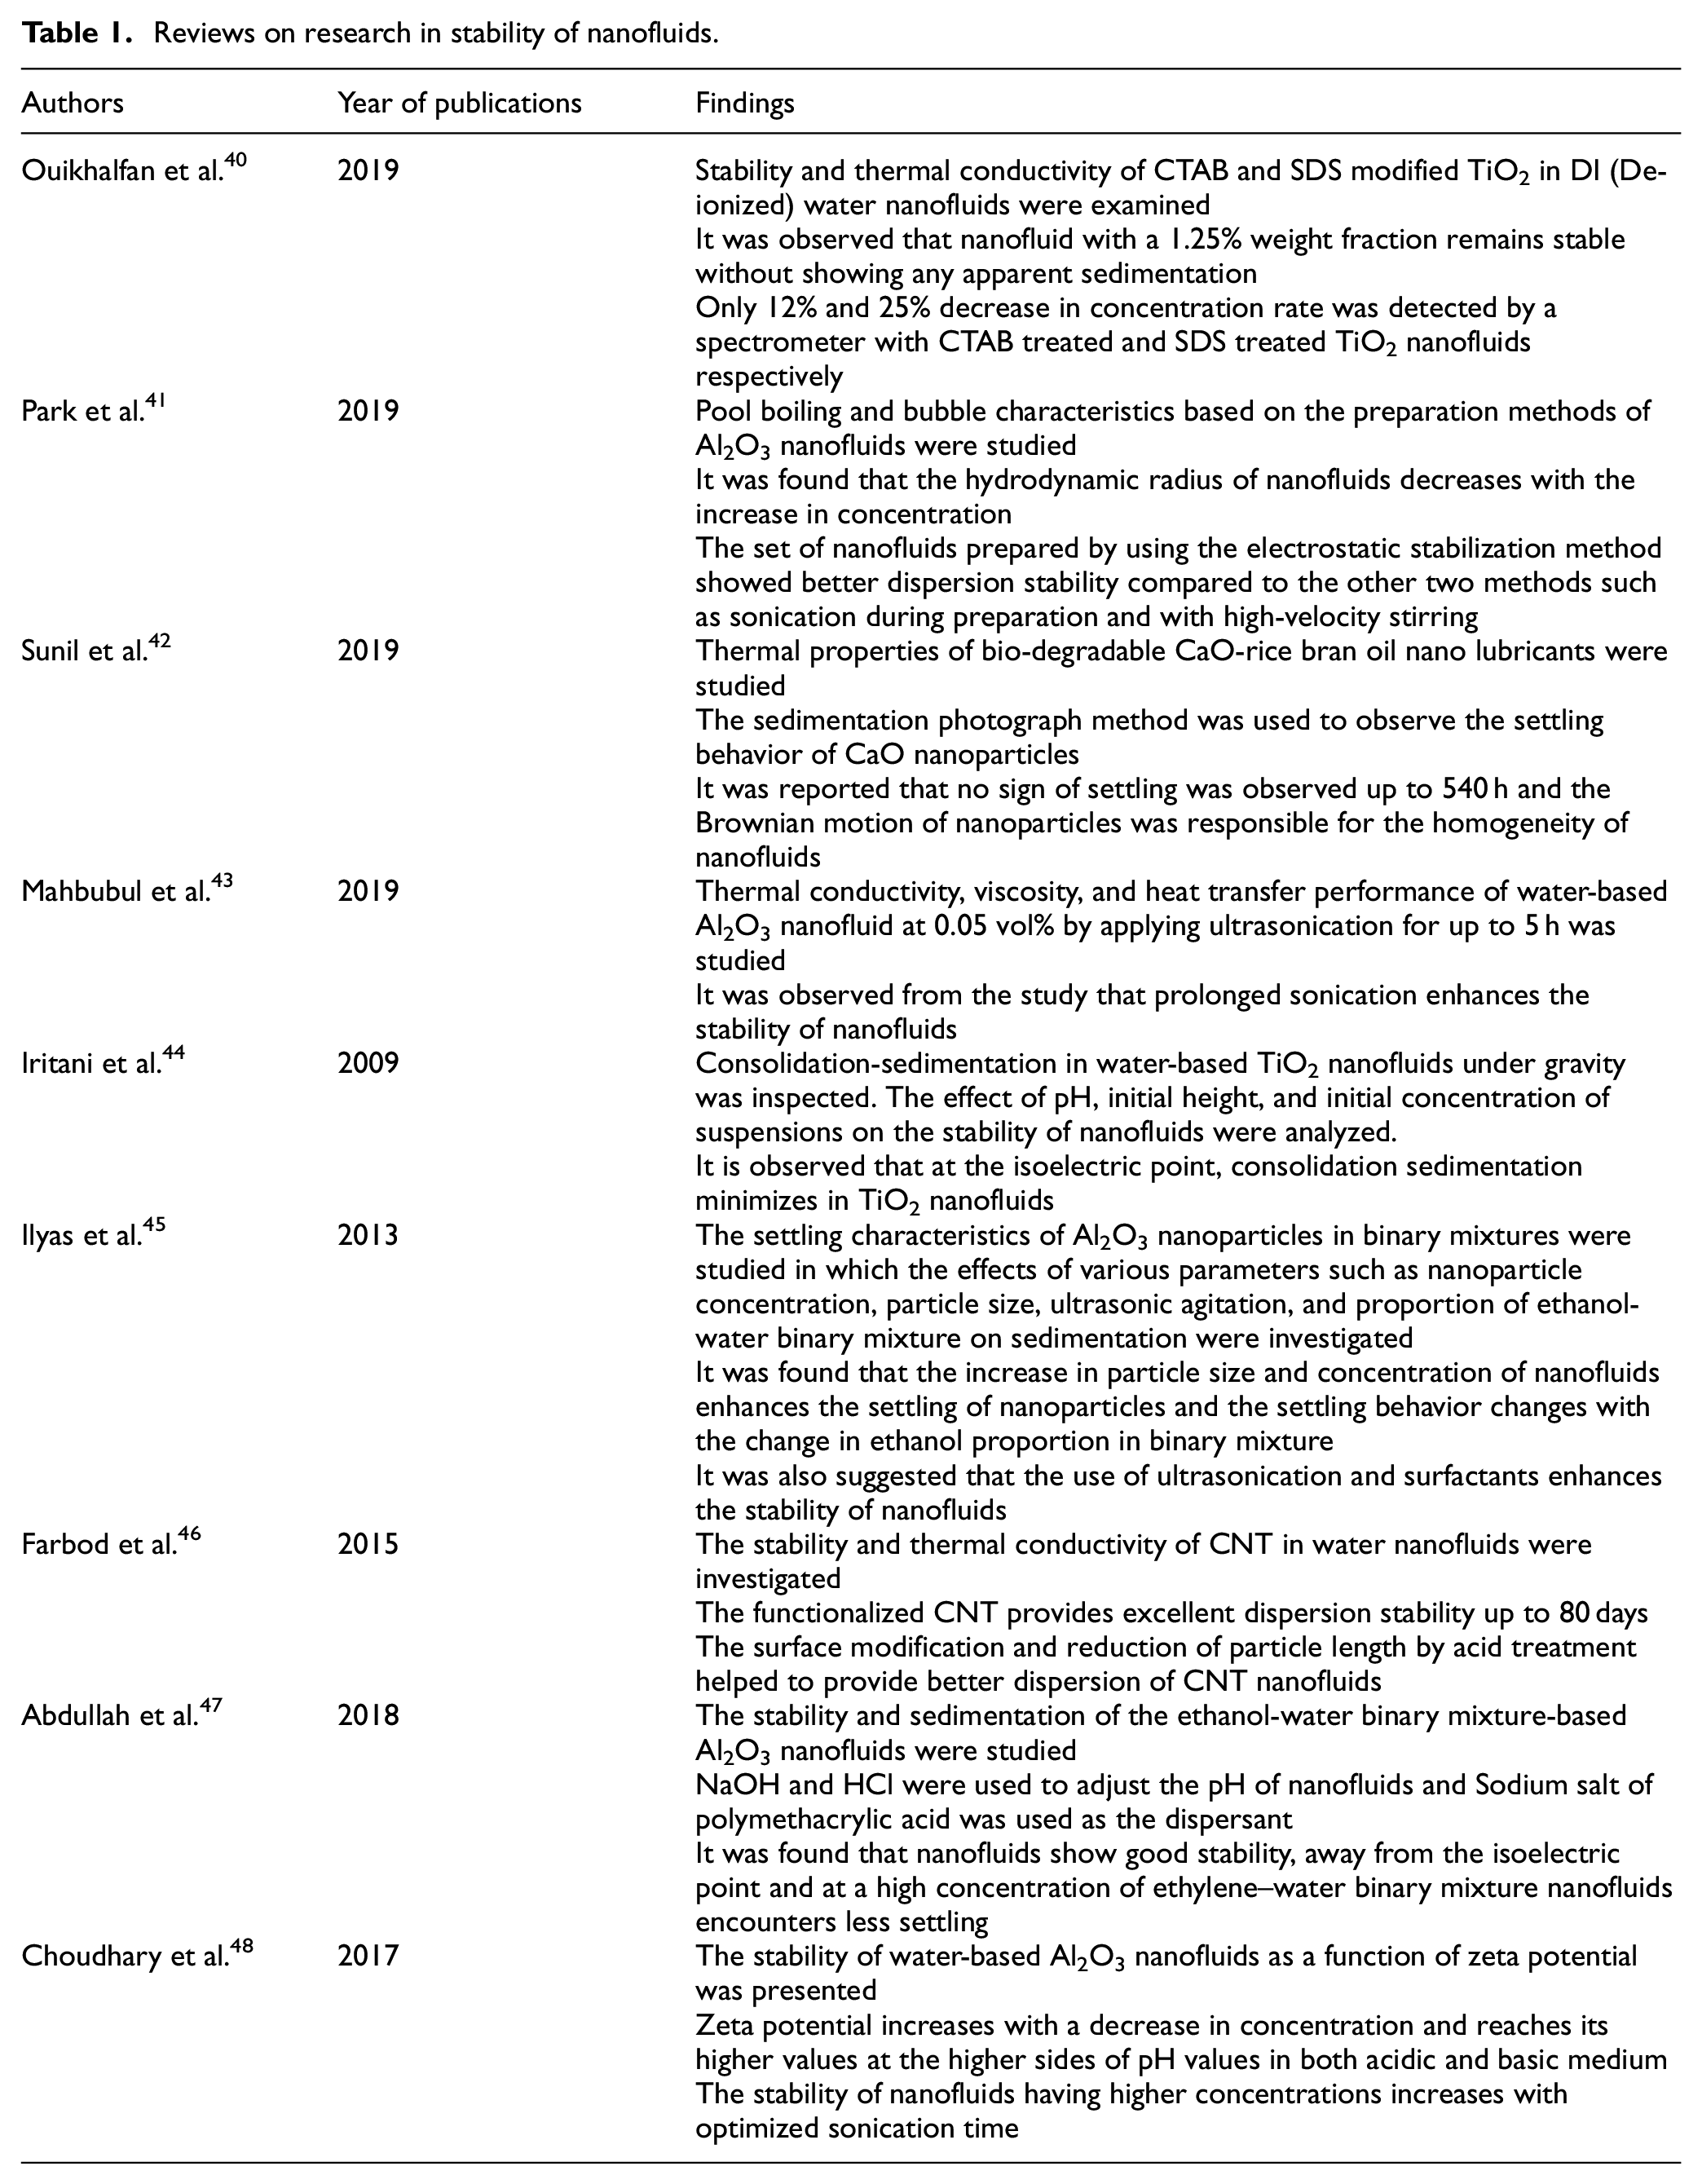
From the detailed review of literature, it is inferred that the stability of the nanofluid is a very crucial factor to be investigated and the enhancement of stability is still a big challenge for researchers before the successful implementations of nanofluids in widespread applications. Although a considerable amount of studies on stability analysis of nanofluids have already been carried out and reported, a detailed study on the effect of micro or nano level phenomena on the stability of nanofluids has not been investigated yet. The stability analysis study has no particular time limit. In general, a stability study was performed from few hours to few months. 38 The measurement of sedimentation velocity and its dependence upon particle size, nanofluid concentration is still not investigated thoroughly. The contribution of Brownian motion of nanofluids on the sedimentation characteristics of nanofluids has also not been reported yet. Therefore, a detailed study on such parameters is needed for a better understanding of the stability characteristics of nanofluids Above all the theoretical analysis for the sedimentation process of nanofluids and its comparison with experimentally obtained sedimentation velocity of nanofluids has not yet been done properly. In the present study, an effort has been made to analyze the stability of nanofluids by addressing these above-mentioned unattended points and this may be considered as the novelty of this present manuscript.
To meet the objective of the current study, the commercially, available Al2O3 and TiO2 nanoparticles were separately dispersed in water at five different concentrations of 0.01, 0.05, 0.1, 0.5, and 1 wt% to prepare nanofluids without any surfactants. The sedimentation of the nanoparticles in all the prepared samples is observed by visual inspection and photograph capturing method. The sedimentation coefficient was estimated. Sedimentation velocity was calculated and compared with the predicted velocity using the existing theoretical formula. The effect of concentration and Brownian motion of nanoparticles on sedimentation was also observed. Additionally, DLS and zeta potential analysis was also performed in support of visualization and photograph capturing methods.
Materials and method
Materials and characterization
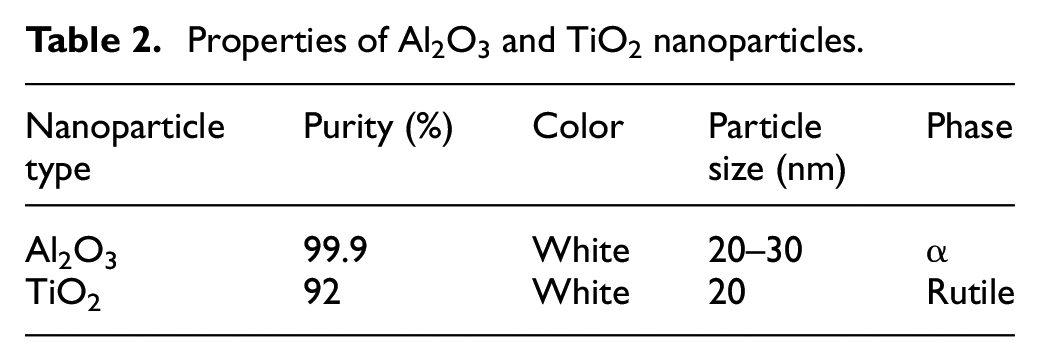
In the present study, commercially available nanopowder: Al2O3 (99% pure, 20–30 nm) and TiO2 (92% pure, 20 nm), are used as constituent nanoparticles and De-ionized (DI) water is used as basefluid during the synthesis of nanofluids. Certain morphological characteristics of as-received Al2O3 and TiO2 nanoparticles are listed in Table 2. Knowledge of particle shape, size and other morphological properties are essential before the preparation of nanofluids. The shape, size and morphological characteristics of nanoparticles are determined by Transmission Electron Microscope (TEM) and Scanning Electron Microscope (SEM) techniques. Standard sample preparation procedures were followed before the characterization of nanomaterial in TEM (Thermo-Fisher Scientific Glacious™ operating at 200 kV) and SEM (Zeiss GEMINI 300).
Properties of Al2O3 and TiO2 nanoparticles.
Synthesis of nanofluids
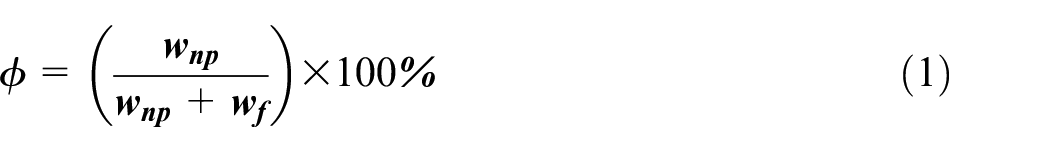
Nanofluids are generally formulated either by single-step approach or two-step approach. The single-step approach is suitable for the preparation of metallic nanofluids whereas the two-step approach is relevant for the synthesis of oxide nanofluids. Hence, a two-step approach is adopted in the present study to prepare Al2O3 and TiO2 nanofluids as depicted in Figure 1. In this approach, nanoparticles are added into water and then mixed properly with water by using a magnetic stirrer (made by Aska Instruments, Kolkata, India) for 2 h to get homogeneous dispersion. The dispersions are further sonicated using an ultrasonic bath(model no: LMUC-2, made by Labman Scientific Instruments Pvt. Ltd., Chennai India) of 50 W power and 40 ± 3 KHz frequency for de-clustering of nanoparticles to stop agglomeration in nanofluids. There is no particular time duration reported till now for sonication. According to some researchers, better dispersion stability needs more sonication time. However, prolonged sonication can lead to distortion of particle shape and reduction in particle size. Therefore, prolonged sonication should be avoided. Mahbubul et al. 39 reported that prolonged ultrasonication gives better dispersion stability in nanofluids. Thus, in the present study, 45 min of sonication is applied to each nanofluid sample. The temperature of nanofluid samples is controlled during sonication using a water bath to avoid change in concentration due to evaporation of basefluid with temperature rise owing to sonication energy and also to avoid property degradation. 49 No surfactant was added during the synthesis of nanofluids to maintain the purity of nanofluids. The whole synthesis process of nanofluid is illustrated schematically in Figure 1. Al2O3 and TiO2 nanofluids at 1, 0.5, 0.1, 0.05, and 0.01 wt.% were obtained by this approach. The prescribed concentrations of nanoparticles are estimated using the following formula shown by equation (1). A digital weighing machine (Made by KERRO, model no: BL5002) with an accuracy of ±0.01 g was applied for all weight measurements.
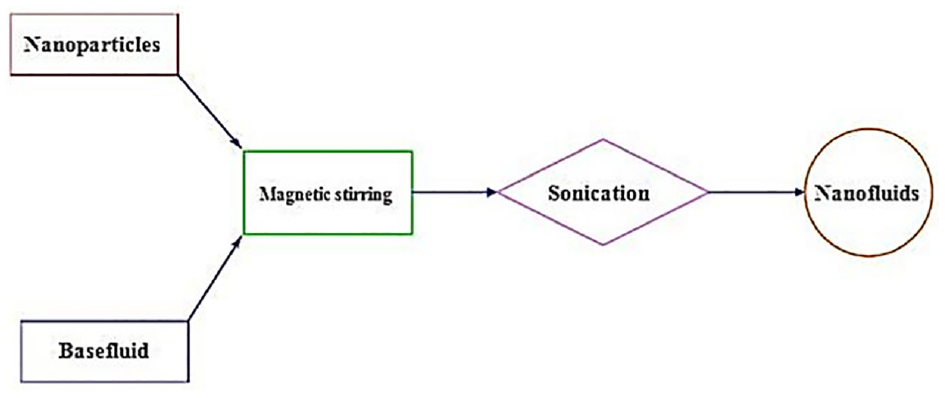
Synthesis of nanofluids.
Where,
Sedimentation analysis by photographic method
The study of sedimentation in nanofluids is very crucial and it signifies stability. The conventional way to examine sedimentation is the photographic method by capturing the photographs of batch settings in static nanofluids to estimate settling rate. Here, the same technique is used to study sedimentation in Al2O3 and TiO2 Nanofluids at 1, 0.5, 0.1, 0.05, and 0.01 wt.% of concentration. The sedimentation analysis is carried out by taking the nanofluid samples in a borosilicate glass measuring cylinder of 100 ml capacity. The samples were put in a static condition for 7 days during which photographs of all the samples were captured in 24 h of a time interval. The ambient temperature was recorded which was 25°C during the experiment. The change of sediment height for 7 days was captured in sedimentation photographs. Visual observation sometimes is not precise due to the bright or dark appearance of nanofluids such as TiO2 or CNT-based nanofluids. In this context, the Zeta potential (ξ) and DLS method are convenient ways to evaluate the stability of nanofluids. Therefore, zeta potential (ξ) and DLS techniques were further used to determine the stability of nanofluids along with the visualization method.
Stability analysis of nanofluids by zeta potential measurement
The zeta potential (ξ) is an important parameter to evaluate the stability of nanofluids. Talaei et al. 50 measured zeta potential to evaluate the stability of CNT nanofluids. Rajan et al. 51 used Zitasizer to estimate the zeta potential of CuO-water nanofluids stabilized with CTAB surfactant. In general, Nanofluids with ξ values ±60 mV have long-tern stability, more than ±30 mV are physically stable, lower than ±20 mV have low stability and below ±5 mV are unstable and ready to agglomerate. 38 Nanofluid samples immediately after preparation were taken to Zitasizer (Malvern Instruments, USA) instrument for zeta potential measurement. The zeta potential of nanofluid samples was calculated from electrophoretic mobility of dispersed nanoparticles applying Henry’s equation. The zeta potential is presented here as the average of six consecutive repetitions.
Stability analysis of nanofluids by dynamic light scattering (DLS) method
The DLS technique measures the hydrodynamic diameter of nanoparticles or nanoclusters over a wide range of particle sizes utilizing a variation of intensity of scattered light due to the Brownian motion of nanoparticles. Several researchers used the DLS technique to evaluate the dispersion stability of Al2O3, TiO2, CNT, CuO nanofluids.52–55 Zetasizer was used to measure the cluster size of nanofluids at different wt.% using DLS (Dynamic light scattering) technique. DLS technique has applied twice in this experiment immediately after the end of synthesis and 7 days later from preparation. The change in DLS data provides a clear view of the stability of nanofluids. Each DLS measurement was carried out six times for repeatability and the average value is considered in the analysis.
Data processing and analysis
Depending upon the sedimentation type, three types of settling behaviors of nanofluid are observed such as dispersed sedimentation, flocculated sedimentation and mixed sedimentation which are illustrated in Figure 2. 56 Generally, dispersed sedimentation is observed in dilute nanofluids where the sediment height increases gradually with time. Flocculated sedimentation is shown by nanofluids with a higher concentration of nanoparticles and sediment height decreases with time. Flocculated sedimentation can only happen above a critical concentration of nanofluids. In mixed-type sedimentation, both of the previous phenomena occur together. The rate of sedimentation in nanofluids is measured using the following formula considering sediment height or sediment volume:
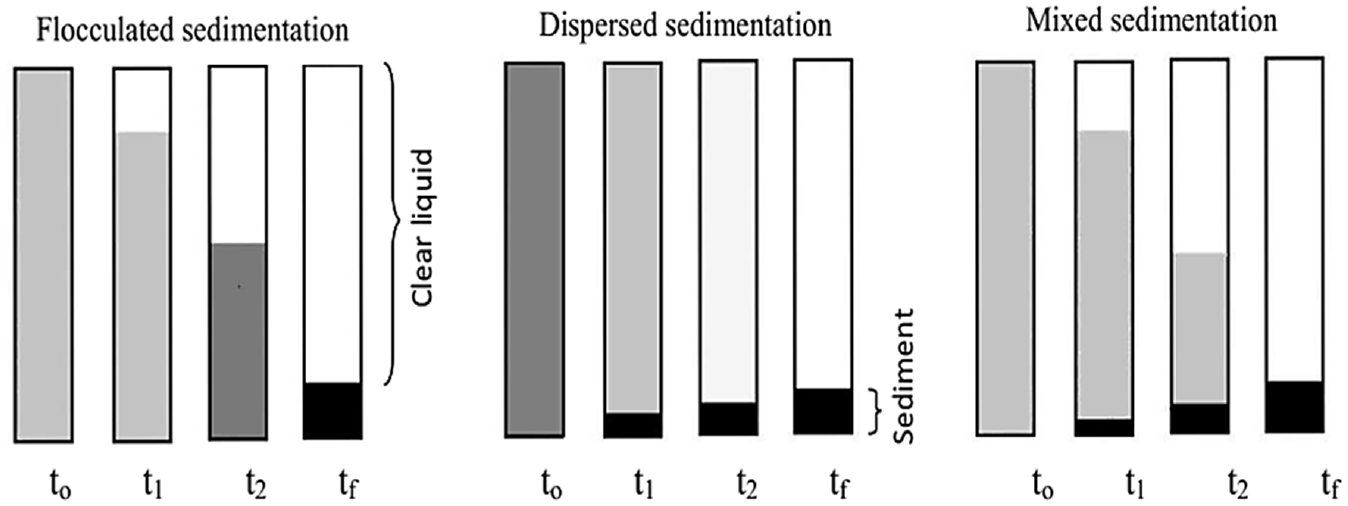
Different types of sedimentation behavior of nanofluids at different time intervals (to<t1<t2<tf). 42
Where
Suffix c and t denote the clear solution and total volume respectively.
The sedimentation rates in Al2O3 and TiO2 nanofluids were estimated by taking the ratio of sediment height to nanofluid height as shown in equation (2).
Theoretically, the sedimentation of nanoparticles under gravity is governed by Stroke’s Law as shown in equation (3) 34 :
Where, ut is terminal velocity (m/s) of nanoparticles, g denotes acceleration due to gravity (m/s 2 ), dnp is diameter (m) of the particle, ρ and µ denotes density (kg/m3), and viscosity (mPa·s) respectively.
Suffix np and f denote nanoparticle and basefluid.
Stokes law is only valid for Re < 1 and Re is Reynold’s number which is defined as:
However, in practice, the sedimentation velocity is calculated by using the equation (5), provided the acceleration at the start of fall is neglected.
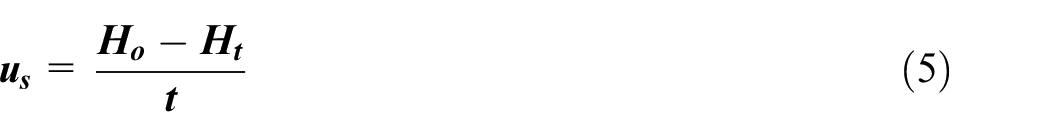
Where us is designated as the sedimentation velocity (m/s).
Ho and Ht denote the initial height of nanofluid and height of nanofluid after time t.
To compare theoretical terminal velocity to its practical counterpart, equation was obtained by using equations (5) and (3) as shown below:
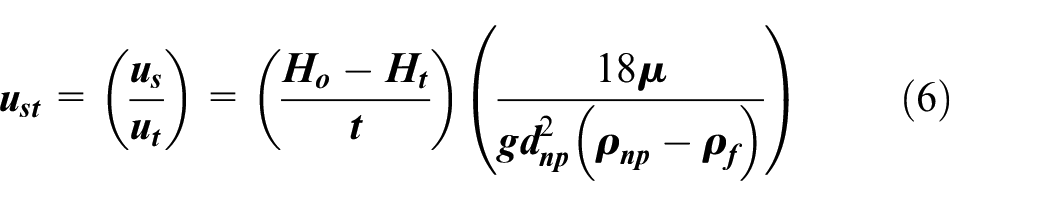
Where
Random agitation due to Brownian motion of dispersed nanoparticles is a regular dominant molecular phenomenon in nanofluids. During Brownian motion creates a stirring effect stops particles to settle down under gravity. Therefore, more randomness means more stability of nanofluids. The velocity of nanoparticles due to Brownian motion can be determined by equation (7). 57
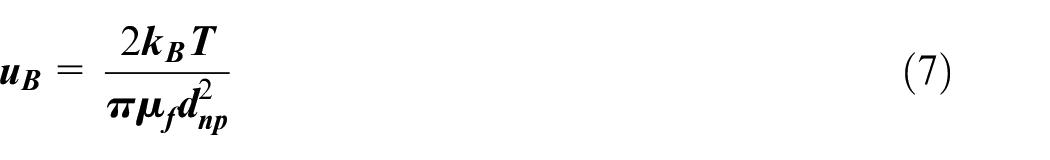
Where,
A decrease in particle size is suitable for an increase in Brownian velocity and a decrease in settling velocity.
A ratio of sedimentation velocity to Brownian velocity will measure the effect of Brownian motion on the stability of nanofluids. Thus, to obtain the ratio, the equation (5) is divided by equation (7) and the following equation is obtained:
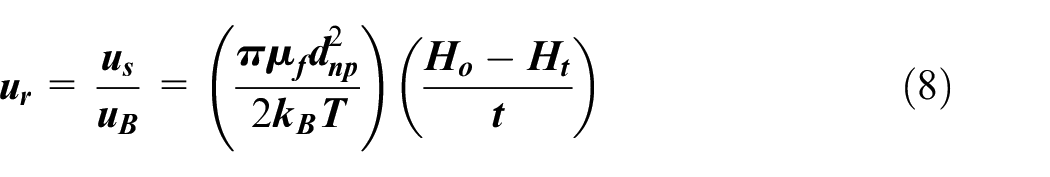
Where, ur is the ratio of sedimentation velocity (m/s) to Brownian velocity (m/s) of nanofluids.
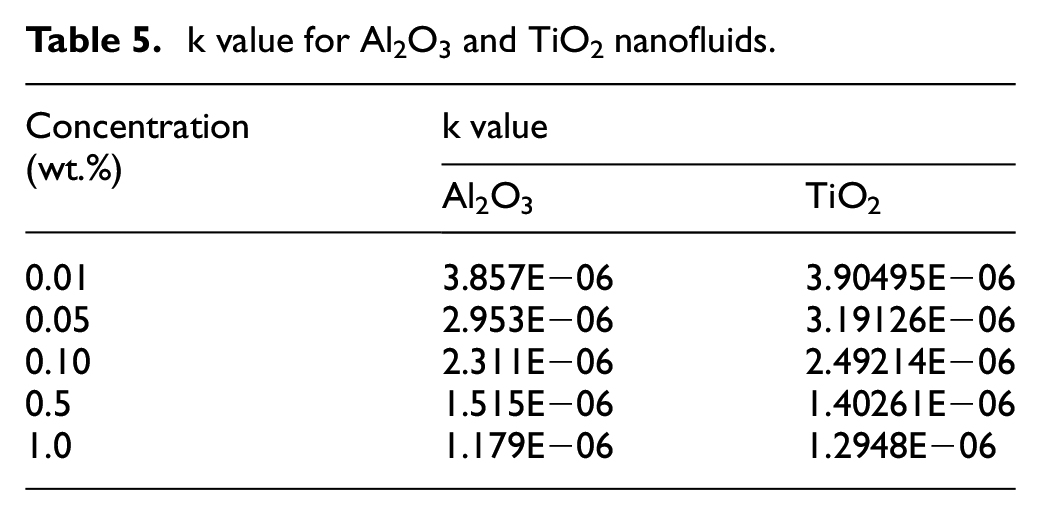
Brunelli et al. 58 calculated sedimentation rate in nTiO2-water nanofluids using a fluorescence spectrophotometer. In that case, the sedimentation rate was estimated by using first-order decay equation:
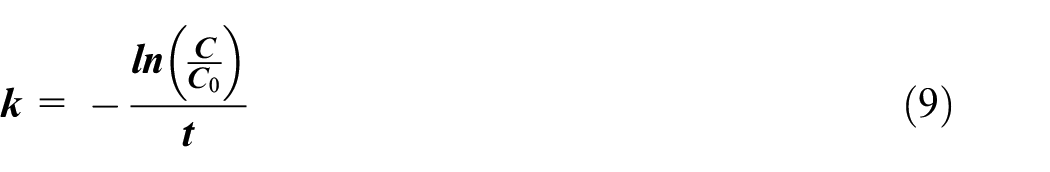
Where, k is the first order sedimentation rate constant. C is the concentration (g/l) at time t (s) and Co is the concentration (g/l) at time to (s)
When the concentration (g/l) of nanofluids is assumed to be uniform throughout the setting cylinder, then the concentration at any time t can also be expressed as the following way:
Where,
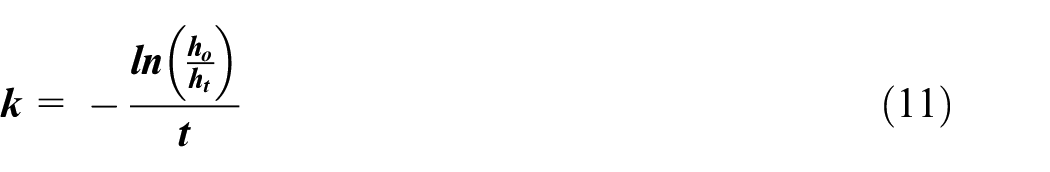
From equations (9) and (10)another equation is derived (equation (11)) to calculate the first order sedimentation rate constant (k).
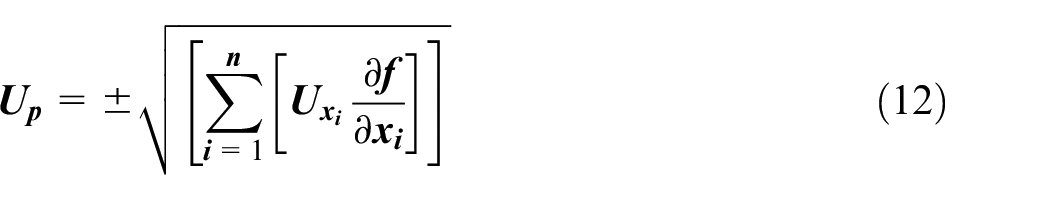
Uncertainty analysis
Uncertainty of measured parameters was analyzed considering random errors, as the systematic error is negligible compared to random error. All the measured parameters presented in the graph as mean ± standard deviation. The uncertainty of height ratio, sedimentation velocity, sedimentation velocity to terminal velocity ratio, sedimentation velocity to Brownian velocity ratio, sedimentation profile and rate constant has been calculated using the formula and the calculated value is within ±5.56%.
Where
Results and discussions
Microstructural characterization of nanoparticles
The SEM micrographs of Al2O3 and TiO2 nanoparticles are shown in Figure 3(a) and (b) which shows that nanoparticles are in the agglomerated state. The agglomeration is may be due to the high surface energy of nanoparticles than microparticles. The TEM micrograph of Al2O3 and TiO2 nanoparticles are presented in Figure 4(a) and (b). The TEM micrographs show that the nanoparticle is nearly spherical in shape. The average size of the nanoparticles is estimated by analyzing the micrographs by Imagej software and it is found that the average size of nanoparticles for Al2O3 is 25 ± 0.5 nm and for TiO2 it is 20 ± 0.5 nm. The size distribution of nanoparticles for both Al2O3 and TiO2 is shown in Figure 5(a) and (b) respectively. It depicts the maximum distribution of nanoparticles is 25 nm in size for Al2O3, whereas for TiO2 it is 20 nm in size.
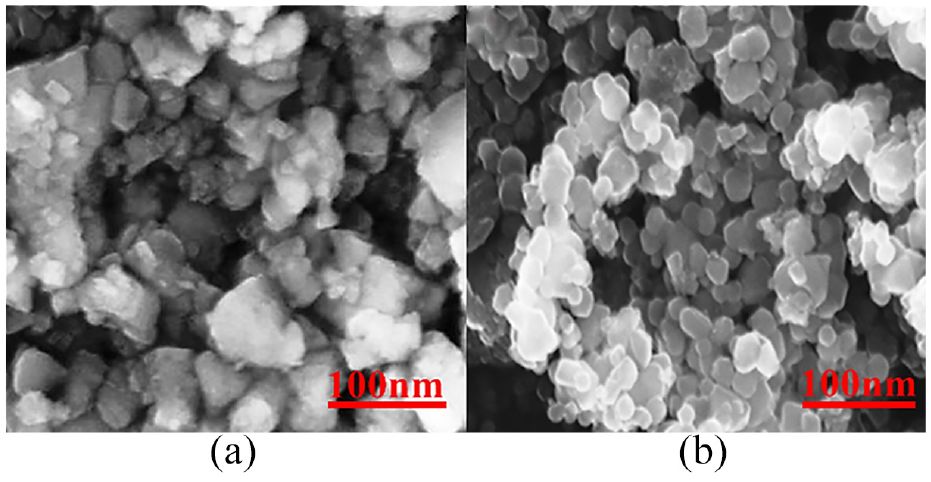
SEM image of (a) Al2O3 nanoparticles and (b) TiO2 nanoparticles.
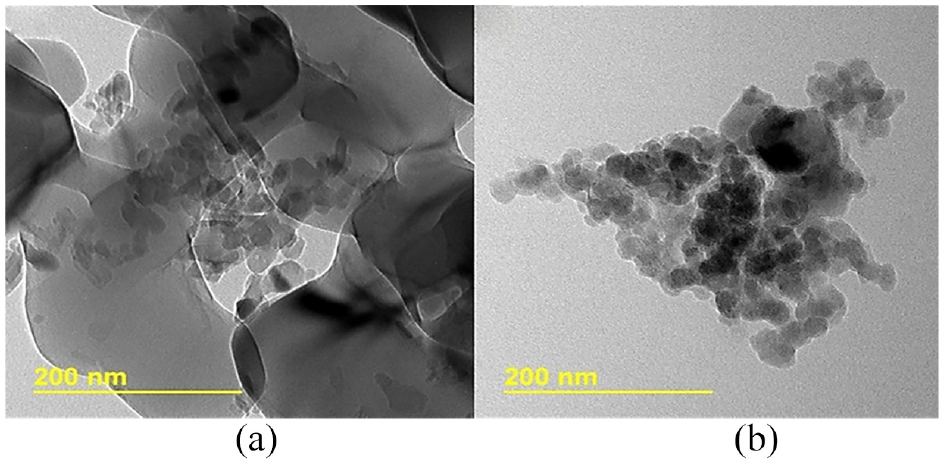
TEM image of (a) Al2O3 nanoparticles and (b) TiO2 nanoparticles.
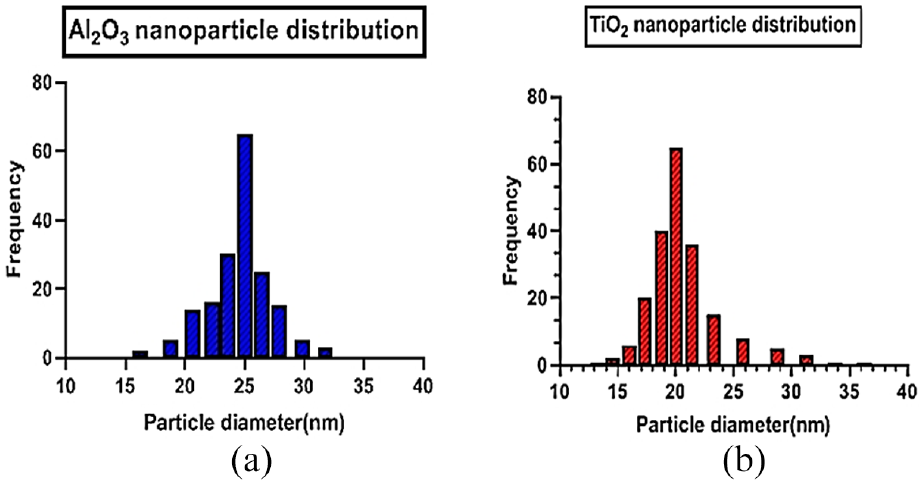
Nanoparticle distribution graphs: (a) Al2O3 and (b) TiO2.
Zeta potential of nanofluids
The measured zeta potential (ξ) values for all nanofluids at different wt.% are shown in Figure 6. It is observed that absolute ξ values are within the range of 30–50 mV for all concentrations irrespective of the material. Therefore, according to the reported ranges, the present ξ values of the test samples indicate good stability in test samples. A large value of ξ means the nanoparticles are far away from their respective isoelectric point which ensures further stability of nanofluids. The ξ value decreased with an increase in the wt.% of nanoparticles. The decrease in zeta potential attributes to the higher sedimentation in increased concentrations. 59 During zeta potential measurement it is assumed that all the samples are at the same pH and temperature since zeta potential varies along with the pH and temperature change.60,61 The ξ of TiO2 nanofluids were found to be more than Al2O3 which means the TiO2 nanofluids are more stable as compared to Al2O3 nanofluids. The reduced particle size of TiO2 may be the prime factor behind such a trend. In a nutshell, the prepared nanofluids are having good stability in this experiment.
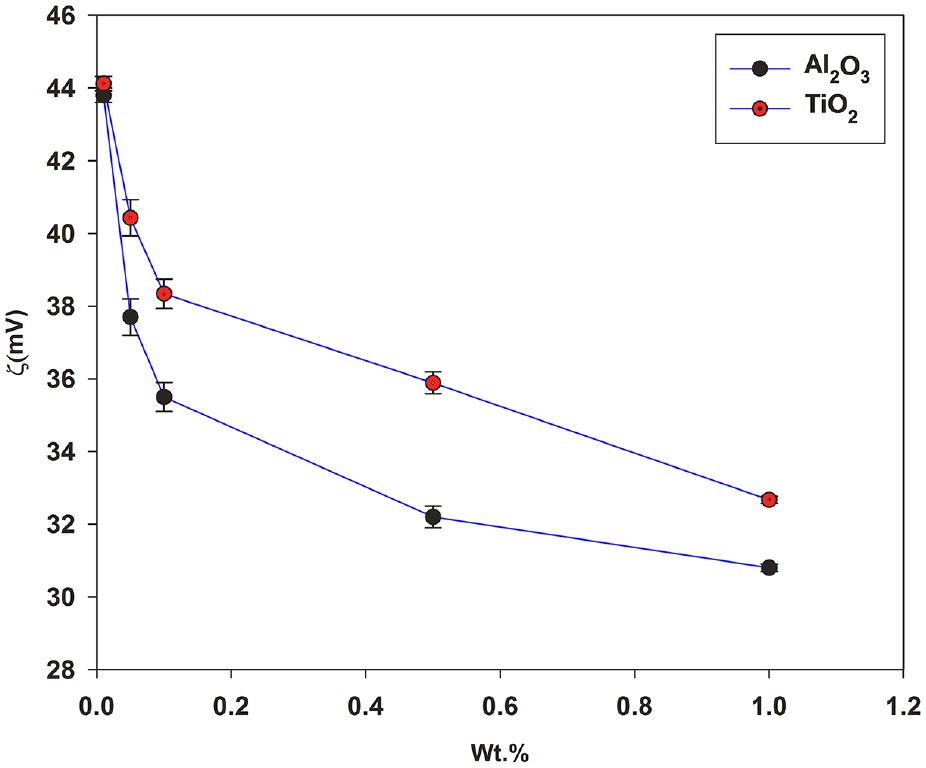
Zeta potential of Al2O3 and TiO2 nanofluids at different wt.%.
Dynamic light scattering (DLS) of nanofluids
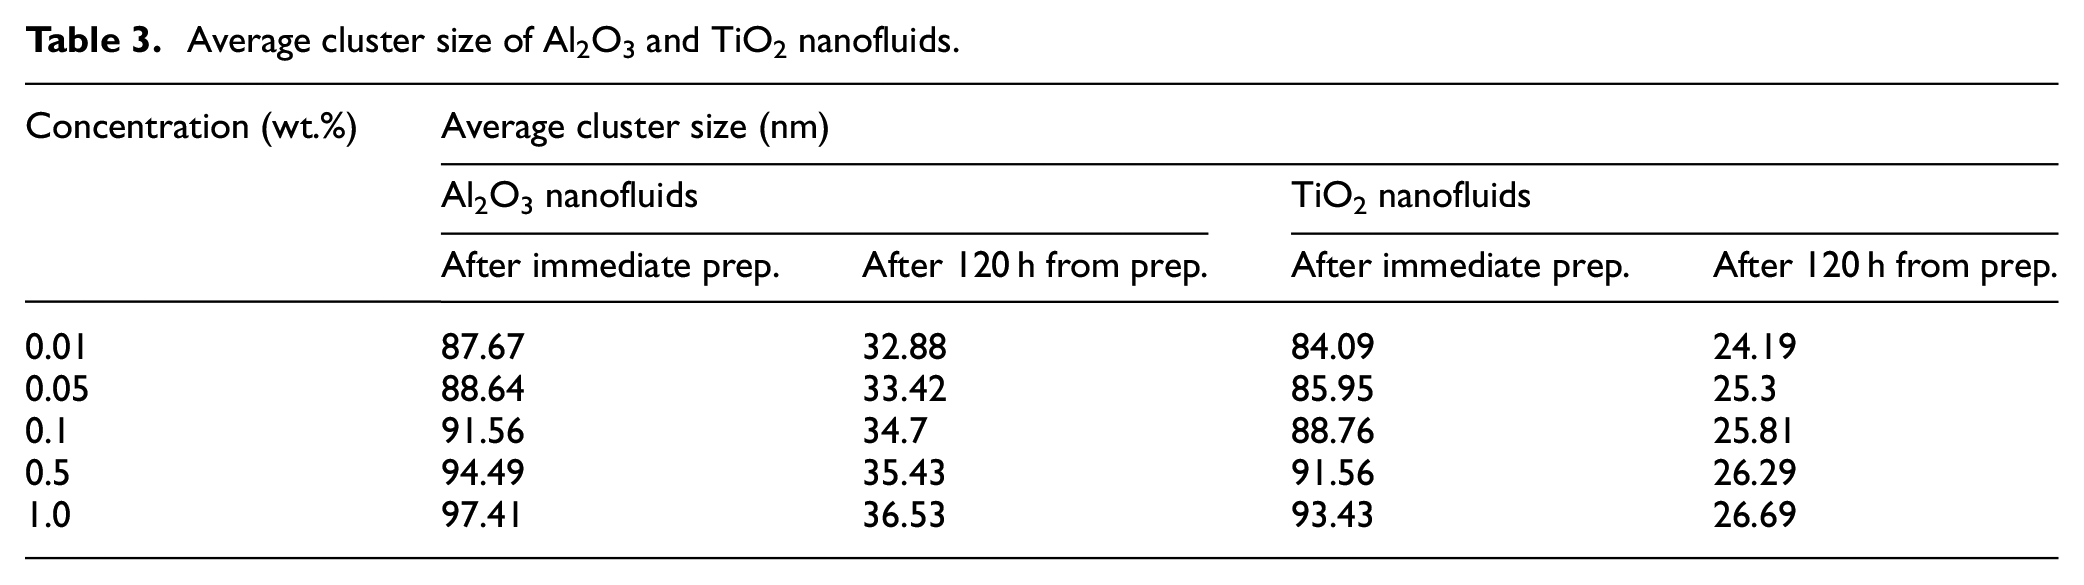
The results of DLS measurements of Al2O3 and TiO2 nanofluids just after the synthesis and after 7 days from synthesis are shown in Figure 7(a) and (b) respectively. This figure shows that the average cluster size of nanoparticles increases with an increase in concentration which is in line with the dataset listed in Table 3. A similar observation was also reported by Byrne et al. 62 where the increase in particle agglomeration takes place with a rise in particle concentration. The figures also describe that the average cluster size decreases with the number of days. It is found from the literature that the reason for this observation is may be due to the detection of only smaller nanoparticle, which is free inside the fluid through particle scattering method, whereas the heavier nanoparticles aggregates with the course of time.
Average cluster size of Al2O3 and TiO2 nanofluids.
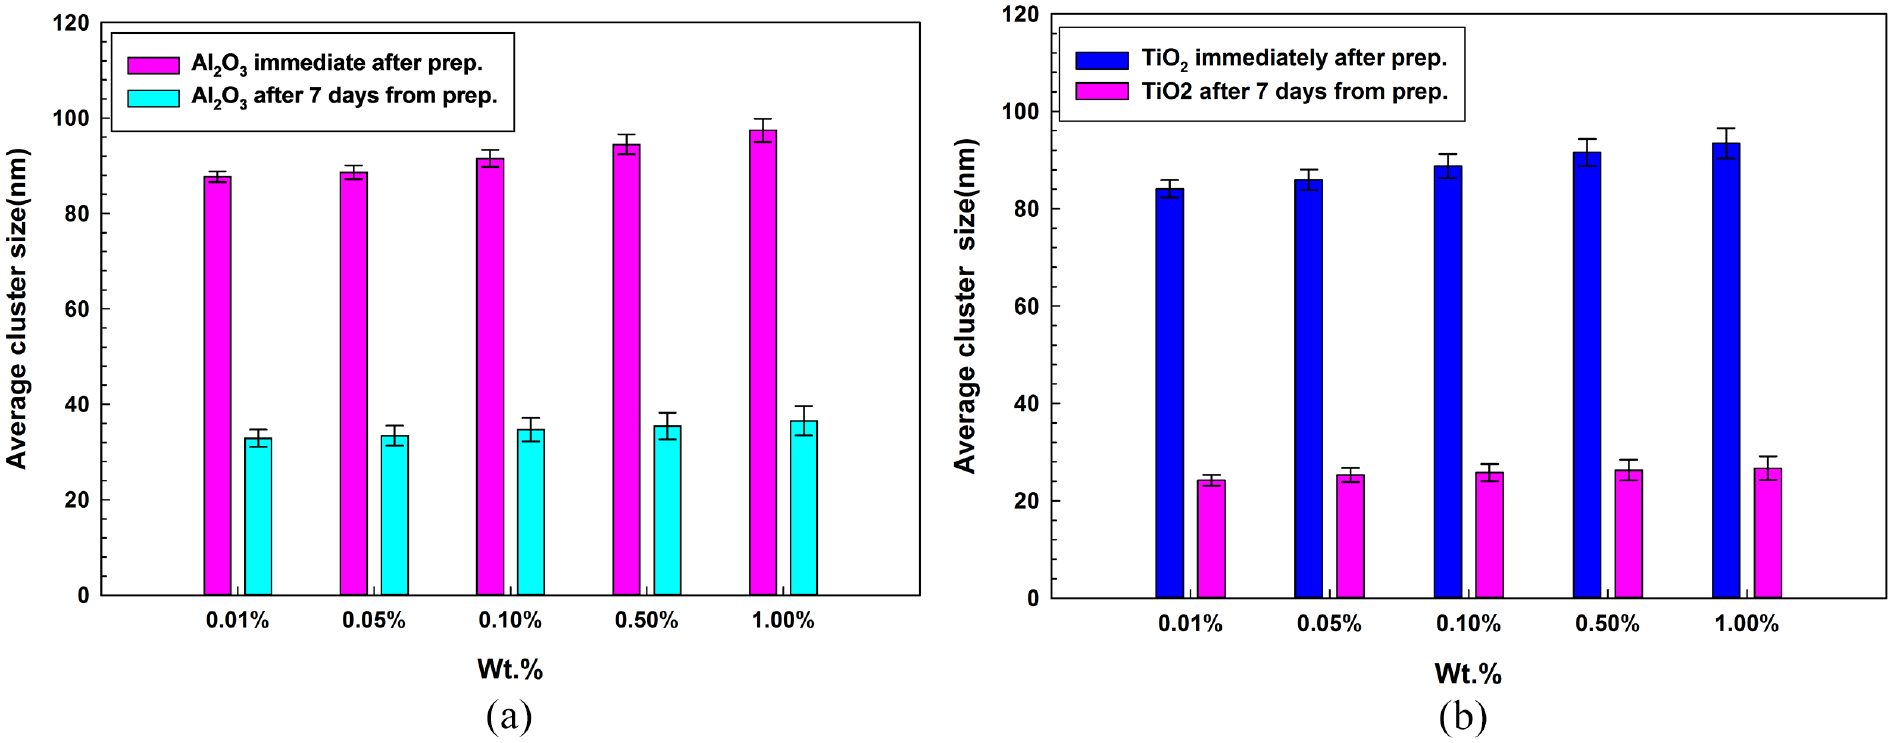
Average cluster size of nanoparticles: (a) Al2O3 nanofluids and (b) TiO2 nanofluids at different wt.%.
Sedimentation analysis in nanofluids
The visualization of the batch sedimentation process from just after the preparation of nanofluids and 7 days afterward is shown in Figure 8(a) to (d).As no surfactant was added, it was obvious that sedimentation will start with the aging of nanofluids. It is found that the nanofluid samples show dispersed sedimentation which is obvious at the present concentrations. The sediment height increases with time. Initially, insignificant sedimentation was observed for 24 h, but it gradually intensifies after 72 h. After 168th hours good amount of sedimentation was observed. The increase in sediment height is a concentration-dependent phenomenon. Nanofluids with higher concentrations show more sedimentation as compared to lower concentrations. It is evident from the Figure 8(a) to (d), that sedimentation of Al2O3 and TiO2 Nanofluids are in the increasing order of 0.01, 0.05, 0.1, 0.5, and 1 wt.%. The present sedimentation characteristics exhibited by nanofluids in correspondence with the zeta potential and DLS test data of nanofluids. In this case, also, TiO2 nanofluids show better stability than Al2O3 nanofluids. This behavior due to the decreased particle size in the case of TiO2, smaller particle size shows better stability as compared to larger particle size.
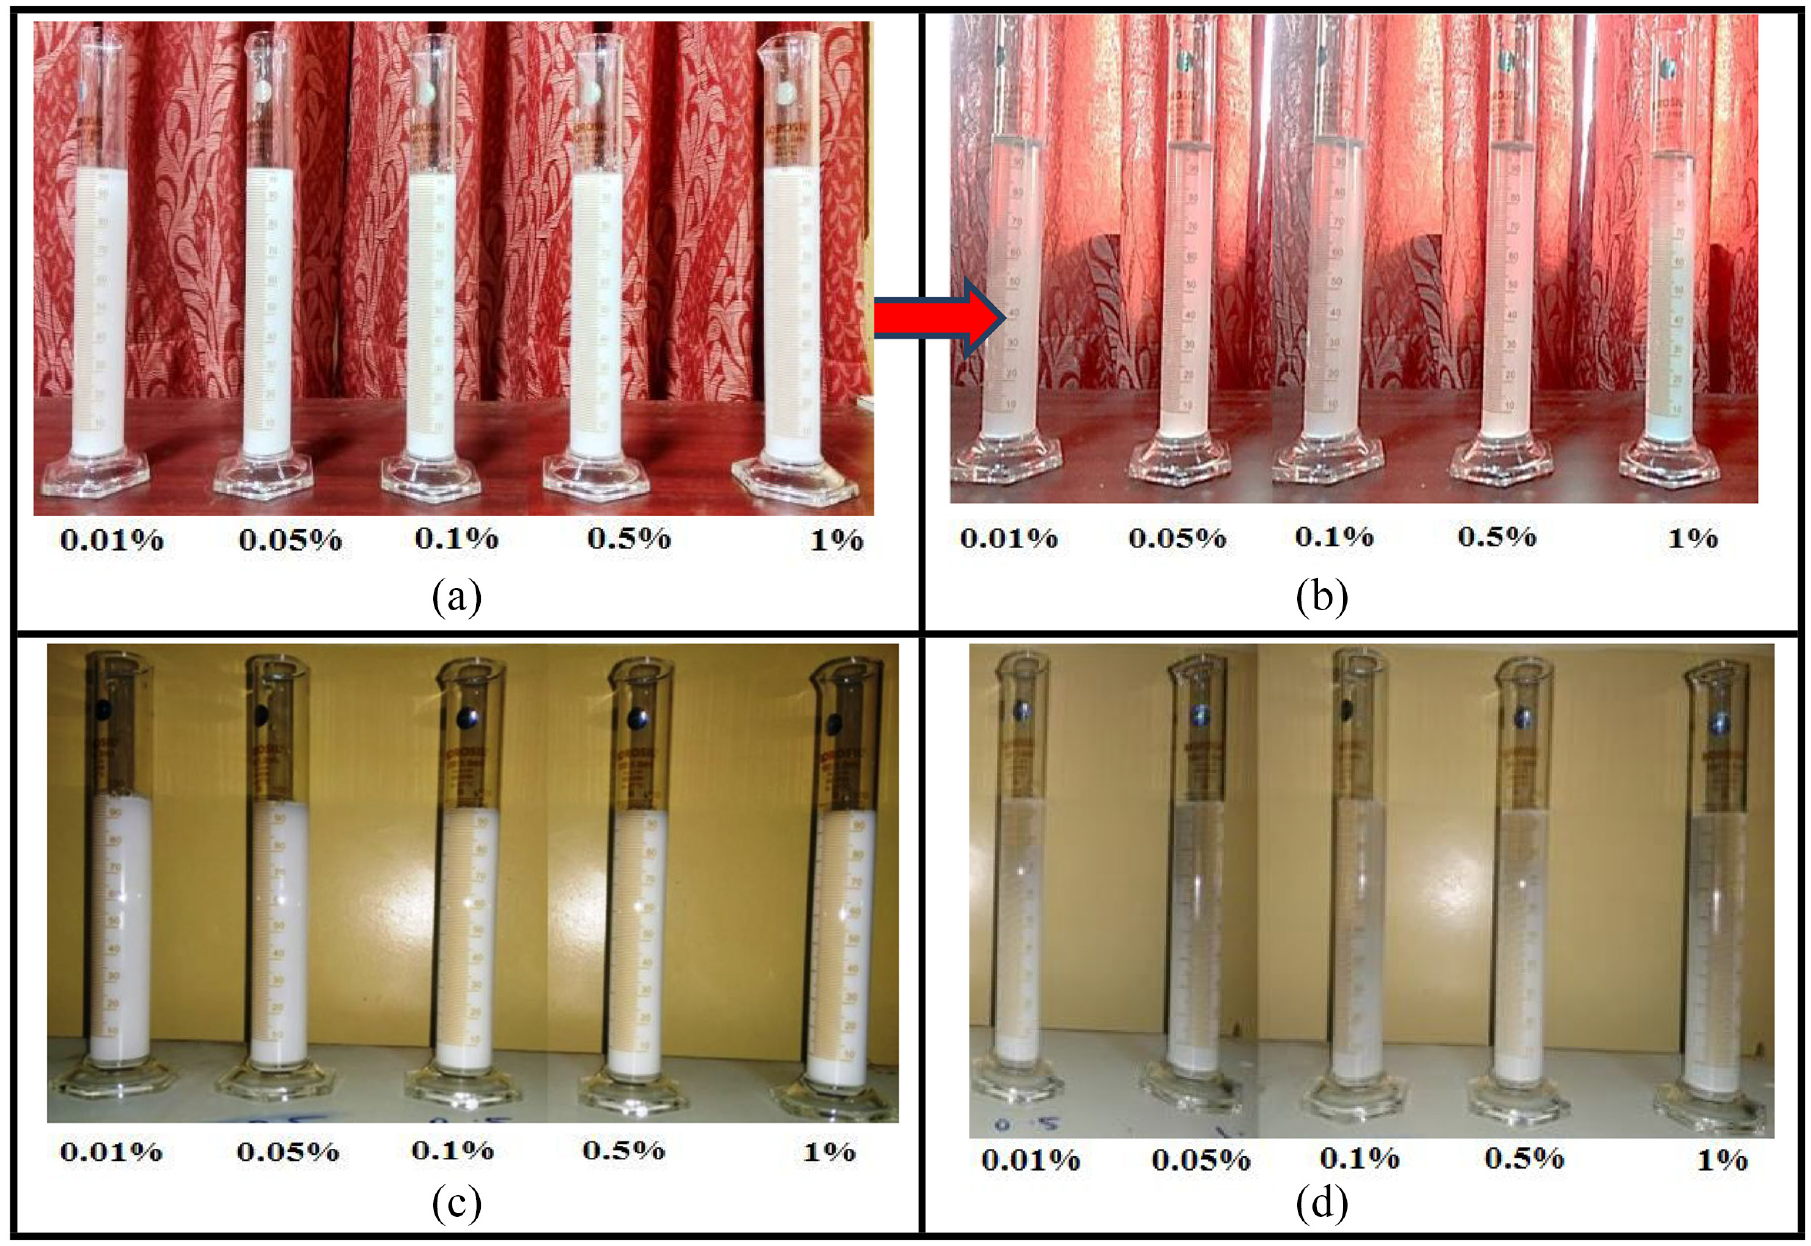
Sedimentation in nanofluids at different wt.%: (a) Al2O3 nanofluids just after the preparation, (b) Al2O3 nanofluids after 7 days from preparation, (c) TiO2 just after the preparation, and (d) TiO2 nanofluids after 7 days from preparation.
Sedimentation height ratio (S)
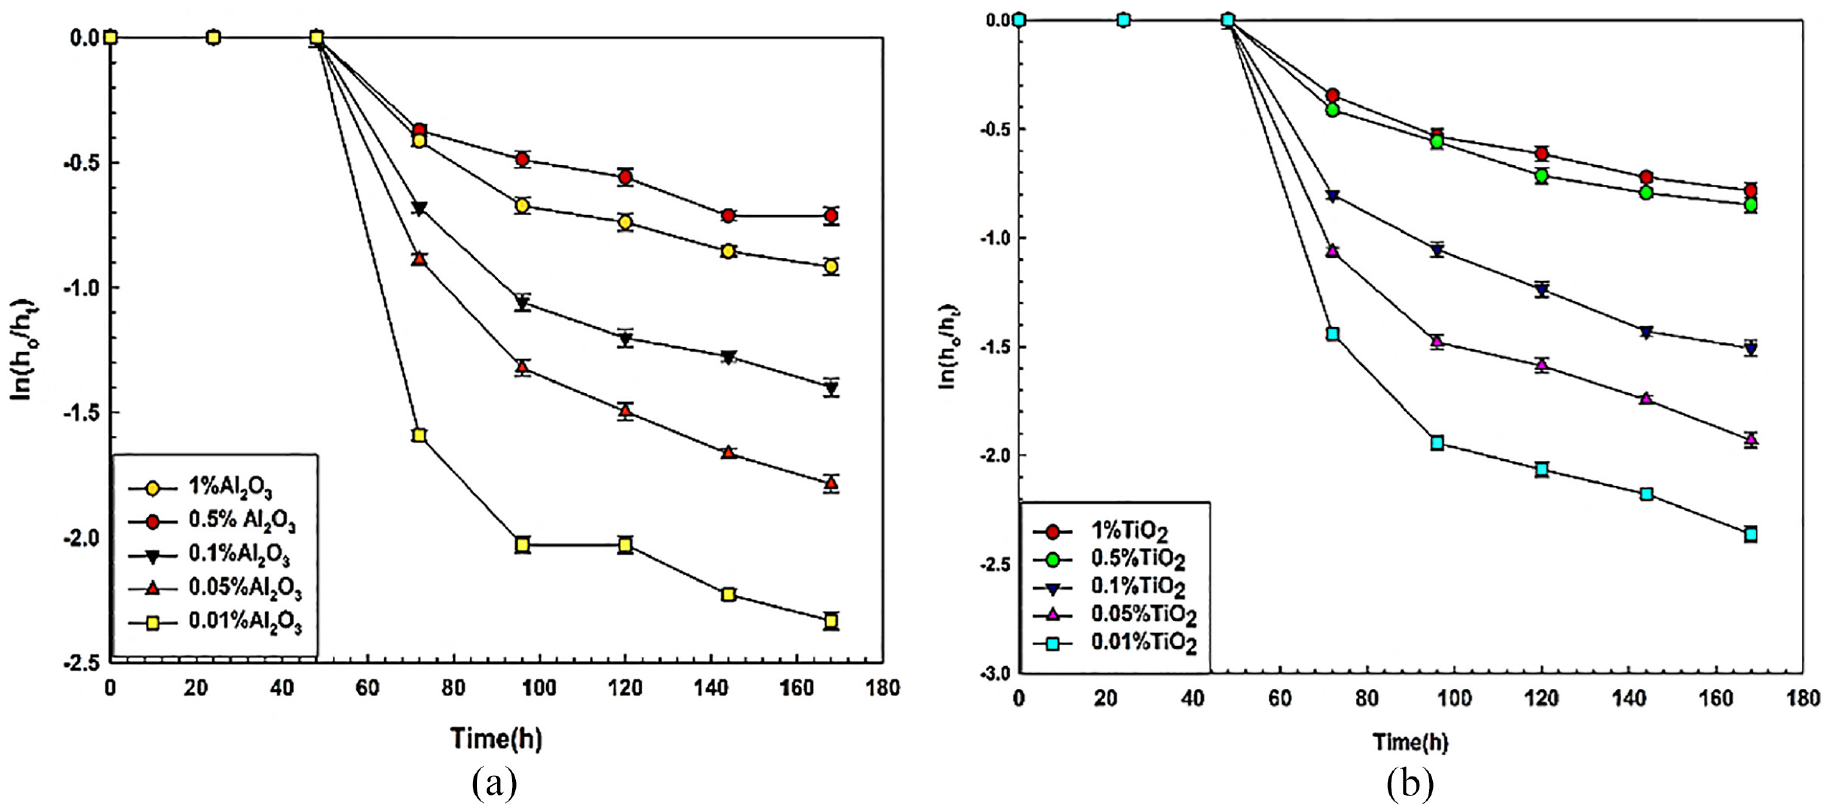
Sedimentation height ratio (S) in all nanofluids has been estimated using equation (2) and shown in Figure 9(a) and (b). This figure shows the variation of sedimentation height ratio of Al2O3 and TiO2 nanofluids with time at varying concentrations of 1, 0.5, 0.1, 0.05, and 0.01 wt.%. According to the figures, the sediment height ratio increases with nanoparticle inclusion in basefluid and also with time. It is observed that the ratio is highest for 1 wt.% and lowest for 0.01 wt.% for both types of nanofluid but in the case of 0.01 wt.% of alumina blended nanofluid, it is observed that the sedimentation height ratio curve is not smooth enough. This reason may be due to the fluctuation in the discrete sedimentation process because of very low nanoparticle concentration. The sedimentation height ratio is dependent on the concentration of nanofluids that is, nanofluids having more amount of nanoparticles show the highest sedimentation than that of less amount of nanoparticles. The probability of collision among nanoparticles in Brownian motion gets intensified due to the presence of more particles in high concentration.63–65 Based on the sediment height ratio, the overall stability of TiO2 nanofluids is found to be more than Al2O3 nanofluids. Lowering the nanoparticle concentration is fruitful to obtain better dispersion stability of nanofluids. It also helps to lower the pumping power loss by lowering the density and viscosity of nanofluids.
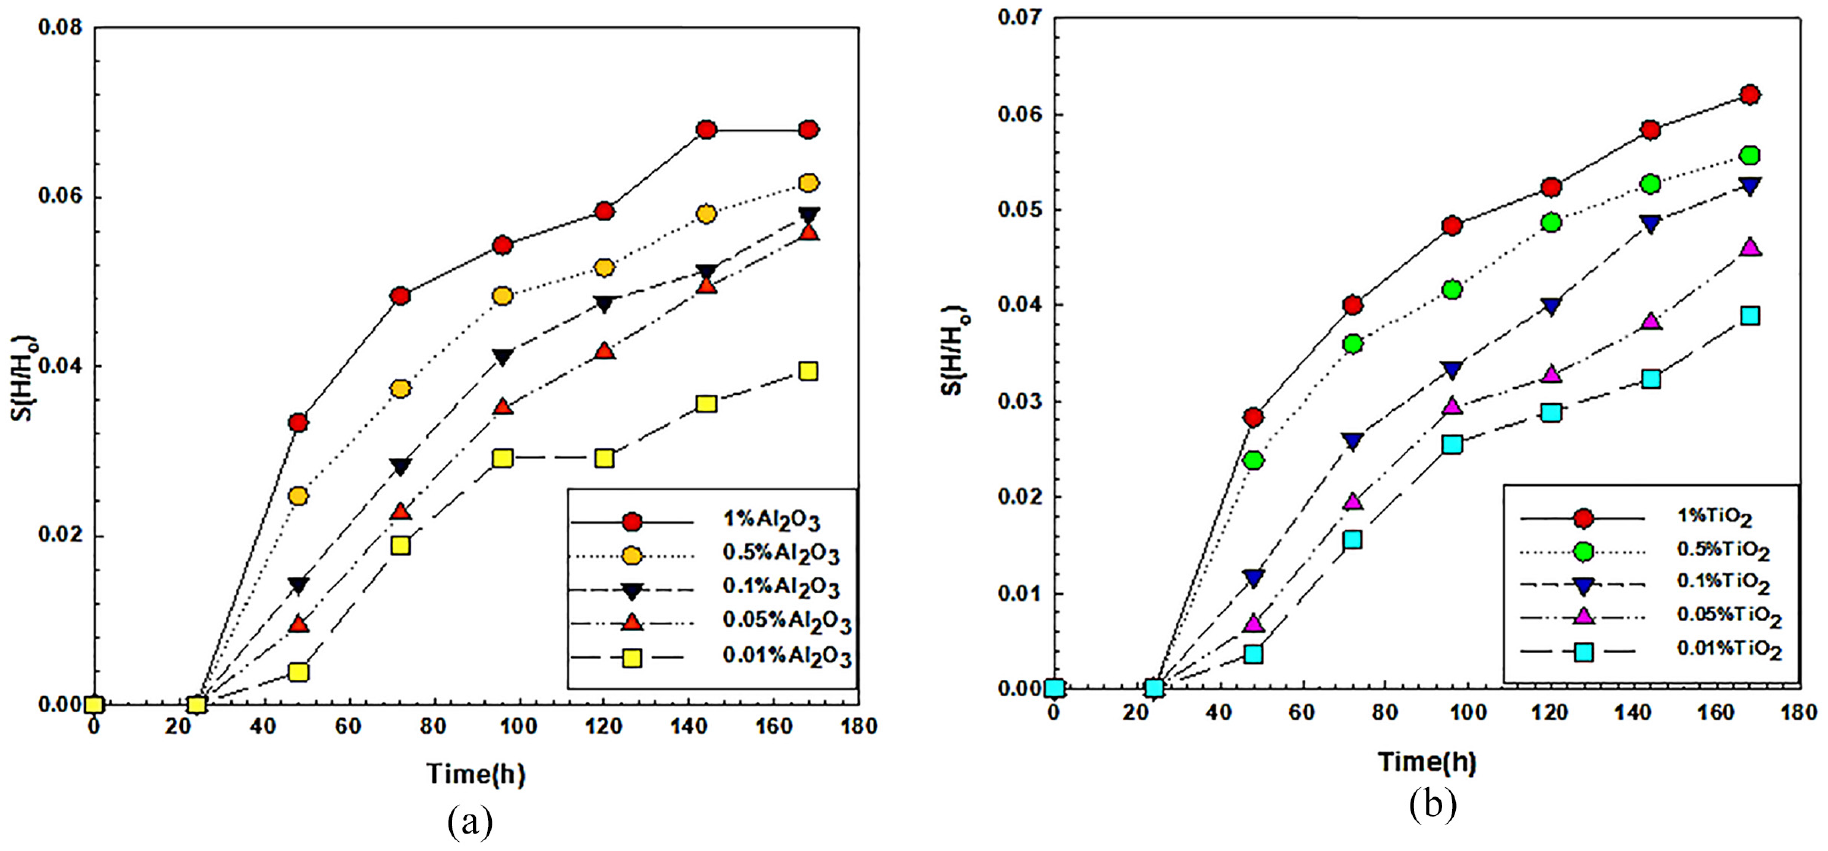
Sedimentation height ratio of nanofluids: (a) for Al2O3 and (b) for TiO2.
Sedimentation velocity
The temporal variation of sedimentation velocity
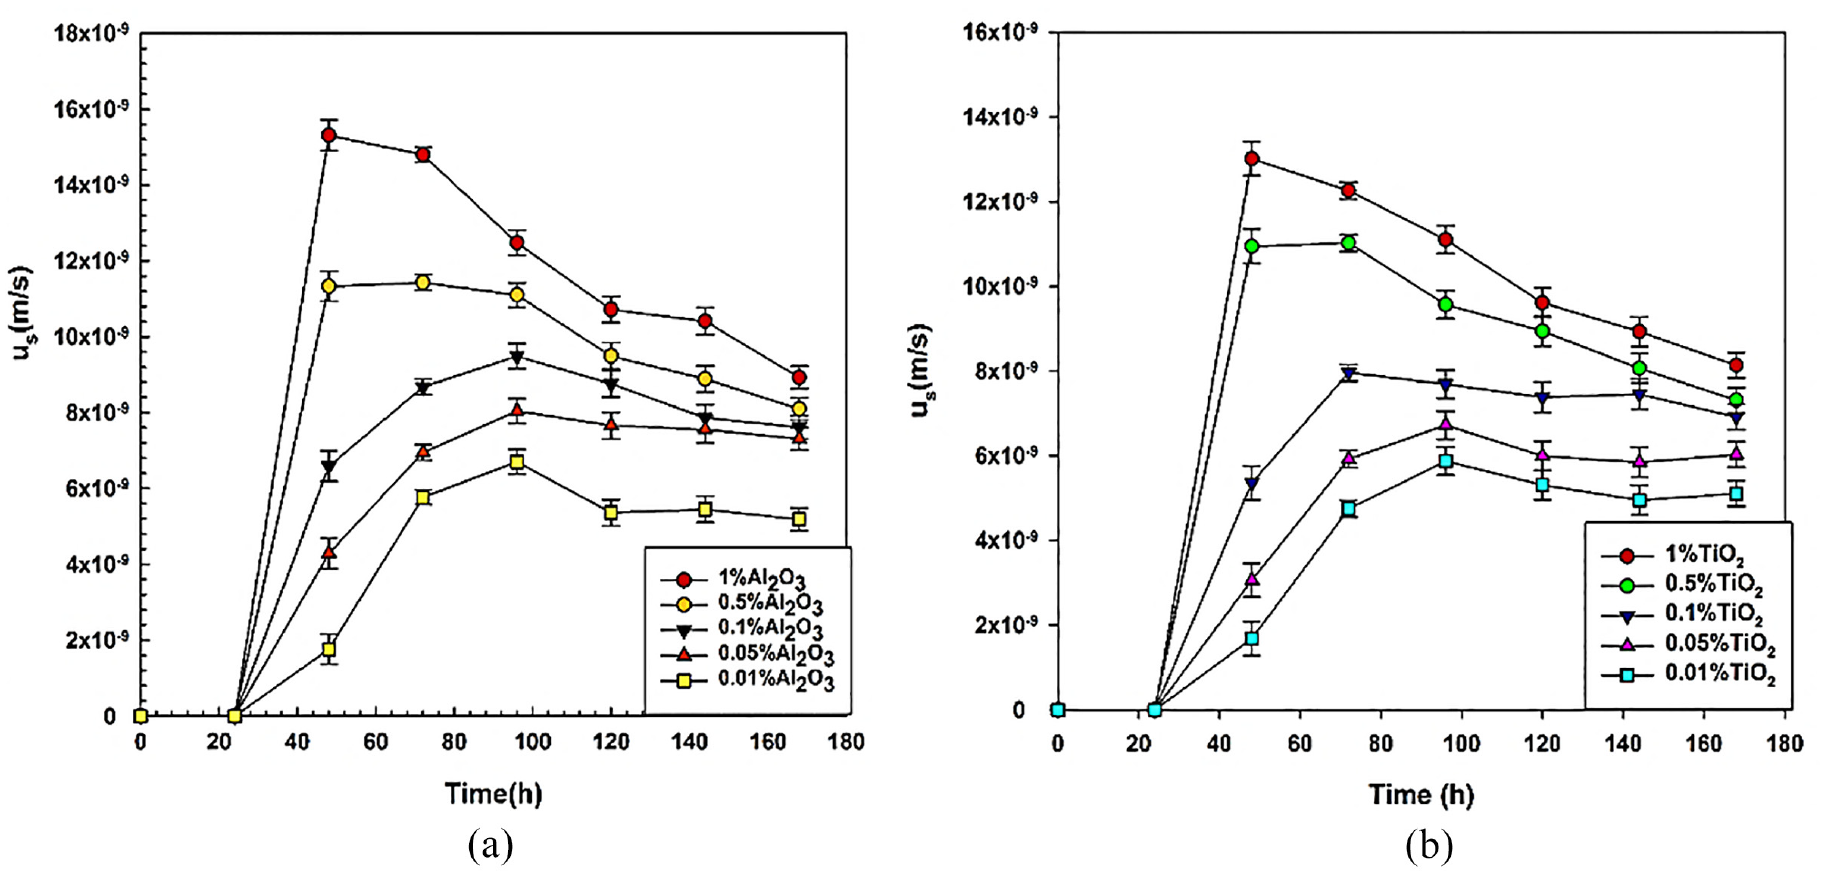
Sedimentation velocity of nanofluids: (a) for Al2O3 and (b) for TiO2.
Ratio of sedimentation velocity to terminal velocity
For a detailed understanding of sedimentation of nanoparticles in nanofluids, the sedimentation velocity to terminal velocity
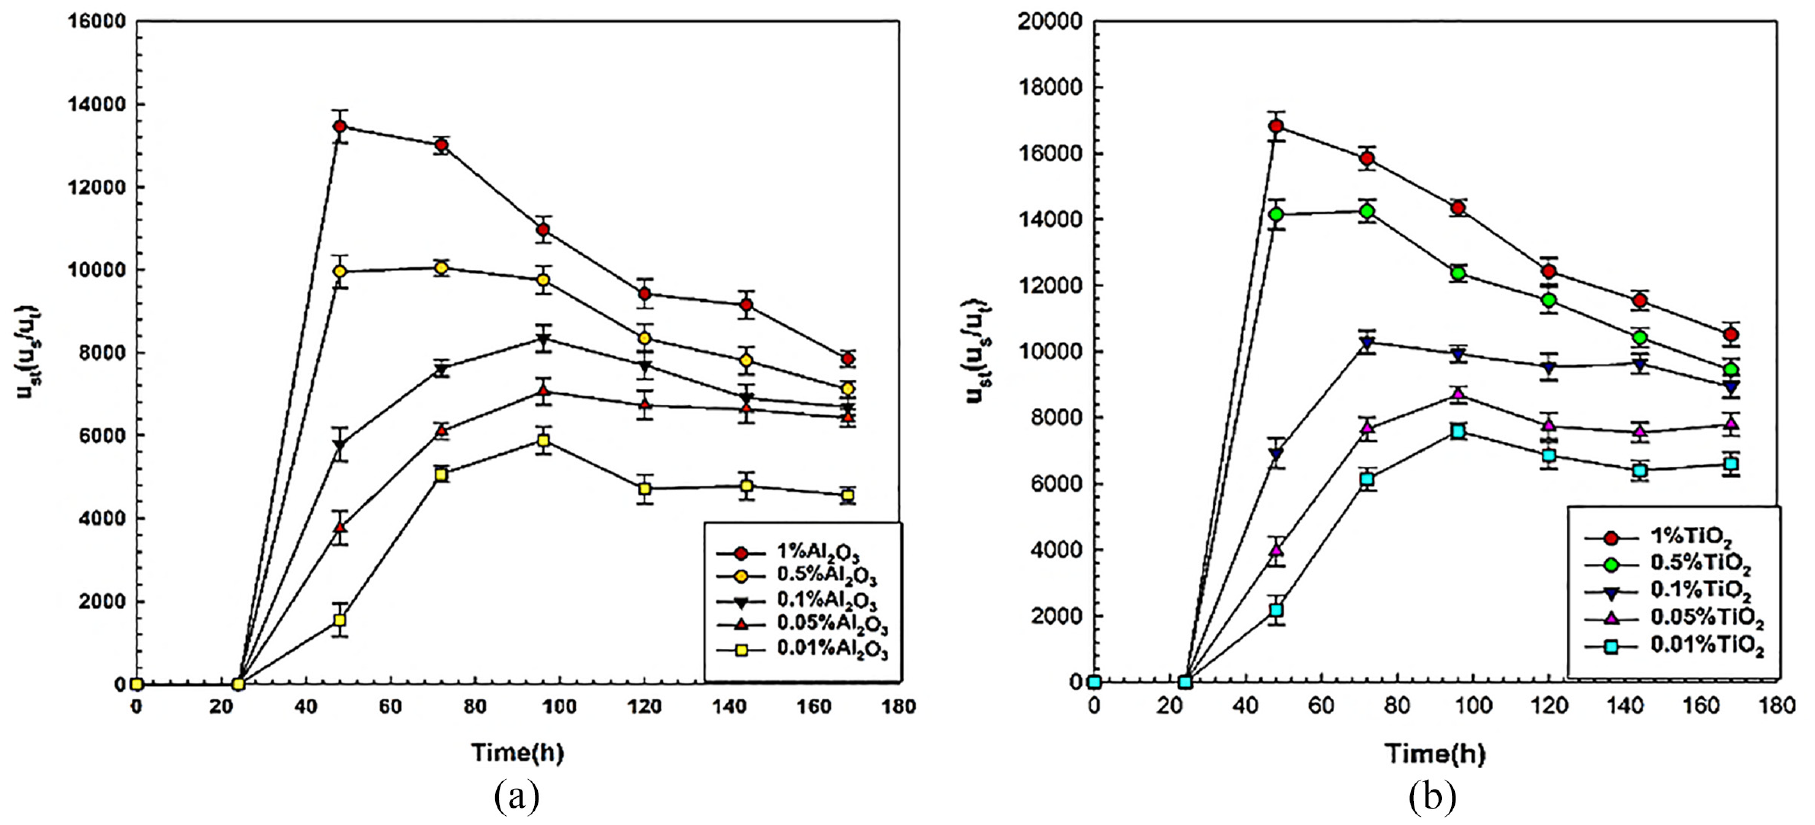
Sedimentation velocity to terminal velocity ratio (ust) of nanofluids: (a) for Al2O3 and (b) for TiO2.
Sedimentation velocity to Brownian velocity ratio
The ratio of sedimentation velocity to Brownian velocity
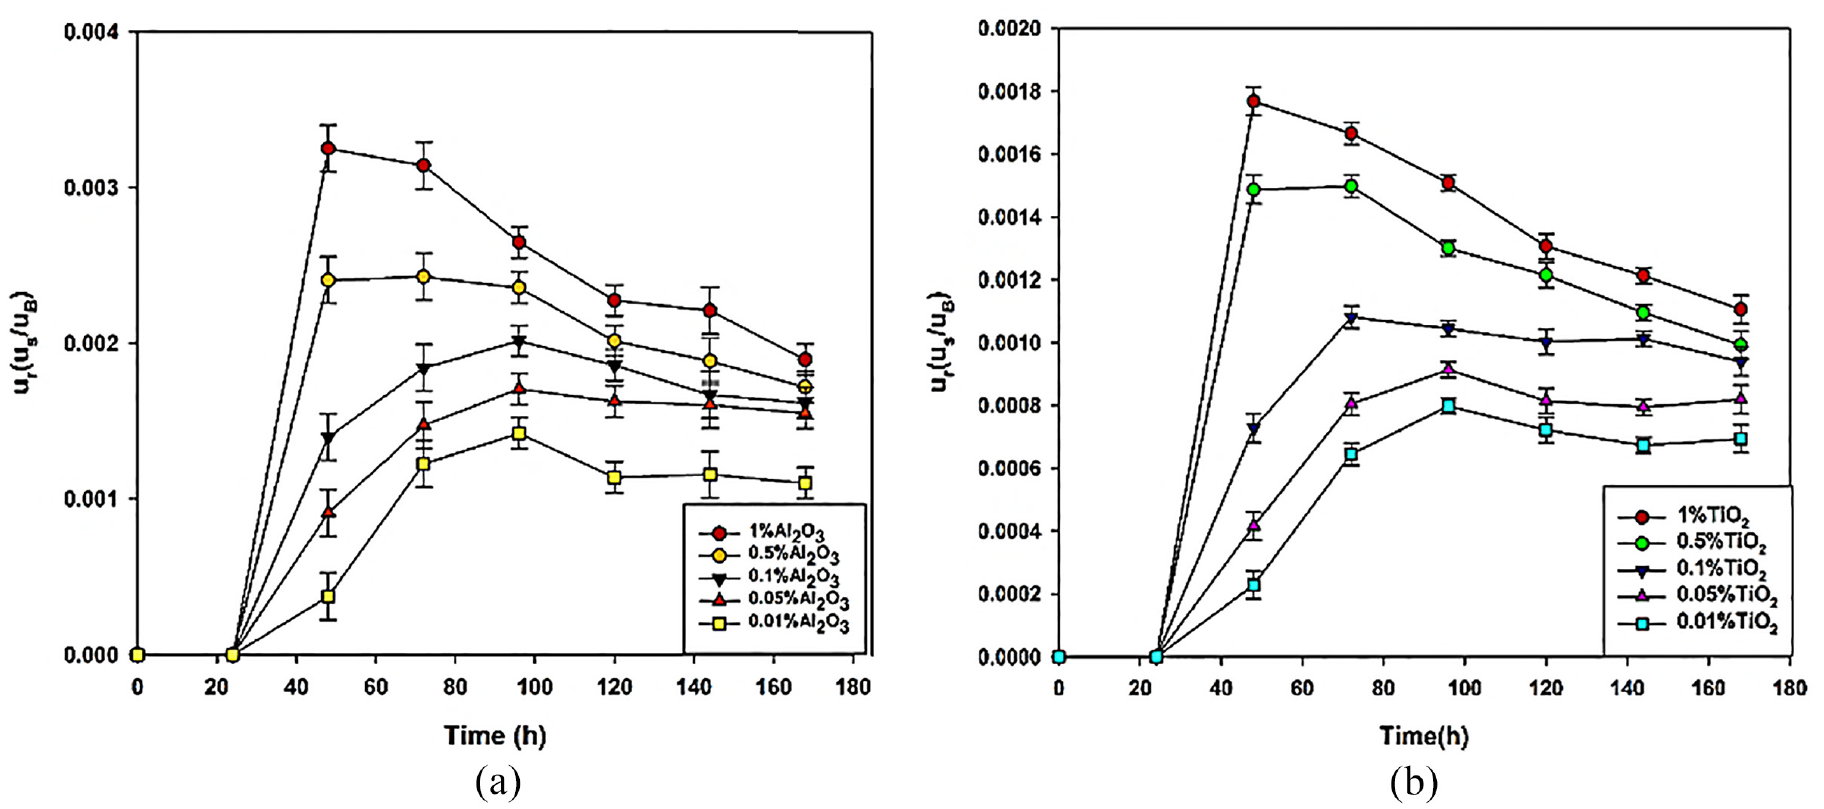
Sedimentation velocity to Brownian velocity ratio (ur) of nanofluids: (a) for Al2O3 and (b) for TiO2.
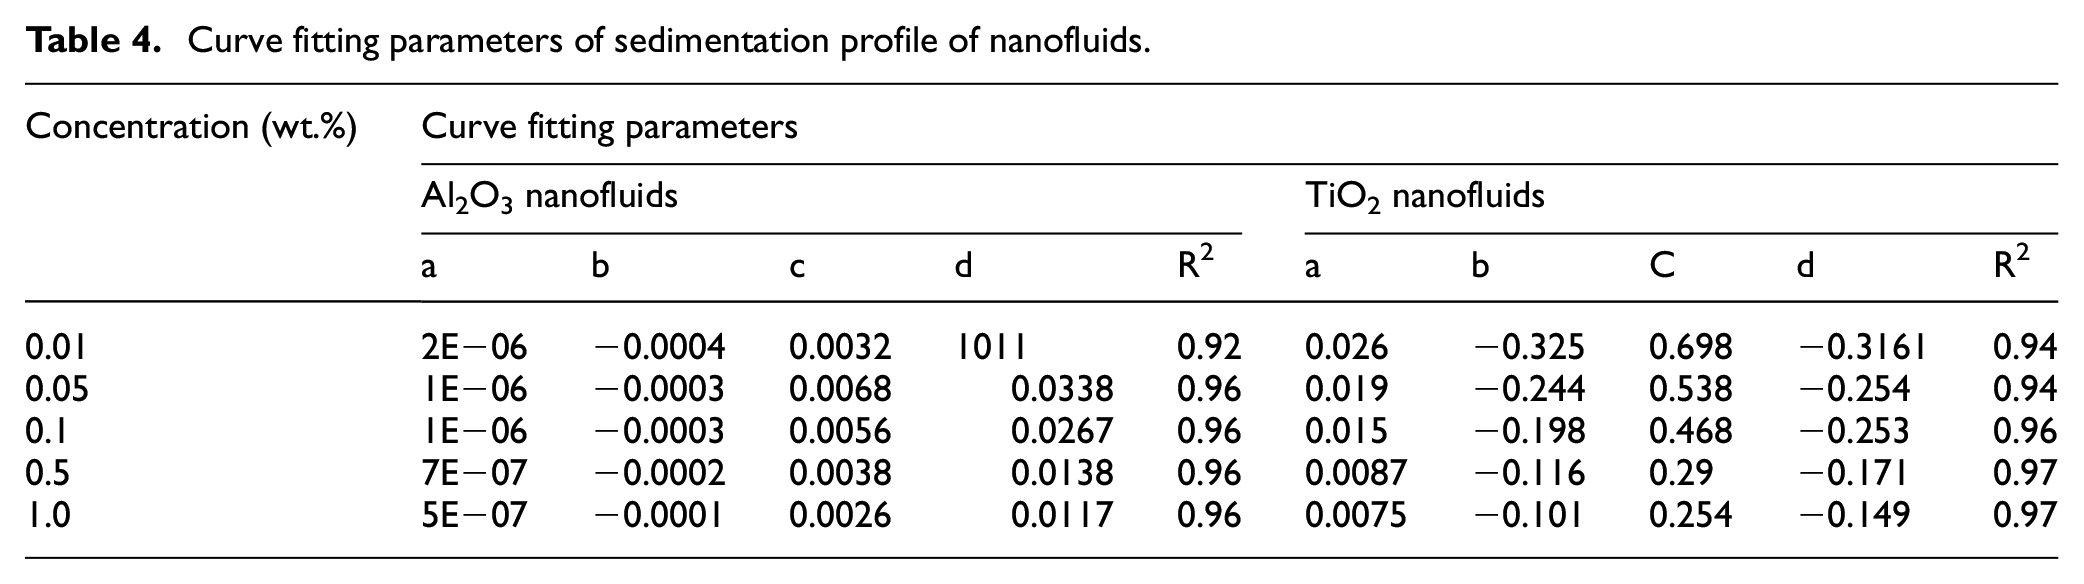
Sedimentation profile and rate constant (k)
The sedimentation profiles of Al2O3 and TiO2 nanofluids with regard to the sedimentation height ratio was obtained by plotting
Curve fitting parameters of sedimentation profile of nanofluids.
k value for Al2O3 and TiO2 nanofluids.
Sedimentation profile of nanofluids: (a) for Al2O3 and (b) for TiO2.
Conclusions
Photograph capturing method followed by Zeta Potential and DLS techniques were used to study the stability characteristics of water-based Al2O3 and TiO2 thermal nanofluids at different concentrations. SEM and TEM characterization were also carried out to analyze the shape, size, and distribution of nanoparticles in the nanofluids. Various empirical relations were considered and derived to analyze the stability of nanofluids and sedimentation of nanoparticles in detail, for different concentrations of nanofluids.
Following are the conclusions based on the above study.
The average size of the nanoparticle is less (20 ± 0.5) nm for TiO2 as compared to Al2O3 nm (25 ± 0.5). Hence TiO2 nanofluid is more stable as compared to Al2O3 nanofluid.
The sedimentation height ratio and sedimentation velocity are dependent on the concentration of nanofluids. Both parameters increase with an increase in the concentration of nanofluids.
Sedimentation velocity to Brownian velocity ratio increases with the increase of concentration of nanofluid. The increases in nanoparticle size due to clustering and increased sedimentation velocity due to the aging of nanofluids are maybe the prime reasons for this trend.
Smaller particle size, optimized sonication time, low nanoparticle concentration and use of surfactant are the key parameters to obtain better dispersion stability of nanofluids which helps to regulate the pumping power loss by lowering density and viscosity of nanofluids.
Footnotes
Appendix
Declaration of conflicting interests
The author(s) declared no potential conflicts of interest with respect to the research, authorship, and/or publication of this article.
Funding
The author(s) disclosed receipt of the following financial support for the research, authorship, and/or publication of this article: The authors cordially acknowledge the financial support provided by the Board of Research in Nuclear Sciences (BRNS), Department of Atomic Energy, Govt. of India (Sanction no: 39/14/04/2017-BRNS/34301).