
Abstract
In this work, the preparation and the physical evaluation of a series of miscible 0.2 M solutions in 50/50 volume ratios were addressed. A total of five solutions comprised of plain electrolyte/graphene, plain electrolyte/graphene-ethylene Glycol, plain electrolyte/graphene-poly-ethylene glycol, plain electrolyte/graphene-glycerol, and plain electrolyte/Graphene–Polyethylenimine. were assembled with Ag, and copper nanoparticles. The physical properties were studied by electrochemical impedance spectroscopy, solution conductivity calculations, and viscosity and flexibility measurements, particle size distribution analyses. Surface morphology characterizations were done by transmission electron microscopy. A comparative approach of the physical properties between the five solutions serves as a guide to select the most appropriate fluid applicable to the upcoming device.
Introduction
Nanomaterials and nanoparticles bound to organic or inorganic compounds in the form of nanowires are most often seen in sensing applications. To significantly magnify the device response, enhancing physical properties such as the electrical conductivity and the impedance of a nanowire by associating complementary nanoparticles to form potent composites has been a common route of device engineering. Some materials can also react to light irradiation, which can be combined with nanomaterials for sensing purposes as well. Completely depending on the type of change induced by adduct material, an immediate effect will rise on charge and electron transfer efficiency. Also, by modifying sensing surfaces with nanomaterials, improvements in electrochemical properties will result. Such improvements are low background current or higher signal-to-noise ratios. 1 Many metallic nanoparticles, for example, silver (Ag), cobalt (Co), copper (Cu), iron (Fe), platinum (Pt), palladium (Pd), iridium (Ir), nickel (Ni) as well as others alone or as composites have also been embodied into biosensors.2–15 Metal oxides and transition metals have also been implemented in biosensor building.15,16 On the other hand, organic nanomaterials have also partaken in enhancing electrochemical behaviors. Allotropes of carbon, are often most seen, such as carbon nanotubes (CNTs), graphene, carbon capsules, carbon powders, carbon nanowires, and carbon nanotube arrays. 17 Many organic-inorganic hybrid nanomaterials such as graphene-Pt nanoparticles, 18 and Pt nanoclusters planted with polypyrrole nanowires 9 have also been investigated.
Nanomaterial possesses a considerable surface area to volume ratio. On this note, CNTs imply a high loading capacity of biological or chemicals catalyst molecules capable of capturing target analyte signals, ideal for identification and quantification purposes. Nanomaterial catalysts are one of the most-liked in terms of design and fabrication of applicable sensors and electrochemical detectors. Most Nano fabricated materials used are characterized by high stability, conductivity, and sensitivity. Like Graphene is a good conductor, stable, androbust during the integration processwith another metal toform a composite. Colloidal particle behavior does not allow adequate diffusion or sufficient homogeneity. 19 Nanomaterials also undergo numerous surface chemical reactions as “vessel harboring reaction conditions” during matrix solution. Because, these nanomaterials, specified copper, silver nanoparticles, nanoscale cerium oxide, and carbon nanotubes (CNTs) are characteristic of an abrasion sphere during the reaction process, moreover they are also created many crystal shapes with different sizes. All depending on different factors (i.e. number of layers, thickness, length, and type of helicity. CNTs are known for excellent surface area to weight ratios, that given, increase the electrical properties of CNTs through high conductivity identifying as metals compared to other elements behaving more semi-conductive. CNTs’ carrying capacity has been reported to reach up to 1000-fold greater than that of copper wires. 20 Many techniques are used for preparing CNTs. Amongst are, chemical vapor deposition (CVD)21,22 electric arc discharge (EAD), 23 graphite electrode laser vaporization 24 or laser extirpation (LA). 25 Furthermore, CNTs have excellent commercial production value, trading high production costs for intensive labor. 26 Another challenge is to grow CNTs of uniform lengths, without aggregation. Leading to reduced undesirable on specific binding of proteins or other molecules on the CNT walls. Despite the previously stated limitations, the electrochemical properties of the different types of CNTs are excellent.27–31 As mentioned above, nanoparticles of copper, palladium, cobalt, silver, platinum, and others have also been incorporated into various biosensors,.32–35 For example, Baioni et al. 36 assembled 30 nm of the crystal structure of single copper hex cyanoferrate nanoparticles by using the electrostatic deposition layer-by-layer (LBL) to deactivate fluorine-doped tin oxide electrodes. This technique has been produced by electroactive films capable of sensing hydrogen peroxide (H2O2) with remarkable detection limits, even in presence of interfering ions Conductive polymers are mainly organic compositions with a pi-orbital network responsible for electrons delocalization within the polymeric structure. The interference due to presence of cations (Mg+2, Ca+2) addition Cl- through a series of chain reactions known as mineralization, hydroxyl radicals react with organics to ultimately form carbon dioxide, water, and mineral ions, with aldehydes and carboxylic acids often serving as intermediate breakdown products
The modeling and synthesis process is based on methods that associate electronic and mechanical properties, thus improving the flexibility and conductivity of the produced polymer. 37–39 Ideal polymers are well known for being thermally and environmentally stable, conditionally soluble, easily operated, and appreciably conductive. The electrical conductivity of polymers changes over several orders of magnitude depending on applied potentials, pH, and environment. 40 Conducting polymers usually link to better defined electroactive area or clearer electroactive area, when compared to other less efficient Nano-scaled materials. Also, conductive polymers have a remarkably ameliorated signal and performance in contrast to other classical materials used in biosensing due to electroactive surface area exposure. 41 Electrochemical methods enable us to detect that interferences, which is resulting from different sample components inside the solution. For example, during the picking process, the raising up specific Amperometric response through the electrode-solution interface can be detected detection color change or turbidity associated with interference variation in homogeneous sample analysis. 42 Moreover, electroanalytical processes require a small amount of sample and electrochemical analyte measurement and signal detection techniques trend toward inexpensive and portable handheld devices.
Numerous Nano electrodes have proved to be advantageous, especially in biological and industrial applications. In the biological sector, for instance, applications have crossed single-cell investigations, point-of-care clinical analysis, interconnected biosensor development, 43 the invention of microchips, and patterned electrodes.44,45 Overall, the Nano electrode application discipline is a rapidly broadening research area due to recurrent progress of material sciences, cost-effectiveness, and additional electrode fabrication methods integrating both electronic and biological components in biosensor development. Many electrochemical techniques include handy screen-printed electrodes (SPEs) fabricated with graphite, gold, and silver.46–50 which can be mass-produced and have low-cost processes.
The three-electrode electrochemical cell setup is commonly used in electrochemical detection. The electrodes are the working electrode, the reference electrode, and the auxiliary electrode (usually a platinum wire). The working electrode is a strongly conductive material such as glassy carbon, gold, platinum, or mercury. For the three-electrode setup, a charge flows through the electrolyte from the electroactive interface between the working electrode and the electrolyte solution to the auxiliary electrode. The reference electrode, ensures an accurate output of the tension at the electroactive site Common reference electrodes are the reversible hydrogen electrode (RHE), silver/silver chloride electrode (Ag/AgCl), and the standard calomel electrode (SCE). All three electrodes must be distance one from the other to avoid short-circuiting the cell. Generally, we use electroanalytical techniques to gauge current, potential, or impedance. The techniques for these measurements are Potentiometry, Amperometry, voltammetry, and Coulometry.51,52
Carbon-based electrodes are classified according to the carbon atoms hybridizations comprising the electrode. Illustrating this with an example, graphite is highly oriented pyrolytic graphite (HOPG), adopting an sp 2 hybridized orbital arrangement, whereas diamond structure is fabricated of sp3 hybridized carbon atoms. Glassy carbon is one of the widespread carbon materials for electrode applications. It complies conformably with the three sought-after characteristics of a good working electrode. It is chemically inert, its surface is easily renewed and it has a large stable potential range (ca. − 0.4 V–+1.7 V (vs SHE)).52,53 For these reasons, carbon electrodes are easily coupled to work with organic redox molecules. Performances of electrode materials vary differently from noble metals to carbon or even conductive polymers for specific applications. Some metals (platinum, gold, silver) have excellent conductivity and superior kinetics with regard to electron transfer. Moreover, some of them like platinum and gold possess noticeable chemical stability and high inertness. Hence, gold contributes to microfabrication and immobilization in biological applications. Effective electrode material can be used dependably when potential stability domains are around − 0.1 and +1.3 V (vs SHE). 54 Although mercury is the most common electrode material in polarography, it has limited applications due to its inveterate toxicity. 55 Semiconductor electrode materials have gained some attention, for example, indium tin oxide (ITO), because they are cheaper than noble metals, transparent, and easily applicable. Furthermore, their potential stability domains are larger than that of gold (− 0.4 V–+1.9 V vs (SHE)). However, ITO has a remarkably lower conductivity (104 vs 107 S cm−1),56,57and is unstable in an acidic medium With respect to electron transfer kinetics, ITO is slower than noble metals or glassy carbon.58,59
One of the most applicable industrial polymers is polyethylene glycol (PEG) because it is a water-soluble neutral polyether (due to the polarity of the hydroxyl group). PEGs can be prepared in different molar masses. Interestingly, low molar mass PEGs are eco-friendly and non-hazard solvents with potential uses in industrial applications, especially in the biological field.60,61 Due to PEG, aqueous biphasic systems (ABS) have been recognized as key tools for the extraction and purification of biomolecules. 62 UV/Vis spectroscopy is used for the characterization of metal nanoparticles suspended in plain electrolyte/organic solutions, between wavelengths of 250 nmand 1000 nm, for investigating noble metals and graphene. In this work, UV/Vis spectrophotometry scanned a series of prepared colloidal solutions made of a plain electrolyte solution made with graphene Nano-tubes, silver nanoparticles, and gallium metal particles. The same electrolyte was also mixed with PEG, glycerol, and PEI. The size of Ag nanoparticles was estimated to be in the range of 15–20 nm depending on the solution composition. Ag NPs were also aggregated and their sizes did not remain in the nanoscale range due to particle enlarging following aggregation.
Various studies have worked on creating and characterizing metal nanoparticles for many applications. Recently, different sectors of life sciences, biological, industrial, and engineering sectors are more interesting in the ways and fabrication of nanomaterials composite63–66 based on many factories like particle size, structure, crystals morphology during fabrication process beside their materials characteristics. They both optimize the size and shape of nanoparticles, which are important factors for potential applications.67,68 Besides, nanoparticles are highly unsteady because, they have high surface energy trending toward the conversion into bulk materials, as aggregated particles.69,70 For this reason, metal nanoparticles must be prepared more stably by using many stabilizing agents like surfactants or emulsifiers, 71 dendrimers. 72 Copolymers 73 and gels 74 Gels incorporated with nanoparticle metals have prospective applications in biomedicine, 75 optics, 76 Electronics, 77 photonics, 78 and catalysis. 79 These blends can be also conveniently characterized by different spectroscopic techniques like transmission electron microscopy (TEM) 80 and scanning electron microscopy (SEM). 81 Fourier transform infrared spectroscopy (FTIR) 82 and ultraviolet-visible spectroscopy (UV/Vis) 83 have their characteristic advantages and disadvantages. To gain specific information for the single metal in composites, Khan et al. assembled P(NIPAM-AA) gels by microwave irradiation process. Micro-reactors were used in situ for the synthesis of Ag NPs in presence of glucose reducing agents, 84 then confirmed the incorporation of Ag NPs gel by acquiring the UV/Vis spectra at 429 nm.
Experimental
All chemicals (Copper (II) Sulfate (CuSO4), Aluminum Chloride hydrate (AlCl3-3H2O) and Sliver Nitrate 99% (AgNO3), Glycerol, Polyethylene Glycol (50 v/50 v) (PEG, MW = 2000), polyethyleneimine (average molecular weight of 750–1000 kDa (50% w/w aqueous solution) and graphene Nanotubes used in preparation were purchased from Sigma Aldrich at 99.9% purity. Other organic solvents and polymers, stated below, were bought from Fisher Scientific Canada:
Preparation electrolyte solution
The electrolyte solution was prepared with 0.2 M of different salts (Ag Cl, AlCl3, NaCl, and CuSO4). Then 3–5 drops of acetic acid were added to keep the pH at around four and to prevent aggregation of just silver and other soluble salts as well, kept going the stirring for 5 h.
Preparation colloidal composite solutions
A mass of 0.1 mg of Nano graphene was dissolved in the 0.2 M electrolyte solution, followed by stirring for 24 h. Composite solutions were then prepared by two steps, first, by taking a specific volume of (1:1:1:1) of different organic compounds glycol, glycerol, polyethylene Glycol, and polyethyleneimine, then mixing together till be homogenized solution. Second, transfer 5 ml of salts electrolyte solution to the same volume of polymeric solution ( 50/50 )volume ratio, then stir overnight. Furthermore, add 1 ml 0.2 M, AgNO3 to the prepared solution while stirring for 8 h additional, until particles became homogeneously suspended
Results and discussion
Figure 1 explained that there are some wrinkles on the graphene Nanotubes. They are induced by a reduction process that happens on the surface of graphene by Ag-NP and hydroxyl groups of EG and PEG, thus turning the outer layer into a negative moiety. Ultimately, charge flow is facilitated inside the composite solution.
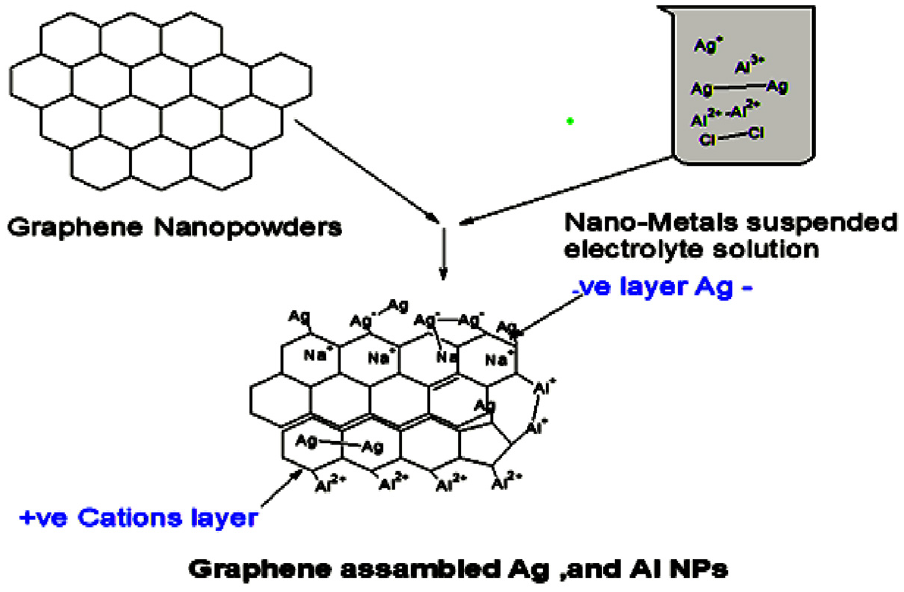
The reaction between Grapheme and the electrolyte solution.
The importance of NPs in the electrolyte/organic solution is underlined by allowing fast electron transfer. Their small size and large surfaces lead to the formation of both metallic bond Ag-Ag and Al –Al as well as aggregation amongst NPs. These events are depicted with more details in cyclic voltammetry analysis in Figure 2. An observation of these voltammograms marks a reversible redox reaction. On the other side of Ag-NPs (mean size 15 nm), self-assembled monolayers (SAMs) stabilize the particles by preventing aggregation within the slightly viscous solution. By doing so, they also prevent Ag-NPs from aggregation and encourage interactions with CNTs via p–p interactions to give a uniform dispersal of Ag-NPs on CNTs.
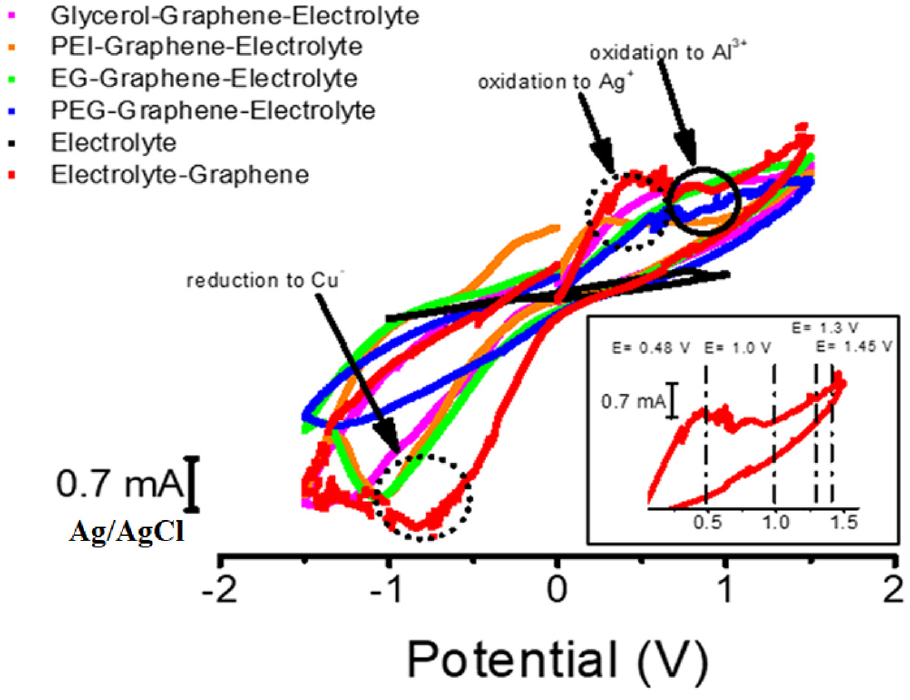
Cyclic voltammetry (CV) of serious prepared solutions, plain electrolyte, PEG/electrolyte –graphene, electrolyte – graphene, EG/electrolyte – graphene, glycerol/electrolyte – graphene.
Electrochemical characterization
EIS analysis
on the Nova potentiostats provided electrochemical impedance measurements,The open-circuit voltage (OCV), and the cyclic voltammogram (CVs).
The impedance results describe physicochemical properties such as conductivity and electron transfer rates and mass transfer kinetics at different frequencies. 85 Studies worked on impedimetric values are relatively common in electrochemical sensors, especially in medical applications. In this work we investigated the conductivity through impedance at frequencies ranging from 3 MHz to 1 kHz fixed at open circuit potential (OCV = 0.43 V) for the different 50 v/50 v modified miscible solutions plain electrolyte, electrolyte/graphene, EG/electrolyte/graphene, PEG/electrolyte/graphene, EG/electrolyte/graphene, glycerol/electrolyte/graphene and PEI/electrolyte/graphene. A three-electrode setup (working, reference, and counter electrodes).
Nyquist plots of the different solutions are depicted. In all cases, a similar semicircle is observed yet slightly increasing in real resistance. The observed trend goes as follows (electrolyte < electrolyte/graphene < electrolyte/graphene/EG < electrolyte/graphene/PEG < electrolyte/graphene/glycerol< electrolyte/graphene/PEI). Conductivity is inversely proportional to molar resistance. We also found another relationship between resistance and frequency. By decreasing resistance, an increase of the characteristic frequency was found in all solutions. The frequency ratio of the electrolyte solution sub-circuit was obtained via 1/ReCe. Thus, by changing the electrolyte composition of nanomaterial consistency, the characteristic frequency of the electrolyte solutions would shift to bigger values. In other statements, if the electrolyte resistivity is high enough, the characteristic frequency would also be high. Therefore, the response of electrolyte solutions, which was shown as a small arc in the Nyquist plots, showed good conductivity within the plain electrolyte solution. On the other hand, as illustrated in Figure 3, in cases where EG and PEG were loaded by graphene Nanotubes, the real resistance spans from −70, +110, −75, and +150 ohms respectfully. This reflects that the concavity of EG > PEG. Due to the viscosity parameters which are higher in PEG, obstruction of the movement of ions in solution increases resistance and suppresses the beneficial conductivity effects of graphene nanotubes.Looking into Z values for (PEI/graphene, glycerol/graphene, and electrolyte/graphene), high conductivity (low impedance) was noted. The Z-value was roughly identical. Functional groups on the nitrogen atoms of PEI and the three hydroxyl groups in glycerol created a resonance complex that lead to higher conductivity. On the other hand, electrolyte/graphene solution, also demonstrated high conductivity when compared, but less than the plain electrolyte. Our explanationconsiders graphene Nanotubes as semiconductors. When aggregated in solution, charge transfer capabilities might be affected, thus becoming less conductive than the plain electrolyte. We conclude that the conductivity arrangement in decreasing order is as plain electrolyte > electrolyte/graphene > electrolyte/PEI/graphene > electrolyte/glycerol/graphene > electrolyte/EG/graphene > electrolyte/PEG/graphene.
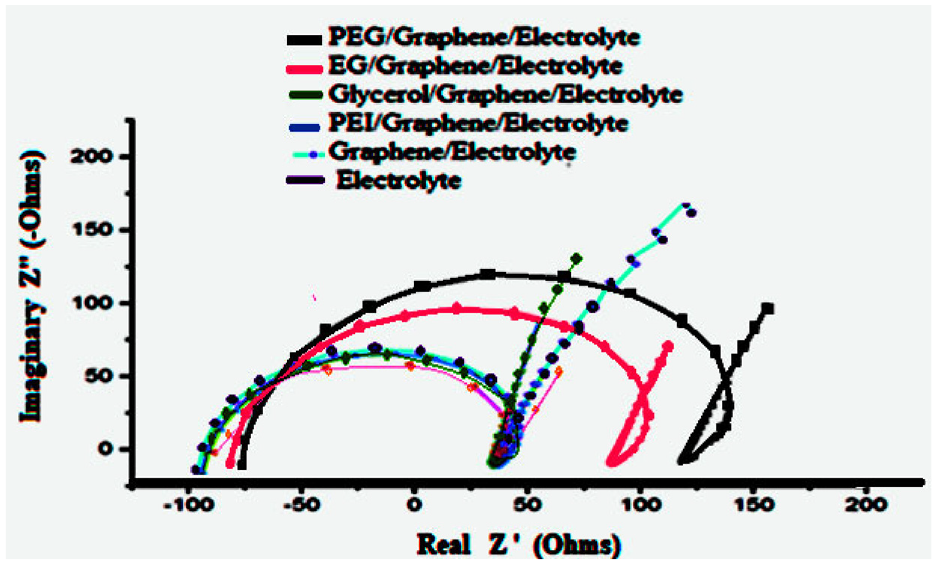
EIS results of plain electrolyte, electrolyte/graphene, EG/electrolyte/graphene, PEG/electrolyte/graphene, EG/electrolyte/graphene, glycerol/electrolyte/graphene and PEI/electrolyte/graphene.
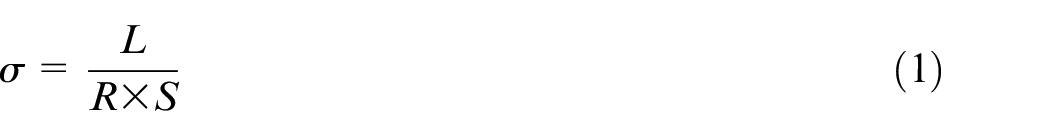
Ionic conductivity tests were conducted at frequencies 3 MHz to 1 kHz at open circuit potential (OCV = 0.43 V) by using a working electrode surface area of 15 mm in diameter at ambient pressure and temperature. The ionic conductivity of solutions (σ) was calculated according to the equation above where (Ω) is the real impedance electrolyte, L (cm) is the thickness of the working electrode, and S (cm2) is the electroactive surface area of the electrodeas shown in equation (1).
Cyclic voltammetry (CV)
Of the fluidic solutions was conducted by a three-electrode electrochemical cell setup, we applied a changing bias between the counter and working electrodes whilst the reference electrode served as a reference for the applied bias. Cyclic voltammetry (CV) is a dynamic measurement technique where potential applied on the working electrode flows within a range while simultaneously monitoring the current on the working electrode. The range may be repeated in individual or numerous cycles before stopping. Cyclic voltammograms display the relationship between the current and the applied potential. This technique can illustrate a chemical reaction occurring between reactants, changes of energy in species and relate these changes to the potential. All transformations are a result of electron transfers of species at the vicinity of the electroactive surface. The performance of the different miscible (organic/salt solution), herein the plain electrolyte, electrolyte/graphene nanotube, 50% electrolyte/50% ethylene glycol (EG) and graphene nanotube, 50% electrolyte/50% polyethylene glycol (PEG) and graphene nanotube, 0% electrolyte/50% poly ethylene imine (PEI) and graphene nanotube and 50% electrolyte/50% Glycerol and Graphene nanotube were evaluated by using cyclic voltammetry. Different scanning rates (10–100 mV/s), using the three-electrode framework, involving carbon as the working electrode, Ag/AgCl reference electrode, and a platinum counter electrode.
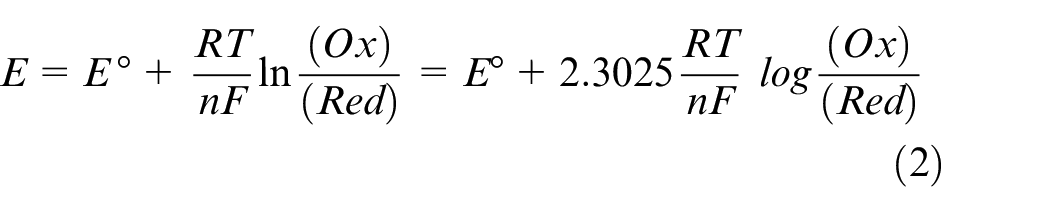
Cyclic voltammetry was executed between potentials + 1.5 Vand − 1.5 V. Many = reduction and oxidation peaks were observed in this scanned range. According to the results, the electrolyte salts sensitivity increased. This increase in sensitivity is seen as a shift in the redox potentials in the electrolyte solution in Figure 2 The potential measurement in an electrochemical cell (E) can be predicted by the Nernst equation and the standard reduction potential of a specimen (Eo) and the activities of the oxidized reduced forms of the analytic in solution. It is therefore also possible to derive the ratio of the activities of an analyte at a given potential. From the equation, F is Faraday’s constant, a universal gas constant is R, a number of electrons are n, and ambient temperature is T. n the case of the EG/graphene–electrolyte solution equation (2), there is
Dynamic viscosity of the fluidic solution
For the measurement of the dynamic viscosity of the prepared solutions, we usedSine-wave Vibro Viscometer SV-10. Detection viscosity by using optimized electrical current to resonate both sensor plates at a steady amplitude of less than one mmand at a frequency of 30 Hz. This viscometer is reliable up to viscosities between 0.3 and 10,000 MPa·s at broad temperatures from 0°C to 160°C, with an accuracy of 1%.By adding the samples inside cubic cups at room temperature, results for different fluids are seen in Figure 4. Dynamic viscosity (η) is a key tool for physically optimizing parameters for liquid-liquid equilibria andmass-charge transfer. Additionally, it is an important thermodynamic and kinetic value of react it is equal ν = η/ρWhere ν is Kinematic viscosity, ρ is fluid density and Dynamic viscosity ions are η.
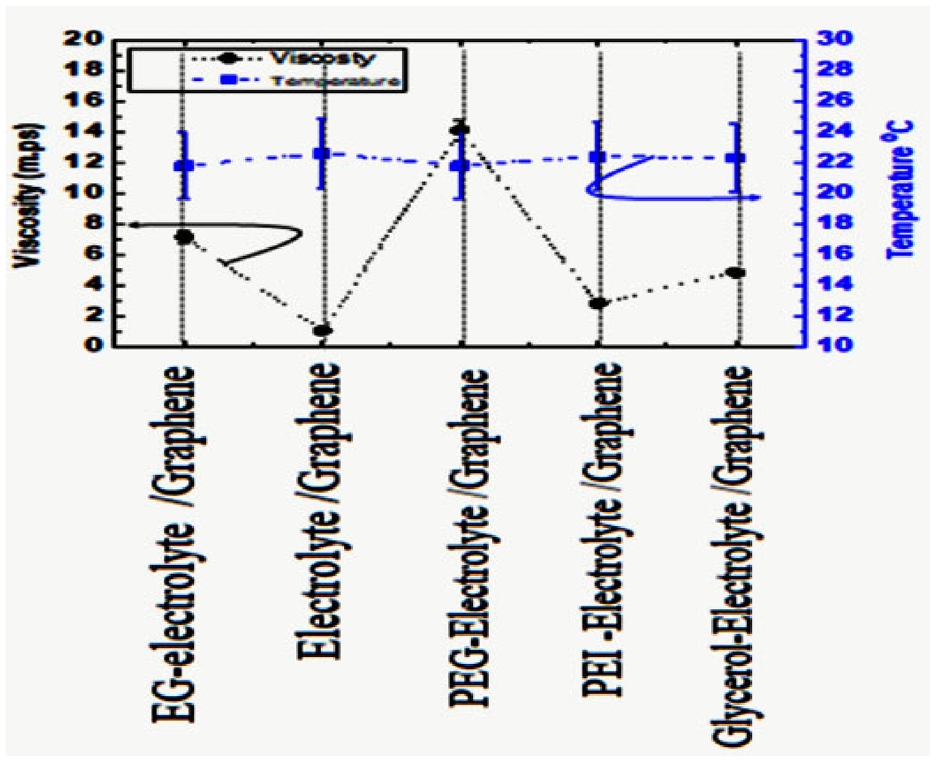
The viscosity of the miscible electrolyte solution.
On the other side, we noticed The densities (ρ) for studied polymer electrolyte solutions at room temperature is shown in a diagram below (4). By comparing densities of different prepared solutions: plain electrolyte, electrolyte-graphene-EG, electrolyte-graphene-PEG, electrolyte-graphene-PEI, and electrolyte-graphene-glycerol. We deduced that viscous fluids do not obstruct charge movement inside solutions, yet slightly decrease the flow rate and increase cohesiveness. Therefore, the solution gains stability at room temperature and remains continuously bound.
The relationship viscosity (ρ) and practical size r distribution are illustrated in the equation above. The particle sizes of dissolved particles are directly proportional with viscosity and inversely with conductivity, as evidenced in Figure 4. Taken for example the plain electrolyte showing low real resistance (z -value), high charge transfer, in Figure 2, viscosity is lower. Mass transport and the energy of reaction through this process have been investigated by Different studies worked on solvent reaction mediums that are dependent upon the viscosity factor of solvent. The ratio of the size of the hole to ion increases with an increase in the molar mass of the PEG of DES. Viscosity decreases with increased concentration (molar ratio) of the organic solvent solution, particle size distribution, and weakening of solute intermolecular interactions. The overall viscosities determined from the viscometer in decreasing order were PEI > GLYCEROL > PEG > EG > plain electrolyte.
Ft-IR characterization
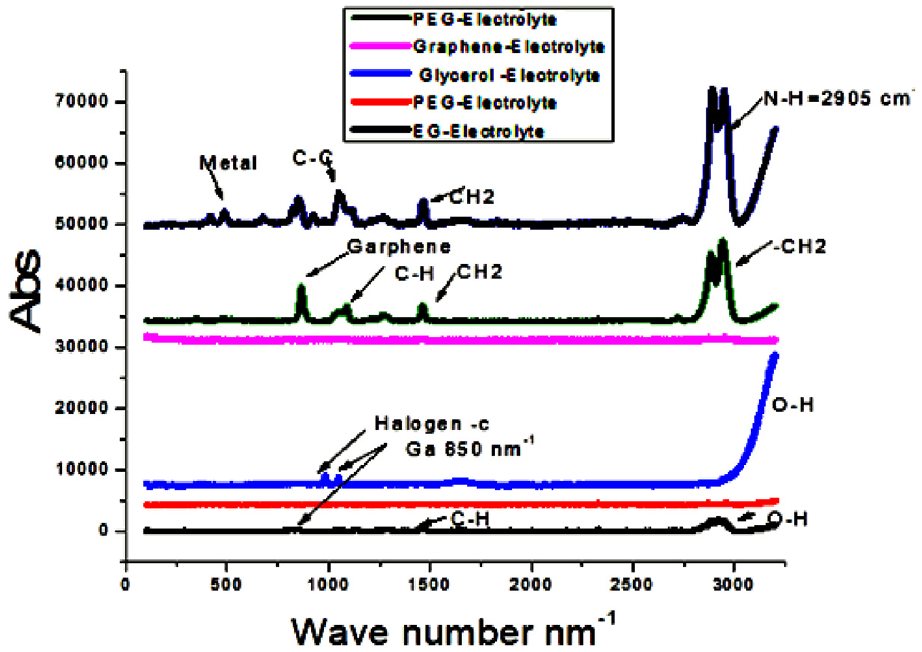
All analyses and characterizations were done by Spectrometer model Nicolet 6700/Smart iTR with Attenuated Total Reflectance (ATR) by using a (diamond plate) as sampling platform from Thermo Fisher Scientific. The range of absorption spectrum covered was between 650 and 4200 cm−1. The data treatment Software installed on the instrument was the Omnic version. Conform to Figure 5, the Polyethylene glycol hydroxyl group was absorbed in the primary alcohol region located at 3378 cm−1. Moreover, asymmetrical stretching and bending vibrations restricted to C-C, C-O, and C-H group’s absorption peaks were observed. The C-H symmetrical bending was also clearly seen by Raman spectroscopy (Figure 6). Methyl groups (C-H) were slightly shifted to vibrate at around 2800 cm−1. This proves the attachment of the OH group as the primary group of PEG. Methylene (C-H2) group appeared at absorption wavenumber of 1474 cm−1. Linked to the hydroxyl group of PEG, the C-O stretching manifested strong peaks at 1362 cm−1 and 1287 cm−1 (Figure 5). Another strong peak appeared at 966 cm−1 and 849 cm−1. The latter was due to the C-C stretching modes. On the other hand, many sharp bonds arose at 700–900 cm−1. These confirmed that the electrolyte was halogenated. Peaks were spotted in different areas at 2590, 2420, 2350, 1977, 802, and 616 cm–1. Once more, the formation of the polymer–salt/graphene carbon–filler complex had been affirmed. Ethylene glycol also contains hydroxyl groups which are absorbed in the same region of PEG’s. For this reason, distinguishing the peaks was hardly possible, except by noting some minute shift of the O-H peak related to NPS (Ag, Cu, and Al) attached to the hydroxyl groups by hydrogen bonding. The bound hydroxyl group’s signal appeared at 3380 cm−1. The peak areas of 505, 406, and 290 cm−1 concerned (Ag, Cu) NPs bonding with the oxygen atoms of the hydroxyl groups on the PEG chains. This it also obvious in pic CV redox mechanism. Thus FT-IR spectra described the presence of van der Waals interactions between NPS and the solution PEG.
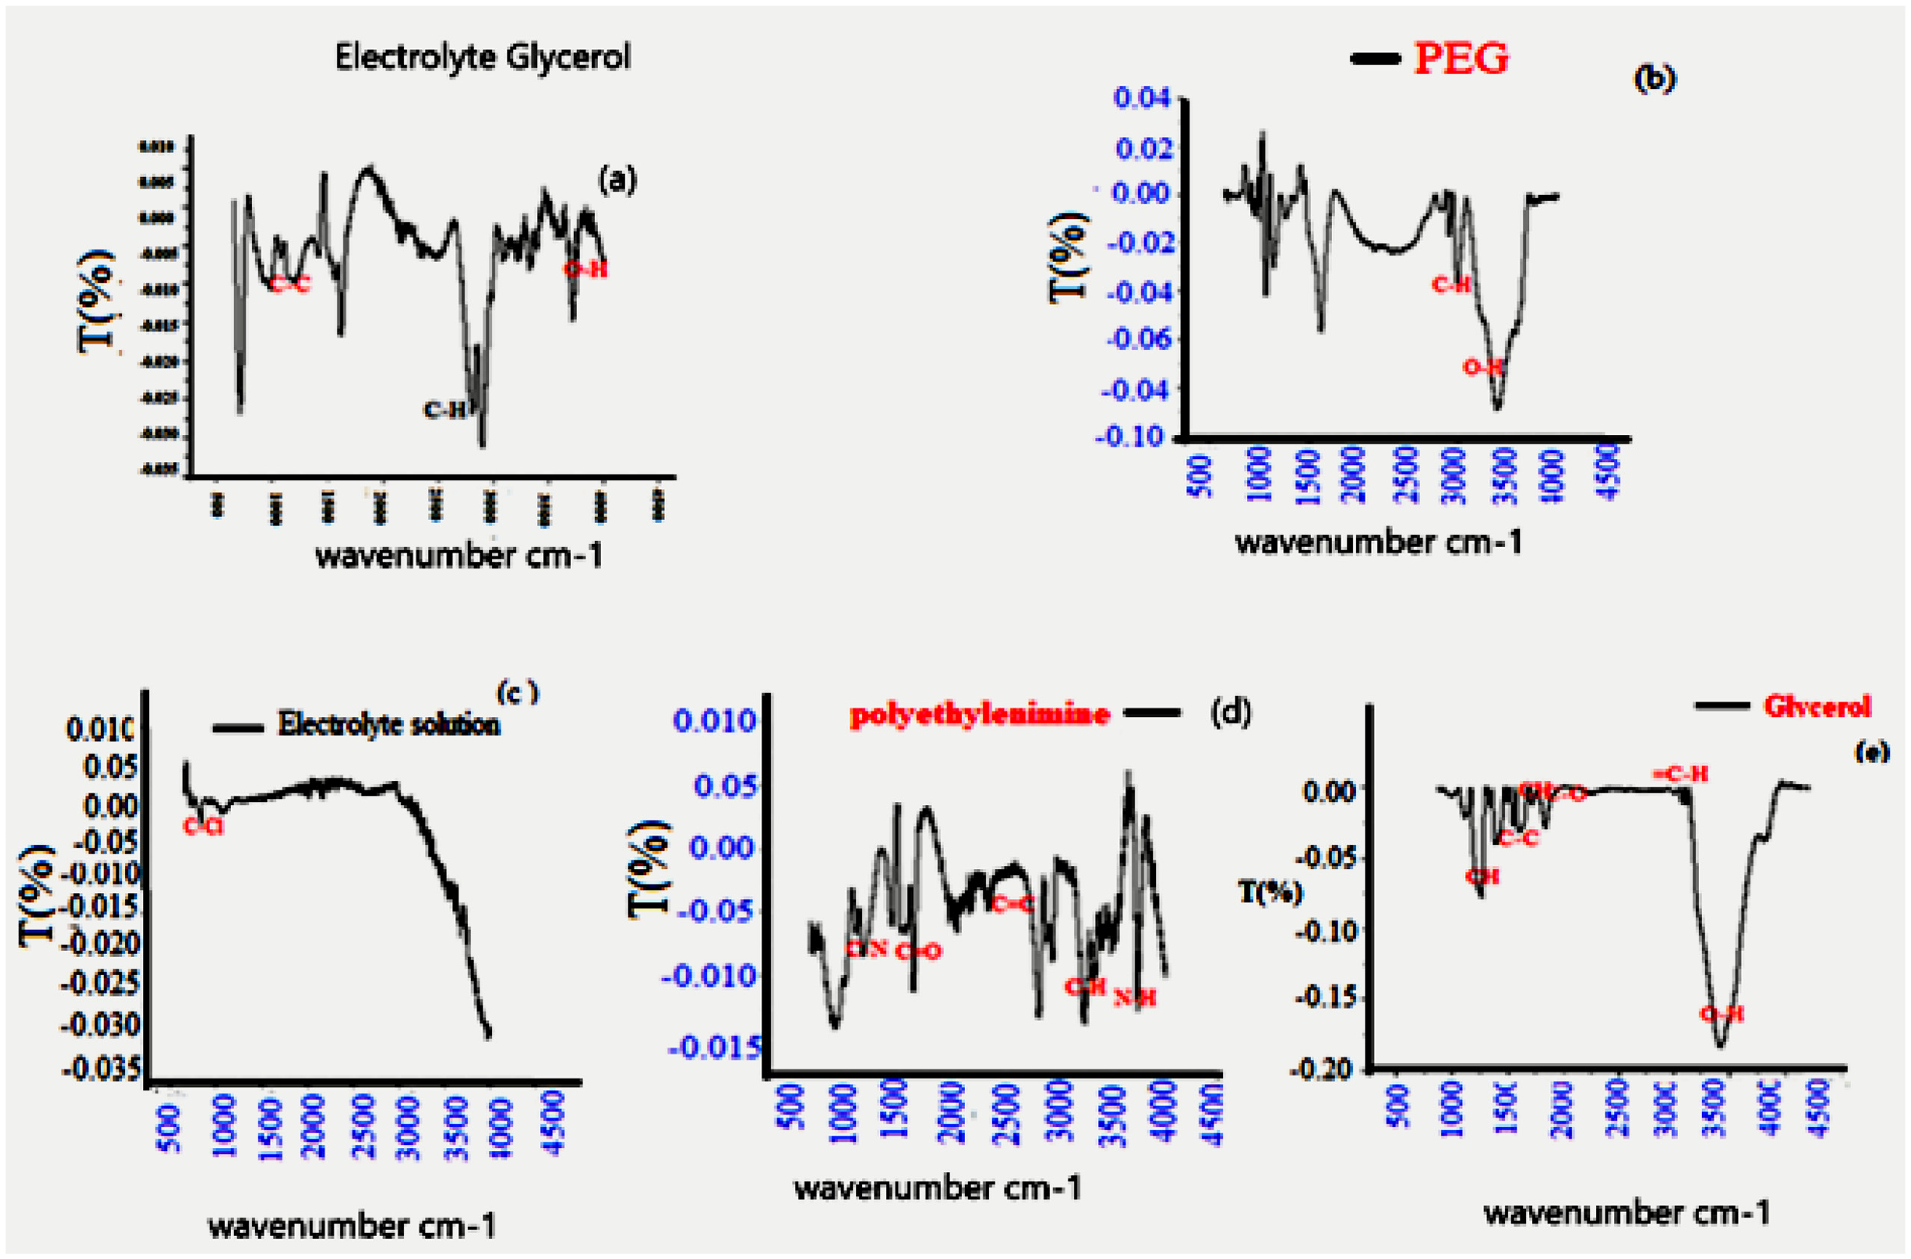
(a) FT-IR (a) EG/Electrolyte, (b) PEG/Electrolyte, (c) Electrolyte, (d) PEI/Electrolyte, and (e) Glycerol/Electrolyte.
Annotated Raman spectra of the prepared solutions.
Low wavelength vibration signals appeared at 750 cm−1 and 872 cm−1, originating from residual transition metal atoms (Ag, Cu, and Al) of the nanocomposite catalyst which was confirmed by UV spectroscopy (Figure 7). The broad peaks around 3400 cm−1 and 3600 cm−1 are indicators of hydroxyl groups on the prepared polymer solutions. Other strong peaks accounting for the carbonyl group (C = O) stretching at 1646.6 and 1731 cm−1, the methylene (CH2) vibrations at 2955 and 3000 cm−1, and the methyl group (CH3) have strong peaks at around 1140, 1194, and 1240 cm−1.
Compilation of the absorption spectra of the different fluidic solutions.
The PEI/electrolyte–graphene solution showed different peak areas for amino groups (N–H) at 3470 cm−1 and (C–H) bond stretching appeared at 2960, 2935, and 2855 cm−1. Weak bands at and 1454 cm−1, were representative of (N–H) and (C–H) respectfully. This data was also confirmed by Raman spectroscopy as shown in Figure 6. There are some peaks at 1725 cm−1 that match the carbonyl and carboxyl group vibration modes. Peaks at 1605 and 1500 cm−1 corresponded to the C-C asymmetric graphene ring and C-O vibration modes respectively. The chemical structure identity of PEI was investigated by (FTIR) and the data analysis was shown in Figure 5. Attributed peaks at 3270 cm−1 (stretch N–H bond ), 2945–2835 cm−1 (C–H bond), 1572 cm−1 (N–H bending), 1460 cm−1 (C–H bending), and 1355–1000 cm−1(stretching and bending C–N) appeared in the PEI spectrum. FT-IR (graphene/Ag NPs in PEI/electrolyte solution) showed peaks in different areas for amino groups (N–H) at 3470 cm−1; (C–H) bond stretching appeared at 2960, 2935, and 2855 cm−1; small bands at 1630 cm−1 and 1454 cm−1 were attributable to (N–H) and (C–H).This data is also reconfirmed by Raman spectroscopy, as shown in Figure 6. Some peaks at 1725 cm−1 match with carbonyl and carboxyl group vibration modes. Peaks 1605 cm1 and 1500 cm1 correspond to the C-C asymmetric graphene ring and C-O, respectively.
Raman spectroscopy of the fluidic solutions
A Technique used for investigating the liquid solution structure is Raman spectroscopy. It was used for the electronic characterization of graphene/organic materials in prepared solution (Figure 6. There are stacks of sp2 hybridized carbon atoms associated with specific vibrations and the number of stacks might affect the electronic configuration of delocalized electrons in p-orbitals. Also, there are many wide bands of scattered light appearing on the spectra for different material compositions, especially for carbon from graphene Nano Skelton at 1583 cm−1. A broad peak located at 2715 cm−1 and a broad high peak located at 2700 cm−1 correspond to the 2D band. It is noticed that different peaks are not as intense and broad. This is a trait characteristic of amorphous carbon, provided by the light scattered from the carbon chain of polyethylene glycol or Ethylene glycol. On the other hand, the Raman spectrum of aqueous polyethylene glycol/electrolyte is at different molten states which strongly appears in the spectrum through frequency shifts related to the helical splitting observed in the electrolyte solutions. Peaks may be subjected to change in presence of NP colloid in PEG. The particles’ effect on bond stretching by forming metallic-organic or hydrogen bonds. By comparing spectra of EG, PEG, glycerol, PEI, and plain electrolyte solution, observations lead to believe that some of the solutions linked with NPS through polar functional groups (OH) in PEG, EG, and Glycerol. Thus, broad Hydroxyl group signals shifted softly and appear broad instead of sharp. In other cases, PEI marks its amino groups, which have a pair of electrons (electron-donating), to make a conjugated bond with NPs like Cu2+ and Al3+. The methylene group’s bending region is visible by two bands at 1475 and 1440 cm−1. Between 800 and 900 cm−1, as shown in Figure 6, considerable differences are noted in the band structure, another evidence for benzene ring resonance linked to the graphene structure. Raman peaks exist at 880, 840, and 805 cm−1, due to methylene groups attached with ionic species (cations or anions), more prevalently in the plain electrolyte solution. In the lower frequency region, bands are observed at 520 and 551 cm−1, with some residual scattering at 586 cm−1.
The scattering of PEI on the NPS (Ag–graphene) in solution leads to a marked change in the Raman spectrum. Noticeably, a decrease in intensity is observed for the bands corresponding to the formation complex (conductive polymer composites) which caused shielding, then shifted the amino(N-H2) bending peak closely. There are both asymmetric and symmetric stretching vibrations that, are carefully shifted upwards in PEI solution. PEI is one amino group carrying polymers. Through Raman spectrum of PEI/electrolyte salts, Ag and Cu peaks disappear on IR spectrum Figure 5, Our explanation reasons that a pair of electrons on the donating nitrogen atom on Aminos groups, conjugates and forms a complex with NPS (Ag and Cu), which has been confirmed by EDX and TEM analyses.
The particle size
Analyzer associated with Zetasizer Nano S90 (Malvern) modal Nano S90 analyzer was used to measure particle size on liquid phases. Red laser (632.8cnm, 4 MW), used for Zetasizer instrument at 90 deg receptor angle, to facilities the detection of particles around 1 nm to 5 microns diameter.it is one important method to judge on our physical properties prepared solution through charge transfer movement, carrying charge, depletion, and flocculated particles.
Furthermore, Particle size analyzer is considered one of the important characterize techniques used to describe the physical distribution of particles in phase and stability of solution ( inter-interaction ) or intra – interaction molecules ( van der Waals force ) Also, it gave us surface charge of nanoparticles( Ag, Cu ) colloid in solution .by forming a double layer ( ions charge ) from outers hare of NP charge and the solution, these ions pass through solution carrying charge. So if particles are too much size then it gets be depletion and aggregated then precipitated to become low efficiency in solution through picture (7) using modules used Malvern Instruments model NO. Zen 3600 Zeta sizer. GO-PEG-Cur aqua was diluted with DI water and put in a zeta cell. Each spectrum was obtained using 25 scans. This analysis was repeated three times to detect Graphene and Ag NP in PEG, EG, Glycerol, and PEI solution. Glycerol and electrolyte solution were found withholding aggregated crystals of potentially salt crystalline flocculated graphene nanotubes and Rheology of organic composition. This results in detrimental charge transfer properties in our prepared solutions.
This analysis had been done to qualitative the existence of Nano metals by using Inductively coupled plasma is a physical method of chemical analysis set aside confirmation of most of the elements simultaneously at a few minutes off preparation. The method is composed of the ionization prepared sample by injecting it into an argon plasma (Temperature around 6000 K). Samples have to be prepared by dissolution into acid (wet digestion) before the analysis. The solution is then injected into the plasma as a fine aerosol, procreated by a pneumatic device (nebulizer). ICP by using HNO3 2%–5% as reference. Concerning Figure 8, it appears that sliver, Aluminum, and Copper are present in our prepared samples.
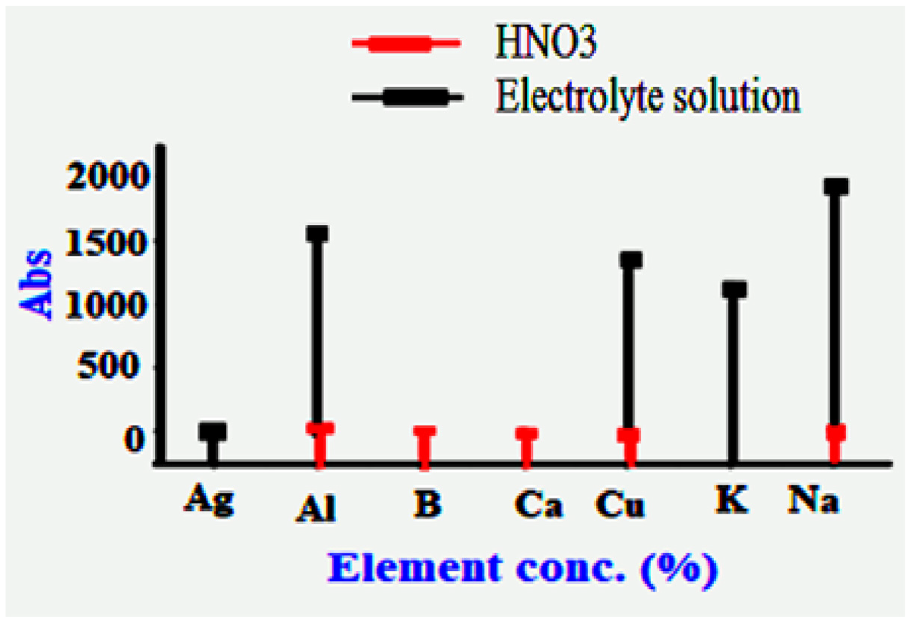
ICP for compositional analysis of the plain electrolyte solution.
Morphological study of fluidic solutions (TEM and EDX characterization)
All analyses have been conducted by transmission Electron Microscope H-9500, Which is a 100–300 VK TEM attached electron gun Panorama La B6 high Diffraction Pattern. Specimen composed of Single crystal silicon (Si) and accelerating voltage range of 40 Kv to 100 KV; with camera Diffraction length: 0.5 m The instrument has a magnification range of 18×–450,000×; Resolution (objective lens): 0.5 nm/5.0å (point), 0.34 nm/3.4å (line).
Morphological and particle size studies hence, assert the existence and spread of Ag NPs (20–25 nm) was too small in the proximity of the larger PEI (25 nm) as depicted by the TEM results (Figure 9). By Correlating the results from the particles size distribution and TEM images (Figures 9 and 10), it is clear that the small particle sizes can move freely without considerable restriction.
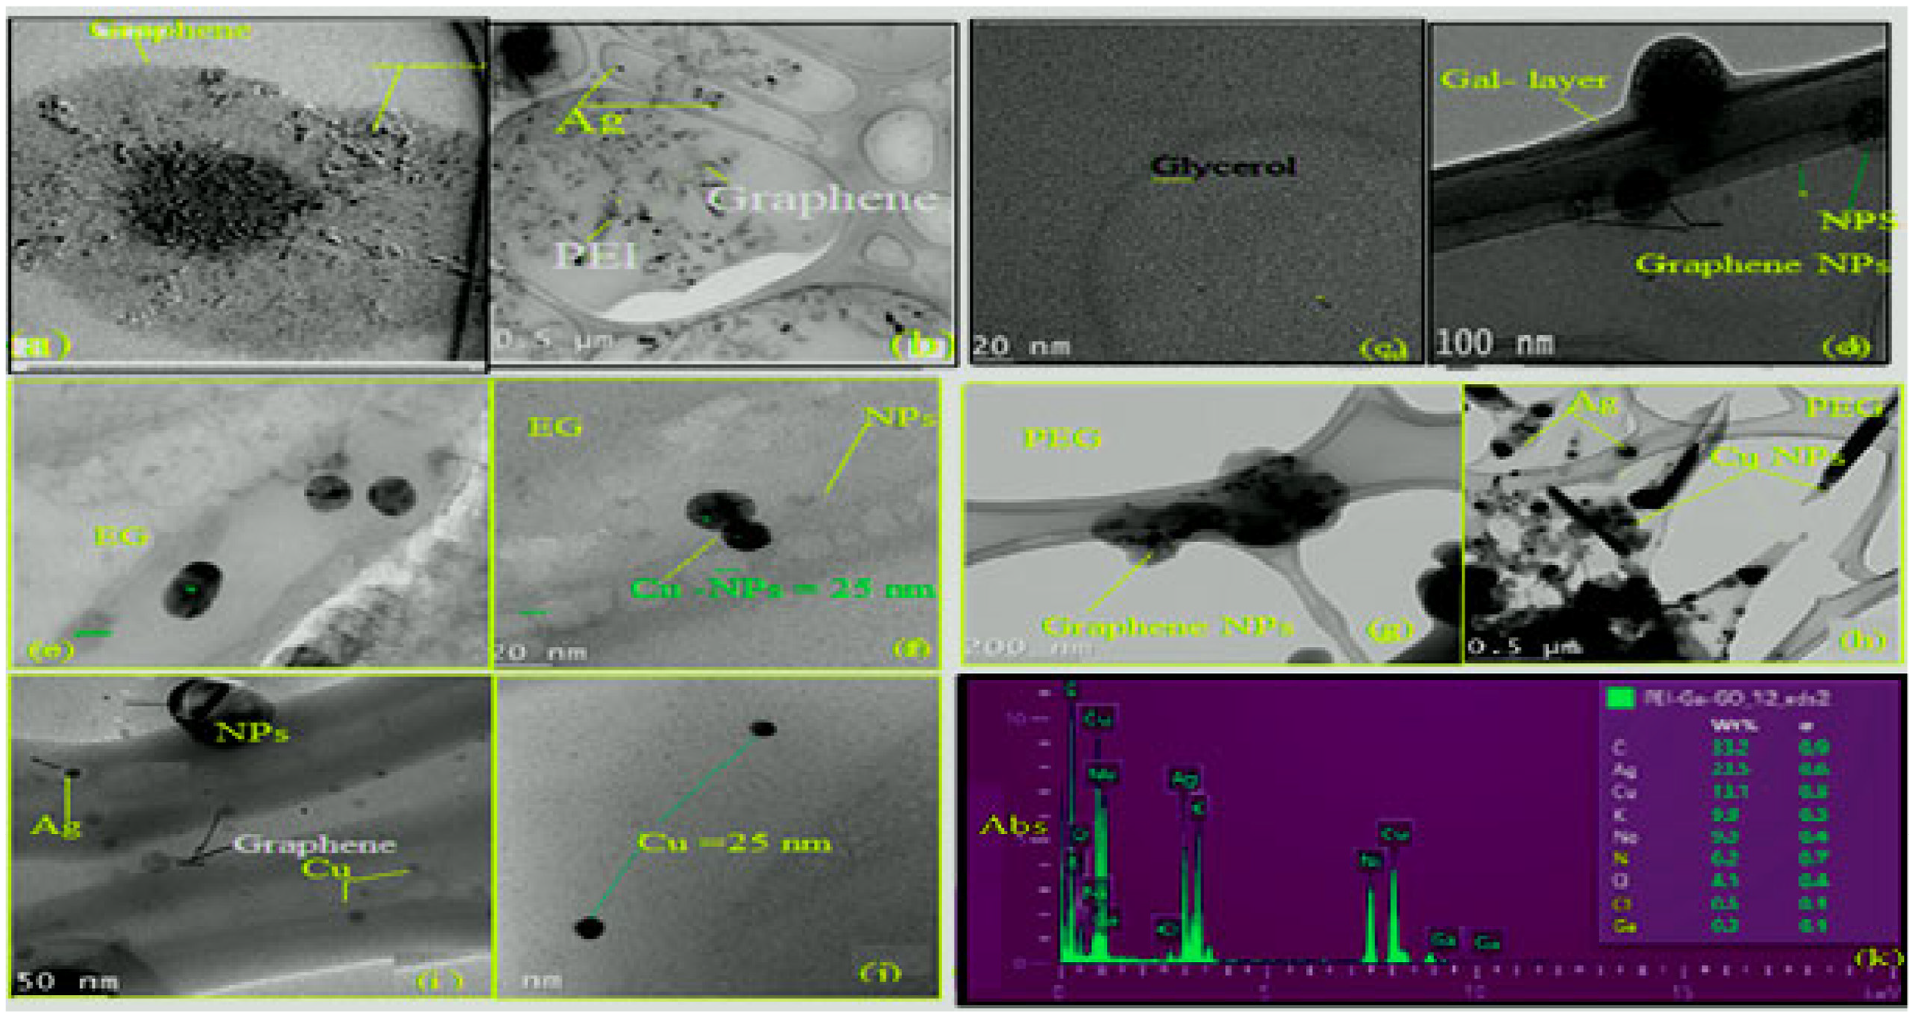
TEM of different miscible solutions. (a–b) TEM of PEI Electrolyte–Graphene, (c and d) TEM Glycerol/Electrolyte–Graphene, (e and f) TEM of EG/Electrolyte–Graphene, (g and h) electrolyte –graphene/PEG, (i and j) Electrolyte–Graphene, (k) EDX of Electrolyte/Graphene–EG.
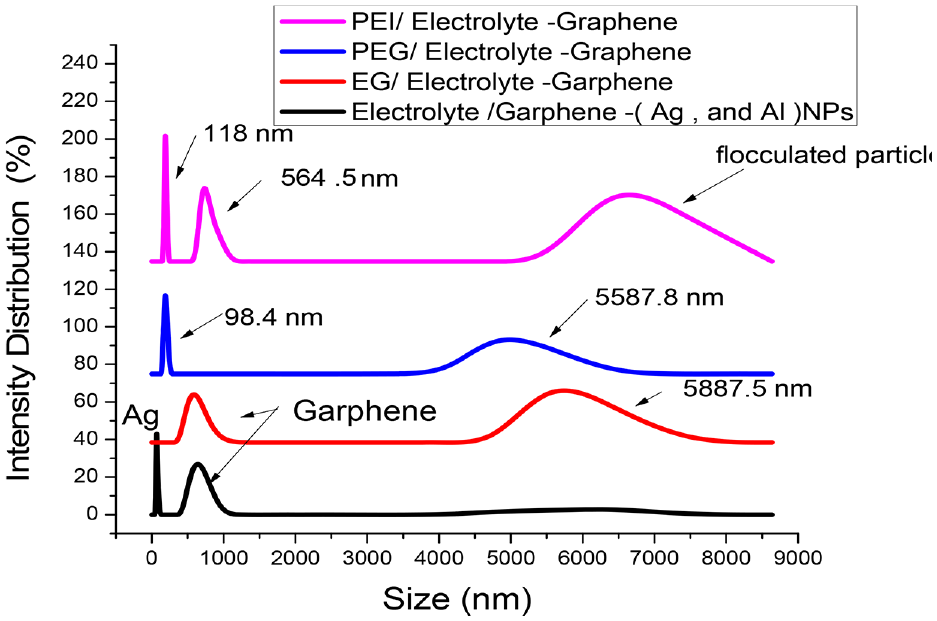
Frequency size analysis of prepared solution.
Furthermore, smaller particles have greater ease in charge transport due to the large surface area to volume ratio. Also, there is a significant distribution of nanoparticles in all the prepared solutions, apparently more abundant in PEG solution than PEI and glycerol solutions. This implies that the polarity of the hydroxyl groups of PEG easily attached graphene by hydrogen bonding as is shown in Figure 9. Although glycerol contains three hydroxyl groups, it seldom appears in the TEM images. The high viscosity of glycerol may have affected its interaction ability with nanoparticles (Ag, Cu, and graphene). This reasoning could appoint the flocculation and aggregation remarked in the DLS results (Figure 10), and reinforced by the glycerol TEM (Figure 9(c)–(d)). Supplementary evidence of metallic bonds among NPs of the same element (Ag-Ag) and (Cu-Cu) producing aggregated sediments is shown in (Figure 9). Graphene nanotubes are visible in all TEM photographs (Figure 9), despite shattering into fragments, due to small crystal masses of Cl–, Na+, and K+. These salt were investigated by EDX (Figure 9(k)).Although there were similarities in the structures of polyethylene (PEG) and Ethylene Glycol (EG) (Figure 9-e and -h), there was homogeneity within the surface morphology of the two components. Small holes and flocculated spots, raised evidence of bond formation or active sites between hydroxyl groups and other metallic nanoparticles (Figure 9(e) and (f)). TEM for glycerol/electrolyte–graphene illustrated by (Figure 9(c) and (d)) portrayed many massive salt crystals deposited, covered by a jelly substance or layer of glycerol with some metallic NPs dispersion of different size ranges (15–35 nm). Regarding the electrolyte salt, solutions with Nano Graphene (Figure 9(i) and (h)) illustrated the formation of graphene nanotubes inside the electrolyte solution containing 0.2 M of (CuSO4, Ag Cl, AgNO3, Na Cl, and AlCl3) salts. Clustered inside those Nanotubes were large numbers of Nano-metals like copper, silver, and aluminum which have respectful sizes of 15, 25, and 20 nm. Sufficient proof of homogenously distributed metals and suspensions with relative bonds between them was found. There was a broken-down graphene nanotube, possibly issued by precipitations of some species. For example, Ag forming Ag Cl. As a remedy, pH was decreased into a mildly acidic medium, favoring the soluble form of the salts and perhaps repacking the nanotubes (Figure 9). Figure 9 displays M-M nanoparticles on the surface of graphene sheets, which set up two layers of different charges (resonance). The negative charge is carried by graphene and the positive charge is carried by the nanoparticles (Ag, Cu, and Al). Electrolyte–graphene/PEI according to TEM of representations (Figure 9 (a) and (b) depict the smooth morphology without any flocculations nor aggregations of nanoparticles. The fine particles of Ag, Al, and Cu submerged inside the graphene sheets, confirmed by EDX (Figure 9-k), seen are around (10–25 nm)). There is no depletion or massive crystals formed as observed in the previous figures. Our explanation, although organic solution has shear strength associated with its viscosity (carrying particle ), it also obstructs the movement o ions and causes deposition. Also, Figure 9(i) and (j)) show the images of Nanotubes graphene. It is possible to confirm that the graphene structure is formed by several thin layers arranged in stacks. Moreover, there is an oxidation process was happened for graphene slight changes appear in its surface morphology, with a rugged appearance with several lappets. This wrinkled or rugged portion might be explained by the oxidation process to elevated of hydroxyl and with cations species in the solution created resonating electron inside carbon graphene structure depending on sp2 hybridization of carbons (planar structure) to switch to sp3 (tetrahedral structure). We could be mention another observation that the Graphene Oxide is formed on a layered structure might be associated with material oxidation, since more degree of oxidation, most spaces are between the functionalized layers. Dikin et al. (2007) investigated the same spotted during conducting a layered structure with several folding. 86
UV characterization
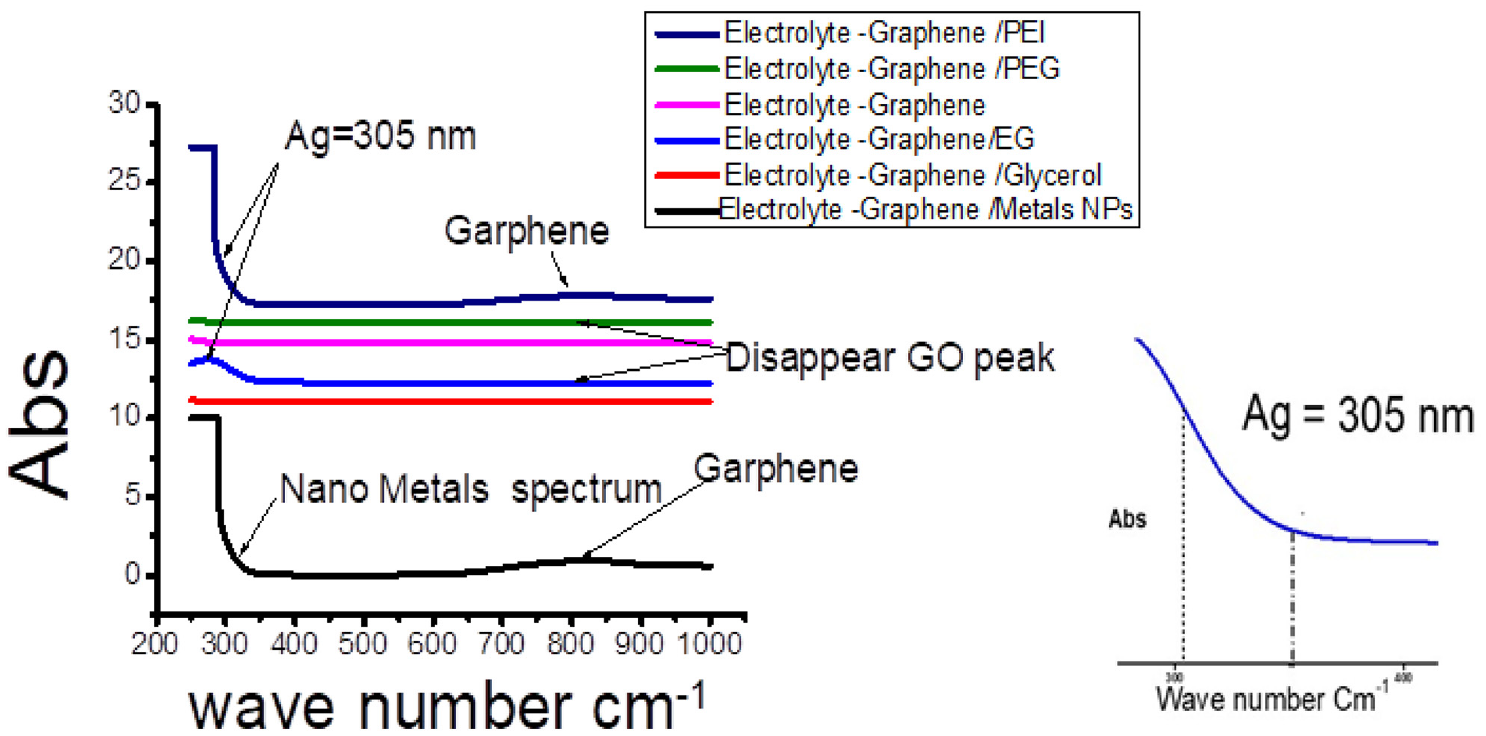
Characterize different prepared solutions by using Lambda 750 UV-vis-NIR spectrophotometer from Perkin Elmer using deionized water as blank sample Figure 7 represented UV absorption spectra of comparing serious 0.2 M OF prepared solutions(electrolyte, electrolyte -graphene, PEG electrolyte -graphene, EG - electrolyte – graphene, PEI – electrolyte – graphene, and glycerol – electrolyte -graphene). Upon comparing the absorbance spectra of the prepared solutions, as can be seen in Figure 7, the absorption spectra of the electrolyte salts reveal strong absorption in the 280–300 region, matching with the p–p* transitions of the conjugated graphene nanotube rings. Many peaks appear in the region at wavelengths between 320 and 285 nm in the case of PEG/electrolyte-graphene and electrolyte-graphene. Could be assigned to n–p* transition of Ag-Ag nanoparticles metals to Graphene molecules. 87 In contrast, the disappearance of that peak by using PEI, glycerol The importance of using Graphene in ferrous metallurgical applications is owed to high plasticity, low melting point, and relative stability with different material alloys (graphene–Ag, Graphene –Cu). Normal and derivative absorption spectra were recorded by UV/vis
Conclusion
Organic and inorganic nanocomposite materials play important roles in modern life. For example, nanoparticles or nanowires are mostly used in biological sensors to magnify their applications through nanowire electrical conductivity, electronic configuration, or modified way of nature. Nanoparticle complexes interact with matter. In the case of nanomaterials, they are usually employed for modifying the core or interface components.
Transducers are responsible to quantify the generated signal in the presence of the target object. Analytic measurements on the other hand, with a worldwide trend toward the effective use of electrolyte solutions in different fields like renewable energies, rechargeable battery technology, and biomedical sensors have especially steadily increased. Many researchers have stepped forward in developing electrolyte material by enhancing some improvements over salt concentrations in suitable salt solvent combinations. Contributing technical advantage lots of data of merit over alternative materials. Thus in this work, we have acquired fluidic solutions that will be applied in antenna fabrication. The highlighted properties are mainly conductivity, flexibility (viscosity-cohesiveness), non-toxic, and compatible composition.
Footnotes
Appendix
Author contributions
Dr. Nedil is completely responsible for Conceptualization, Data curation, in addition to Investigation, Prof . Fouad is a Formal analysis data acquisition, Project administration supervision. Dr. Siaj is facilitated all, Resources, and Software in his lab. in UQAM, Montreal, Ameenis collaborated in the collection of data,conducting experiments, Validation, Visualization, Writing original drafts, Writing-review & editing with his advisors.
Declaration of conflicting interests
The author(s) declared no potential conflicts of interest with respect to the research, authorship, and/or publication of this article.
Funding
The author(s) received no financial support for the research, authorship, and/or publication of this article.