
Abstract
Research on human resources (HR) indicates that many biases (e.g., halo effect, confirmation bias, stereotyping bias) affect decisions taken by HR employees. However, it remains unclear whether HR employees are aware of their susceptibility to bias. To improve understanding, this study examines the “bias blind spot” phenomenon, the tendency of individuals to believe they are less likely to be biased than their peers. This quantitative survey among 234 HR employees in Switzerland measured the bias blind spot on seven interview biases in recruitment decision-making. The study shows that participants rated the average HR colleague as more susceptible to bias than themselves. Furthermore, male HR employees partly showed a greater bias blind spot than female HR employees. These findings contribute to behavioral research in HR and offer practical insights.
Introduction
Some of the most critical decisions an organization takes involve the selection and hiring of new employees (Schmitt and Kim, 2007). This personnel selection—normally conducted through structured interviews—is a complex process requiring sound decision-making skills and attentive, thoughtful appraisal (Ahmad and Schroeder, 2002). Failure to hire the most suitable candidate leads to dissatisfaction and high opportunity costs for companies (Hunt, 2007). Nevertheless, several studies have shown that human resource (HR) employees are prone to cognitive biases when assessing potential candidates (Stevens, 2015). A better understanding of cognitive biases and associated potential pitfalls would improve hiring decisions (Gifford, 2014).
The term “cognitive bias” was introduced in 1972 by the later Nobel laureate Daniel Kahneman and his colleague Amos Tversky. It refers to the tendency of individuals to make systematic errors in their decisions and is contrary to the rational choice theory, which is often used in modeling economic and social behavior. One example of a cognitive bias discovered by Kahneman and Tversky is the “framing effect,” that is the phenomena how different phrasing affects individuals’ decision. For example, participants for a conference were found to register earlier when there was a “penalty” of $50 for late registration than when there was a discount of $50 for early registration (Gächter et al., 2009).
Several dozen other cognitive biases have been identified by psychologists and many of those biases have negative economic impacts. In business, these biases often lead to systematic errors and suboptimal outcomes, such as low survival chances for new ventures and low average financial returns (Thomas, 2018). For example, in business situations, decision makers are often influenced by biases such as overconfidence (the tendency to overestimate one’s own ability to make correct predictions or of one’s ability relative to others (Busenitz and Barney, 1997)) and overoptimism (the tendency to overestimate the likelihood of positive events and underestimate the likelihood of negative events (Sharot, 2011)). These biases cause poor financing decisions and suboptimal team-composition decisions (Thomas and Wulf, 2019). According to Moore et al. (2007), these biases also explain why some industries, such as restaurants, bars, and retail clothing, see continuous high rates of market entry, low profits, and high failure rates. Another example of a cognitive bias is the “Ostrich effect,” the tendency to ignore dangerous or negative information one fears may cause psychological discomfort by “burying” one’s head in the sand, like an ostrich (Karlsson et al., 2009). This effect can be observed among some investors, who have been found to check the value of their investments less often during bad markets, thus leading to poor financial decisions (Karlsson et al., 2009).
The aforementioned examples show that individuals exhibit numerous systematic biases in judgment and are, therefore, not always rational in their decision making (Kahneman et al., 1982; Tversky and Kahneman, 1974). However, individuals are often unaware of their own bias even though they can readily spot bias in the decision making of others (Nisbett and Wilson, 1977). Consequently, individuals tend to believe that they are less biased than their counterparts (Scopelliti et al., 2015)—a phenomenon known as the “bias blind spot” (Pronin et al., 2002). The bias blind spot is described as a meta-bias since it is a bias in recognition of other biases (Lilienfeld et al., 2016; Scopelliti et al., 2015). It has a negative influence on the quality of decision-making since individuals will believe that their own judgment needs less correction (Scopelliti et al., 2015).
It is currently unclear whether HR employees are fully aware of these potential risks in their decision-making, and, therefore, whether they can recognize their potential susceptibility to a bias blind spot. Research on the bias blind spot (Ehrlinger et al., 2005; Pronin and Kugler, 2007; Pronin et al., 2004; Scopelliti et al., 2015; West et al., 2012) remains scarce and mainly focuses on investigating the phenomenon in everyday situations involving, for example, college students or airport passengers. However, an existence of the bias blind spot in a business setting, such as choosing the best candidate for a managerial role, could have many, longer-lasting consequences. In addition, there has been no research yet on the bias blind spot and gender differences, even though studies have shown that men are generally more susceptible to many biases than women (Beyer and Bowden, 1997; Jacobsen et al., 2014). Consequently, this study investigates the following questions: (1) “Does the bias blind spot exist among HR employees?” and (2) “Is there a difference between male and female HR employees with regard to the bias blind spot?”
On a theoretical level, this study mainly contributes to the research stream on the bias blind spot since it determines whether this meta-bias can be detected in business decision-making situations. It draws on prospect theory from economics (Kahneman and Tversky, 1979) and dual-process theory from psychology (Evans, 2008; Evans and Stanovich, 2013; Wason and Evans, 1974). On a practical level, these findings will enhance understanding of the bias blind spot among HR employees and thereby provide information on possible biased hiring decisions and a lead on potential mitigating strategies.
Literature review and hypotheses
Hiring decisions in human resource management
HR management consists of four primary functions: staffing, training and development, motivation, and maintenance (DeCenzo et al., 2013). The hiring process is an essential aspect of staffing. In turn, the hiring process comprises four stages: first, defining the requirements, second, third and fourth, attracting, recruiting, and selecting candidates (Armstrong, 2006). The final stage—personnel selection—is of strategic importance because the quality of products and services depends mainly on successful personnel selection (Bartscher and Huber, 2007). The overall goal is to achieve the best match between available people and the vacant positions in a company at minimum cost (Imelauer, 2016). The selection process uses several selection tools, the most frequent of which is the face-to-face interview (DeCenzo et al., 2013). For this reason, our study focuses on the existence of the bias blind spot in face-to-face interviews.
Job interviews can be unstructured or structured. In a structured interview process, all candidates are asked the same questions in the same order, and most researchers recommend this approach for personnel selection (Mondy and Martocchio, 2016). However, even structured interviews can be influenced by subjective feelings and interviewer bias (Gmür and Thommen, 2014). The consequences of wrong hiring decisions can be severe; Since poor staffed positions in management generate substantial additional costs, potentially damaging the morale of the entire workforce, they should be avoided (Cook, 2008; Mondy and Martocchio, 2016). The existence of bias within the interview process is discussed in the following section.
Interview biases in hiring decisions
Cognitive biases are systematic errors in thinking that often significantly affect decisions and judgment (Kahneman and Tversky, 1979), and the occurrence of bias increases with the complexity of the situation and with time pressures (Derous et al., 2016). Hiring interviews are complex situations that require a high degree of thinking capacity (Linos and Reinhard, 2015). Additionally, these decisions often have to be made under time pressure if a post has been vacant for an extended period. It is not surprising; therefore, that existing HR research has already uncovered a range of different biases. The following section outlines seven biases that occur in hiring decisions during the interview process; those seven biases are the basis for measuring the bias blind spot (a meta-bias) in this study: confirmation bias, halo effect, in-group bias, order effects, peak-end rule, status-quo bias, and stereotyping bias. For the sake of simplicity, in this paper, the term interview biases is used for these types of bias.
The selection of these seven interview biases to measure the bias blind spot was based on two requirements: (1) there is empirical evidence that the bias occurs in the interview selection process and (2) the signs of the bias are seen in the interviewer rather than in the candidate.
Confirmation bias
Confirmation bias is defined as the tendency to search for information that confirms one’s initial prejudgment (Nickerson, 1998). It leads to arguments in favor of preconceived opinions being overrated while any evidence against them is disregarded or downplayed (Beck, 2014). Research has repeatedly shown that HR employees are prone to such bias (Linos and Reinhard, 2015). For example, Purkiss et al. (2006) empirically examined biases in interview situations. They found applicants with an ethnic name or those speaking with an accent were viewed less positively by interviewers than the ethnic-named a non-accent applicants. They also found that this initial impression affected the HR employees’ final decision on job suitability. The first finding can be attributed to the stereotyping bias (see below) while the latter is consistent with the confirmation bias. That means, once the HR employees has formed an initial impression of a candidate, during the interview process he or she tends to elicit only that information consistent with his or her initial perception and ignores any facts suggesting otherwise (Whysall, 2018).
Halo effect
The halo effect occurs when people project one specific (usually positive) characteristic of a person onto the other qualities of that person (Mondy and Martocchio, 2016). According to Nisbett and Wilson (1977: 250), the halo effect is “one of the oldest and most widely known psychological phenomena.” When hiring, the halo effect may cause HR employees to overrate a single character trait or a positive first impression of the candidate (Smith and Robertson, 1993). Subsequently, this impression is generalized for the other character traits, therefore creating the “halo,” which outshines any possible weaknesses. Existing research on HR shows that interviewers assess certain personality traits of a candidate disproportionately highly and draw false conclusions about the candidate’s competency. For example, a meta-analysis by Aamodt et al. (2006) and a laboratory experiment by Kutcher and Bragger (2004) found that physical appearance produces a halo effect: physically attractive people are often perceived as more intelligent and competent than they are.
Stereotyping bias
Stereotypes are characteristics or attributes applied to a group of people as the result of accepted beliefs that are held about that specific group (Koch et al., 2015). Types of stereotypes include, among others, racial, cultural, or gender stereotypes (Greenwald and Banaji, 1995). In this study, “stereotyping bias” is used as an umbrella term that includes sub-biases such as the stereotypical gender bias or the stereotypical racial bias. Stereotyping is an implicit bias in judgment and has been proven as one of the most commonly known in hiring decisions (Kawakami et al., 2005; Whysall, 2018). In job interviews, HR employees may assign specific candidate characteristics (such as race, gender, hobbies, previous job positions, or clothing) to a particular prevalent (positive or negative) stereotype they hold and use that stereotype to assess the candidate’s competence (Mondy and Martocchio, 2016). For example, Bertrand and Mullainathan (2004) conducted a field experiment to measure stereotypical racial bias by responding with fictitious résumés to newspapers ads. They manipulated perception of race by assigning either a very African-American sounding name or a very White sounding name to the résumé. The results showed that White names received 50 percent more callbacks for interviews.
Various studies have also shown a stereotypical gender biases for both “male” and “female”-dominated occupations (Kawakami et al., 2005). For example, Booth and Leigh (2010) found a stereotypical discrimination against male candidates when they were applying for female-dominated occupations such as waitstaff, sales staff, or data entry staff. An average male applicant would have to submit 28 percent more applications to receive the same number of callbacks for entry-level jobs that were female dominated. Many studies have shown similar results for male-dominated occupations: a meta-analysis by Koch et al. (2015) found that male applicants were favored for male-dominated positions, and Rudman and Glick (1999) showed that men are more commonly selected for supervisory roles than women since power and leadership are often viewed as masculine qualities while submissiveness and gentleness are seen as feminine characteristics.
In-group bias
In-group bias is defined as the tendency of people to be partial toward others in their group or to disapprove of those not in their group (Bendick and Nunes, 2012). People strive to increase their self-esteem by attributing positive characteristics to their “in-group” and negative characteristics to the “out-group” (Weeks et al., 2017). In the context of hiring decisions, candidates who are similar to the HR employee evoke a positive feeling as the interviewer may feel a personal connection to the candidate. For example, Finkelstein et al. (1995) found that younger managers rated younger candidates more favorably than older candidates in terms of qualification for the job and potential for development. The in-group bias also appears in characteristics such as gender, ethnicity, or social class, and when professional backgrounds or interests are similar. For example, Rivera (2012), drawing from 120 interviews with employers and participant observation of a hiring committee, found that concerns about shared culture were highly salient to employers and often outweighed concerns about productivity.
Status-quo bias
The status-quo bias is present when people stick to the status quo rather than opting for a potentially better solution that requires change (Samuelson and Zeckhauser, 1988). Instead of including all the available information in the decision-making process, people tend to choose what has already been agreed-on (Burmeister and Schade, 2007). Fear of loss is one reason why people opt for the status quo more often than is advisable or beneficial (Samuelson and Zeckhauser, 1988). In the same vein, when making hiring decisions, recruiters prefer a candidate similar to someone the recruiter has successfully hired before (Linos and Reinhard, 2015). Similarly, Johnson et al. (2016) conducted two laboratory experiments, in which participants were asked to review qualifications of three job candidates from a finalist pool of applicants. The authors manipulated race in the first experiment and gender in the second experiment. They found that, when a majority of the finalists were White or male (demonstrating the status quo), participants tended to recommend hiring a White or a male candidate. However, when a majority of finalists were Black or female, participants tended to recommend hiring a Black or a female candidate.
Order effects
Order effects state that people are biased by the order in which data or evidence is presented (Asch, 1946). Highhouse and Gallo (1997) distinguish between two different types of order effects: (a) primacy effects, which occur when judges are disproportionately influenced by earlier rather than later evidence, and (b) recency effects, which occur when judges are disproportionately influenced by later rather than earlier evidence. Due to selective memory, the order in which interviews take place or the order in which questions are asked directly influences how a candidate is perceived and rated (Linos and Reinhard, 2015). Research in Human Resource Management about order effects started as early as the 1970s, when Farr (1973) found recency effects in a study conducted with 140 personnel interviewers. A subsequent study (Farr and York, 1975) revealed that recency effects occurred when repeated judgments rather than single judgments were made. A laboratory experiment conducted by Highhouse and Gallo (1997) was also able to show recency effects. Recruiters susceptible to this bias remembered the first and last interviews in a series most clearly.
Peak-end rule
The peak-end rule implies that people tend only to remember the peak or the end of an experience and do not consider it in its entirety (Miron-Shatz, 2009). For example, research shows that, after a painful event, our memory fails to capture the total experience; instead, it disproportionately rates the moment at which the pain was severest or how we felt at the end of the ordeal (Hsu et al., 2018). Surprisingly, research about this bias in Human Resource Management is scarce (Schuttevaar, 2017), despite the peak-end rule being more prevalent for events or situations that have a clearly defined ending (Varey and Kahneman, 1992), such as job interviews. In the context of hiring decisions, the peak-end rule suggests that recruiters have difficulties recalling the full details of the interview and are, consequently, biased toward the high point or the conclusion of the interview, although these might not be the best moments to assesses the candidate suitability (Linos and Reinhard, 2015). Clark and Georgellis (2004) found empirical evidence for the existence of the peak-end rule in the field of Human Resource Management.
Bias blind spot
Bias blind spot is defined as a tendency to assume biased thinking in others while simultaneously considering oneself free from bias (Pronin et al., 2002). It occurs because individuals often lack conscious access to their own decision-making processes and are thus frequently unaware of their own biases (Nisbett and Wilson, 1977). Consequently, individuals tend to believe that they are less biased than their peers (Scopelliti et al., 2015).
Pronin et al. (2002), who conducted the first study to examine the bias blind spot, reported that many individuals—ranging from college students to airport passengers—consistently perceived themselves to be less biased than their peers. To measure the bias blind spot, the authors used “everyday life” biases such as self-serving attributions for success versus failure, dissonance reduction following free choice, biased assimilation of new information, and perceptions of hostile media bias toward one’s group or cause. They concluded that humans could generally detect biases in others, yet they could not generally identify these biases in themselves or, if they did, then to a lesser extent.
Several researchers have investigated the antecedents of the bias blind spot and suggest that possible causes are cognitive ability, self-esteem and self-awareness, and introspection illusion and naïve realism. For example, West et al. (2012) found that people with higher cognitive ability showed a higher susceptibility toward a bias blind spot. Scopelliti et al. (2015) reported that individuals with higher self-esteem are more likely to see themselves as immune from bias and, therefore, be more susceptible to a bias blind spot. They also showed that the bias blind spot is caused by a lack of self-awareness due to asymmetric consideration of evidence when assessing oneself and other people. For introspection illusion (i.e., the erroneous assumption that people can observe their mental processes) and naïve realism (i.e., the inner attitude of an individual who assumes that his or her subjective perception is, essentially, identical to objective reality) research (Ehrlinger et al., 2005; Pronin and Kugler, 2007; Pronin et al., 2004) suggests that the bias blind spot is connected to both.
So far, research on the bias blind spot is limited and has only been conducted in the field of psychology. Studies have usually compared groups such as students versus the average American, students versus fellow students, or airline passengers versus other travelers (Ehrlinger et al., 2005; Pronin et al., 2002, 2004; Scopelliti et al., 2015; West et al., 2012). Most studies found significant differences among these groups. As far as the authors of this paper are aware, the existence of a bias blind spot has not yet been examined in the research field of business administration or, more specifically, in HR. This lack is surprising considering the potentially severe consequences of the bias blind spot. Scopelliti et al. (2015) point out that the awareness of being vulnerable to biases is an important antecedent of openness to advice, which in turn can improve decision quality. For example, HR personnel high in bias blind spot may be particularly likely to ignore the advice of others, which in turn can lead to poorly staffed positions generating substantial additional costs and affecting the entire workforce morale (Cook, 2008; Mondy and Martocchio, 2016). Thus, this study seeks to address this gap in research. The subsequent hypotheses synthesize the arguments presented above. Hypothesis 1a refers to the bias blind spot (measured as a composite score, that is, the mean across all seven interview biases) while Hypothesis 1b refers to the bias blind spot for each individual (in total seven) interview bias.
A bias blind spot is closely linked to overoptimism (Pi et al., 2014) and overconfidence (Scopelliti et al., 2015). Overoptimistic or overconfident individuals tend to overestimate themselves and are more prone to a bias blind spot. Furthermore, research has repeatedly shown that women tend to be neither as overoptimistic nor as overconfident as men (Thomas, 2018). For example, Beyer and Bowden (1997) examined differences in self-perception and discovered that women show a greater tendency to underestimate themselves whereas men are more prone to overconfidence. Jacobsen et al. (2014) conducted similar studies in the financial sector and found similar results in that women show less overoptimism and less overconfidence than men. The authors are unaware, to date, of any research into differences between genders concerning the bias blind spot.
Based on the arguments presented above, we hypothesize that, in comparison to female HR employees, male HR employees will show a greater bias blind spot composite score and a greater bias blind spot for each individual interview bias.
Methodology
Participants and data collection
This cross-sectional study is based on a quantitative, questionnaire-based, online survey of a convenience sample of HR professionals in Switzerland. Participants were invited to the survey either through the LinkedIn feed of SwissStaffing, which is the Association of Swiss Recruitment Agencies, or through emails to approximately 280 generic HR department addresses gathered through desk research. The survey was conducted anonymously in German and no IP-addresses were collected. As an enticement, participants were entered into a draw to win two gift vouchers. Data collection took place in April 2019. Before conducting the survey, a pre-test was conducted with eight participants—mostly HR professionals—to check the questionnaire for comprehensibility, logic, and content. They were then asked to complete a feedback survey and, as a result, minor changes were made to the wording. The structure of the survey was perceived as clear, and the general order and content of the question items remained unchanged.
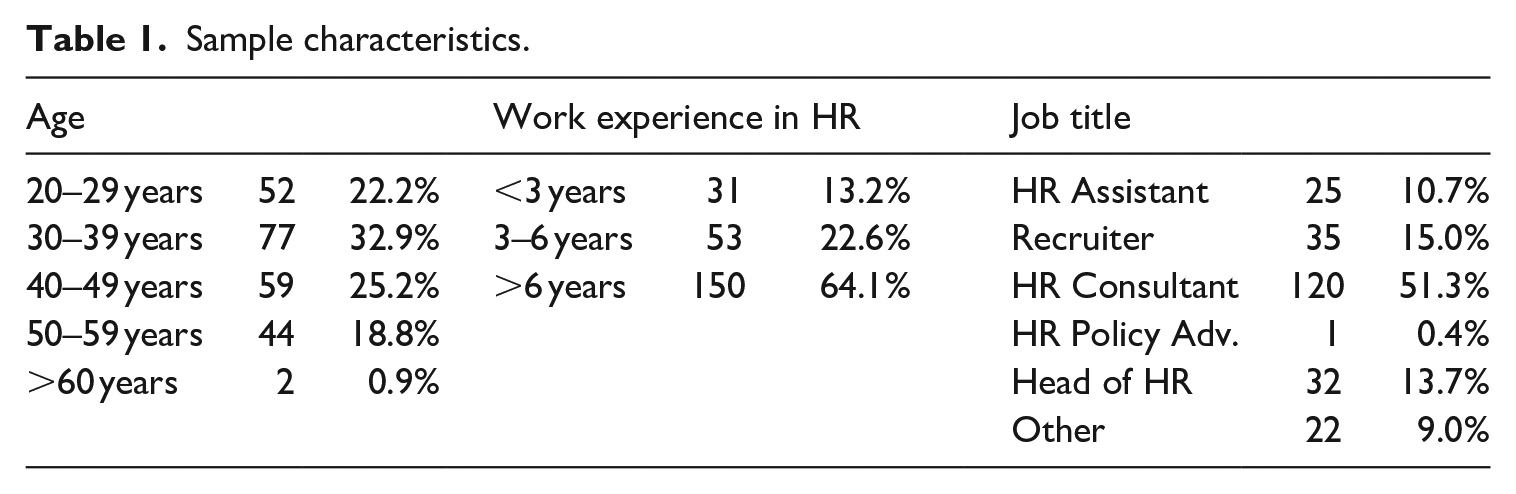
A total of 295 completed surveys were returned. To avoid sampling errors and ensure the correct sample selection, three sampling criteria were defined that participants had to meet. They had to (1) work in the field of HR and be employed in an HR company, (2) have experience of recruitment interviews, and (3) work in the German-speaking part of Switzerland. We excluded 61 participants from the sample who did not meet one or more of these sampling criteria or who did not answer the respective questions. The final sample consisted of 234 participants and comprised 31% men and 69% women. Our sample’s gender composition is not representative of the respective population in Switzerland (N = 6960 in 2019), which consists of 58% men (N = 4057) and 42% women (N = 2903) (Swiss Federal Statistical Office, 2022). The majority of our sample consisted of HR consultants (51%), recruiting specialists (15%), and heads of HR departments (14%). About 64% of the participants had more than 6 years of professional experience in HR. The sample characteristics are displayed in Table 1.
Sample characteristics.
Measures
Bias Blind Spot: The bias blind spot for this study is based on the seven interview biases described in the previous section. The measurement for the bias blind spot for each individual interview bias consisted of two questions and followed the same procedure. First, participants read a short description of each interview bias. Participants were then asked to evaluate how much they perceived themselves as susceptible to this bias (“To what extent do you believe that you show this effect or tendency?”). Following this, they were asked how much they perceived their average fellow HR colleague to be susceptible to this bias (“To what extent do you believe your average fellow HR colleague shows this effect or tendency?”).
Respondents were asked to indicate their evaluation on a seven-point Likert-type item ranging from 1 (not at all) to 7 (very strongly). The statements were adapted from Pronin et al. (2002). Descriptions of the seven interview biases were adapted from Highhouse and Gallo (1997), Linos and Reinhard (2015), Pronin et al. (2002), Scopelliti et al. (2015), and Varey and Kahneman (1992). The statements and descriptions were translated into German and back to English for verification purposes.
The bias blind spot (score) for each individual interview bias (H1b/H2b) was calculated as the difference in the perceived susceptibility of others and the perceived self-susceptibility (Pronin et al., 2002; Scopelliti et al., 2015; West et al., 2012). Instead of explicitly calculating bias blind spot composite scores (H1a/H2a), we use MANOVA for the combined assessment of all individual biases.
Findings
The data analysis consisted of multiple steps. The analyses were conducted using the General Linear Model (GLM) syntax commands in IBM SPSS 27. The model used to test hypothesis 1 will be referred to as model 1, the models used to test hypothesis 2 will be referred to as model 2a and model 2b.
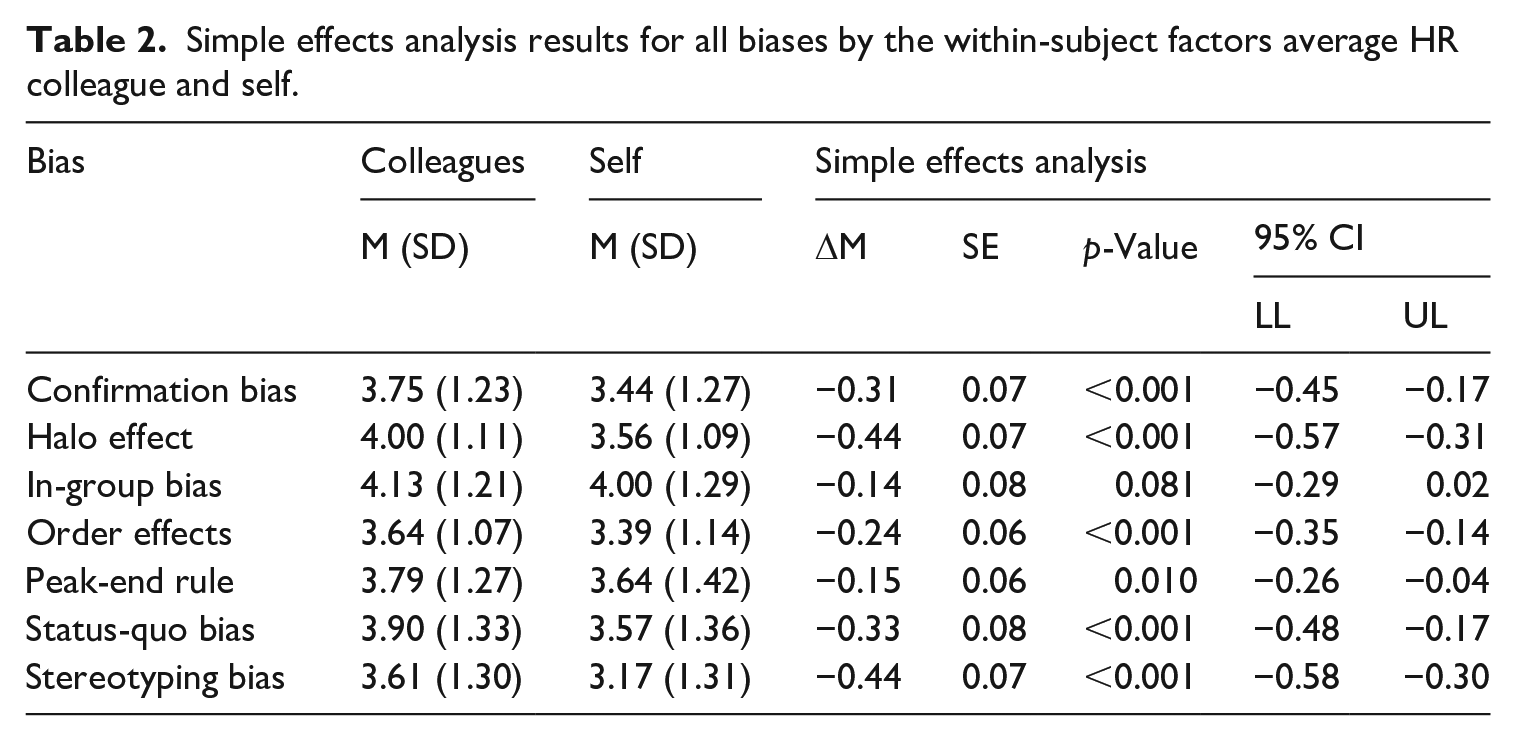
Hypothesis 1a predicted a bias blind spot among HR employees concerning hiring decisions. Hypothesis 1b predicted a bias blind spot for each individual interview bias. To test both H1 hypotheses, we conducted a repeated-measures MANOVA (model 1) using the two within-subject factors “unit of analysis” (average colleague vs. self) and “bias type” (each subject’s rating for each bias). We find significant main effect of unit of analysis (F(1, 233) = 52.99, p < 0.001) and bias type (F(5.55, 1292.32) = 13.25, p < 0.001). Also the interaction between unit of analysis and bias type is significant (F(5.29, 1231.60) = 4.30, p = 0.001). Since Mauchly’s test was significant for bias type (χ²(20) = 56.74, p < 0.001) and the interaction (χ²(20) = 92.44, p < 0.001), we report corrected degrees of freedoms using the Greenhouse-Geisser estimates (ε = 0.92 for bias type and ε = 0.88 for the interaction term). Table 2 shows the descriptive statistics and the results of the simple main effects analysis. For all biases except the In-Group Bias (p = 0.081), we find significant differences in the means at p = 0.01 or smaller. For all seven biases, participants report a higher bias of their colleagues vs. themselves. Also, the multivariate test statistics are significant for the following main factors: unit of analysis (Pillai’s V = 0.19, Wilk’s Λ = 0.82, Hoteling’s T = 0.23, Roy’s Largest Root Θ = 0.23, F(1, 233) = 52.99, p < 0.001), bias type (Pillai’s V = 0.28, Wilk’s Λ = 0.72, Hoteling’s T = 0.40, Roy’s Largest Root Θ = 0.40, F(6, 228) = 15.00, p < 0.001) and their interaction (Pillai’s V = 0.09, Wilk’s Λ = 0.92, Hoteling’s T = 0.09, Roy’s Largest Root Θ = 0.09, F(6, 228) = 15.00, p = 0.002). We conclude that Hypothesis 1a and Hypothesis 1b are fully supported.
Simple effects analysis results for all biases by the within-subject factors average HR colleague and self.
Hypothesis 2a predicted that male HR employees would show a greater bias blind spot in hiring decisions than female HR employees. Hypotheses 2b predicted a bias blind spot for each individual interview bias. To test hypothesis H2, we conducted a MANCOVA using gender as the between subjects factor and the bias blind spot score for each of the seven biases as an individual DVs. To account for the assumption that the more biased HR employees will leave the HR business and that, thus, the employees who remain will be less biased, we also added the recoded work experience of the participants (more than 6 years = 1, 6 years or less as = 0) as a covariate. Additionally, we recoded the education level to a dummy variable (1 = university education, 0 = no university education) and added it as a second covariate to control for the influence of education. Table 3 shows the multivariate and univariate test statistics of the MANCOVA (model 2a) and a MANOVA (model 2b) without the two covariates. Since both covariates had no significant effect in the multivariate or the univariate analysis of the MANCOVA, we continued our analysis with the MANOVA (model 2b). Table 4 shows the descriptive statistics for all bias blind spot scores by gender and the univariate statistics of the MANOVA.
Comparison of Multivariate and Univariate Statistics for MAN(C)OVAs.
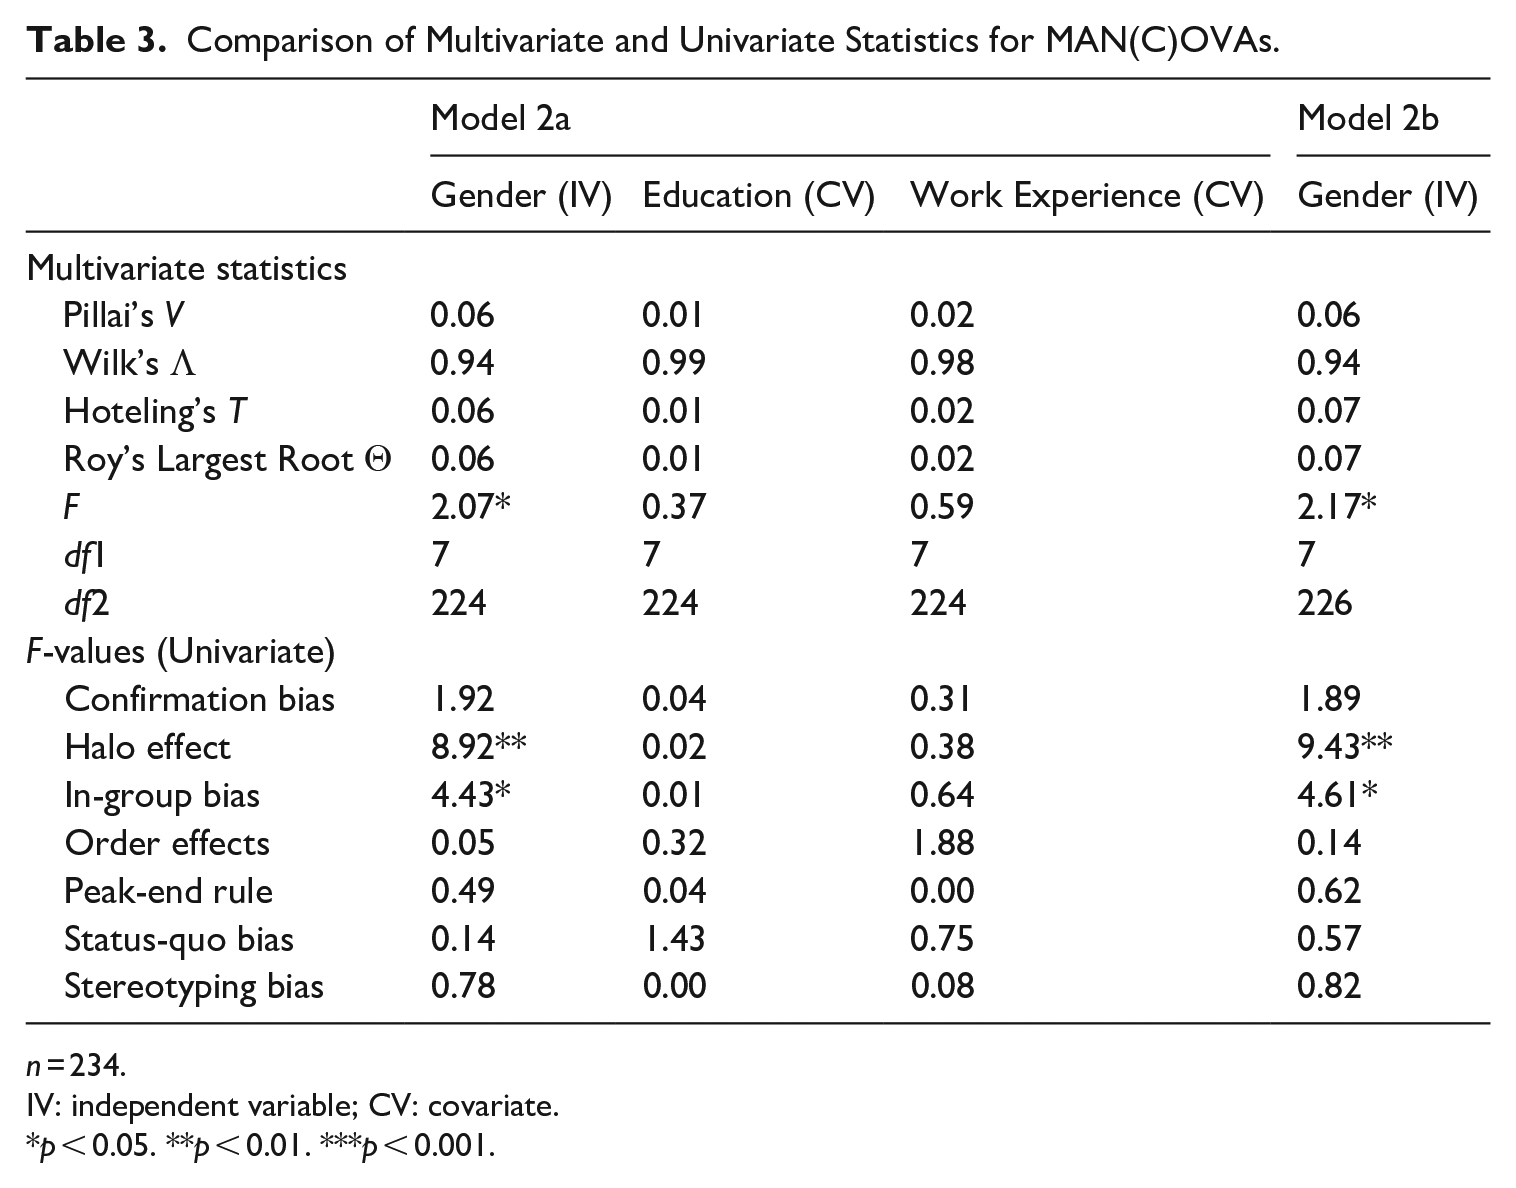
n = 234.
IV: independent variable; CV: covariate.
p < 0.05. **p < 0.01. ***p < 0.001.
Descriptive statistics und univariate ANOVA results on the bias blind spot score for all bias types by gender.
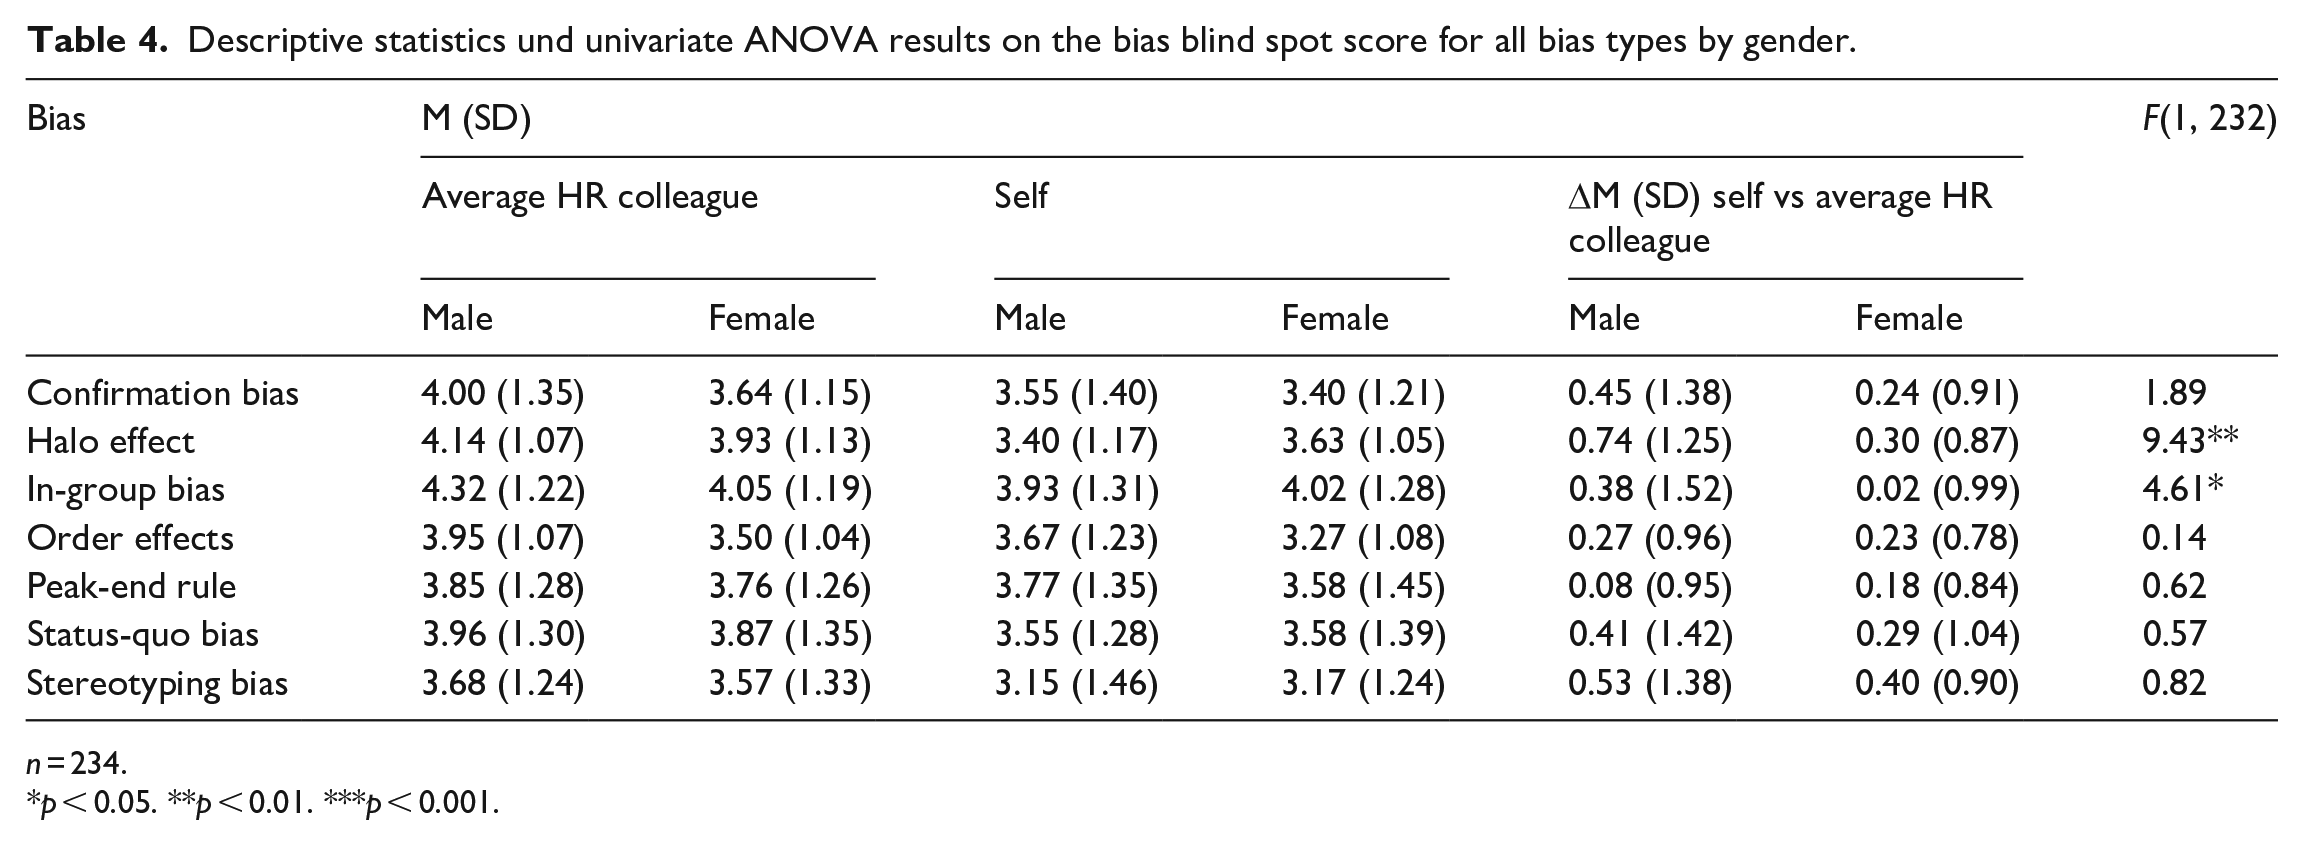
n = 234.
p < 0.05. **p < 0.01. ***p < 0.001.
The multivariate test reveals a significant effect of gender (Pillai’s V = 0.06, Wilk’s Λ = 0.94, Hoteling’s T = 0.07, Roy’s Largest Root Θ = 0.07, F(7, 226) = 2.17, p = 0.038). However, the univariate tests only show a relationship between gender and the bias types halo effect (F(1, 232) = 9.43, p = 0.002) and in-group bias (F(1, 232) = 4.61, p = 0.033). We do not find significant results for the other bias types on a univariate level (0.14 < Fs < 1.89, 0.171 < ps < .711). Interpreting the results of our second analysis is more challenging. While, for gender, the less sensitive univariate test only shows two significant results, the more sensitive multivariate test is significant in all cases. This difference might be a result of the limited statistical power on the univariate level to reveal the small effects’ sizes in our sample. Overall, we conclude that Hypothesis 2a and Hypothesis 2b are partially supported.
Discussion and implications
For individuals in general and HR employees in particular, identifying one’s susceptibility to the bias blind spot has important implications for (1) the occurrence of biases and (2) improving decision making (Scopelliti et al., 2015). Existing research indicates that many biases (e.g., halo effect, confirmation bias, or stereotyping bias) affect decision-making by HR employees. However, it remains unclear whether the bias blind spot exists in business context situations, such as in HR employees’ hiring decisions. This study addresses this research gap. As anticipated, the results show that HR employees demonstrate a bias blind spot on several biases occurring during the interview process. This study shows significant results for all individual interview biases (confirmation bias, halo effect, in-group bias, order effects, peak-end rule, status-quo bias, and stereotyping bias) on the univariate and, for the composite, on a multivariate level. Therefore, hypotheses 1a and 1b are confirmed. This study also found significant differences in the bias blind spot between male and female HR employees. As predicted, male HR employees show a greater bias blind spot in hiring decisions than female HR employees in the multivariate test (H2a). A gender effect for two individual interview biases—the halo effect and in-group bias—was also found on the univariate level, thereby partially confirming H2b. It is noteworthy that these two items belong to the group of so-called motivational biases, which are determined by personal desirability or undesirability (in contrast to the group of cognitive biases such as order effect and peak-end rule, which arise from deficient cognitive processes) (Montibeller and von Winterfeldt, 2015; Zakay and Fleisig, 2012).
This study contributes to theory and research on several levels. It contributes to research on the bias blind spot (Ehrlinger et al., 2005; Pronin and Kugler, 2007; Pronin et al., 2004) since it provides additional evidence that the bias blind spot not only exists in everyday situations but also in critical business decision-making situations such as hiring decisions. To the best of the authors’ knowledge, this is the first study to examine the bias blind spot in the research field of business administration or, more specifically, in HR.
Furthermore, the majority of participants in this study had over 6 years of work experience in HR (64.1%) and were employed in senior roles as HR consultants (51.3%) or heads of HR departments (13.7%). Also, 90.2% of the sample had a higher education degree. Despite their wealth of experience and level of education, this study identified a bias blind spot among participants. This study, therefore, confirms research by West et al. (2012), who showed that the bias blind spot exists independently of cognitive sophistication and is not necessarily reduced by professional experience or awareness of bias.
Another interesting conclusion from this study can be drawn with reference to the ambiguous results in research about the effect of debiasing strategies. Researchers have long suggested that debiasing training sessions and strategies, such as reference class forecasting (Flyvbjerg, 2008) and pre-mortem analysis (Kahneman, 2011; Klein, 2007), might help counteract the adverse effects of cognitive biases. However, research on human resources has shown partially ambiguous results for such debiasing training. For example, some studies about stereotyping bias found that recruiters were prone to gender stereotyping despite receiving training (Kawakami et al., 2005) while others reported that trained professionals showed less stereotyping bias (Koch et al., 2015). The prevalence of the bias blind spot among HR employees might be a possible explanation for these ambiguous results in earlier HR research: when people are unaware of being vulnerable to the bias blind spot, they are less likely to improve their decision-making by participating in debiasing training (Scopelliti et al., 2015).
This study also has potentially significant practical implications for HR. Failure to hire the most suitable candidate owing to biased decision-making leads to dissatisfaction and high opportunity costs for companies (Hunt, 2007). As mentioned, the awareness of being susceptible to the bias blind spot has important implications for the occurrence of biases.
Limitations and future research
As well as offering avenues for future research, this study acknowledges some limitations. First, the study sample consists solely of HR employees working in the German-speaking part of Switzerland so the results may not be transferable to other countries. Also, the gender composition of our sample is not representative of the population. Future research should include a broader range of test subjects.
Second, the survey method used (questionnaire) may facilitate significant results, in this case the existence of a bias blind spot, because participants may provide self-serving rather than deliberate responses. Further observational research in real HR decision contexts (instead of questionnaires) should be conducted to determine whether HR personnel exhibit similar behavior in a relevant decision context.
Third, in terms of hiring decisions, this study has focused on the interview as a selection method, and frequently used alternative selection methods, such as assessment centers or tests (Bartscher and Huber, 2007) have not been considered. Researchers may wish to investigate whether the bias blind spot also occurs when recruitment methods other than the personal interview are used.
Fourth, this study focuses on seven biases considered relevant to job interviews—confirmation bias, halo effect, in-group bias, order effects, peak-end rule, status-quo bias, and stereotyping bias. However, this list is not exhaustive, and there might be other biases in the interview processes that exert an unhelpful influence. Studies incorporating other bias items might show different results, and researchers may wish to address these.
Lastly, researchers may also wish to examine whether HR employees from specific industries (e.g., the financial sector) are more susceptible to the bias blind spot than other branches, or whether line managers behave similarly to HR specialists in recruitment interviews.