
Abstract
Introduction:
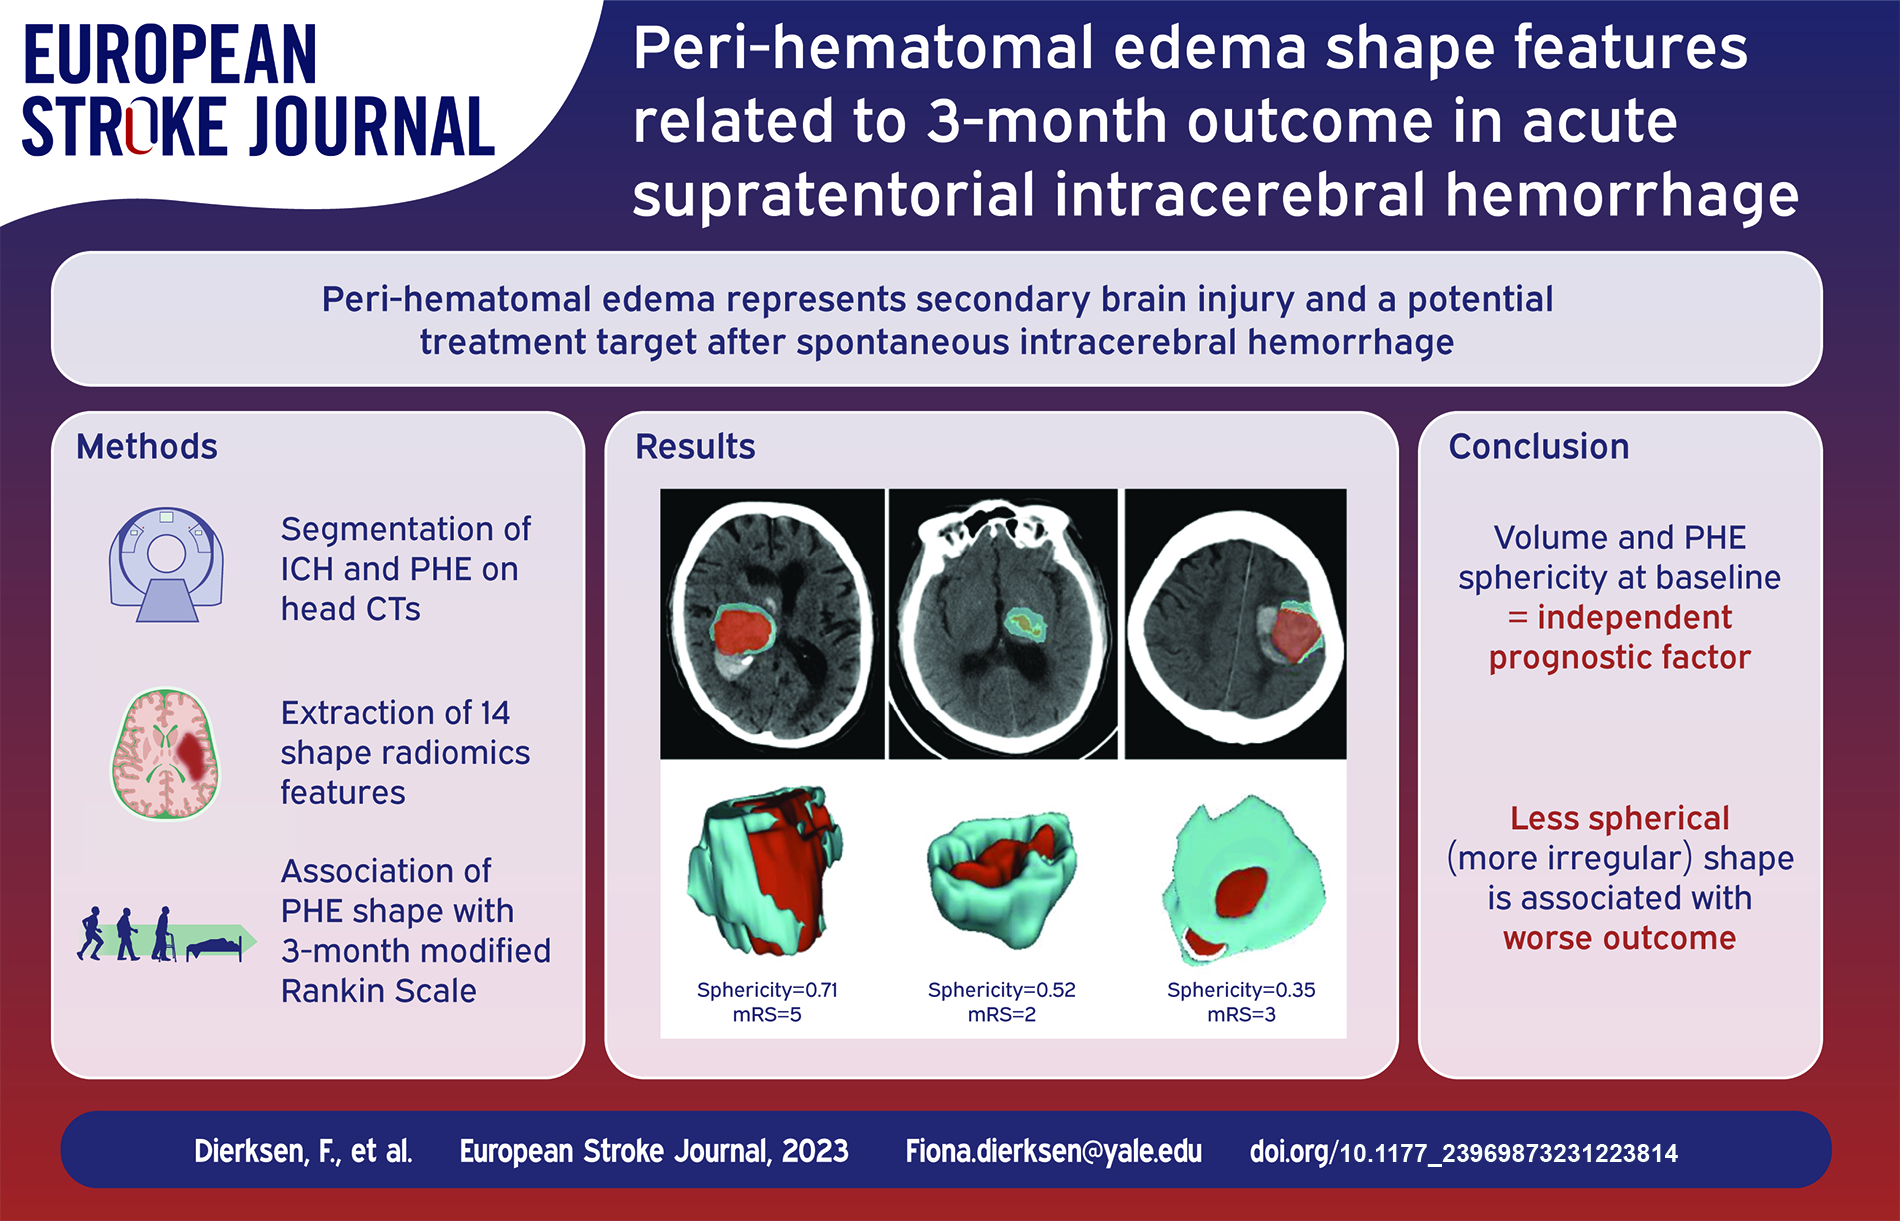
Perihematomal edema (PHE) represents secondary brain injury and a potential treatment target in intracerebral hemorrhage (ICH). However, studies differ on optimal PHE volume metrics as prognostic factor(s) after spontaneous, non-traumatic ICH. This study examines associations of baseline and 24-h PHE shape features with 3-month outcomes.
Patients and methods:
We included 796 patients from a multicentric trial dataset and manually segmented ICH and PHE on baseline and follow-up CTs, extracting 14 shape features. We explored the association of baseline, follow-up, difference (baseline/follow-up) and temporal rate (difference/time gap) of PHE shape changes with 3-month modified Rankin Score (mRS) – using Spearman correlation. Then, using multivariable analysis, we determined if PHE shape features independently predict outcome adjusting for patients’ age, sex, NIH stroke scale (NIHSS), Glasgow Coma Scale (GCS), and hematoma volume.
Results:
Baseline PHE maximum diameters across various planes, main axes, volume, surface, and sphericity correlated with 3-month mRS adjusting for multiple comparisons. The 24-h difference and temporal change rates of these features had significant association with outcome – but not the 24-h absolute values. In multivariable regression, baseline PHE shape sphericity (OR = 2.04, CI = 1.71–2.43) and volume (OR = 0.99, CI = 0. 98–1.0), alongside admission NIHSS (OR = 0.86, CI = 0.83–0.88), hematoma volume (OR = 0.99, CI = 0. 99–1.0), and age (OR = 0.96, CI = 0.95–0.97) were independent predictors of favorable outcomes.
Conclusion:
In acute ICH patients, PHE shape sphericity at baseline emerged as an independent prognostic factor, with a less spherical (more irregular) shape associated with worse outcome. The PHE shape features absolute values over the first 24 h provide no added prognostic value to baseline metrics.
Introduction
Peri-hematomal edema (PHE) is considered a radiological marker of secondary brain injury after spontaneous, non-traumatic intracerebral hemorrhage (ICH) and is considered a potential target for neuro-protective and/or anti-inflammation therapies. 1 Subsequently, the PHE volume has been reported as a prognostic factor in patients with ICH. 2 On the other hand, some groups reported that the post-ICH expansion of PHE – rather than the baseline PHE volume – is more prognostically 1 informative. 3 Yet, Venkatasubramanian et al. found no clear association between PHE growth from admission to peak volume and the 90-day functional outcome. 4
However, it is worth considering that other shape features, beyond volume, may hold key insights and may provide a more comprehensive basis for evaluating the PHE expansion. This concept finds further support in oncology investigations, where shape features, other than tumor volume, have emerged as crucial prognostic indicators. 5 Thus, in this study, we aimed to examine the prognostic correlates of different PHE shape features at baseline and 24-h follow-up as well as their interval changes with 3-month outcomes using a detailed multicentric trial dataset.
Methods
Patients
We conducted an observational study based on retrospective analyses of clinical and imaging data from the “Antihypertensive Treatment of Acute Cerebral Hemorrhage-II” (ATACH-2) trial. 6 We excluded patients with CT artifacts affecting hematoma, corrupted scans, or missing admission or follow-up clinical variables (Figure 1).
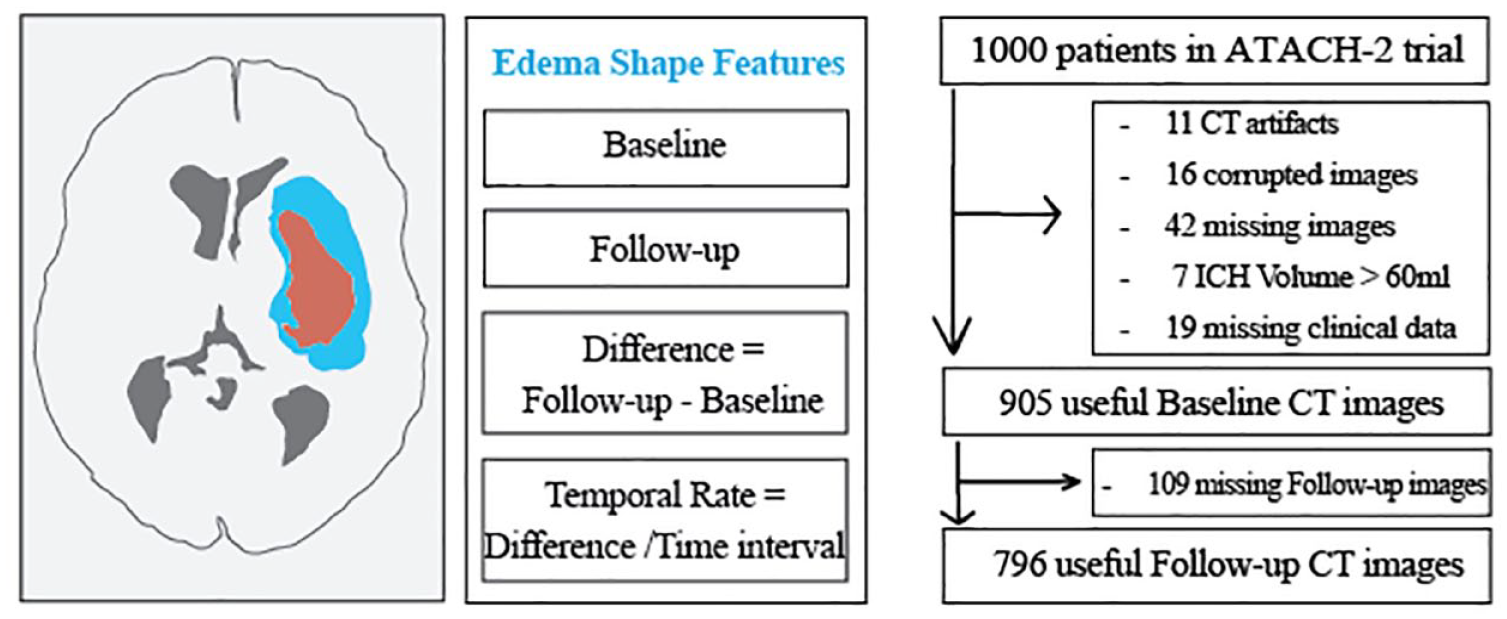
Overall study design. We included patients with complete baseline and follow-up clinical information and adequate quality of head CTs as summarized in the flowchart. We extracted 14 shape features (Table 1) from manually segmented peri-hematoma edema (blue) surrounding the intracerebral hemorrhage (red) on “baseline” and “follow-up” non-contrast head CTs. We calculated the “shape feature difference” by subtracting follow-up from baseline values and the “temporal rate” of shape features change by dividing “shape feature difference” by the time interval between follow-up and baseline CT scans.
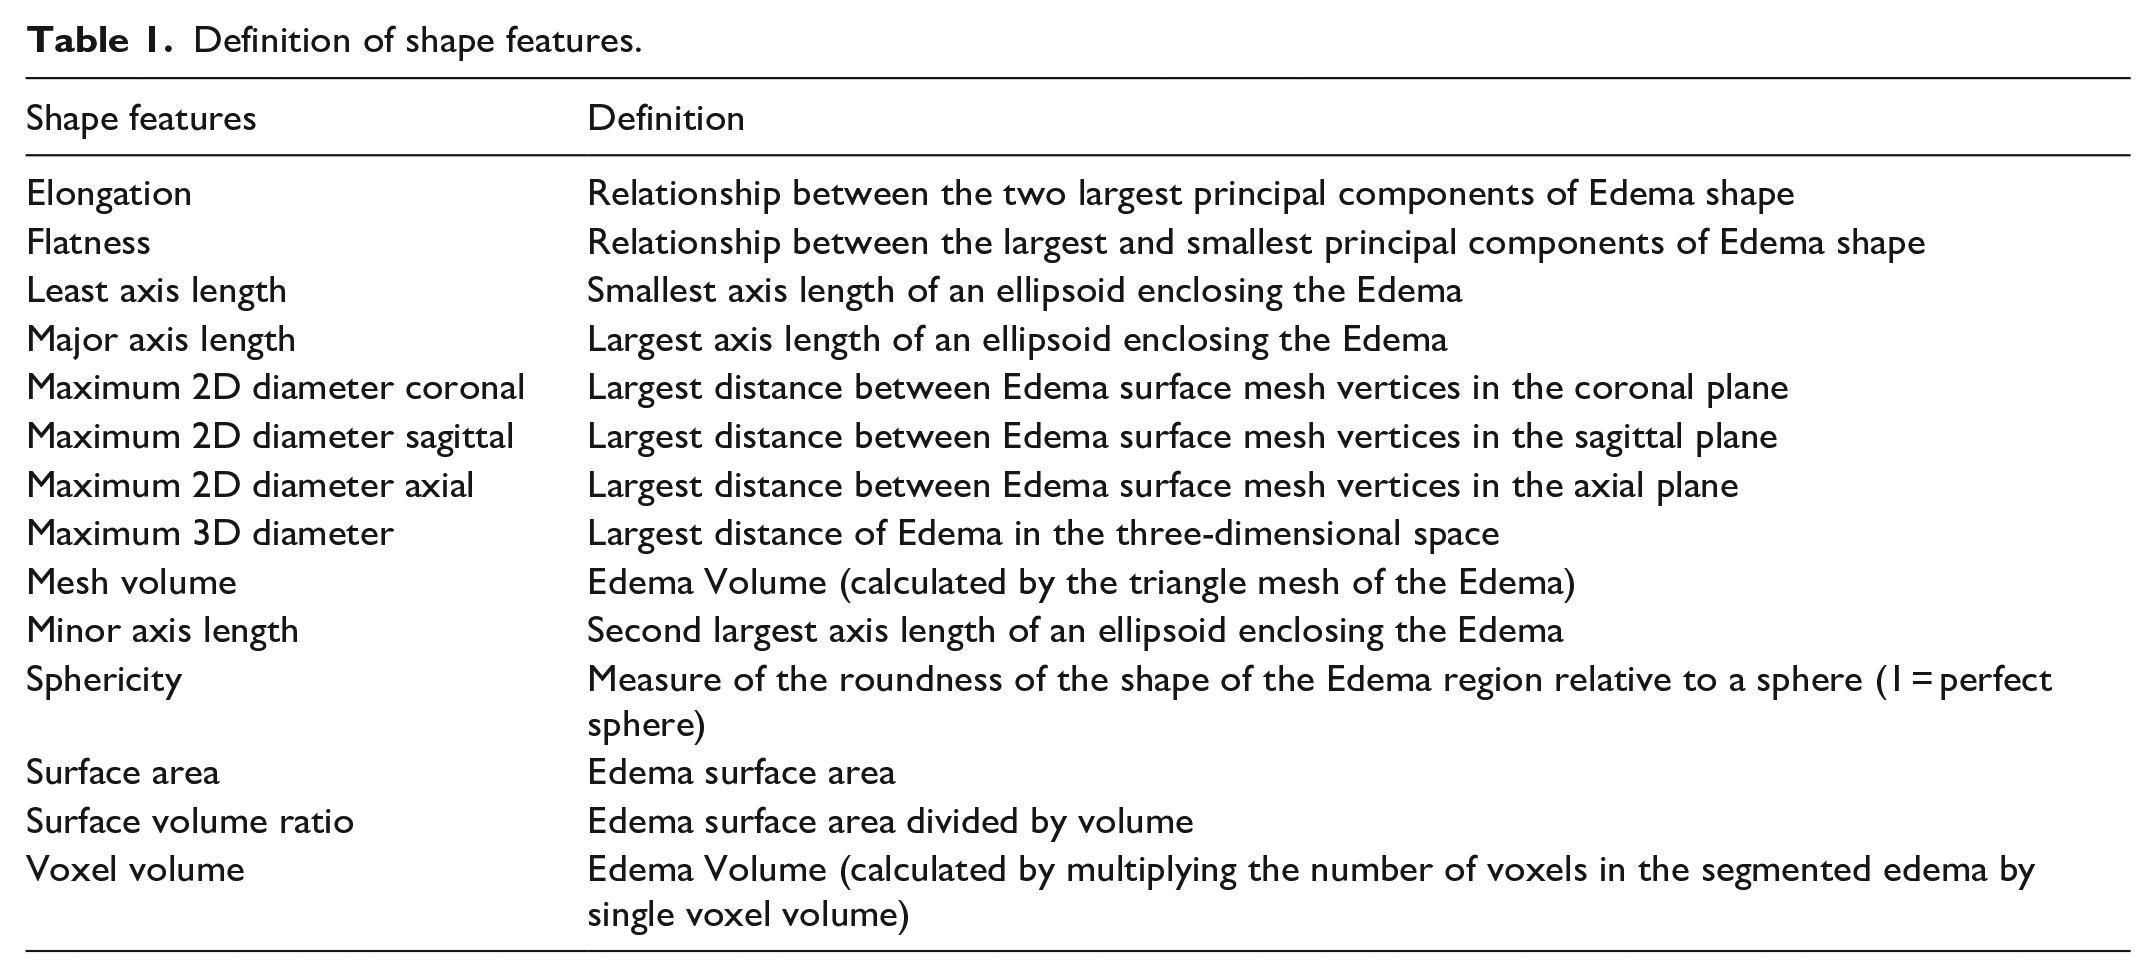
Definition of shape features.
Data acquisition and allocation
The ATACH-2 was a multi-centric randomized controlled trial comparing standard versus intensive blood pressure reduction among patients with acute spontaneous supratentorial ICH. The main inclusion criteria were a baseline ICH volume of less than 60 mL using the ABC/2 formula and an elevated admission systolic blood pressure exceeding 180 mmHg. 6 The study received approval from Institutional Review Boards in corresponding centers.
Segmentations of hematoma and surrounding edema
After initial training on subset of 100 subjects, three research associates manually segmented hematomas and surrounded edema on both admission and follow-up non-contrast head CT scans, axial slice by slice, using the Paint and Erase tool of MRIcron. An expert neuroradiologist (SP) conducted a thorough review and verification of all segmentations to ensure their accuracy, providing continuous feedback to research associates to maintain and improve segmentation process. In addition, in another subset of 100 subjects, all lesions were segmented two more times, once by the original research associate and once by a second reviewer, to determine the intra- and inter-rater reliability based on intra-class correlation (ICC).
Extraction of edema shape features
We employed the pyradiomics version 2.2.07–10 to automatically extract 14 shape features from PHE lesions on admission and follow-up scans as described in Table 1 and depicted in Figure 2. All features were extracted from 3-dimensional PHE volumes reconstructed from manual segmentation on axial slices. To prevent inadvertent inclusion of hematoma in the PHE lesions, we applied 1–200 Hounsfield Unit (HU) range for hemorrhage and 1–40 HU range for PHE. Prior studies have applied 5-to-23 and 5-to-33 range for PHE,11,12 and above 40 HU for ICH.13,14 We further expanded the HU range to prevent presence of any unfilled holes within PHE and hematoma lesions. For each feature, we also calculated the “shape feature difference” by subtracting follow-up from baseline values and the “temporal rate” of shape features changes by dividing “shape feature difference” by the relative time difference between follow-up and baseline CT scans (Figure 1), to adjust for time-dependent evolution of edema after the ICH onset.
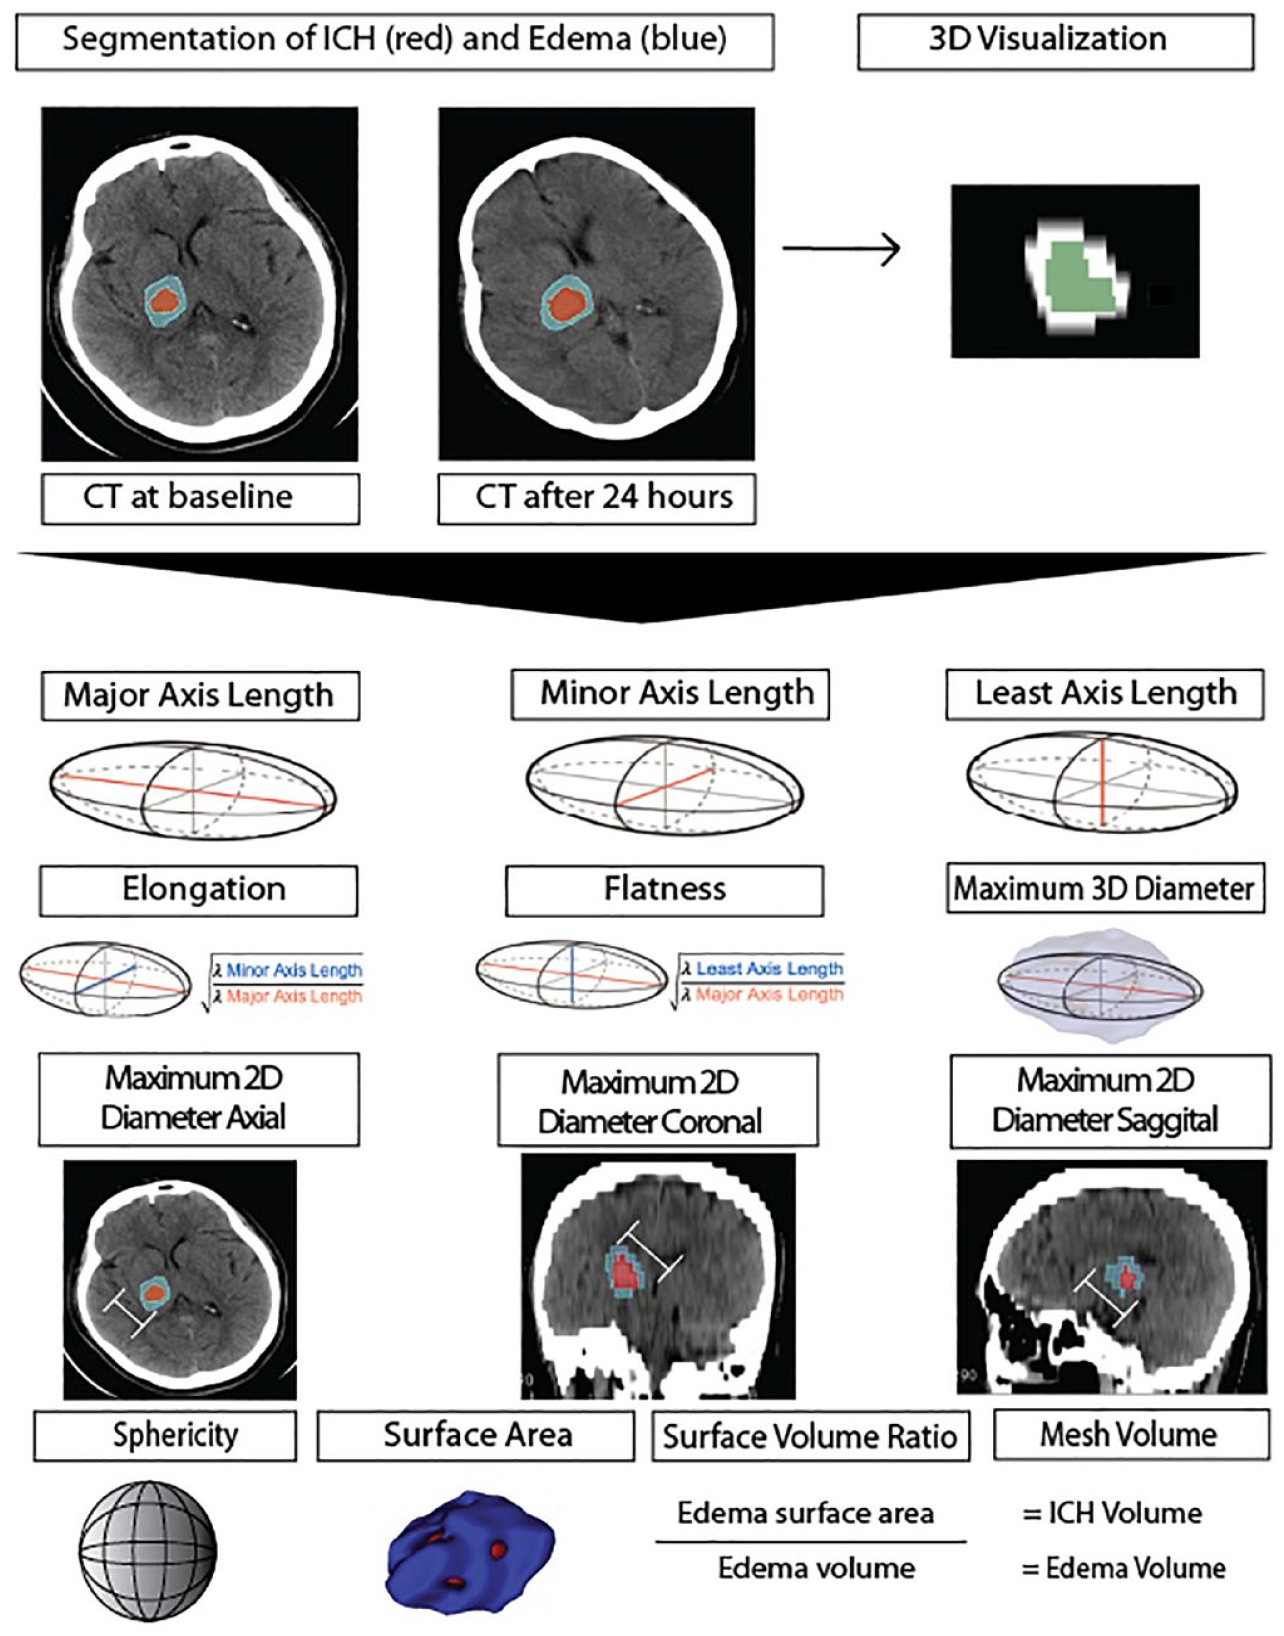
Visualization of peri-hematoma edema shape features (described in Table 1).
Statistical analysis
Continuous variables are reported as mean ± standard deviation, ordinal variables as median (interquartile), and nominal variables as frequency (percentage). Favorable outcome is commonly defined by 3-month modified Rankin scale (mRS) score of 0-to-3 in patients with hemorrhagic stroke. We compared the baseline clinical and imaging characteristics of patients between those with favorable versus unfavorable outcome – applying student t-test for continuous variables, Mann-Whitney rank sum test for ordinal variables (that did not follow a normal distribution), and Chi-square test for binary variables. In separate univariate analyses, we applied spearman correlation to determine the association of each shape feature at baseline and 24-h follow-up as well as shape feature differences and temporal rate of changes with 0-to-6 score 3-month mRS. Then, we applied separate ordinal regression analysis to determine if each shape feature is predictive of 3-month mRS, adjusting for admission age, sex, NIH Stroke Scale (NIHSS) scores, Glasgow Coma Scale (GCS), baseline ICH volume, and time-to-treatment as covariates. To account for multiple comparison, all calculated p-values were adjusted using the false discovery rate (FDR) method. Finally, we applied multivariable stepwise logistic regression to examine whether any of PHE shape features are independent predictors of favorable outcome – using bidirectional variable selection (forwards p < 0.05, backwards p < 0.10). We report the odds ratio (OR) and 95% confidence interval (CI) for variables retained in the model. For multivariable analysis, we applied the model including baseline shape features in addition to clinical variables, and then including baseline, follow-up, difference and temporal rate of shape feature changes in addition to clinical variables.
Results
Patients characteristics
From 1000 patients enrolled in ATACH-2 trial, 796 were included (Figure 1). The flowchart in Figure 1 summarizes the inclusion/exclusion of subjects in our analysis. Overall, the mean age of the patients was 61.9 ± 13.1 years and 493 (62%) were male. Among them, 498 (62.56%) had favorable outcome (mRS 0-to-3). Supplemental Table 1 compares the clinical characteristics of patients with favorable versus unfavorable outcomes.
Association of PHE shape features with clinical outcome
The inter- and intra-rater reliability of PHE shape features assessed by ICC are summarized in Supplemental Table 2. Except for elongation, all other features had >0.75 average inter- and intra-rater ICC. Supplemental Table 3 lists the Rho correlation coefficients and p values of different PHE shape features with 3-month mRS. Shape features related to admission PHE maximum diameters in each of the three planes, along with major and minor axes, volume, surface area, and sphericity at baseline were associated with 3-month mRS after adjustment of p values (p < 0.001) for multiple comparison (Supplemental Table 3). In addition, the shape feature difference and temporal rate of changes between 24-h follow-up and baseline (but not the 24-h features themselves) were also associated with outcome. Whereas, PHE “Elongation” (p = 0.536), “Flatness” (p = 0.148), and “Surface/Volume Ratio” (p = 0.239) had no significant association with outcomes.
The PHE shape features predictive of clinical outcome
Table 2 presents the results of separate ordinal logistic regression analysis, examining the association between PHE shape features and the 3-month mRS score outcome, adjusting for age, sex, admission NIHSS, GCS, treatment, ICH Volume, and Time-to-treatment as covariates. After correcting for multiple comparisons, baseline sphericity (p = 0.047) was predictive of 3-month mRS (Table 2) with an Odds Ratio of 0.03 and a 95% Confidence Interval of 0.003–0.4. However, none of the features on 24-h follow-up scan, or shape feature difference, or temporal rate of changes were predictive of 3-month mRS after adjusting for age, sex, admission NIHSS, GCS, treatment, ICH Volume, and Time-to-treatment as covariates (Table 2).
Multivariable analysis to determine peri-hematomal edema shape features predictive of 3-months modified Ranking Scale score after adjusting for predictors of outcome.
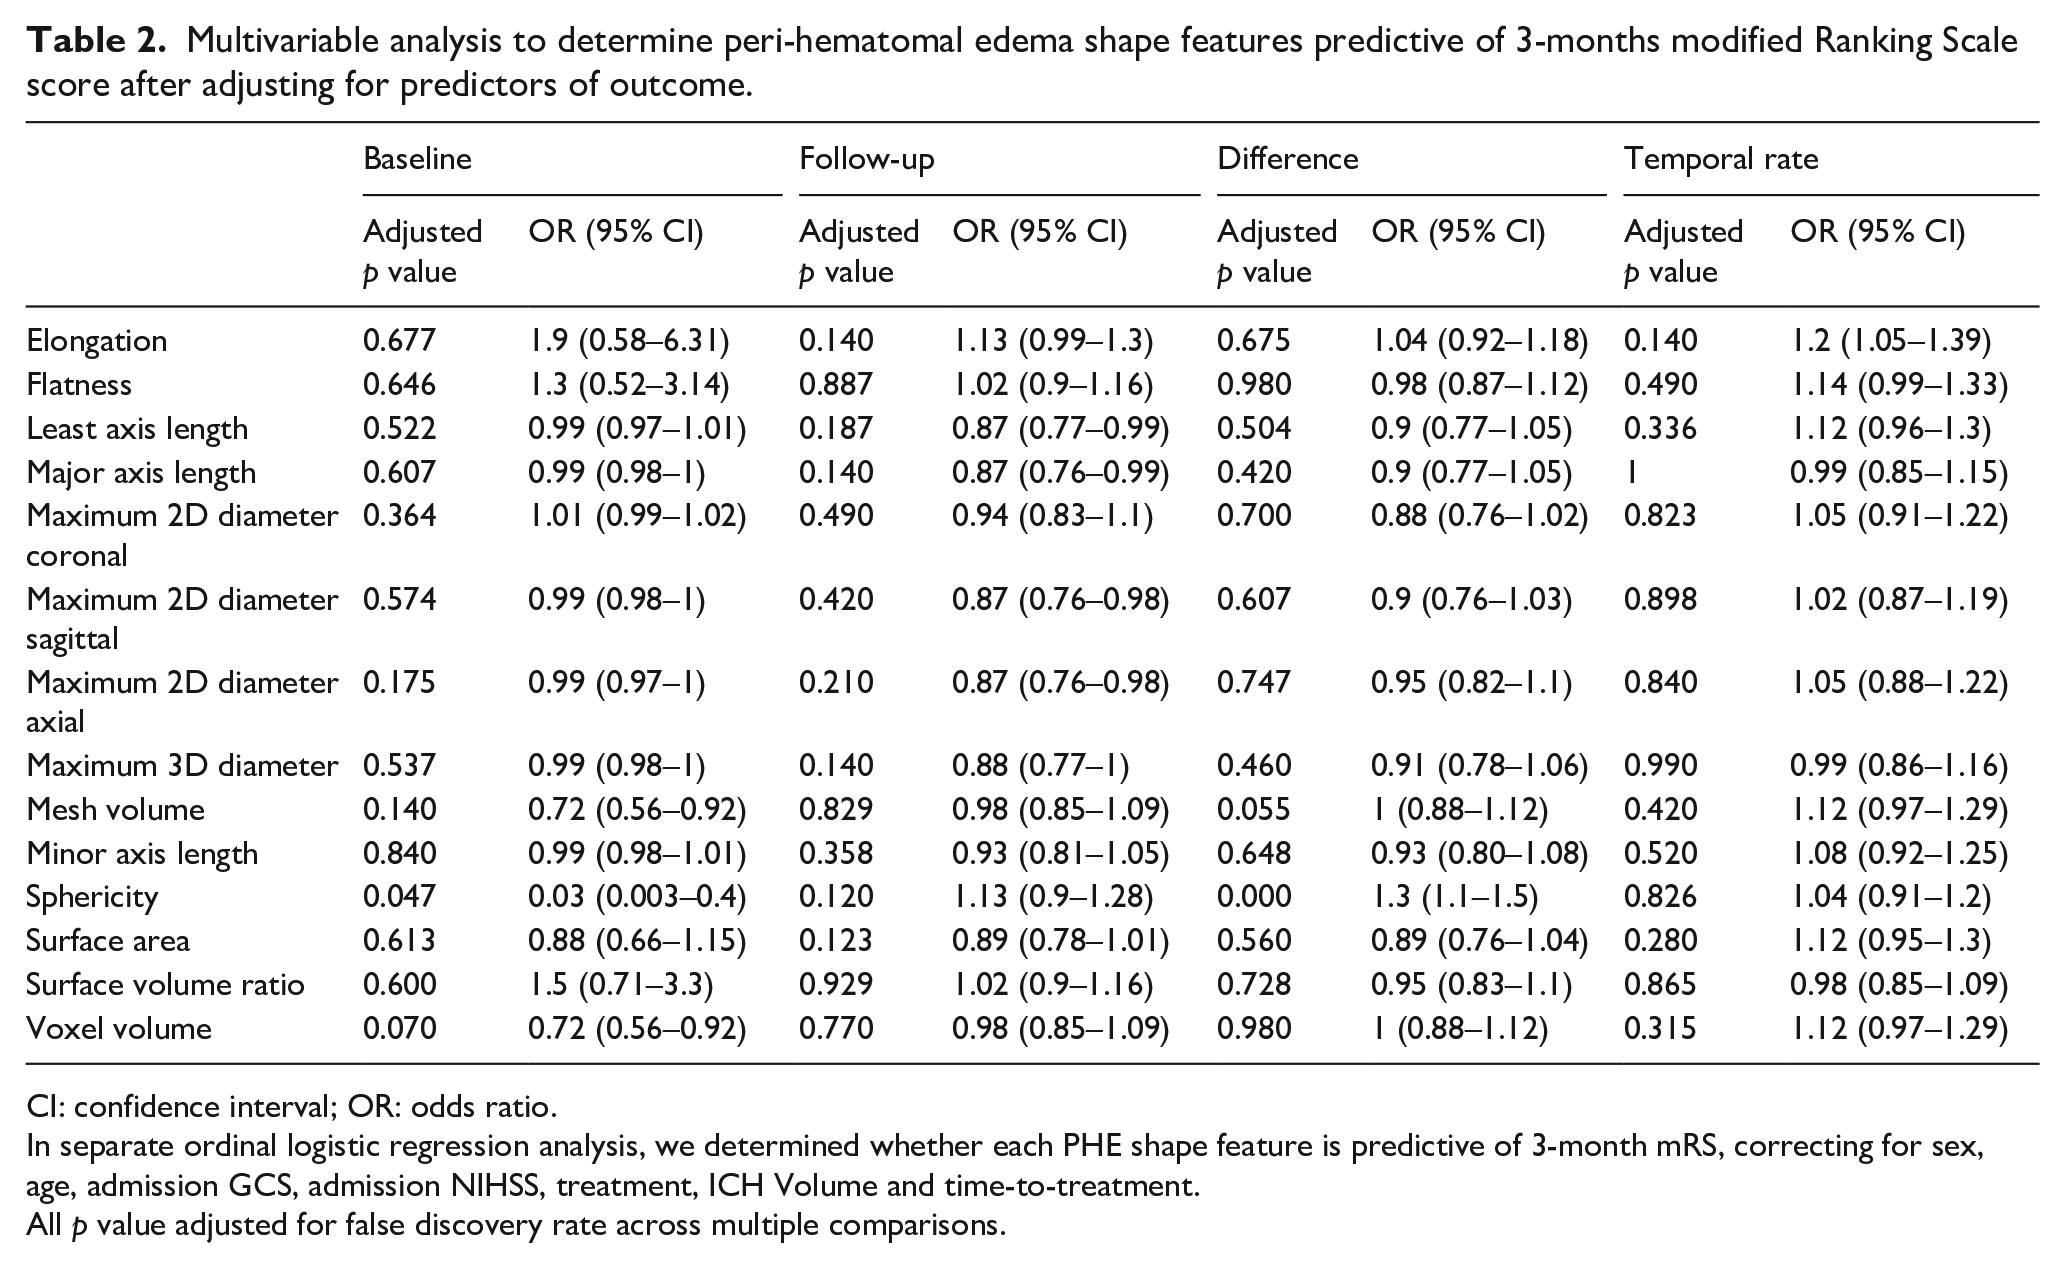
CI: confidence interval; OR: odds ratio.
In separate ordinal logistic regression analysis, we determined whether each PHE shape feature is predictive of 3-month mRS, correcting for sex, age, admission GCS, admission NIHSS, treatment, ICH Volume and time-to-treatment.
All p value adjusted for false discovery rate across multiple comparisons.
Independent predictors of favorable versus unfavorable outcome
In stepwise multivariable logistic regression, in addition to admission NIHSS (p < 0.001), ICH Volume (p = 0.002), and age (p < 0.001), the baseline PHE shape Sphericity (p = 0.029) and Voxel Volume (p = 0.026) were independent predictors of favorable outcome defined as 3-month mRS 0-to-3 (Table 3). When including follow-up, difference, and rate shape features of PHE in a multivariable model, the PHE shape Sphericity (p = 0.033) and Voxel Volume (p = 0.033) at baseline and Maximum 2D Diameter Axial (p = 0.040) at follow-up were independent predictors of favorable outcome defined as 3-month mRS 0-to-3 (Supplemental Table 4).
Independent baseline clinical and imaging predictors of favorable outcome (modified Rankin Scale score of 0-to-3) at 3-month follow-up, using stepwise multivariable logistic regression.
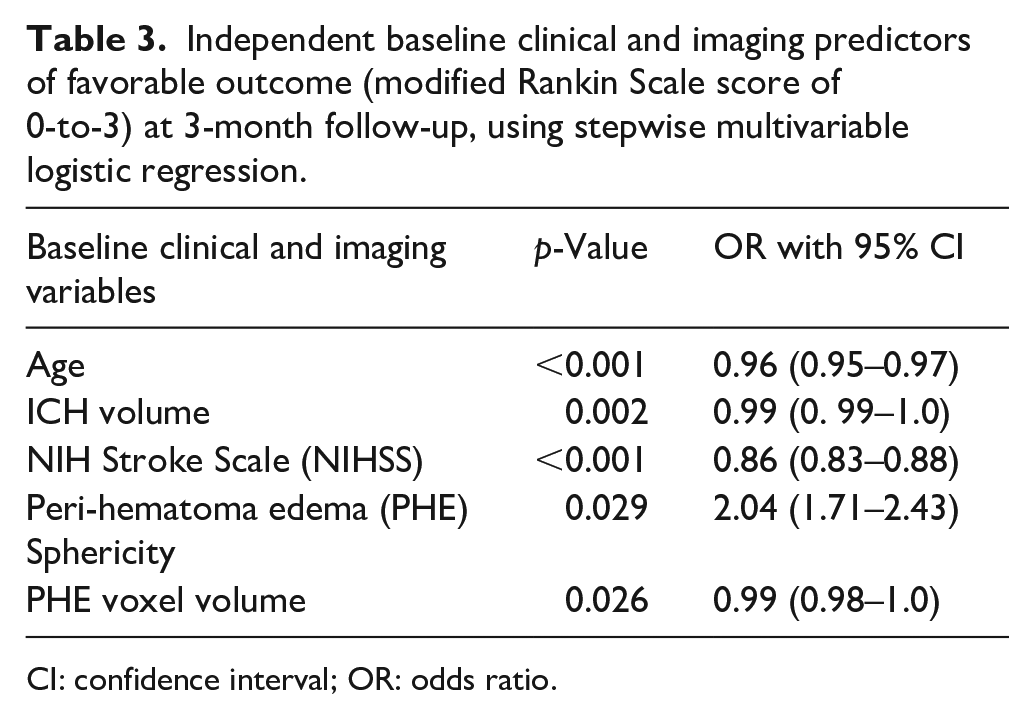
CI: confidence interval; OR: odds ratio.
Discussion
Using a large multicentric cohort of patients with acute supratentorial ICH, we found that many metrics of baseline PHE size, including volume, maximum diameter along the three orthogonal planes, and major axes diameters as well as shape sphericity are associated with 3-month outcome (Table 1). When adjusted for other predictors of outcome, metric of baseline PHE size as well as sphericity were independent predictors of outcome (Table 3 and Supplemental table 4). Our results show that less spherical appearance of PHE is associated with worse outcome (Figure 3), independent of severity of symptoms at baseline, age, hematoma and PHE volumes. In addition, unlike some prior studies, metrics of interval PHE growth or rate of expansion during the first 24-h did not emerge as stronger prognostic factors than baseline variables.15–17 These findings emphasize the potential of PHE shape characteristics, alongside clinical and imaging variables, as indicators of favorable outcomes in ICH patients.
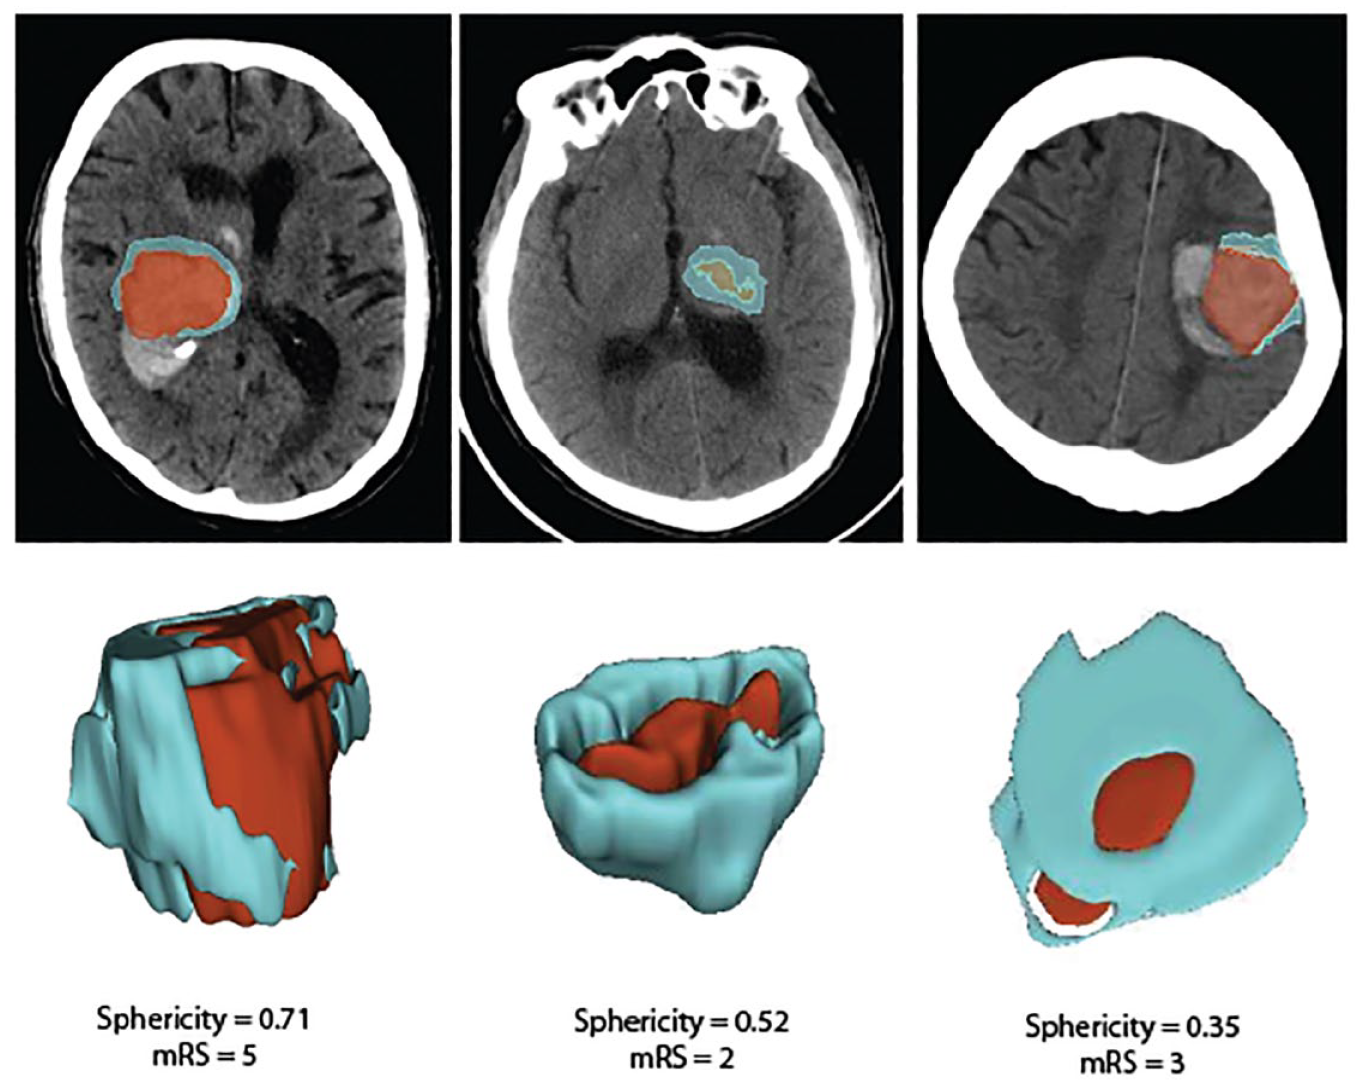
Visualization of peri-hematomal edema (blue) sphericity feature.
The sphericity is a measure of 3-dimentional roundness, where 1 is a perfect sphere and closely related to compactness (Table 1 and Figure 2).
7
Sphericity was calculated as
Some groups have reported that rate of PHE growth is a stronger prognostic factor than baseline PHE volume 19 and that larger PHE is associated with poor functional outcome at 3-months. 15 In our study, the temporal rate and difference of baseline to follow-up CT scans had significant association with outcome but in multivariable analysis correcting for clinical predictors of outcome, they offered no additional prognostic information to baseline PHE volume and sphericity. Although follow-up PHE maximum diameter on axial slices remained as an independent predictor of favorable versus poor outcome in binary logistic regression (Supplemental Table 4), in general, the PHE shape evolution over the first 24 h could barely provide additional prognostic information to baseline variables.
As the search for effective treatment for ICH continues, some investigators are targeting post-ICH secondary brain injury in these patients.20–25 However, clinical trials have thus far only applied baseline hematoma volume cutoffs as inclusion criteria for enrollment. 24 Given the emergence of automated ICH and PHE segmentation tools, 26 shape features beyond lesion volume (such as PHE sphericity) may also be incorporated in future acute ICH trial triage.
The strength of our study is in use of large multicentric dataset with detailed prospective follow-up. However, our study’s scope is somewhat constrained by the absence of 72-h follow-up data, which would have provided a broader temporal context for comparison with prior studies.3,27,28 Furthermore, the predominance of Asian participants, exceeding 50%, may potentially introduce an underrepresentation bias in our analyses. Our study is influenced by the ATACH-2 inclusion criteria, with sample bias limited to supratentorial ICH, presented with elevated admission systolic blood pressure exceeding 180 mmHg and a baseline hematoma volume under 60 mL. In addition, we evaluated the association of shape features with 3-month mRS (as an ordinal variable) in separate ordinal regression models (Table 2) as well as dichotomized mRS outcome in stepwise multivariable logistic regression (Table 3); it should however be noted that outcome binarization has recently been discouraged as it may result in information loss. Lastly, we opted for manual segmentation in our analyses, as opposed to relying on automated segmentation tools, which inherently reduce inter-rater variability and reliance on assessor expertise. It should, however, be noted that currently available automated and semi-automated methods for PHE segmentation will still require human supervision and refinement.11,26
Nevertheless, even after applying HU threshold, manual segmentation has inherent limitations. 29 Efforts to address these limitations would further enhance the robustness and generalizability of our findings.
Conclusion
Our study underscores the utility of baseline PHE shape features in prediction of ICH medium-term outcomes. Of note, interval evolution of PHE shape features over the first 24 h appear to provide no substantial additional prognostic information to baseline features – although longer follow-up evolution of PHE shape metrics were not available for analysis in our dataset. Finally, in addition to baseline PHE volume, shape sphericity emerged as a key prognostic feature, with less spherical PHE shape associated with worse 3-month outcome even after adjusting for baseline clinical predictors, hematoma and PHE volumes. With emergence of automated segmentation tools for processing of admission non-contrast head CT scans, PHE shape features may help with prognostication and potential treatment triage for interventions targeting secondary brain injury.
Supplemental Material
sj-docx-1-eso-10.1177_23969873231223814 – Supplemental material for Peri-hematomal edema shape features related to 3-month outcome in acute supratentorial intracerebral hemorrhage
Supplemental material, sj-docx-1-eso-10.1177_23969873231223814 for Peri-hematomal edema shape features related to 3-month outcome in acute supratentorial intracerebral hemorrhage by Fiona Dierksen, Anh T Tran, Tal Zeevi, Ilko L Maier, Adnan I Qureshi, Pina C Sanelli, David J Werring, Ajay Malhotra, Guido J Falcone, Kevin N Sheth and Seyedmehdi Payabvash in European Stroke Journal
Footnotes
Declaration of conflicting interest
The author(s) declared the following potential conflicts of interest with respect to the research, authorship, and/or publication of this article: KNS reports equity interests in Alva Health.
Funding
The author(s) disclosed receipt of the following financial support for the research, authorship, and/or publication of this article: Dr. Falcone is supported by the National Institutes of Health (K76AG059992, R03NS112859 and P30AG021342), the American Heart Association (18IDDG34280056), the Yale Pepper Scholar Award and the Neurocritical Care Society Research Fellowship.
Dr. Sheth is supported by the National Institutes of Health (U24NS107215, U24NS107136, U01NS106513, R01NR018335), the American Heart Association (17CSA33550004), and grants from Novartis, Biogen, Bard, Hyperfine and Astrocyte.
Dr. Payabvash is supported by the National Institutes of Health (K23NS118056), the Doris Duke Charitable Foundation (2020097).
Ethical approval
Ethical compliance was ensured by the ATACH-2 investigators (ClinicalTrials.gov identifier: NCT01176565). Our group performed post-hoc analyses of anonymized data.
Informed consent
All patients and/or legal guardians provided informed consent.
Guarantor
SP.
Contributorship
FD implemented the analysis, contributed to the study design, interpreted, and visualized the findings and wrote and revised the manuscript. SP designed the study, interpreted the findings, and supervised the writing and revision of the manuscript. AT assisted with coding. IM co-supervised FD. TZ, IM, AQ, PS, AT, DW, AM, GF, and KN assisted in the interpretation of the findings and reviewed the manuscript. All authors contributed to the article and approved the submitted version.
Supplemental material
Supplemental material for this article is available online.
References
Supplementary Material
Please find the following supplemental material available below.
For Open Access articles published under a Creative Commons License, all supplemental material carries the same license as the article it is associated with.
For non-Open Access articles published, all supplemental material carries a non-exclusive license, and permission requests for re-use of supplemental material or any part of supplemental material shall be sent directly to the copyright owner as specified in the copyright notice associated with the article.