
Abstract
Introduction:
Exposure to ambient air pollution is strongly associated with increased cerebrovascular diseases. The 2019–20 bushfire season in Australia burnt 5.4 million hectares of land in New South Wales alone, with smoke so severe it affected cities in Argentina, 11,000 km away. The smoke emitted by bushfires consists of both gaseous and particle components. It is important to note that exposure to particulate matter has been shown to be linked to a heightened risk of stroke, which is the primary kind of cerebrovascular illness, as well as an increased likelihood of hospitalisations and mortality. However, the available data is inadequate in terms of documenting the response of patients diagnosed with a proven cerebrovascular illness to bushfire smoke. Additionally, there is a lack of information about the health effects associated with particulate matter throughout the bushfire season and on days when smoke was present in 2019 and 2020.
Therefore, we aimed to determine the effects of (i) short-term air pollution triggered by bushfires and (ii) high smoke days in increasing the daily number of hospital admissions with cerebrovascular diseases.
Materials and Methods:
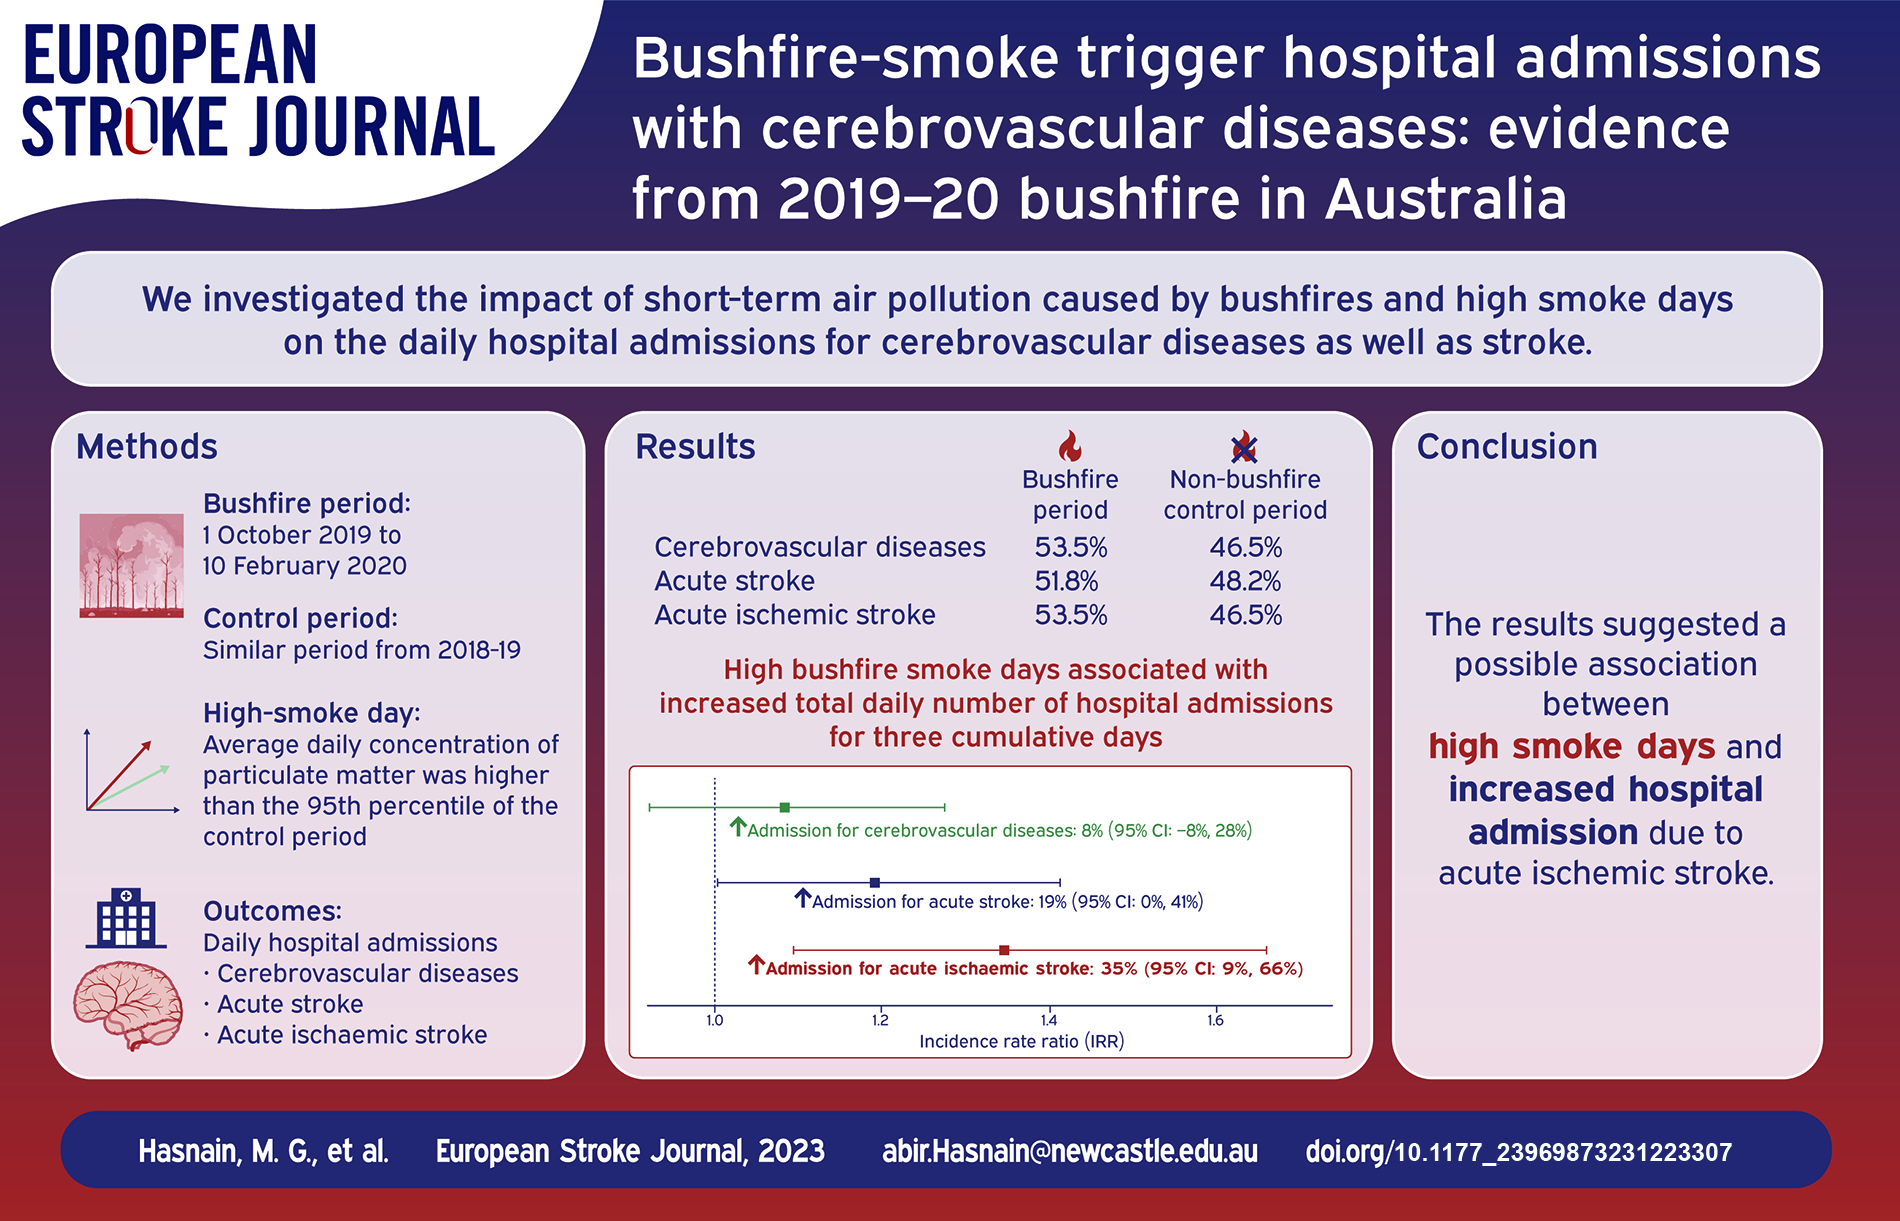
Hospitalisation data were accessed from the admitted patient dataset from seven local Government areas of Hunter New England Local Health District. The bushfire period was defined from 1 October 2019 to 10 February 2020, and a same period from 2018–19 as the control. High bushfire smoke days were days when the average daily concentration of particulate matter was higher than the 95th percentile of the control period. Poisson regression models and fixed effect meta-analysis were used to analyse the data.
Results:
In total, 275 patients with cerebrovascular admissions were identified, with 147 (53.5%) during the bushfire (2019-20) and 128 (46.5%) in the control period (2018–19). There was no significant increase in daily admissions for cerebrovascular disease (Incidence Rate Ratio, IRR: 1.04; 95% CI: 0.81–1.34; p-value: 0.73), acute stroke (IRR: 1.15; 95% CI: 0.88–1.50; p-value: 0.29) or acute ischaemic stroke (IRR: 1.18; 95% CI: 0.87–1.59; p-value: 0.28), over the entire bushfire period. However, the high bushfire smoke days were associated with increased acute ischaemic stroke-related hospital admissions across lead 0–3 and the highest cumulative effect was observed with lead 0 (IRR:1.52; 95% CI: 1.01–2.29; p-value: 0.04). In addition, during the bushfire period, particulate matter, both PM10 and PM2.5 (defined as particulates that have an effective aerodynamic diameter of 10, and 2.5 microns, respectively), were also associated with increased acute ischaemic stroke admissions with a lag of 0–3 days.
Discussion and Conclusion:
The results suggested a possible association between particulate matter and high smoke days with increased hospital admissions due to acute ischaemic stroke during the recent Australian bushfire season.
Introduction
Bushfire is an inevitable and ever-increasing challenge in many parts of the world.1,2 Global warming increases the number of extremely hot and dry days in some regions, leading to more frequent episodes of bushfires. 3 As a result of longer and more destructive fire seasons being caused by rising temperatures, wildfire intensity is increasing as a result of climate change. This year has already seen exceptionally devastating wildfires in the United States, Canada, Russia, Spain, Kazakhstan, Mongolia and Central America. In addition to significantly affecting a huge portion of the United States, the Canadian wildfire smoke also generated substantial long-range transport over the Atlantic and into Europe due to its extreme intensity and record-breaking emissions.4,5 Wildfires that are bigger and worse have the potential to release more smoke and expose people to numerous pollutants over an extended period of time, both of which pose serious health hazards. 6 In recent past, Australia suffered an extensive bushfire season in 2019–20. From October 2019 to February 2020, fires burnt an estimated 18.6 million hectares across Australia, with New South Wales being the most affected state (5.4 million hectares of land).7,8 Evaluating the impact of recent Australian bushfires will assist to establish an accurate assessment of the health impact of recent bushfires throughout North America and Europe, which will ultimately help to counteract the future disastrous effect of bushfires on human health.
Bushfire smoke contains both gaseous and particulate matter. 9 The effect of particulate matter, including total inhalable particulate matter (PM10) and the finer particulate matter fraction (PM2.5), defined as particulates have an effective aerodynamic diameter of 10, and 2.5 microns, respectively, are of great concern because of their presence in high concentrations in smoke and their potential impact on health. 10 Fire days may increase mortality and morbidity, premature death, and exacerbation of cerebrovascular conditions. 11 Moreover, there is significant evidence from other settings of an association between higher particulate matter and ischaemic stroke incidence. Exposure to particulate matter, PM10 and/or PM2.5 is associated with an increased risk of stroke-related hospitalisations and death. 12 A recently published umbrella review included 20 meta-analyses and demonstrated a robust correlation between short-term exposure to PM10 and PM2.5 and an elevated risk of hospital admissions related to stroke. 13 Another study evaluating the 2019-20 bushfire effect on eastern Australia estimated that bushfire smoke accounted for 1124 (95% CI, 211–2047) emergency hospitalisations related to cardiovascular conditions, including strokes and other cerebrovascular diseases. 14 However, there was not enough information about how bushfire smoke changes the dynamics of the population at risk in terms of changing the number of hospital admissions with confirmed stroke or cerebrovascular disease related patients and how they respond to bushfire smoke. There was also not enough information about what the health effects of PM10 and PM2.5 were during the 2019 and 2020 bushfire season and smoke days.
Aims
Therefore, this study aims to
- examine the association between particulate matter concentrations and cerebrovascular disease hospital admissions during the 2019–20 bushfire period with the previous similar period in 2018–19 (Aim 1),
- compare the number of hospitalisations following high bushfire smoke days with those following non-smoke days (Aim 2), and
- study the association between particulate matter concentrations and cerebrovascular disease hospital admissions during the 2019–20 bushfire period (Aim 3).
Methods
Study area and population
The study was conducted in Hunter New England Local Health District (HNE-LHD), New South Wales (NSW), Australia, covering an area of 131,785 km 2 and 920,370 people. It encompasses a metropolitan centre (Newcastle) surrounded by a large, low-density rural area with some small cities or towns. 15 This study focused on seven Local Government Areas (LGAs) within the health district: Newcastle, Muswellbrook, Singleton, Tamworth, Armidale, Narrabri and Gunnedah (Figure 1)16–18. These areas were chosen because they have at least one on-site air pollution monitoring measuring PM10 and PM2.5. These seven LGAs had a population of 318,323 people (Newcastle LGA 160,919, Tamworth LGA 60,998, Armidale 30,311, Singleton 23,595, Muswellbrook 16,468, Narrabri 13,481 and Gunnedah 12,551 people), representing 35% of the population of the HNE-LHD. 19
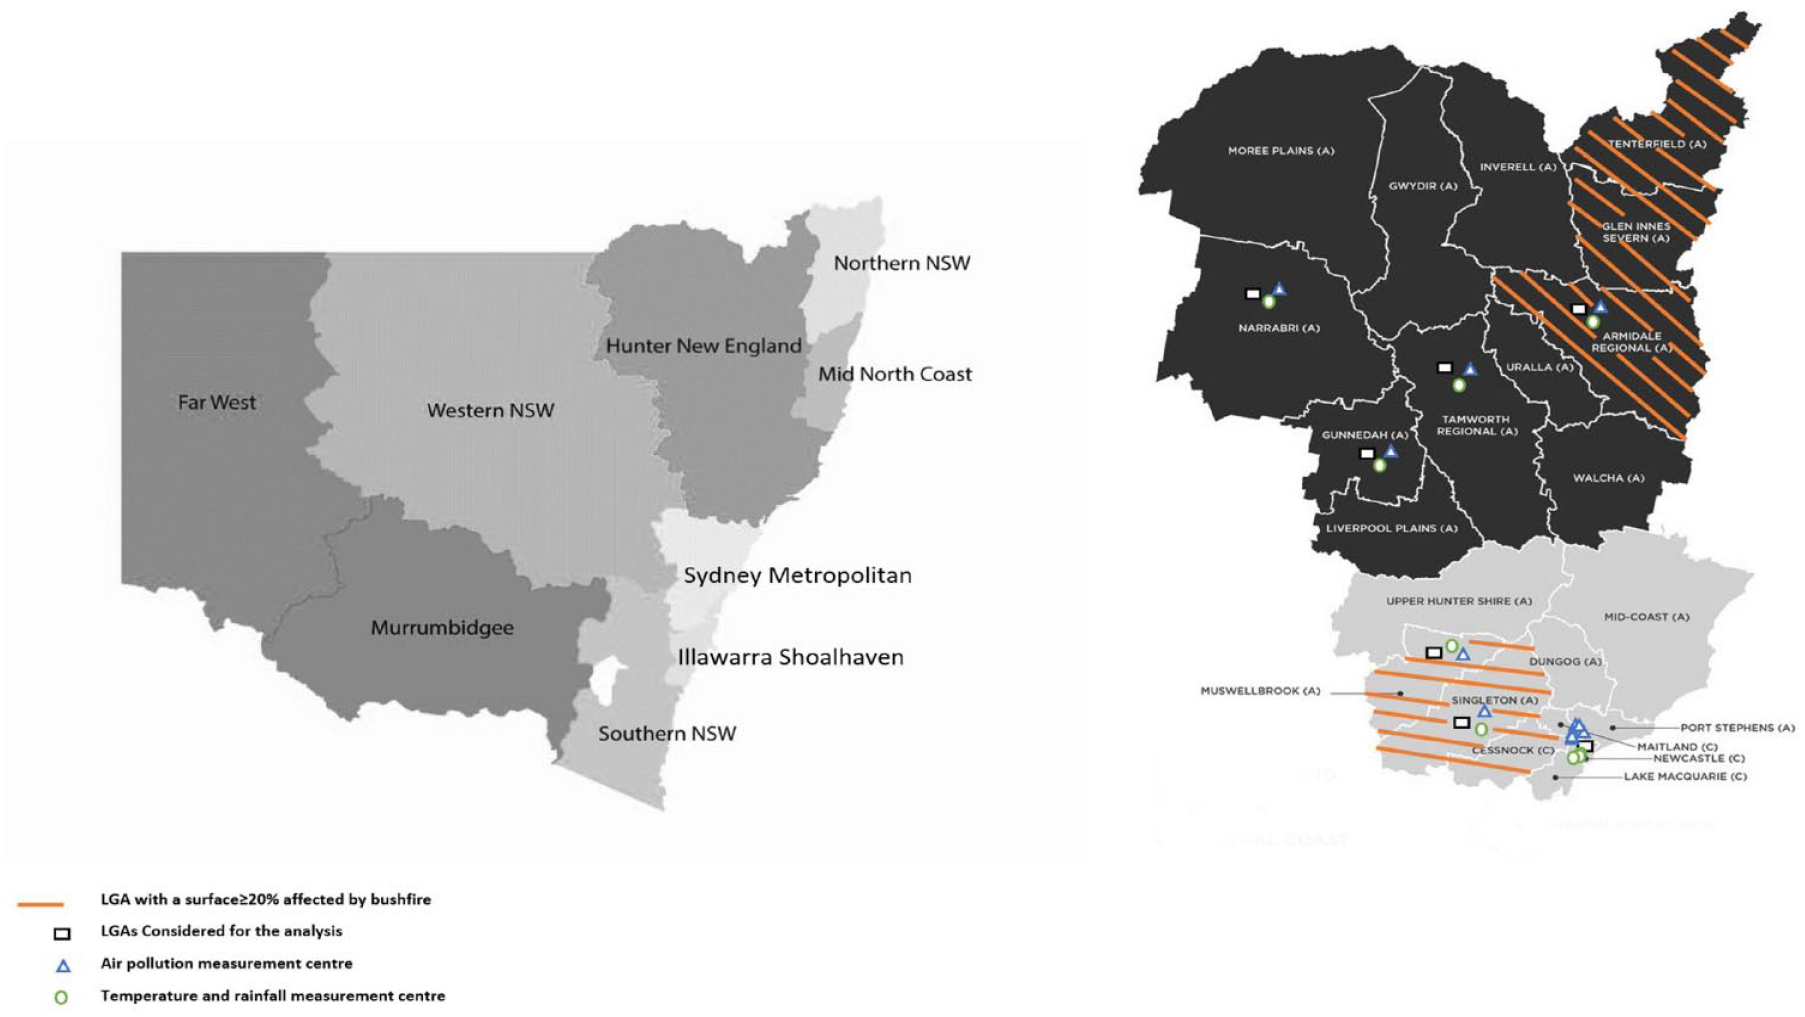
Diagram showing the distribution of bushfire 2019–2020 affected areas and weather measurement centres across HNE-LHD.
Bushfire seasons and smoke days
The 2019–2020 bushfire season started from October 2019 to February 2020. These affected multiple regions in Australia, especially within NSW and in the Hunter region. Most of the fires were extinguished by 10 February 2020. 14 Therefore, we defined the bushfire period as extending from 1 October 2019 to 10 February 2020. The period from 1 October 2018 to 10 February 2019 was designated the control period.
Smoke exposure during the bushfire varies enormously, depending on the proximity of fires and prevailing wind and weather conditions. To determine the effects of bushfire smoke, we defined high bushfire smoke and non-smoke days as follows:
- High bushfire smoke days: Days from the bushfire period when the daily concentration of either PM10 or PM2.5 was greater than the 95th percentile of the control period. Population-weighted control period pollutant data was used to calculate the percentiles.
- Bushfire non-smoke days: The same dates from the control period year to those identified as ‘High bushfire smoke days’ during the bushfire period were considered as non-smoke days.
Hospitalisation and patient data
Hospitalisation with cerebrovascular disease was the primary outcome variable. Hospitalisation data were retrieved from the HNE-LHD local electronic database for admitted patients, which includes information on discharges from all publicly funded hospitals within the LHD. All cases were coded according to the World Health Organization’s (WHO’s) International Classification of Diseases, 10th Revision (ICD-10). 20 The following criteria were used to code patients in this study: ‘admitted for any reason, but at least one episode in the admission has a principal or first secondary diagnosis of cerebrovascular diseases available on final discharge notes. Cerebrovascular diseases were coded as I60-I69, acute stroke coded as I60, I61, I63, I64 and ischaemic stroke as I63. Daily counts of patients with an address within the seven selected LGAs with a primary or secondary diagnosis identified on discharge corresponding to one of the ICD-10 codes of interest were obtained. The date of admission was used as the incidence date for analysis, and this date was considered the day of pollutant exposure which was also used as an index day to calculate lag and lead days.
Air pollution and meteorological data
Daily mean concentrations of air pollutants data (PM10 and PM2.5) were collected from the NSW Government Planning, Industry and Environment website, 21 for 12 measuring stations within the five selected LGAs: Newcastle, Beresfield, Wallsend, Carrington, Mayfield, Stockton, Muswellbrook, Singleton, Tamworth, Armidale, Narrabri, and Gunnedah. Six of the 12 measurement stations were selected from the Newcastle LGA, covering an area of 187 square kilometres (km 2 ) (less than 1% of the total land area of HNE-LHD) and with a population of 160,919 (17% of the total population of HNE-LHD). The remaining six stations were chosen from Muswellbrook, Singleton, Tamworth, Armidale, Narrabri, and Gunnedah Which together, covered an area of 44,805 km 2 (34% of HNE-LHD’s total land area) and have a population of 157,403 (17% of HNE-LHD’s total population).19,22 The daily maximum temperature and daily total rainfall data were collected from the Australian Government Bureau of Meteorology website for nine weather stations within the same LGAs 23 (Figure 1).
Statistical analysis
Initial analysis was performed using descriptive statistics, with frequency and percentages for categorical variables and mean and standard deviation (SD) or median and interquartile range (IQR) for continuous variables. The patient characteristics between bushfire and control were compared using Chi-square tests (frequency)/t-test (mean)/Kruskal-Wallis test (median). Poisson regression models were used where appropriate to measure the effect of bushfire period, smoke days and particulate matters on cerebrovascular hospitalisation. Each regression model was adjusted for daily maximum temperature and daily total rainfall. Separate models were performed for each outcome. Considering the possible delayed and or cumulative effects of air pollution, we created a cross-basis matrix for air pollutants within the distributed lag linear model framework. The selection of lag days was justified by the information criteria: Schwarz’s Bayesian information criterion (SBIC), Akaike’s information criterion (AIC), and the Hannan and Quinn information criterion (HQIC). There is typically a lag between an environmental exposure and manifestation of disease. In this instance we were interested in acute effects but recognising that the biological cascade of events may take days to manifest as cerebrovascular disease. Several well-established criteria were used to evaluate the lag period that provided the best model fit for exposure. In this study, the selection of lag days was justified by the information criteria: Schwarz’s Bayesian information criterion (SBIC), Akaike’s information criterion (AIC), and the Hannan and Quinn information criterion (HQIC). The selection of the best lag days was based on the consideration of the lowest values of AIC, SBIC and HQIC. This approach was chosen since lower values of these criteria indicate a better model fit. Based on the results obtained from the output S1, the chosen lag order was spread among lags 2 and 3, with a greater emphasis on lag order 3. Finally, to minimise the risk for increasing variances and spurious estimates in subsequent analyses, we choose to use a lag of 3 days, which represents a sufficient lag duration. 24
The effect of high bushfire smoke days was calculated for each LGAs separately. The outcome variables were the cumulative number of daily hospital admission at a lead of 0–3 days, which admission day was considered as ‘Day 0’. A fixed effect meta-analysis was conducted to calculate the overall effect of bushfire period and high bushfire smoke days. Meta-analysis was conducted to check the robustness of the non-stratified results, evaluate the variations across the study areas, and improving the precisions of the findings. Robust standard errors were used to control for mild violations under assumptions. Results are presented as an incidence rate ratio (IRR) and 95% confidence intervals (95% CI). A p-value < 0.05 was considered significant. All analyses were performed with Stata Statistical Software, version 15 (Stata Corp, College Station, TX, USA).
Results
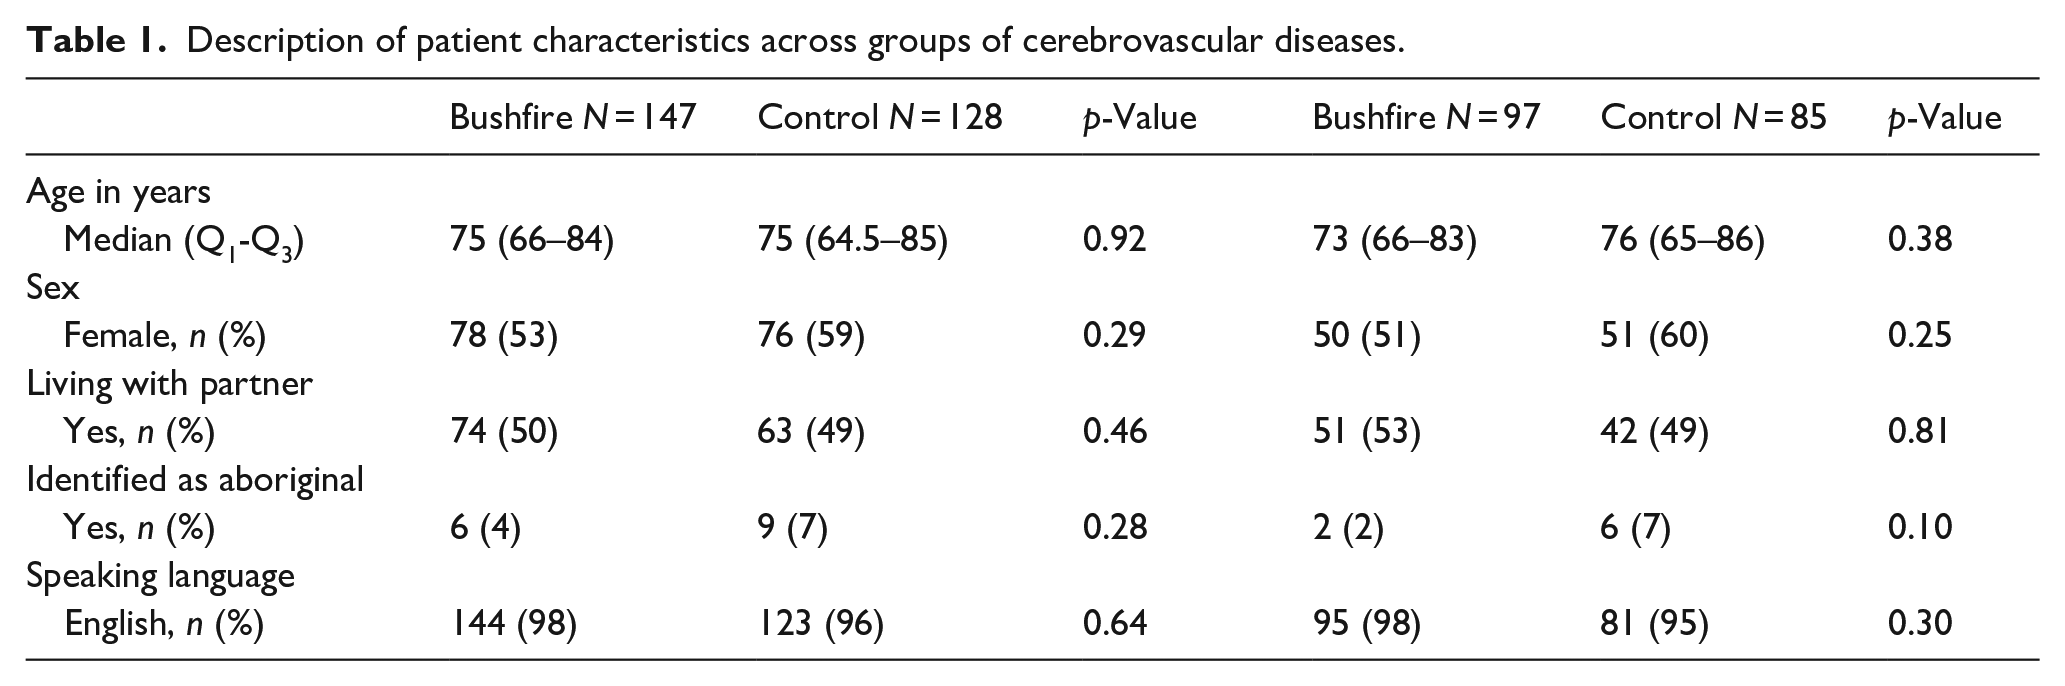
In total, 275 patients with cerebrovascular disease admissions were identified during the bushfire and control period (128, 46.5% in the control period and 147, 53.5% in the bushfire period). Out of 275 patients with cerebrovascular diseases, 255 (97.7%) were defined as acute stroke, 132 (51.8%) were from the bushfire period and 123 (48.2%) were from the control period. Of those 275 patients, 182 (66.2%) were identified as ischaemic strokes, 97 (53.3%) of which occurred during the bushfire period and 85 (46.7%) during the control period. Furthermore, 12 (4%) were diagnosed as subarachnoid haemorrhages, 34 (12%) as intracerebral haemorrhages, 17 (6%) as subdural haemorrhages and 30 (11%) were codified as stroke (unspecified subtype). During the period of interest (133 days for bushfire and 133 days for control period), the crude admissions rate for cerebrovascular disease, acute stroke and acute ischaemic stroke related hospital admissions were 46, 41 and 30 per 100,000 population for the bushfire period and 40, 39 and 27 per 100,000 population for the control period. The converted annual rates were 126, 113 and 82 for the bushfire period and 110, 107 and 74 for the control period. The median age of patients with a cerebrovascular disease admission was 75 [65–84] years, and 154 (56%) were female. There were no major differences in age, sex, or demographic variables, between the bushfire and control period patients (Table 1). In the subgroup of patients with an ischaemic stroke, the median age was 74.5 [66–85] years, and 101 (55.5%) were female. There were no differences between the baseline characteristics of these patients from the bushfire period and those from the control period. In addition, substantial differences in the daily distribution of particulate matter were observed between the bushfire and control periods, S2. Furthermore, statistically significant difference was observed in daily distribution of maximum temperature, whereas no difference with total daily rainfall, S3.
Description of patient characteristics across groups of cerebrovascular diseases.
Effect of bushfire period
There were no significant changes in total daily cerebrovascular diseases (IRR: 1.04; 95% CI: 0.81–1.34; p-value: 0.73), acute stroke (IRR: 1.15; 95% CI: 0.88–1.50; p-value: 0.29) or acute ischaemic stroke admissions (IRR: 1.18; 95% CI: 0.87–1.59; p-value: 0.28) over the entire bushfire period Figure 2. The meta-analysis showed similar non-significant overall and stratified effect, S4.
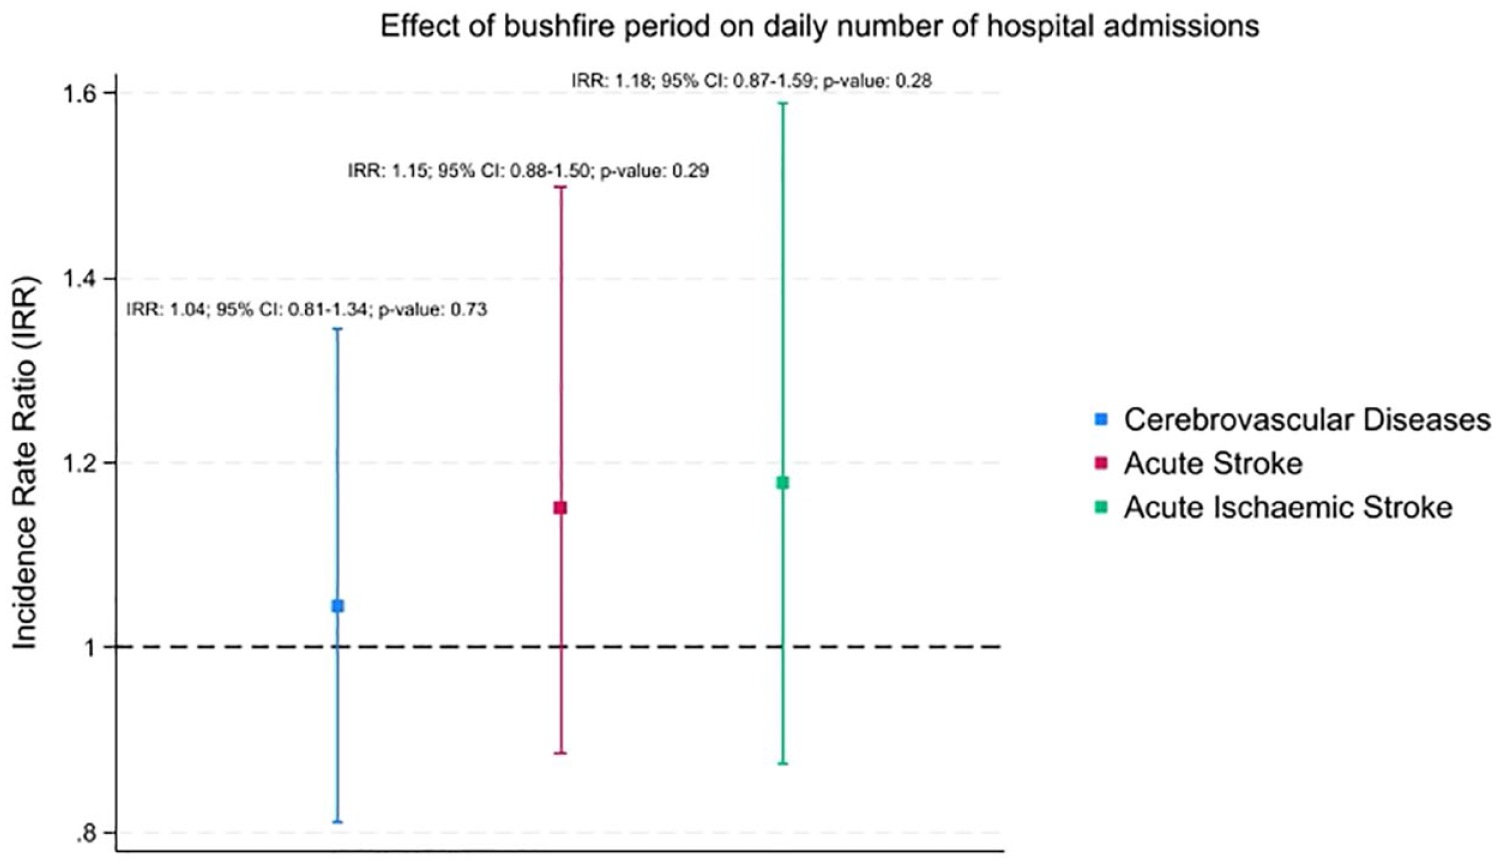
Effect of bushfire period on daily number of hospital admissions compared to control period.
Effect of bushfire high smoke days
The study showed that high bushfire smoke days were associated with increased cumulative daily number of ischaemic stroke-related hospital admissions across a lead of 0–3 days. The highest cumulative effect was observed with lead 0 (IRR: 1.52; 95% CI: 1.01–2.29; p-value = 0.04); Figure 3. A similar but non-significant trend was also observed for cerebrovascular disease and acute stroke-related hospital admissions, Figure 3. In addition, stratified findings and meta-analysis showed a similar positive trend for most of the included LGAs except Singleton and Narrabri, S5. An additional analysis evaluating the effect of non-smoke days during the bushfire period compared to (i) high smoke days from the bushfire period and (ii) similar dates from the control period did not reveal any significant differences, S6.
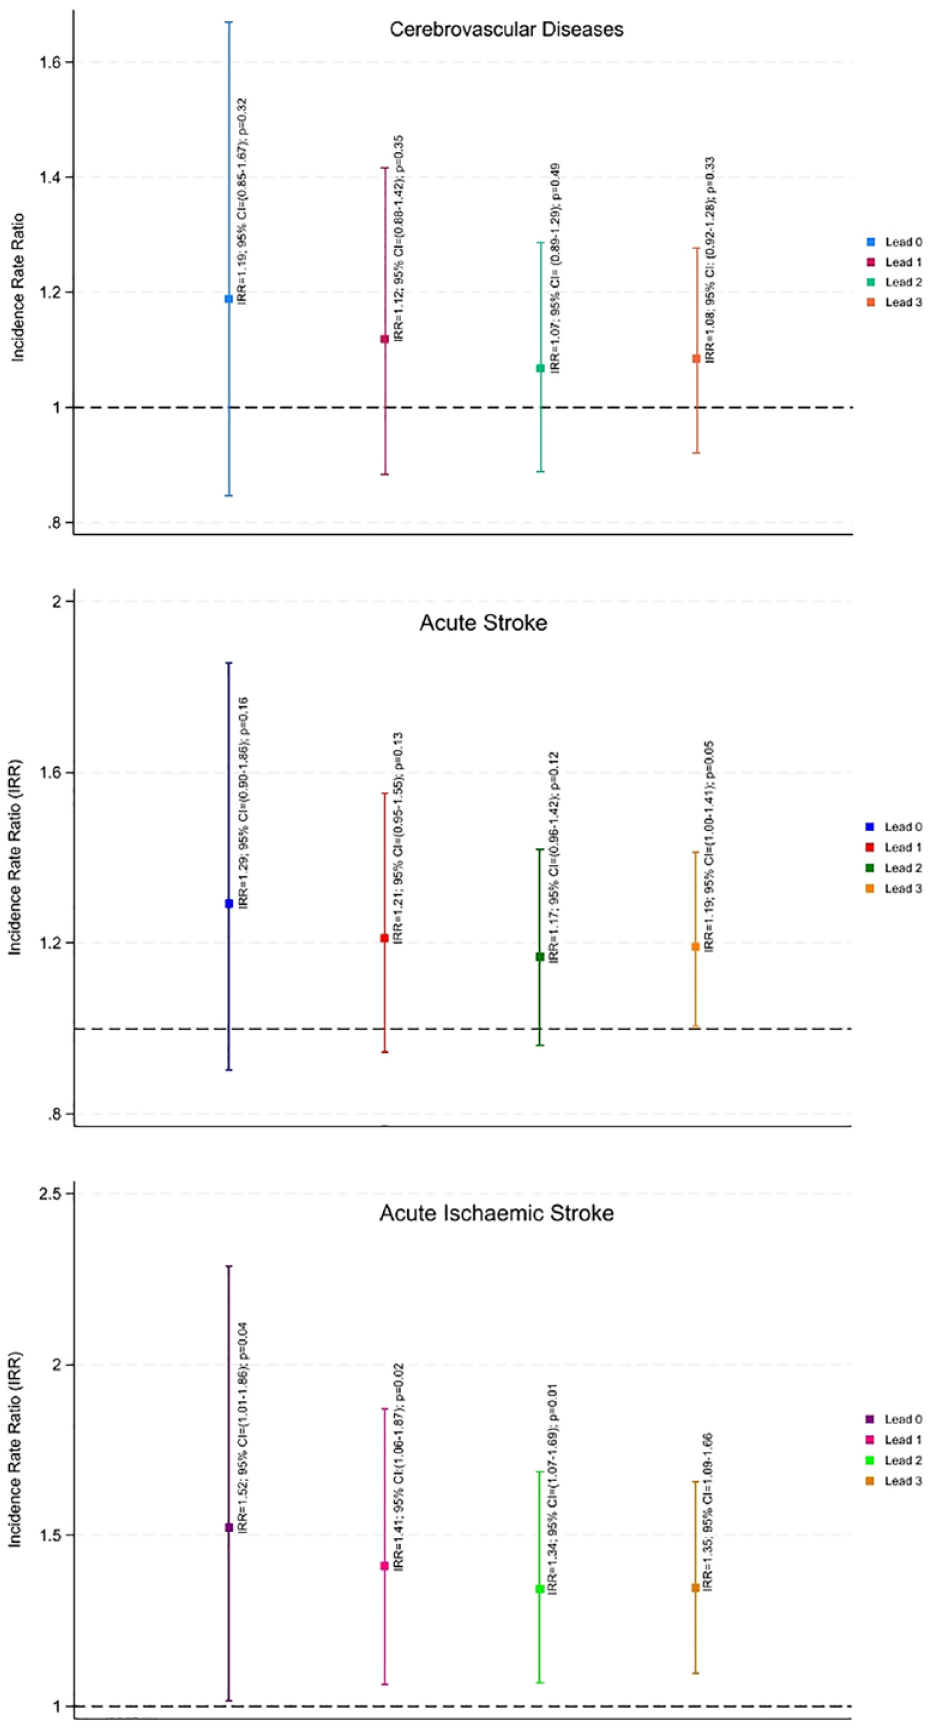
Effect of high bushfire smoke days on daily number of hospital admissions.
Effect of PM10 and PM2.5 during bushfire and control periods
During the bushfire period, PM10 was associated with increased ischaemic stroke admissions across a lag of 0–3 days, Table 2. The effect of PM2.5 was only found significant for the lag 0–2 (IRR: 1.01; 95% CI: 1.00–1.03; p-value: 0.03). The effect of both PM10 and PM2.5 was non-significant increasing the daily number of acute stroke related hospital admissions; Table 2. No significant effect was observed during the control period between PM10 or PM2.5 and the number of total daily admissions of cerebrovascular disease or ischaemic stroke; Table 2.
Effect of PM10 and PM2.5 on daily hospital admissions due to cerebrovascular diseases and ischaemic stroke across lag 0–3 days.
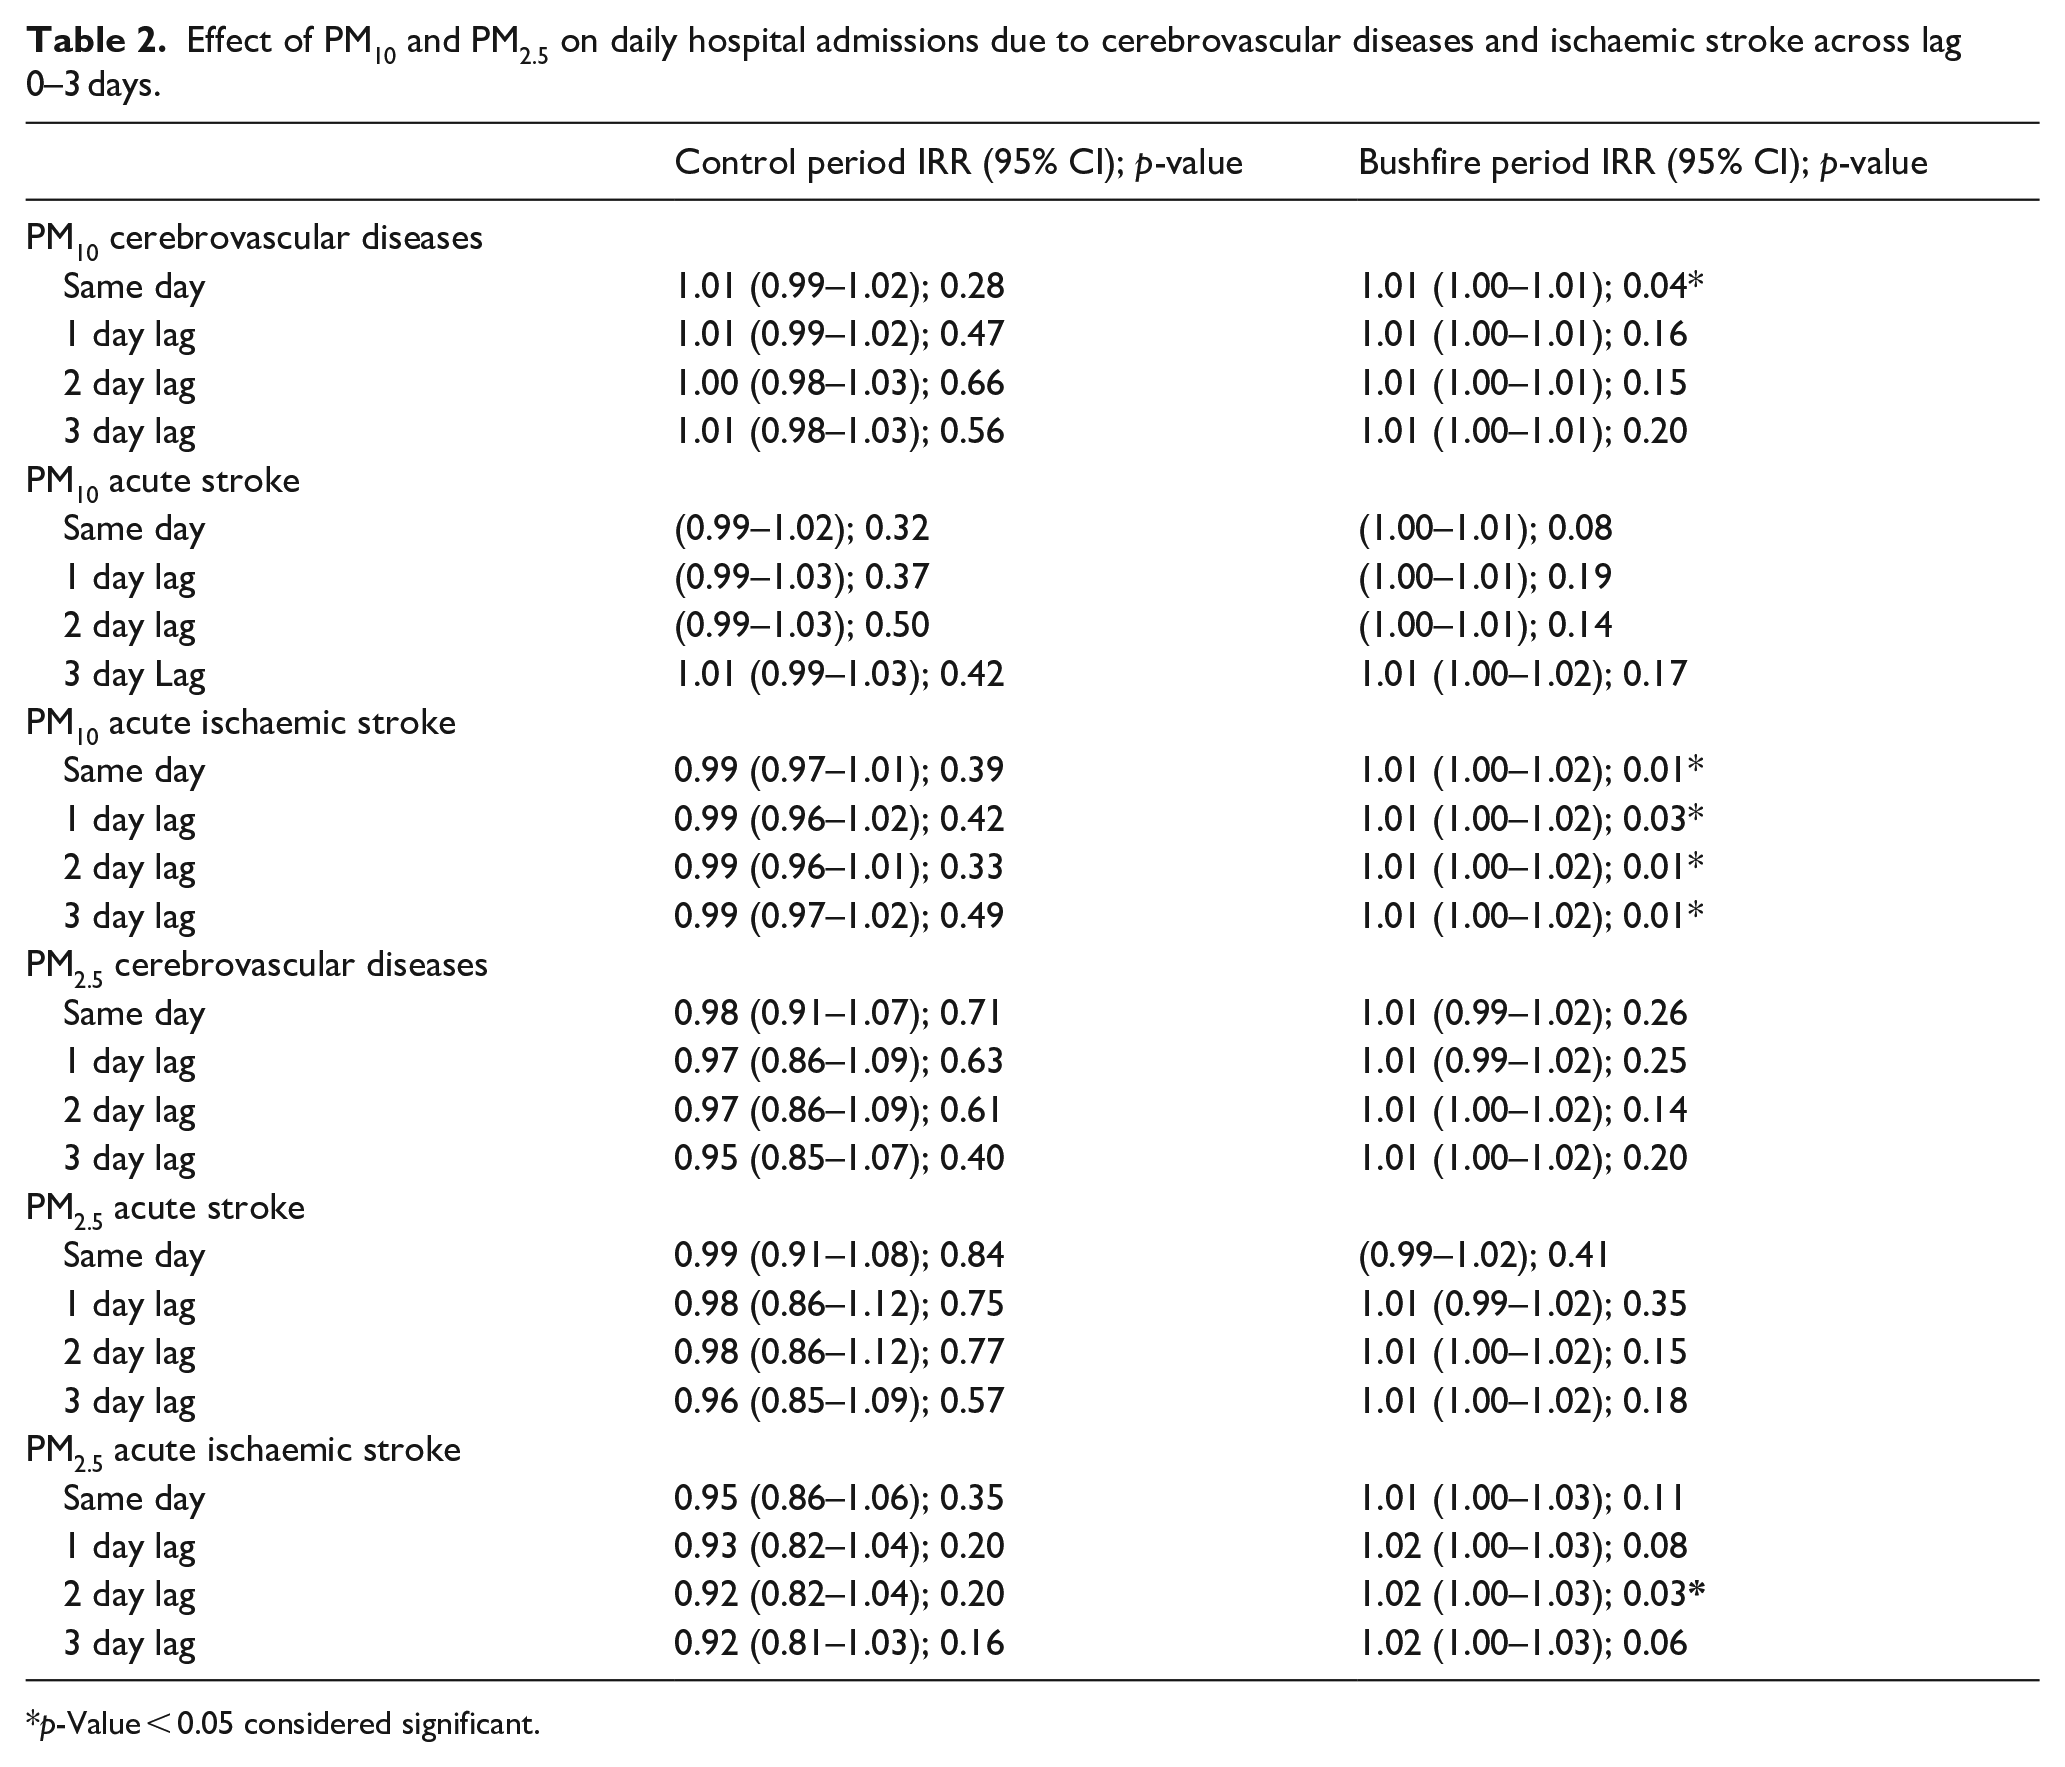
p-Value < 0.05 considered significant.
Discussion
When examining the total 133-day bushfire period we found no significant increase in the daily number of hospital admissions for cerebrovascular diseases, acute stroke, or acute ischaemic stroke, compared to the control period.
In addition, compared to non-smoke days, a substantial rise in hospital admissions was seen during days with high bushfire smoke. The study also showed that particulate matter (PM10 and PM2.5 separately) significantly increased the daily number of hospital admissions during the bushfire period, while no such effect was seen during the control period.
When the bushfire period was compared to the control period, the study found no significant difference. According to the Australian Institute of Health and Welfare (AIHW), these findings are in line with what was found. 7 After analysing data from the 2019 to 2020 bushfire season, the AIHW found that there was a small increase in the number of patients presenting with symptoms of cerebrovascular illness at NSW emergency departments. There was no discernible pattern to the growth, though. This study, however, found that days with high bushfire smoke were linked to more hospitalisations than days with non-smoke days. There has been a dearth of such findings in recent publications related to 2019–20 bushfire.7,14 We think this additional information uncovers a substantial concern with the data that has been gathered. It is extremely challenging to link specific exposures to subsequent hospitalisations. By its very nature, bushfire smoke exposure is highly variable from one location to the next; individual exposure is also highly variable since remaining indoors, for example, greatly reduces exposure. Therefore, the finding of a significant effect on the worst bushfire days, when using only limited numbers of monitoring stations, suggests that this may be quite a substantial effect. This research further emphasises the need for large scale analysis of the effects of recent bushfires on cerebrovascular health globally.
The study also identified a significant effect of particulate matter, predominantly PM10, in increasing the number of hospitalisations during the bushfire period. We did not observe an effect of particulates during the non-bushfire period; however, this lack of significant effect should be interpreted with some caution. Baseline particulate pollutant levels are low in our region, and the fluctuation in levels was less during the non-bushfire period, limiting our capacity to identify any effects, given the relatively small sample size. Particulate matters are known to significantly increase the number of strokes and cerebrovascular disease-related hospital admissions. 25 Exposure to particulate matter increases inflammation, antioxidant activity and circulating blood platelet activation and decreases vascular endothelial functions and enzyme activity, which may increase peripheral thrombosis and blood clotting.12,26,27 However, given the hypothesised impact of particulate matter on the risk of stroke, which may be attributed to the activation of inflammatory responses and blood clot formation, it is reasonable to anticipate a cumulative effect whereby the frequency of stroke admissions would rise in places experiencing prolonged bushfires. The phenomenon in question was not detected over the course of the investigation. Instead, the findings mostly indicated a limited and temporary impact, perhaps attributable to factors such as variations in exposure and geography, potential confounding variables at the individual level, and methodological constraints stemming from a small sample size. Over the course of 10 years or more, two investigations from Australia looked at whether or not exposure to particulate matter during bushfire smoke days increased hospital admissions for cerebrovascular disorders or stroke.28,29 Hospitalisations due to cerebrovascular or stroke-related conditions were not linked to the higher concentration of particulate matter, according to the investigations. Previous research had mixed results because of methodological differences and outcome measurement; for example, they counted transient ischaemic attack patients as having a stroke and characterised bushfire smoke days using the 99th percentile of the entire study period. Patients with a discharge diagnosis of cerebrovascular diseases were included in our study, and smoking days were defined using data from the control group alone. Furthermore, the most recent devastating bushfire in 2019–2020 occurred almost a decade after the prior research were completed. Consequently, a shift in demographic and environmental factors may also account for this discrepancy. Finally, although this study demonstrated increased particulate matter concentrations during the bushfire period, some days from the control period (3 days) also showed high concentrations of PM10. Those days might be associated with some locally sparked bushfires within the Hunter region (Kurri Kurri and Port Stephens) controlled quickly, within days, by firefighters. 30
This study’s primary strength is its evaluation of the time lag between exposure and effect during a bushfire and its estimation of the number of admissions based on confirmed diagnoses. More crucially, the study took place in an area with a somewhat consistent population and habitat, making it possible to determine an effect size more accurately.
Nevertheless, the study has several limitations. Assessing the consequence of fire smoke exposure on health is always a big challenge. The sporadic characteristics of significant fire events make it challenging to distinguish when and where air quality will be poor accurately. Many affected areas do not have routine air quality monitoring stations. In addition, the peak exposures may be too short-lived to detect all but the most sensitive health outcomes with adequate statistical power. Because of these local effects and the effect of variable time spent outdoors, some degree of exposure misclassification is inevitable, which would likely have biased our results towards the null. Another potential limitation, as with most studies of this type, is fixed-site monitors. It is possible that available monitors did not detect smaller smoke plumes on some occasions and did not take into account geomorphic and atmospheric characteristics that tend to dilute, or concentrate, particulate matter in certain areas, and these would not have been classified as severe smoke events. In this study, the translated annual rate is a little higher than our most recently published rates. 31 This likely reflects our oversampling for rural postcodes in this study as we have previously shown 30% higher stroke attack rates in rural versus urban postcodes in our region. 32 A further potential limitation is that in this study we were unable to measure or control for any changes in behaviour that may have been associated with high bushfire smoke days, such as spending more time indoors, or less time outside exercising.
However, it is important to note that this research did not specifically investigate or adjust for these possible causes. Additionally, this research only included patients who were admitted to hospital. We are unable to draw any conclusions about those with minor stroke, discharged from the emergency department. However, we would note that there were no changes in hospital pathways over this period, and in discussions with hospital staff, we have had no indication of any change in patient behaviour and disposition over this period. In addition, in this study we did not collect any individual patient level data. Therefore, we were unable to describe clinical outcomes and adjust statistical models for specific confounding variables related to stroke aetiology and risk factors.
Moreover, since this was an observational study, we lacked sufficient data to explain causality. Finally, future large-scale research will need to take into account the fact that the models utilised to create findings were single pollutant models that weren’t adjusted for other contaminants and lacked the requisite linkage data to differentiate between an initial and subsequent recurring episodes. Future research should also consider evaluating therapies designed to lower risk, especially for those with a higher risk of stroke. For example, reducing the impact of particulate matters by limiting outdoor activities, utilising an air purifier with a high-efficiency particle air filter, and wearing masks (P2 or N95 masks with caution).
We did not observe an effect of particulates during the non-bushfire period, however this lack of significant effect should be interpreted with some caution. Baseline particulate pollutant levels are low in our region, and the fluctuation in levels was less during the non-bushfire period, limiting our capacity to identify any effects, given the relatively small sample size. Our findings suggest that during the season of significant bushfires, taking appropriate precautions might be helpful to reduce the risk of being exposed to smoke and the severity of the disease load.
Supplemental Material
sj-docx-1-eso-10.1177_23969873231223307 – Supplemental material for Bushfire-smoke trigger hospital admissions with cerebrovascular diseases: Evidence from 2019–20 bushfire in Australia
Supplemental material, sj-docx-1-eso-10.1177_23969873231223307 for Bushfire-smoke trigger hospital admissions with cerebrovascular diseases: Evidence from 2019–20 bushfire in Australia by Md Golam Hasnain, Carlos Garcia-Esperon, Yumi Kashida Tomari, Rhonda Walker, Tarunpreet Saluja, Md Mijanur Rahman, Andrew Boyle, Christopher R Levi, Ravi Naidu, Gabriel Filippelli and Neil J Spratt in European Stroke Journal
Footnotes
Acknowledgements
None.
Declaration of conflicting interests
The author(s) declared no potential conflicts of interest with respect to the research, authorship, and/or publication of this article.
Funding
The author(s) received no financial support for the research, authorship, and/or publication of this article.
Ethics approval
Ethics approval was taken from the Hunter New England Health Human Research Ethics Committee (2020/ETH01801).
Informed consent
In this study, individual patient consent was not obtained since the research did not include direct interaction with patients. The researcher gathered data pertaining to the frequency of hospital admissions from the Cardiac and Stroke Outcomes Unit (CSOU) of HNE-LHD. The Hunter New England Health Human Research Ethics Committee has also granted approval for the waiver of consent.
Guarantor
MGH.
Contributorship
MGH, CGE, YT, CRL, RN, GF, NJS conceived the study, were involved in protocol development and gaining ethical approval. MGH, CGE, YT, RW, TS, MMR, AB were involved in study design and data collection. MGH, MMR were involved in data analysis. MGH, CGE, CRL, RN, GP, NJS were involved in data analysis findings interpretation. MGH wrote the first draft of the manuscript. All authors reviewed and edited the manuscript and approved the final version of the manuscript.
Data access statement
De-identified data will be available on request from corresponding author.
Supplemental material
Supplemental material for this article is available online.
References
Supplementary Material
Please find the following supplemental material available below.
For Open Access articles published under a Creative Commons License, all supplemental material carries the same license as the article it is associated with.
For non-Open Access articles published, all supplemental material carries a non-exclusive license, and permission requests for re-use of supplemental material or any part of supplemental material shall be sent directly to the copyright owner as specified in the copyright notice associated with the article.