
Abstract
Introduction
Cerebrovascular diseases are the most frequent risk factor for epilepsy in the elderly, and epileptic phenomenon following stroke is known to worsen the prognosis. Although electroencephalography is the gold standard epilepsy biomarker, it is rarely used in post-stroke studies, and the frequency of post-stroke epileptiform activity is still uncertain.
Patients and methods
We analysed studies indexed to MEDLINE, Embase, Web of Science, PsycINFO and OpenGrey (up to March 2015), reporting post-stroke electroencephalographic epileptiform activity frequency in adults. Epileptiform activity was classified as ictal (electrographic seizures) and interictal (non-periodic spikes and sharp waves). Data selection, extraction and appraisal were done in duplicate. Random-effects meta-analysis was used to pool frequencies.
Results
The pooled frequency of post-stroke ictal and interictal epileptiform activity was 7% (95% CI 3%–12%) and 8% (95% CI 4%–13%), respectively. The use of continuous electroencephalogram was not associated with an increased frequency of electrographic seizures (p = 0.05), nor did the management setting (Intensive Care Unit versus non- Intensive Care Unit, p = 0.31). However, studies with continuous electroencephalogram showed a higher frequency of interictal epileptiform activity (p = 0.01).
Discussion
This study provides the best available estimates of the frequency of post-stroke electroencephalographic epileptiform activity. Due to detection bias, it was not possible to correlate clinical and electrographic seizures.
Conclusion
The frequency of ictal and interictal epileptiform activity in the electroencephalogram was comparable with previous frequency analyses of clinical seizures. The frequency of ictal epileptiform activity did not change with continuous record or clinical setting, while the frequency of interictal epileptiform activity increased with continuous record.
Introduction
Cerebrovascular diseases are the most frequent risk factor for epilepsy, 1 accounting for more than half of all cases in elderly patients. 2 On the other hand, epileptic seizures following stroke3,4 and electrographic seizures and interictal epileptiform discharges in critically ill patients are known to worsen the outcome.5–7
The current International League Against Epilepsy (ILAE) definition of epilepsy 8 allows for the diagnosis of epilepsy after a single unprovoked seizure, provided that there is at least a 60% probability of recurrence, as it is the case of the first unprovoked seizure after the acute stroke phase. 3 This sensitivity-maximising definition, and the fact that acute symptomatic seizures are described as risk factors for unprovoked seizures, 9 prompts discussion for the role of electroencephalogram (EEG) after stroke – as this technique can contribute to early and accurate detection of ictal and interictal epileptiform activity.
The frequency of seizures and interictal epileptiform activity after stroke is uncertain. 10 This is the case because EEG is seldom used in studies investigating the frequency of post-stroke seizures, although being the gold standard for the identification of these phenomena, 11 and as little as 10% of all seizures are recognised without EEG in critically ill patients. 12
As so, we set out to estimate the frequency of post-stroke electroencephalographic epileptiform activity using meta-analytical techniques.
Patients and methods
Protocol and registration
The protocol followed the PRISMA-P guidelines and was registered at Prospero (CRD42015029362). We followed the MOOSE and PRISMA guidelines 13 . Statistical data reporting followed the SAMPL guidelines.
Eligibility criteria
We included published and unpublished (i.e. conference proceedings) observational studies reporting original data on the frequency of electroencephalographic epileptiform activity after stroke in adults (≥18 year-old). All observational study designs were accepted with the exception of case series with less than 10 participants to decrease the risk of selection bias. This threshold was established arbitrarily and excludes single case-reports and small case series. Studies reporting on patients diagnosed with silent cerebral infarcts and haemorrhages were excluded due to the low specificity to determine a time sequence between the cause and the effect. No study was dismissed a priori due to poor quality, language or length of follow-up. Epileptiform activity in the EEG was classified as ictal activity (electrographic seizures 14 ) and interictal activity (non-periodic spikes and sharp waves). 15 Stroke was defined as an episode of acute neurological dysfunction presumed to be caused by ischemia or haemorrhage, persisting ≥24 h or until death. 16 For data extraction and analysis we followed the above-mentioned definitions.
Information sources
The electronic search was conducted in MEDLINE, Embase, Web of Science and PsycINFO. Grey literature was searched via OpenGrey. No language, date/time, document type or publication type restriction was applied. The last search was done on 22 March 2015. Search results were de-duplicated in EndNote X7. Non-English reports were translated. Whenever needed, authors were contacted for further data. The reference lists of included studies were crosschecked for additional studies.
Search
The search strategies developed combine the terms (Cerebrovascular disorder OR Stroke OR Brain Ischemia OR Brain Infarction OR Intracranial Embolism and Thrombosis OR Intracranial Haemorrhage OR Cerebral Haemorrhage OR Subarachnoid Haemorrhage (SAH) OR Cerebral Infarction OR Cerebellar Infarction OR Cerebellar Haemorrhage OR Brain Stem Infarction OR Brain Stem Haemorrhage) with (Partial Epilepsy OR Generalized Epilepsy OR Post-Traumatic Epilepsy OR Reflex Epilepsy OR Seizure OR Status Epilepticus). A filter was adapted to avoid retrieval of non-observational studies. The search strategy was restricted to humans as participants. All terms were searched as free-text and controlled vocabulary. The search strategies can be found in the Supplemental methods.
Study selection
Reports retrieved through electronic identification were screened by title and abstract. The full-text of potentially eligible studies was screened for appropriateness for inclusion. Three independent screeners (CB, DS and RP) conducted this process. Disagreements were solved by consensus, or by a fourth party (FBR).
Data collection process
A pilot extraction form was tested with five studies by two independent reviewers (CB and FBR). Two independent parties (AF, DS, GSD, HN, RM or RP) extracted data from included studies to a predetermined and piloted electronic form using the online-based software Covidence (https://www.covidence.org/). Disagreements were solved by an independent party (CB or FBR).
Risk of bias in individual studies
The risk of bias of individual studies was evaluated in accordance with the Newcastle–Ottawa Quality Assessment Scale. 17 Quality of reporting was independently analysed by two authors (AF, DS, GSD, HN, RM or RP). Disagreements were solved by a third party (CB or FBR). Studies having a star rating of more than 60% were considered of low risk of bias, as assumed by others.
Summary measures
The primary outcomes were the frequency of ictal and interictal epileptiform activity (as defined above) in stroke patients’ EEGs. To calculate frequencies we adopted a conservative approach by determining the number of events divided by the number of participants in the study. This method underestimates events, since not all participants performed EEG.
Synthesis of results
We used Stata/SE 14.0 software to conduct the analysis and to derive forest plots. Random-effects meta-analysis weighted by the inverse-variance method was performed to estimate the pooled frequencies and respective 95% confidence intervals (95% CI). We used a random-effects model as substantial heterogeneity between studies results was expected. Heterogeneity was assessed with the I2 test. The limit for statistical significance was established at 0.05.
Additional analysis
Pre-specified sensitivity analyses were conducted by excluding: studies at high and unclear risk of bias; studies without continuous EEG (cEEG); and studies in settings other than the intensive care unit (ICU). We planned to estimate the frequency of events in different subgroups of patients according to study site, year, stroke type and location. Unfortunately, we could not retrieve enough data for the latter analysis. Two post-hoc analyses were performed: the first excluding studies only reporting on SAH, to study the effect of this aetiology on the overall frequency of events; and the second solely including studies where EEG was performed in a consecutive cohort of stroke patients, to study the effect of selection bias.
Results
Study selection
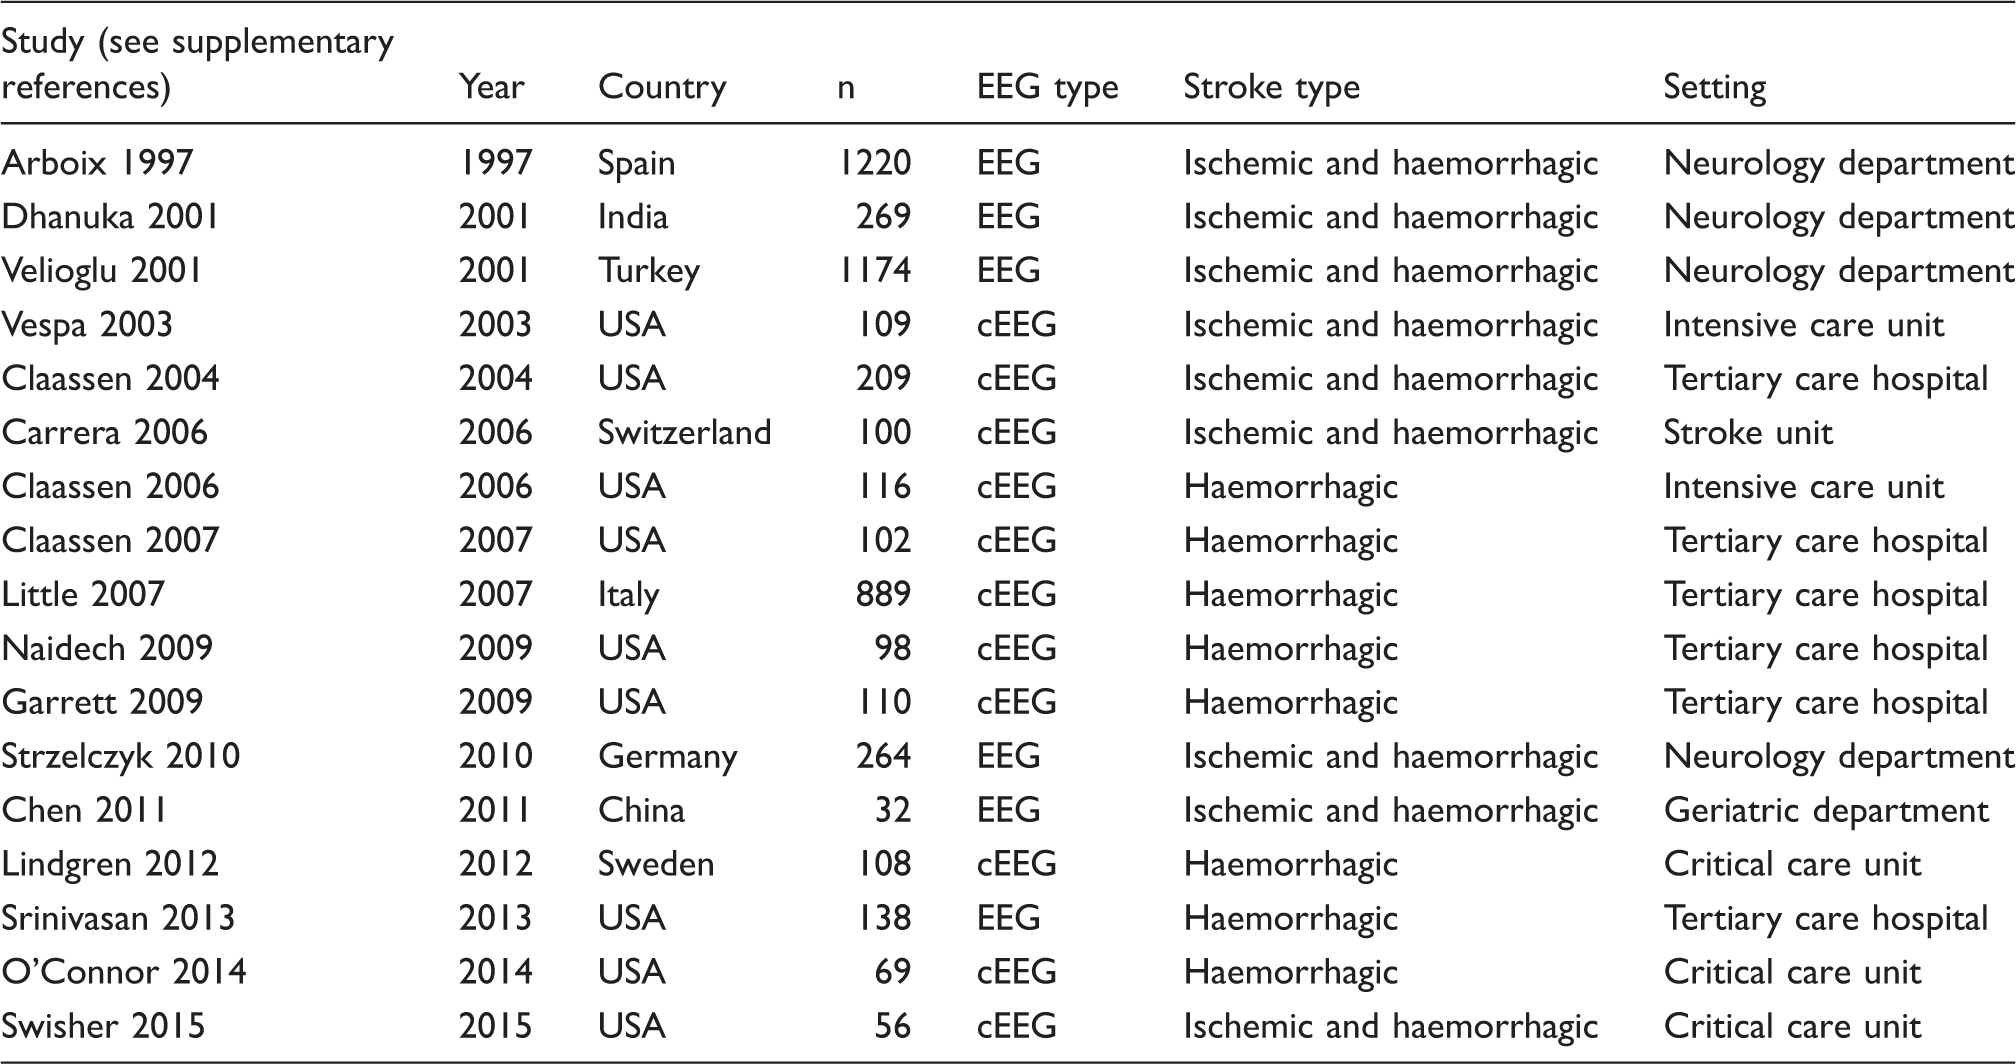
The last electronic search was run from inception to 22 March, 2015. A total of 2871 references were retrieved (MEDLINE 1985, Embase 425, PsycINFO 66, Web of Science 394, Open Grey 1). Two studies were included via hand-search. After de-duplication, 2527 titles and abstracts were screened, and 2226 were excluded, as they were not relevant to our research question. We selected 301 studies for full text assessment, and 284 studies were removed due to failure to comply with inclusion criteria. A total of 17 studies where included (Figure 1, Table 1 and supplemental references).
PRISMA flow chart. Characteristics of included studies. EEG: spot EEG; cEEG: continuous EEG; n: number of patient enrolled per study.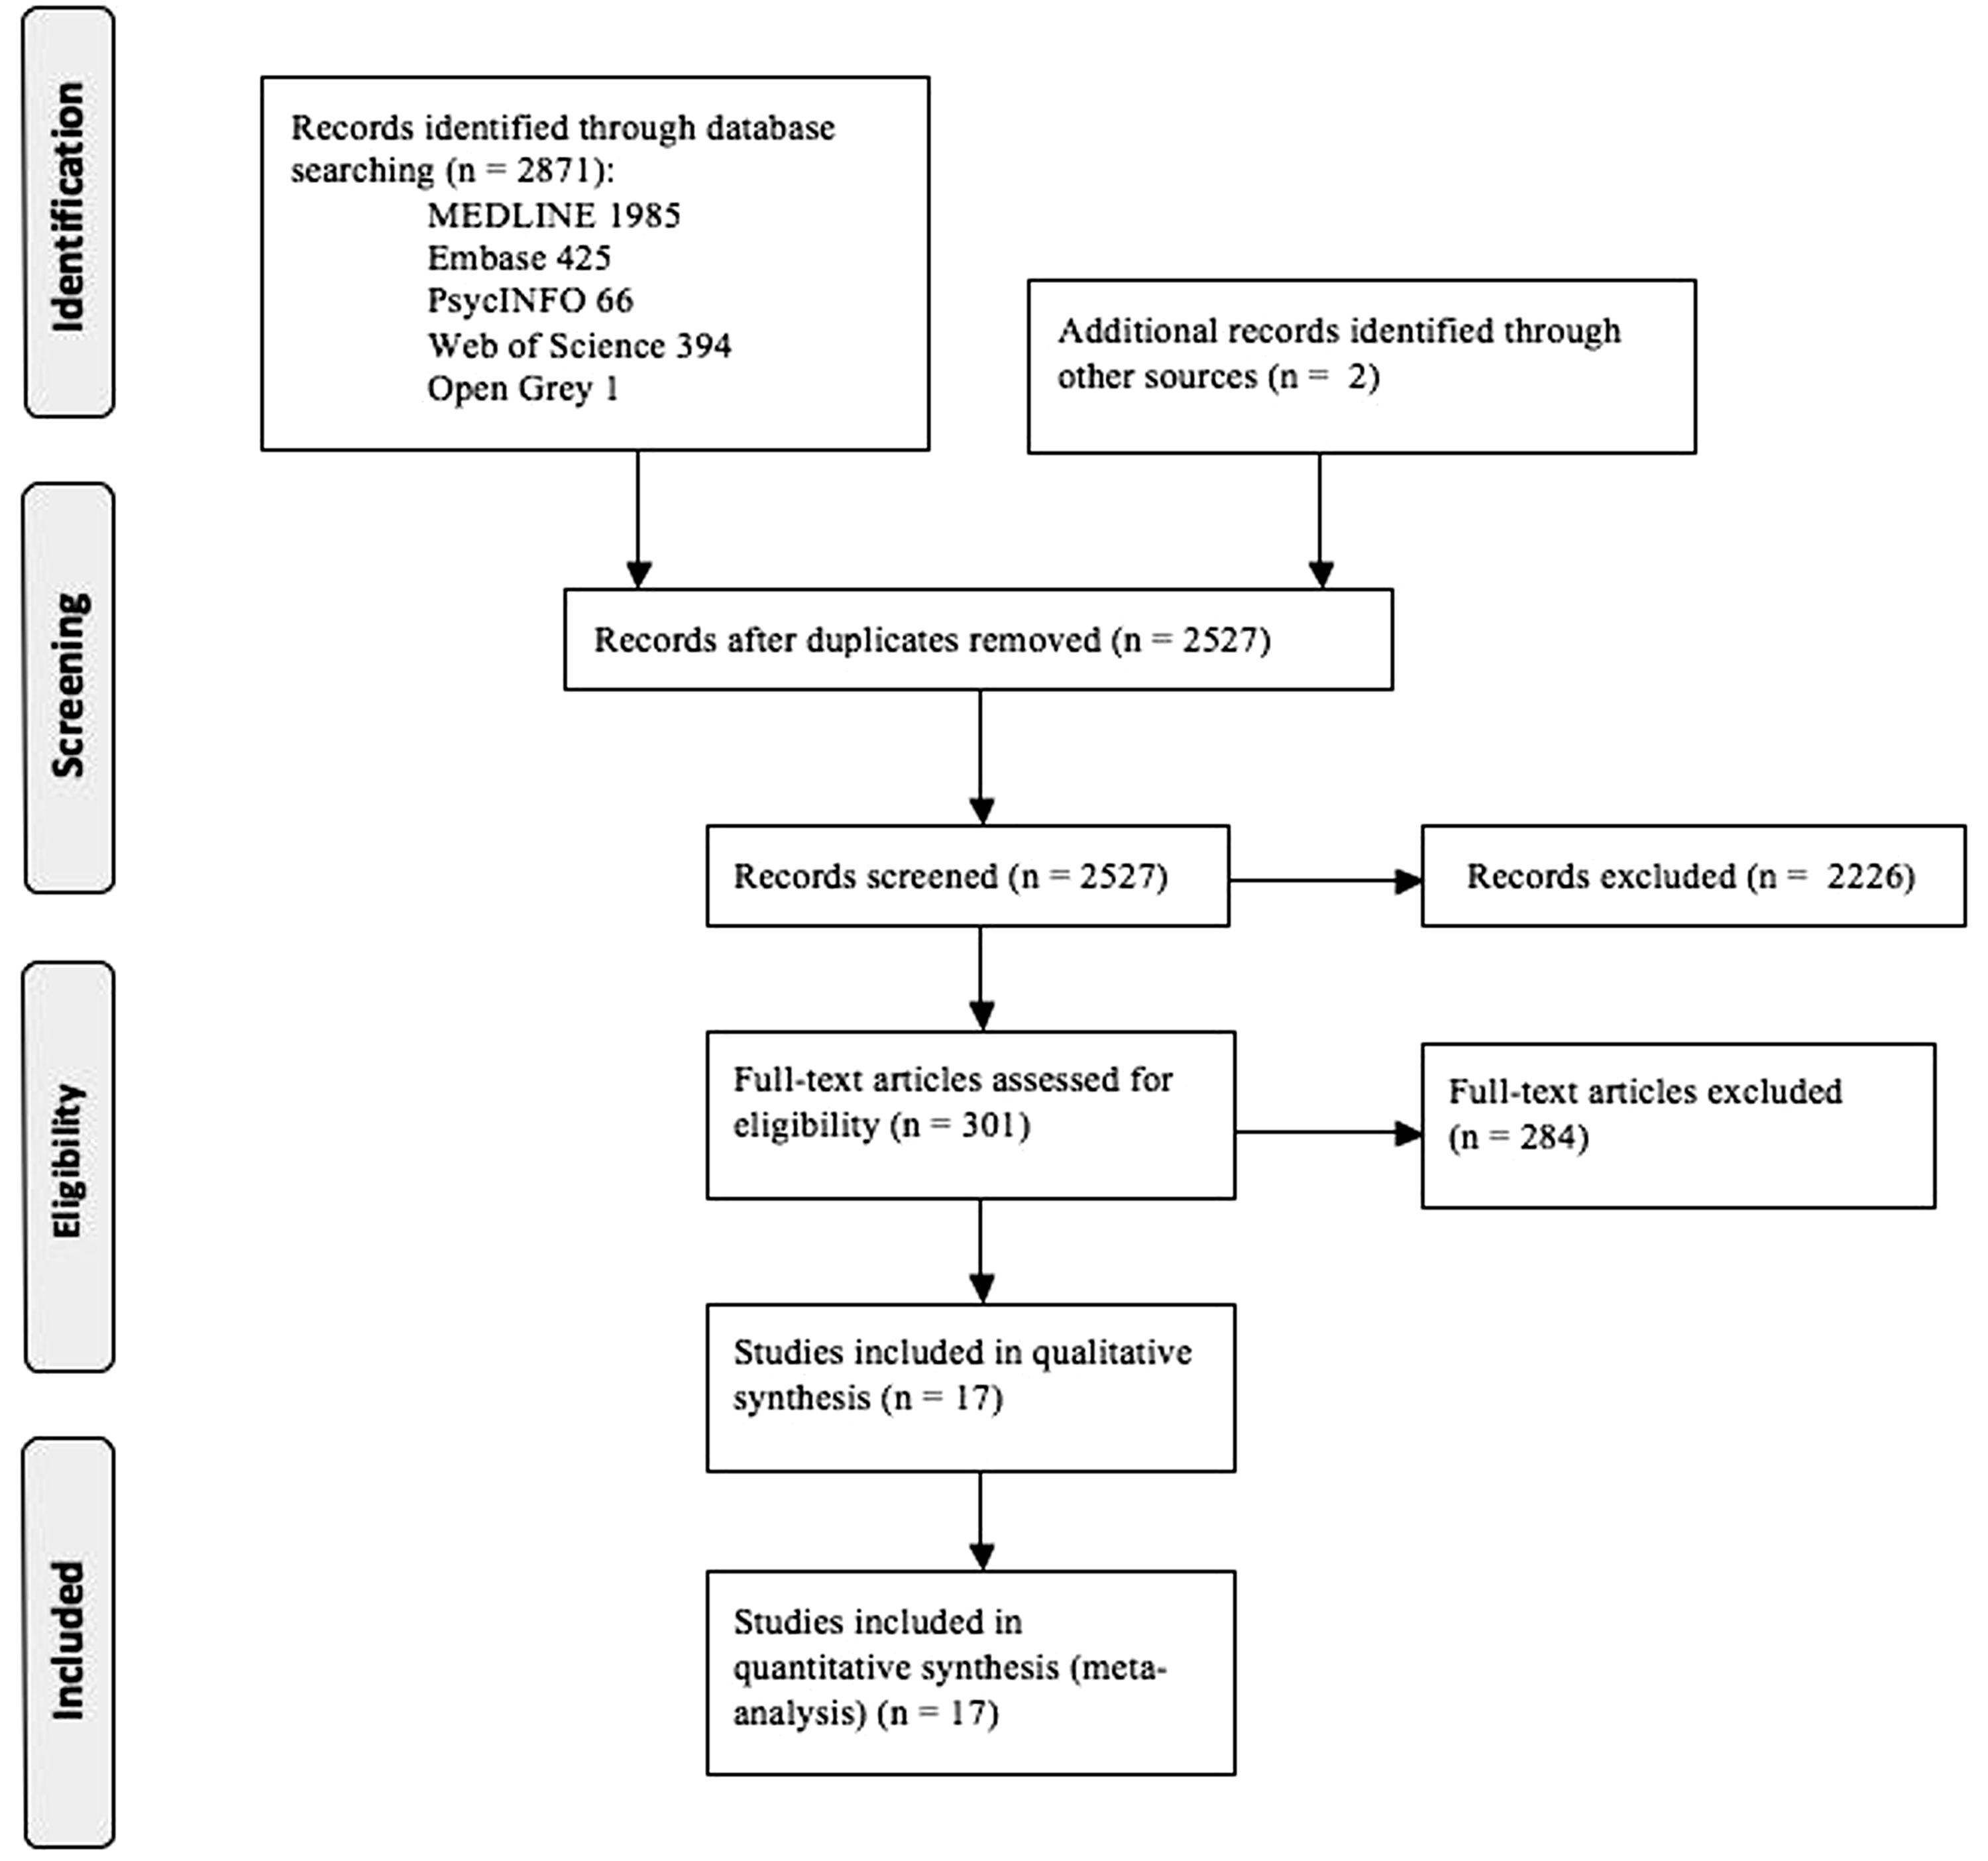
Risk of bias within studies
Four (23.5%) studies did not meet our definition of low risk of bias. The remaining were assessed as being at a low risk of bias. Only two (11.7%) included studies attained the maximum quality score (low risk of bias in all domains).
Synthesis of results
The pooled frequency of ictal epileptiform activity (electrographic seizures) in the EEG was 7% (95% CI 3%–12%, I2 = 93.5%, 14 studies, n = 2711, Figure 2), without significant differences when considering only studies at low risk of bias (13 studies), studies exclusively enrolling participants with haemorrhagic stroke (8 studies), studies including ischemic and haemorrhagic stroke (6 studies), or after excluding studies where only SAH were captured (13 studies). Studies where EEG was performed in a consecutive cohort of stroke patients showed a smaller frequency of events (4%, 95% CI 0%–12%, I2 = 82.5%, 4 studies, n = 339). No study exclusively enrolled participants with ischemic stroke. Studies including exclusively SAH patient did not differ from the other included studies (p = 0.77). The use of cEEG was not associated with an increased frequency of detected electrographic seizures (p = 0.05), nor with the setting where the patients were tested (ICU versus non-ICU, p = 0.31), or the year of publication (before versus after 2007, a threshold generated by splitting the included studies into two groups according to the year of publication) (p = 0.72). Studies performed in the USA showed a higher frequency of electrographic seizures than studies performed outside the USA (13% (95% CI 10%–17%) versus 1% (95% CI 0%–2%); p < 0.001).
Pooled frequency of ictal activity (electrographic seizures). This graph shows the results of each individual study in each of the lines, and the results of the meta-analysis in the last line (lozenge). The left column presents the surname of the first author of each study, the year of publication and the country where the study was performed, with the exception of the last line, where the results of the statistical heterogeneity tests employed are presented. The two middle columns show, from the left to the right, the graphical (forest plot) and numerical representation (percentage of participants with ictal activity and a 95% confidence interval [95% CI]) of the results of each individual study and, on the last line (lozenge), of the meta-analysis. The dotted vertical line represents the central estimate of effect. Finally, the right column depicts the weight each of the studies had on the meta-analysis.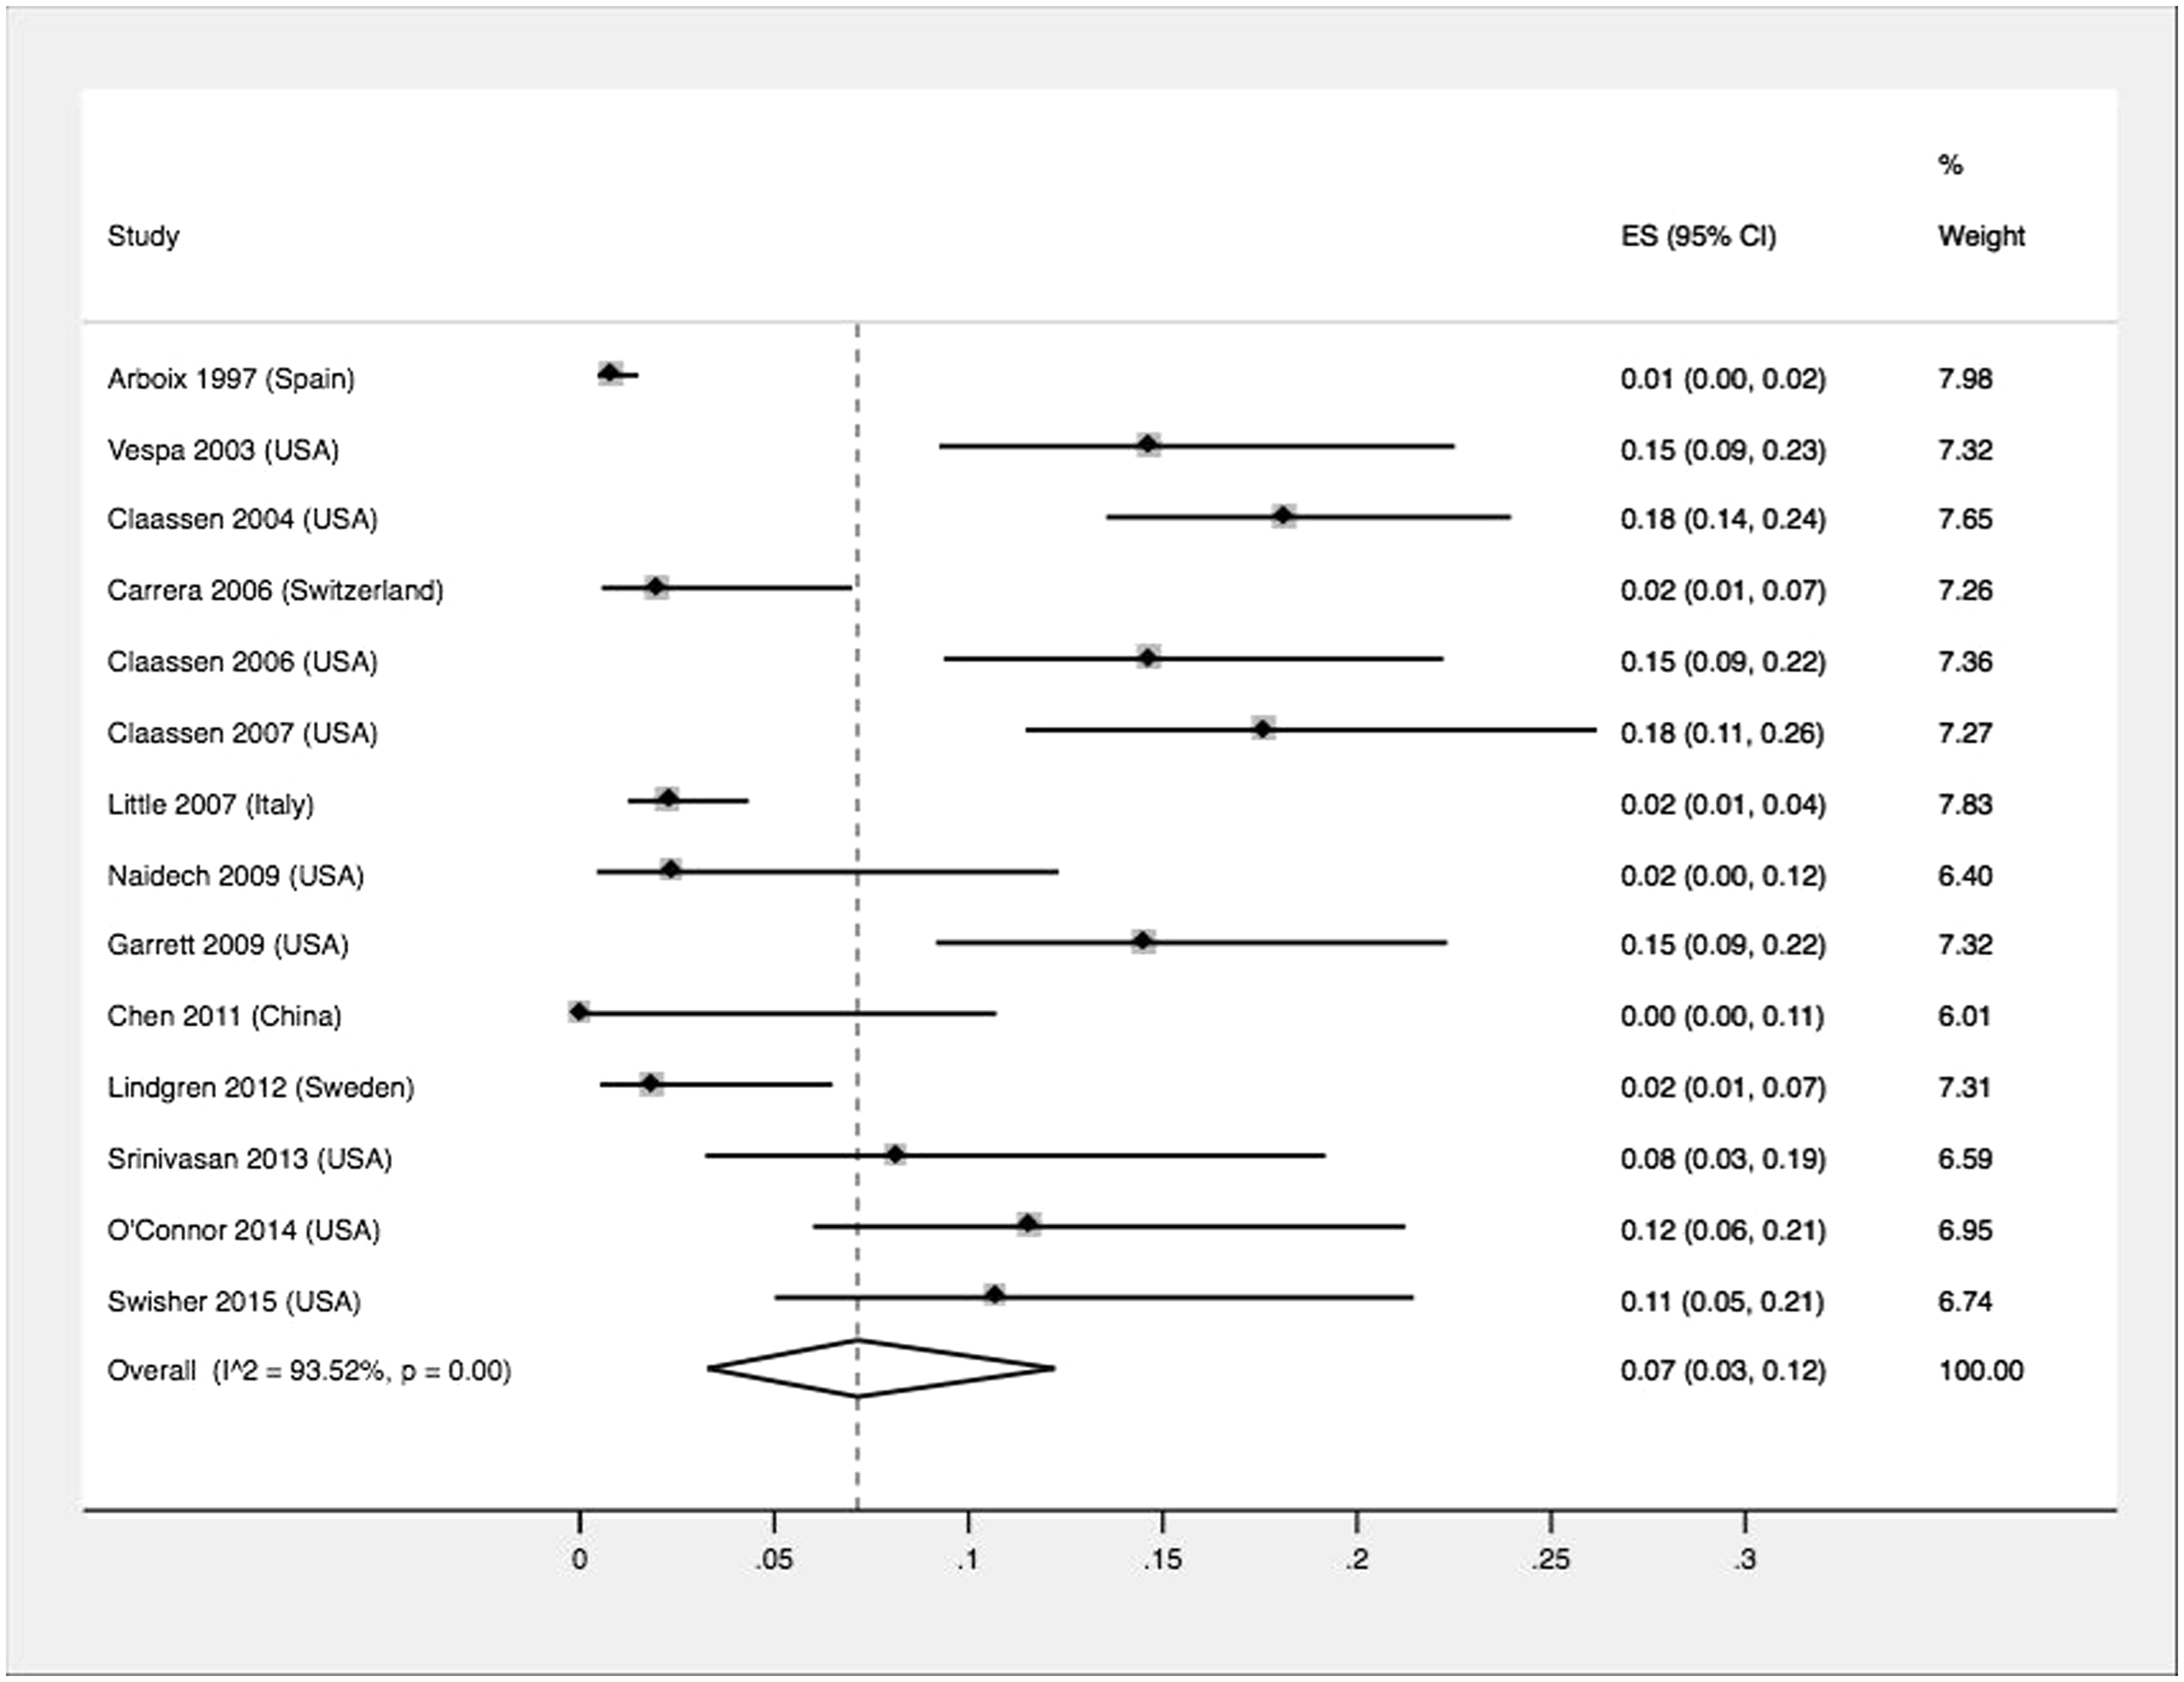
The pooled frequency of interictal epileptiform activity (non-periodic spikes and sharp waves) was 8% (95% CI 4%–13%, I2 = 86.0%, 7 studies, n = 1874, Figure 3). When only analysing trials at low risk of bias, the estimated frequency increased to 10% (95% CI 5%–16%, I2 = 85.48%, 6 studies, n = 1810). We found no difference for studies including ischemic and haemorrhagic stroke (8%, 95% CI 3%–13%, I2 = 87.2%, 5 studies, n = 1839), though we found an increased frequency among studies exclusively enrolling haemorrhagic stroke patients (12%, 95% CI 7%–13%, I2 = 96.8%, 2 studies, n = 240). No study reported solely on patients with SAH. Studies where EEG was performed in a consecutive cohort of stroke patients showed a higher frequency of events (14%, 95% CI 9%–21%, I2 = 0.0%, 2 studies, n = 132). Studies with cEEG showed a higher frequency of interictal epileptiform activity detection (14%, 95% CI 10%–20% vs. 6%, 95% CI 3%–10%; p = 0.01). No study performed in ICU reported these events and no differences were found between study site (p = 0.26) or year of publication (p = 0.29).
Pooled frequency of interictal activity (non-periodic spikes and sharp waves). This graph shows the results of each individual study in each of the lines, and the results of the meta-analysis in the last line (lozenge). The left column presents the surname of the first author of each study, the year of publication and the country where the study was performed, with the exception of the last line, where the results of the statistical heterogeneity tests employed are presented. The two middle columns show, from the left to the right, the graphical (forest plot) and numerical representation (percentage of participants with interictal activity and a 95% confidence interval [95% CI]) of the results of each individual study and, on the last line (lozenge), of the meta-analysis. The dotted vertical line represents the central estimate of effect. Finally, the right column depicts the weight each of the studies had on the meta-analysis.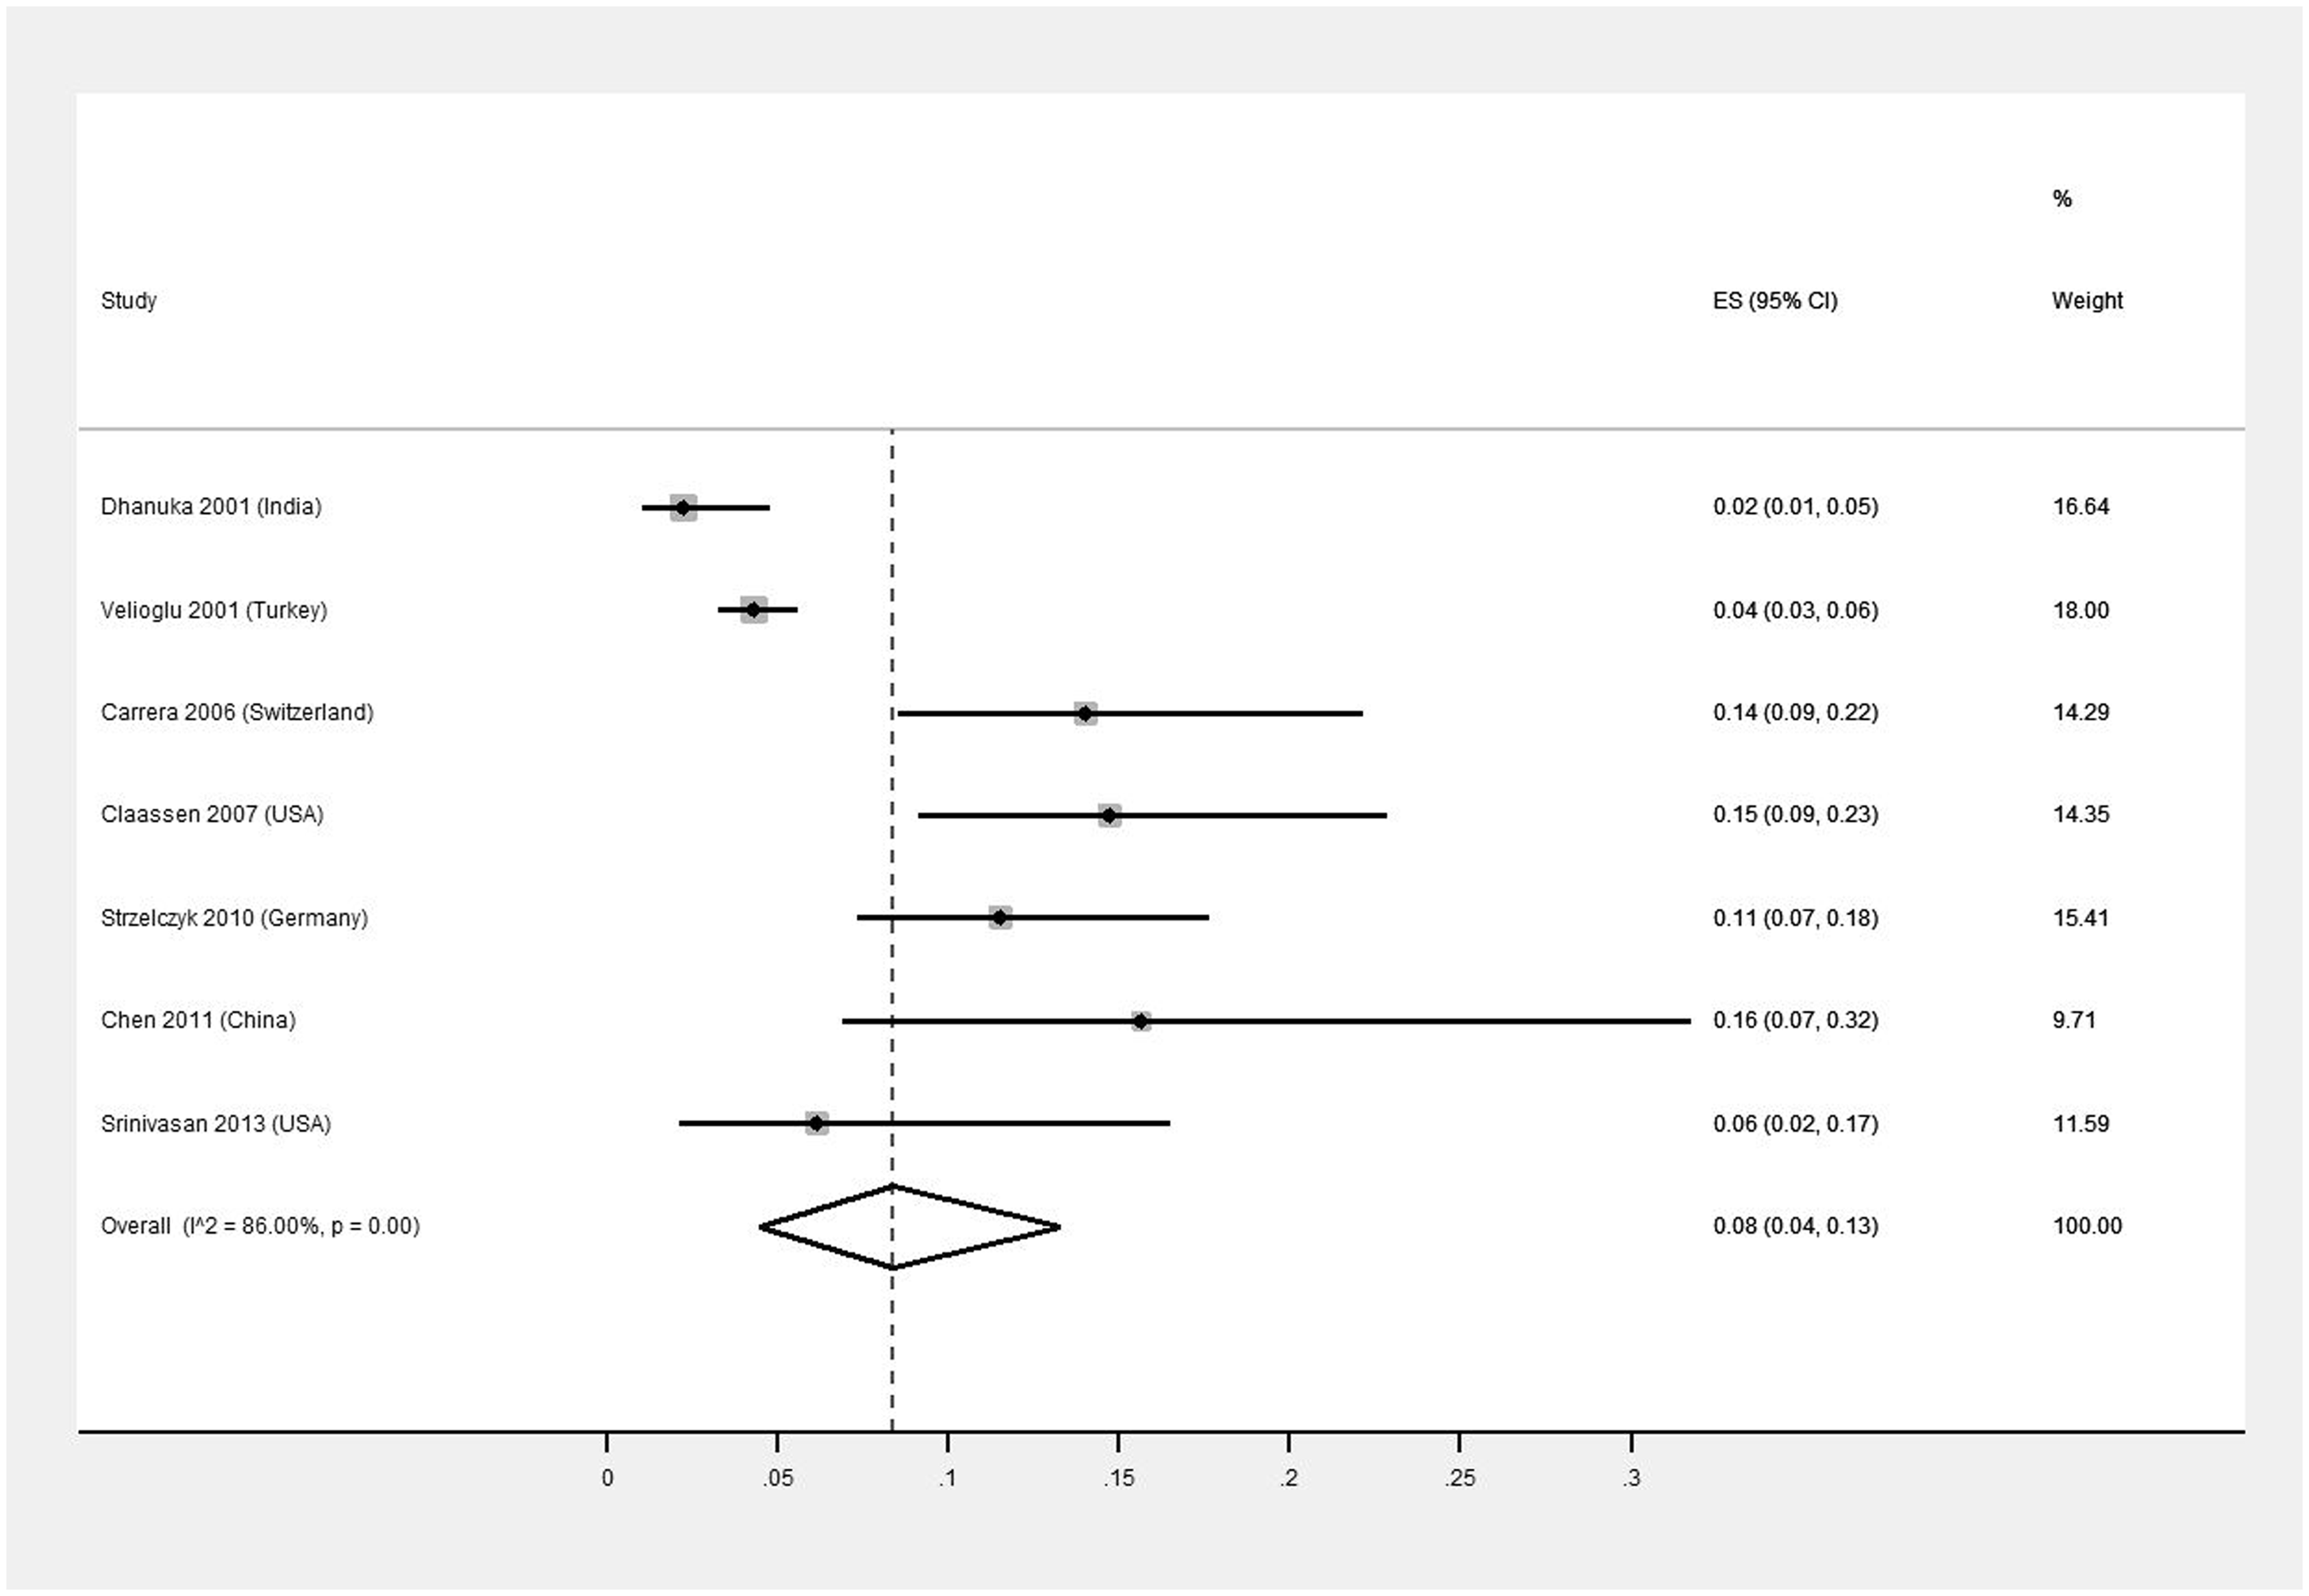
Discussion
This systematic review and meta-analysis of observational studies shows that 7% and 8% of patients following a stroke have ictal and interictal epileptiform activity, respectively, in the EEG. To the best of our knowledge, the frequency of post-stroke electroencephalographic events in observational studies was never pooled, and such results should prompt further discussion as to whether EEG should be used more frequently after stroke as a biomarker for epileptic manifestations.
Previous systematic reviews have shown that intracerebral haemorrhages and SAH are associated with a significantly greater probability of epileptic seizures.18,19 In our study, studies exclusively enrolling haemorrhagic stroke patients showed a higher frequency of interictal epileptiform activity but not of electrographic seizures. Furthermore, the frequency of events was not different in studies solely focused on SAH. Importantly, the absence of studies exclusively enrolling ischemic stroke patients may bias these results, since mixed population studies (i.e. including both ischemic and haemorrhagic stroke) are expected to set the bar for this comparison much higher, and decrease the likelihood of finding a statistically significant difference between populations. Also, the low number of studies analysing epileptiform activity in haemorrhagic stroke in general, and in SAH in specific, can also contribute to uncertainty and to unexpected results, as there is a pathophysiological rational for these stroke subtypes to be associated with more epileptiform activity.
As expected, in studies where consecutive stroke patients underwent an EEG, the frequency of ictal events was lower than our general estimate. This analysis subtracts from the selection bias introduced by retrospective studies where it is methodologically difficult to avoid a systematic error of including participants more likely to have epileptiform activity, such as those with clinical seizures or with a lower or fluctuating consciousness level. Unfortunately, our confidence in these results is low due to limited statistical power and low precision. Unexpectedly, the frequency of interictal events in these studies exceeds the general estimate, though the reason for this finding may be the lack of power, since only 2 studies were included.
In our study, cEEG did not increase the likelihood of detection of ictal epileptiform activity, which agrees with previous studies, 20 where it was stated that insufficient data exists to support the benefit of cEEG over spot EEG recordings. That being said, the detection rate of interictal epileptiform activity with cEEG was twice as high without cEEG.
The frequency of electrographic seizures was not different in ICU and non-ICU patients. However, the scarcity of studies and the imbalances between population characteristics may bias these results.
Not unexpectedly, the year of publication did not influenced the frequency of events. On the other hand, it was interesting to note that studies conducted in the US showed a statistically significant higher frequency of ictal events. We hypothesise that this can be explained by the population characteristics, since a great majority of the North American studies were based in an intensive care setting, while this was not true for the other studies.
Finally, it is important to note that this study has several limitations. The quality assessment showed that almost 80% of the studies were at low risk of bias but only 12% had a high quality standard. Our methodological options probably underestimate electroencephalographic epileptiform activity. EEG is more likely to be requested if there is a clinical suspicion of seizures. This selection bias by indication is only avoidable in prospective studies where EEG is performed on all patients regardless of the clinical features. Studies reporting electroencephalographic epileptiform activity are not controlled with a group of participants without the pathological condition of interest, but who were subject to the same kind of clinical and diagnostic procedures. This invalidates the possibility of studying risks of events instead of frequency as we did. It would be interesting to understand how the frequency of clinical seizures relates to the frequency of electrographic ones. Unfortunately, due to diagnostic bias, since not all enrolled participants performed EEG, the available literature cannot reliably answer this question. Finally, we would like to have included the timing of the EEG in our analyses, since this variable seems to be closely related with the likelihood of detection of epileptiform events. Unfortunately this data was rarely available.
Conclusion
In conclusion, the frequency of ictal and interictal epileptiform activity in the EEG was comparable with previous frequency analyses of clinical seizures. The frequency of ictal epileptiform activity did not change with continuous record or clinical setting, while the frequency of interictal epileptiform activity increased with continuous recordings.
Footnotes
Acknowledgements
We would like to thank the Sociedade Portuguesa do AVC (SPAVC) for their support.
Declaration of Conflicting Interests
The author(s) declared the following potential conflicts of interest with respect to the research, authorship, and/or publication of this article: JMF has received personal fees from Boehringer Ingelheim. The remaining authors declare that there is no conflict of interest.
Funding
The author(s) disclosed receipt of the following financial support for the research, authorship, and/or publication of this article: This work was supported by the “2012 Research Grant in Cerebrovascular Diseases” (sponsor: Sociedade Portuguesa do AVC (SPAVC)/funder: Tecnifar).
Ethical approval
Not applicable.
Informed consent
Not applicable.
Guarantor
JC and JMF.
Contributorship
CB and JC conceived the study. FBR and JC were involved in protocol development. DS, GSD, ACF, RM, HN and ARP performed the systematic review. FBR performed the data analysis. CB, FBR and GSD wrote the first draft of the manuscript. All authors reviewed and edited the manuscript and approved the final version of the manuscript.
References
Supplementary Material
Please find the following supplemental material available below.
For Open Access articles published under a Creative Commons License, all supplemental material carries the same license as the article it is associated with.
For non-Open Access articles published, all supplemental material carries a non-exclusive license, and permission requests for re-use of supplemental material or any part of supplemental material shall be sent directly to the copyright owner as specified in the copyright notice associated with the article.