
Abstract
Introduction
It is well established that managing patients with acute stroke in dedicated stroke units is associated with improved functioning and survival. The objectives of this study are to investigate whether patients with acute stroke are less likely to be directly admitted to a stroke unit from the Emergency Department when hospital beds are scarce and to measure variation across hospitals in terms of this outcome.
Patients and methods
This register study comprised data on patients with acute stroke admitted to 14 out of 72 Swedish hospitals in 2011–2014. Data from the Swedish stroke register were linked to administrative daily data on hospital bed occupancy (measured at 6 a.m.). Logistic regression analysis was used to analyse the association between bed occupancy and direct stroke unit admission.
Results
A total of 13,955 hospital admissions were included; 79.6% were directly admitted to a stroke unit from the Emergency Department. Each percentage increase in hospital bed occupancy was associated with a 1.5% decrease in odds of direct admission to a stroke unit (odds ratio = 0.985, 95% confidence interval = 0.978–0.992). The best-performing hospital exhibited an odds ratio of 3.8 (95% confidence interval = 2.6–5.5) for direct admission to a stroke unit versus the reference hospital.
Discussion and conclusion
We found an association between hospital crowding and reduced quality of care in acute stroke, portrayed by a lower likelihood of patients being directly admitted to a stroke unit from the Emergency Department. The magnitude of the effect varied considerably across hospitals.
Keywords
Background
Managing patients with acute stroke in a dedicated stroke unit (SU) is associated with increased rates of survival and independence. 1 The positive effects remain at 5 and 10 years of follow-up.2,3 Due to the wealth of evidence that supports its positive effects, SU care is now recommended in a multitude of global, national and regional guidelines.4–7 Moreover, the benefits of SU care has been shown in all subgroups of stroke patients and is not associated with an increased hospital length-of-stay. 1
Despite the consensus about the value of SU care, data from the Swedish stroke register (Riksstroke) suggest that the proportion of patients with acute stroke in Sweden who are directly admitted to a SU as the first destination from the Emergency Department (ED) is only 79%, with no improvement over the past 3 years. 4 A widespread belief is that hospital bed shortages contribute, making the continued downsizing of hospital bed capacity in Swedish hospitals worrisome.4,8–10
While a link between hospital bed shortages and ED overcrowding is already established, recent publications suggest additional associations with decreased overall hospital admission rates from the ED and premature hospital discharges.11–18
In an attempt to elaborate the effects of hospital crowding in patients with acute stroke, this study aims at measuring the association between hospital bed occupancy and the likelihood of direct admission to a SU from the ED. A secondary objective is to investigate whether the likelihood of direct SU admission varies across study sites.
Patients and methods
Study design
The study was conducted as a register study on Riksstroke data, enriched with data on hospital bed occupancy from 14 hospitals in two different administrative regions in Sweden – Norrbotten County council and Region Skåne. The study period stretched from 1 January 2011 to 31 December 2014. All patients registered with an acute stroke in Riksstroke at any of the 14 included hospitals were included, while patients with transient ischemic attacks (TIA) were not included. Patients who were not admitted to a hospital ward at stroke onset were excluded, as were patients with in-hospital stroke. Hospital bed occupancy data for 2011 was not available for five of the participating hospitals (S4, S6, S7, S8 and S9); which therefore only contributed data for 2012–2014.
Setting
Sweden is a sparsely populated country in northern Europe, with approximately 10 million inhabitants. Its healthcare system is organised in a way that leaves the Swedish government responsible for supervising the system (e.g. through legislation), while 21 counties and regions provide primary and secondary care. Each county and region deploys its own political leadership to prioritise healthcare resources, which are funded by taxes imposed on the citizens. Apart from a small copayment at each visit, healthcare is free for patients. As most Swedish hospitals do not yet staff Emergency Medicine specialist physicians Swedish EDs are staffed by specialists from the inpatient departments, leaving the triage nurse to decide which subspecialty department should be the first to assess a patient upon arrival in the ED.
Norrbotten County is one of the most sparsely populated Swedish regions, supplying healthcare to ∼250,000 inhabitants distributed over almost 100,000 km2. The county hospital is located in the village of N2, while four rural hospitals are located in the towns of N1, N3, N4 and N5. All five hospitals have EDs that are open around the clock. However, the hospitals in N1 and N5 refer patients that have complaints outside the realm of internal medicine to the hospitals in N2 and N3, respectively. The hospital in N2 is an academic teaching hospital affiliated with Umeå University. All hospitals contribute data on stroke patients to Riksstroke.
In contrast, Region Skåne is one of the most densely populated Swedish regions, supplying healthcare to ∼1.3 million inhabitants distributed over 11,300 km2. This yields a population density about 45 times higher than in Norrbotten County. 19 There are 10 hospitals in Region Skåne, of which nine offer emergency care and supply data on stroke patients to Riksstroke. The hospitals in the cities of S1, S2, S3, S5 and S9 offer emergency care around the clock. All four except S9 are academic teaching hospitals affiliated with Lund University. The hospitals in S6, S7 and S8 offer emergency care from 08.00 a.m. to 08.00 p.m. every day, and the hospital in S4 offers emergency care from 08.00 a.m. to 05.00 p.m., Monday to Friday.
While the definition of a dedicated SU may be subject to variation globally, Swedish authorities have defined it as ‘an organized in-hospital facility that entirely (or next to entirely) is devoted to care for patients with stroke’ that ‘is staffed by a multidisciplinary team with special knowledge in stroke care’. 20 All participating hospitals have had SUs meeting this definition since at least 2007. 21
It is difficult to quantify the exact number of SU beds at the study sites, as some beds are ‘flexible’ (i.e. not exclusively dedicated to stroke patients) and subject to variation over time. Despite this, Riksstroke estimates that some 984–1271 SU beds are currently available in Sweden (9.8–12.7 per 100,000 inhabitants). Following this, SU beds are expected to account for approximately 4.5% of the total number of Swedish hospital beds. The number of SU beds in Region Skåne and Norrbotten County are 156–205 and 56–76, respectively (12.0–15.8 and 22.4–30.4 per 100,000 inhabitants). 10
Data sources
Data on acute care episodes were retrieved from Riksstroke. Data regarding hospital bed occupancy in the hospitals in Norrbotten County were retrieved from the regional data warehouse. Corresponding data from Region Skåne were retrieved from an administrative healthcare database used in regional quality assurance.
Variables
The exposure variable (hospital bed occupancy) was defined as the number of occupied beds divided by the number of staffed beds in the Internal Medicine department (including SUs, cardiology wards, haematology wards, nephrology wards, etc.) and Intensive Care Unit (ICU) of each participating hospital at 06.00 a.m. daily. Where applicable (hospital S2), the department of neurosurgery was also included. The decision to include only Internal Medicine department beds was made a priori and reflected the strong tendency to relocate stroke patients within Internal Medicine departments only, rather than to other departments (e.g. orthopaedic wards, psychiatric wards, etc.). ICUs and the department of neurosurgery were included as they are considered equivalent to SUs according to the Riksstroke definition and as some stroke patients indeed require this level of care. The decision to measure occupancy at 06.00 a.m. was also made a priori and was thought to capture the information available during discharge rounds (which generally occur before noon). However, this choice was also tainted by data availability in Norrbotten County.
The outcome variable captured direct admission to a SU as first destination after being admitted to the hospital from the ED and was prospectively recorded in Riksstroke. A SU, the ICU and neurosurgery departments were equated in this respect (in accordance with national definitions and suggestions from Riksstroke). 4 A theoretical casual model of the relationship between the exposure and the outcome was created through an iterative process involving the authors and official representatives from Riksstroke, using the directed acyclic graph (DAG) methodology. 22 The DAG method was also deployed to identify factors potentially confounding the relationship between the exposure and the outcome (please see Appendix 1, all appendices can be found online with this article). The following independent variables were screened for inclusion in the multivariable models, based on insights from the DAG: managing hospital, patient sex and age, whether the patient had suffered a prior stroke (dichotomous), the time of presentation, the stroke type (ischemic/hemorrhagic), patient level of consciousness on arrival (Reaction Level Scale, RLS) (awake = RLS 1, lowered = RLS 2–3, unconscious = RLS 4–8) and whether a thrombolysis alarm was triggered upon patient arrival. These variables were all retrieved from Riksstroke. The datasets were linked by one of the authors (MB) in the open-source programming language Python™ (release 2.7).
Statistics
Descriptive data for the study population were described as proportions. The proportion of direct admissions to the SU was then compared across different levels of hospital bed occupancy (using Fisher’s exact test). Following the findings of Bagust et al., hospital bed occupancy <85% was used for reference, with subsequent levels constructed as 5% increments. 23 Binary logistic regression was used to adjust for confounding factors. As the goal was to evaluate a predictor of primary interest, additional independent variables were added in subsequent layers to improve model face-validity. 24 The models were built as nested models in four layers using the entry method rather than implementing automatic rejection criteria. The variables added in each layer were: (a) Hospital bed occupancy, (b) circumstantial factors (managing hospital, presentation during weekend), (c) patient factors (age, sex, prior stroke) and (d) visit level factors (subject to thrombolysis alarm, level of consciousness, stroke type). The contribution of individual variables in each model was evaluated using the Wald test and the likelihood-ratio test.25–27 Multi-collinearity was first addressed by constructing a matrix for bivariate correlations between candidate variables. A Spearman correlation coefficient of 0.70 was considered indicative. 28 The models were screened for multicollinearity by inspecting the standard errors of the regression coefficients across model layers, along with model convergence. 25 Multicollinearity was finally addressed by VIF and tolerance statistics, along with inspecting the condition index for each model.28,29 The Box-Tidwell approach was used to address the assumption of variable linearity. 25 Variables that did not pass this test were converted to the ordinal scale before being included in the models. The overall model fit was assessed using the receiver-operating characteristic (ROC) curve, the likelihood ratio test and Nagelkerke’s R2. 30 The assumption of independent observations in the logistic regression models was in part addressed by factors inherent to Riksstroke (a new stroke within 28 days from the previous is not included in the registry) and in part by conducting a sensitivity analysis making use of index cases only (i.e. the first registered care episode for each patient during the study period). The modelling strategy was decided a priori to analysis. All statistical analyses were performed in IBM® SPSS® Statistics 22.
Results
Exclusion analysis and baseline characteristics
The number of registered patients in the participating hospitals during the study period was 16,182 – of which Norrbotten County contributed 3039 visits and Region Skåne 13,143. Of the total, 15,018 visits were linked with occupancy data from the study period. Fifty-four visits that did not result in hospitalisation were excluded from the study. In all, 1009 cases were excluded because they were already hospitalised at the onset of symptoms. The remaining 13,955 visits were included in the main analysis; 687/13,955 (4.9%) visits lacked data on one or more variables included in the multivariable models. These cases were not imputed, but were excluded from analysis in a complete-cases approach. In all, 1077/13,955 visits did not constitute index cases, leaving 12,878 visits for sensitivity analysis. Six hundred thirty-two of these 12,878 visits lacked data on one or more variables used in the multivariable models and were therefore left out of analysis (Figure 1).
Exclusion analysis.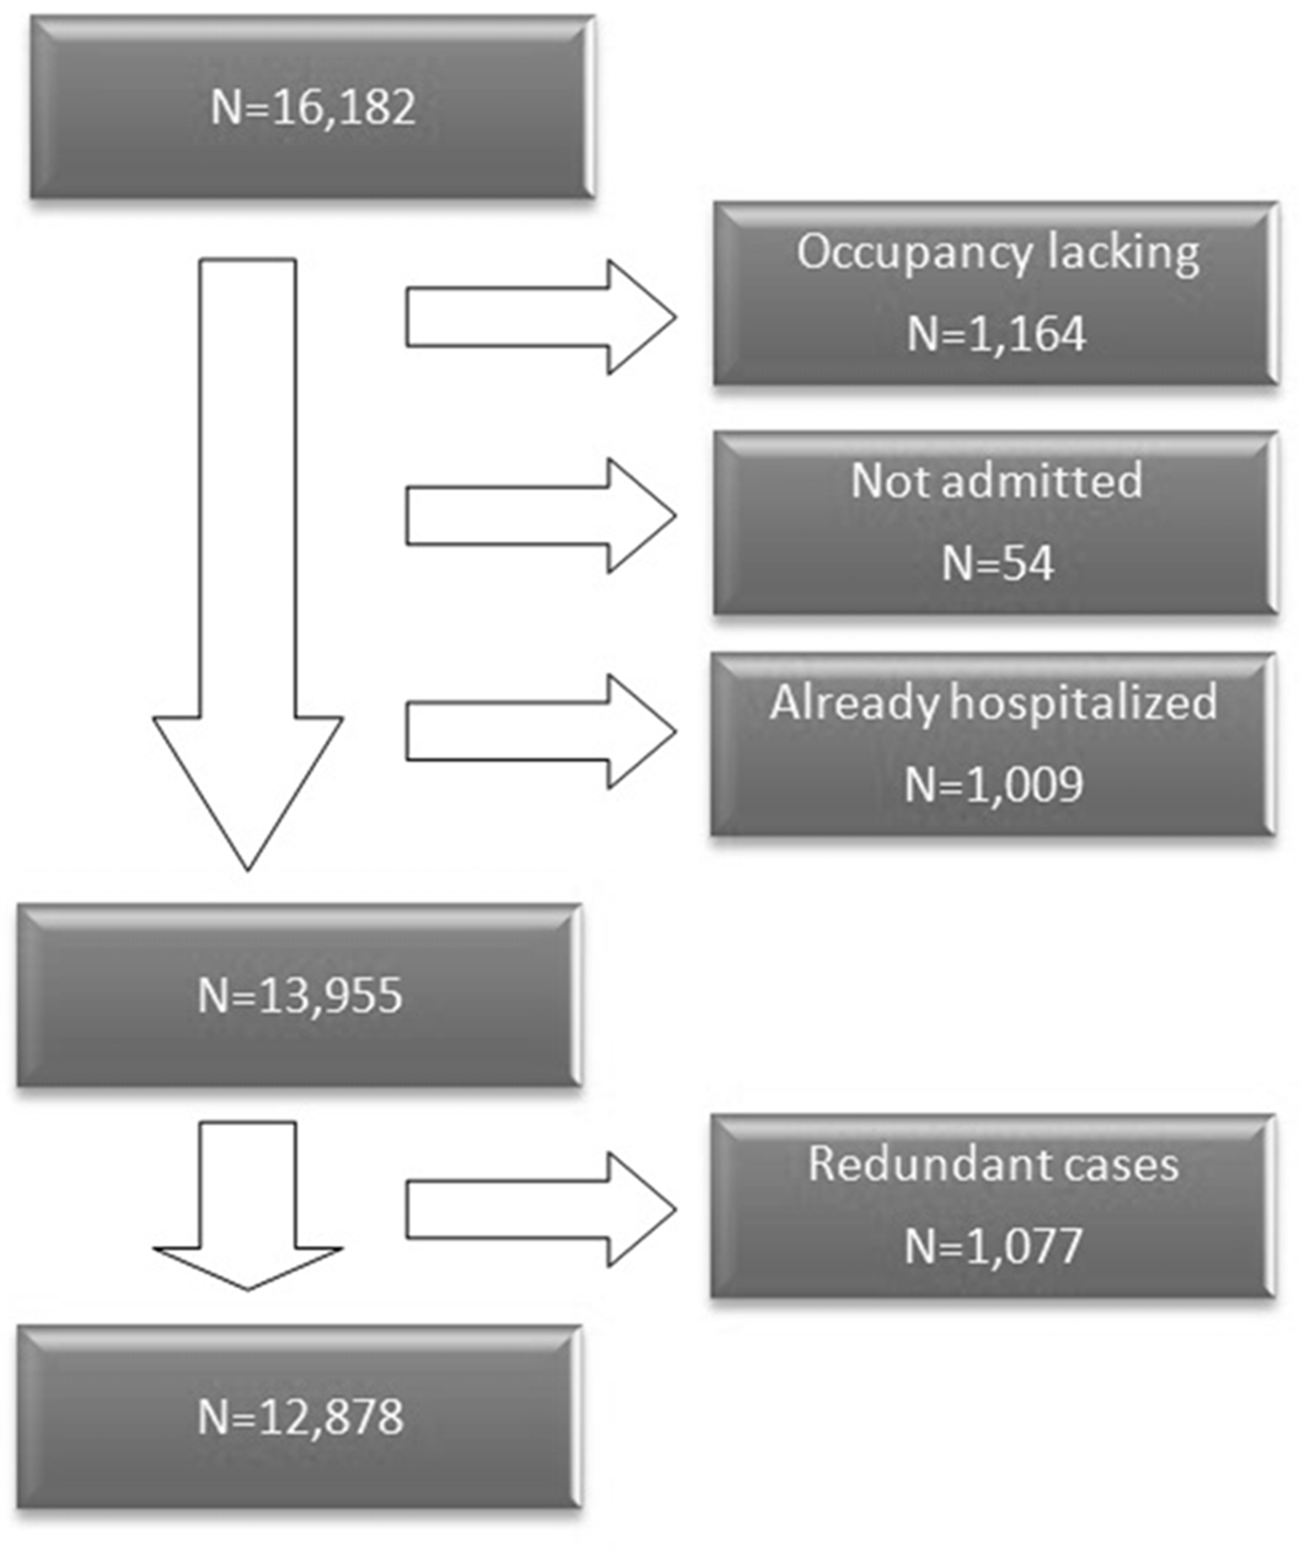
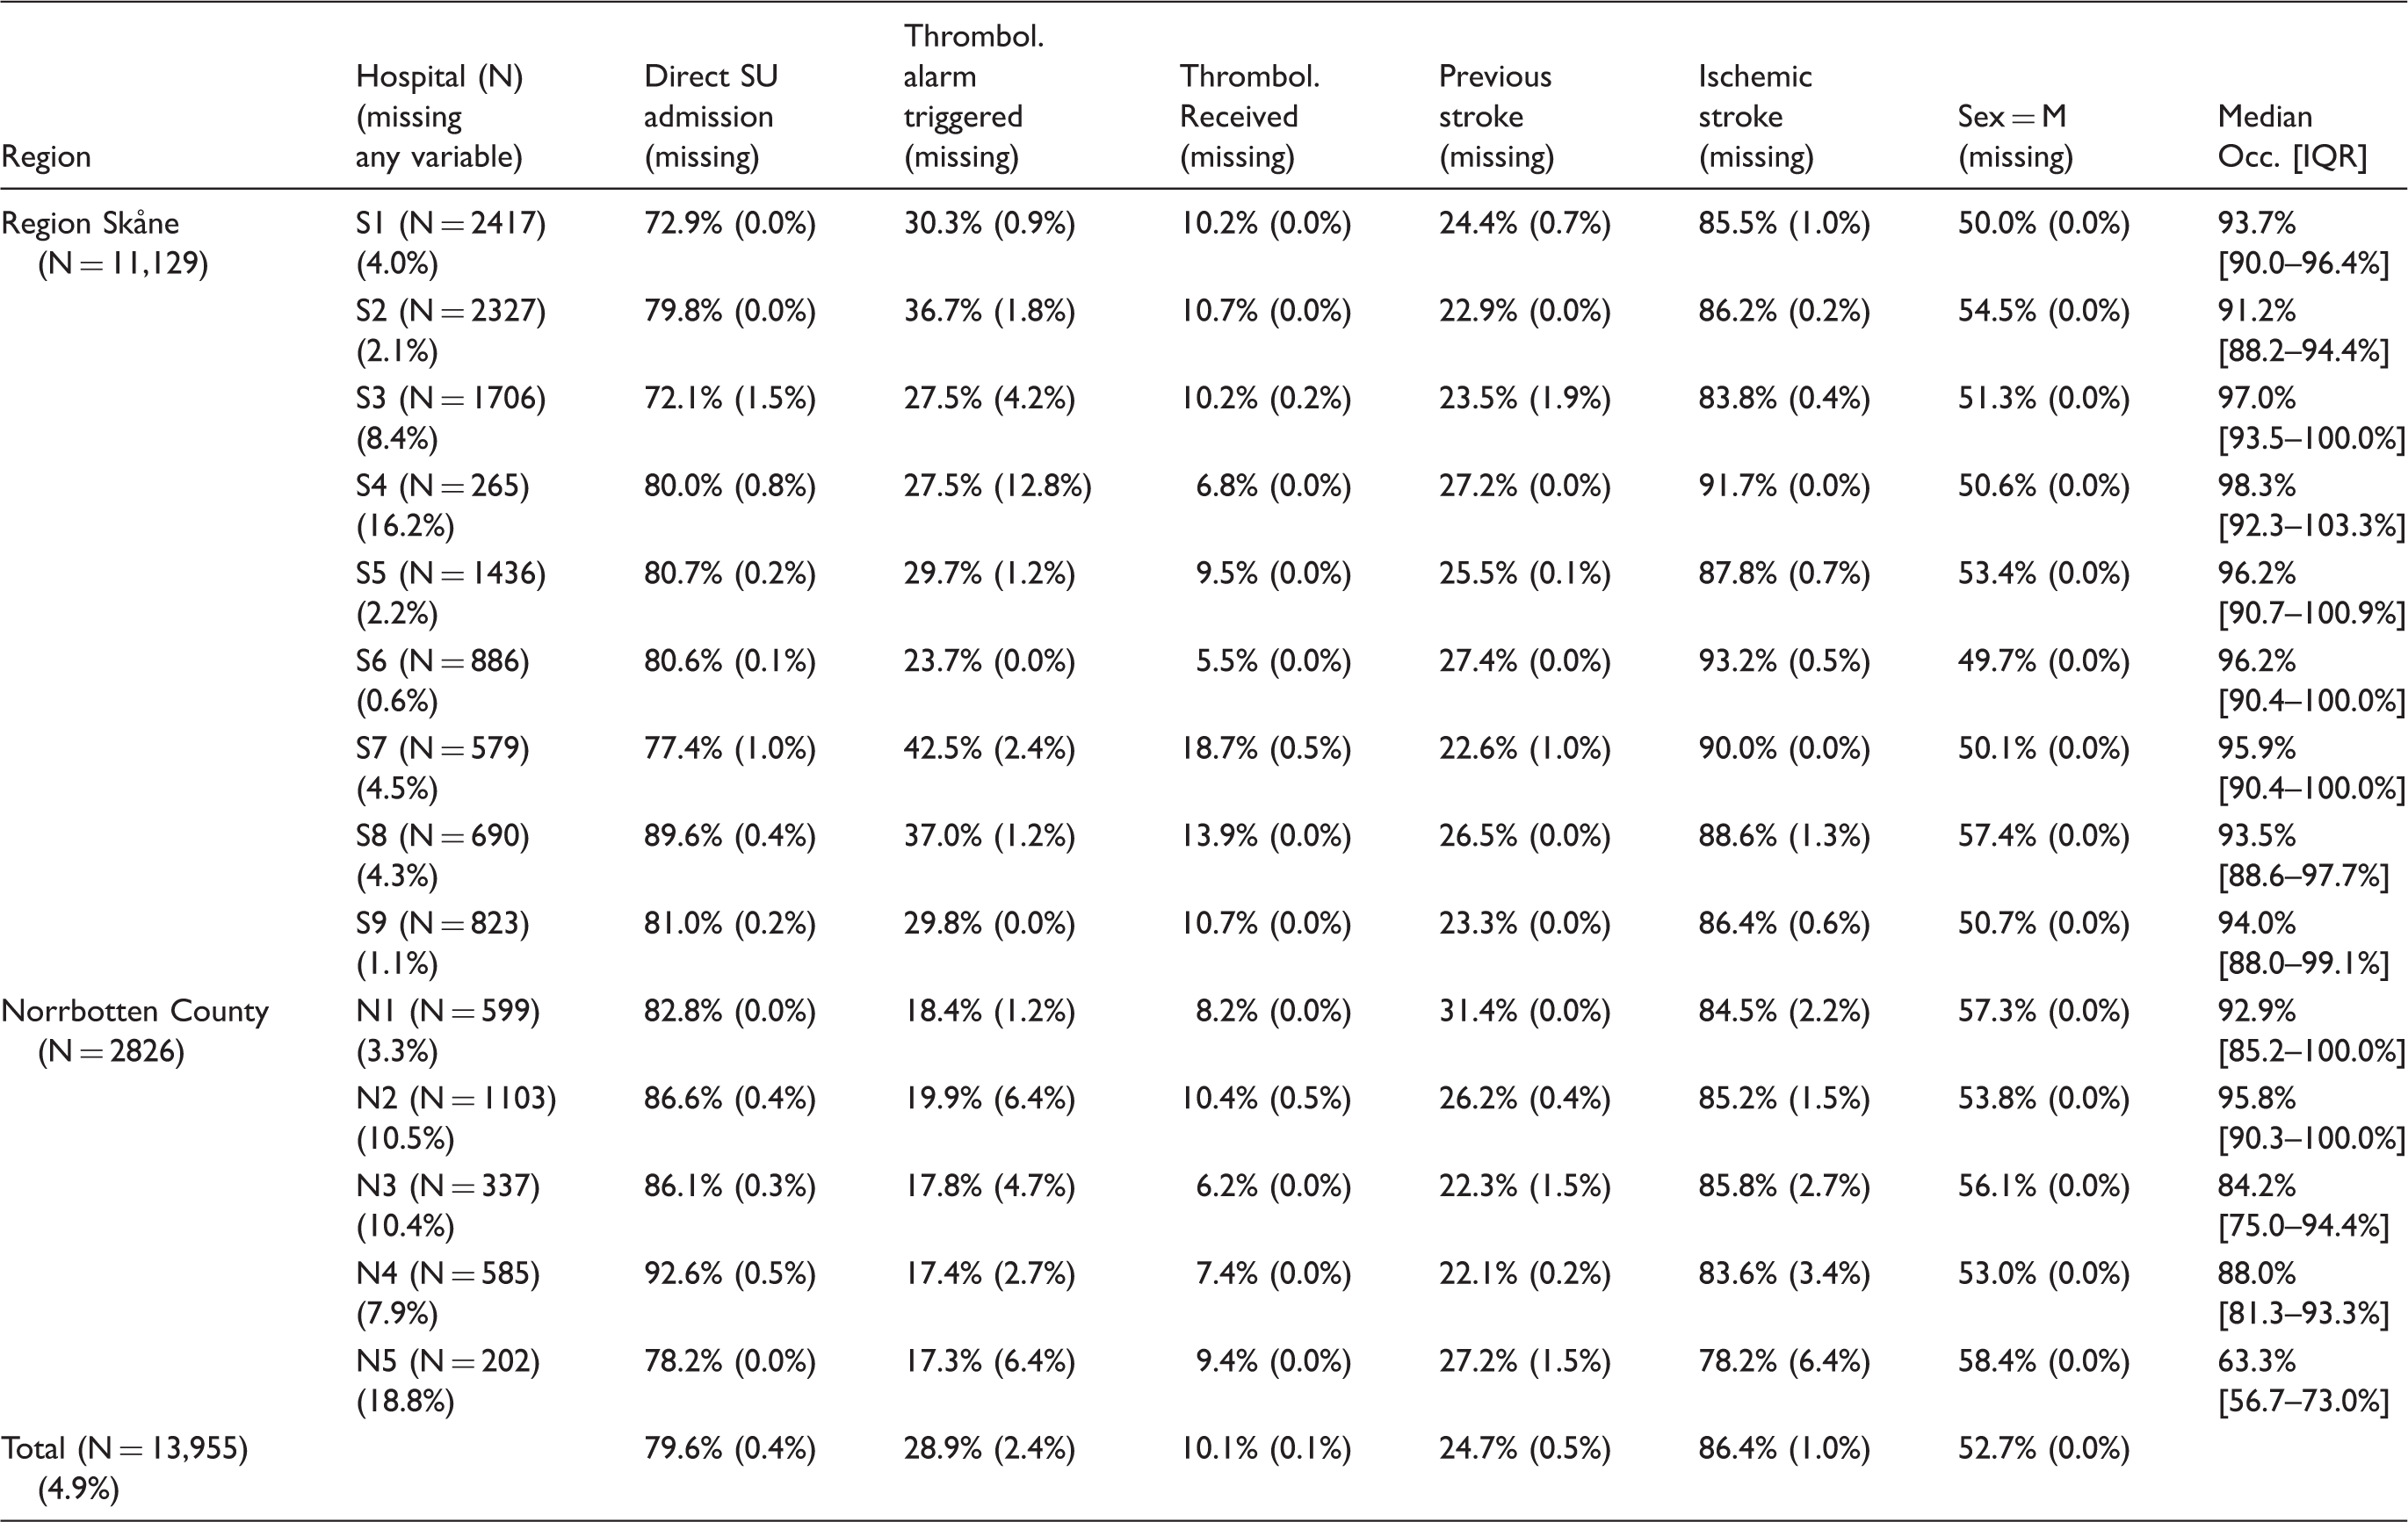
Descriptive data on included variables.
Direct SU admission as a function of hospital bed occupancy
The crude analysis revealed a significantly lower overall proportion directly admitted to a SU from the ED, for hospital bed occupancy levels 90–95%, 95–100% and 100%, respectively, when compared to occupancy <85% (p < .001). Post-hoc power calculations revealed a statistical power of 93.9%, 91.1% and 86.9% for these comparisons.
31
Fifty-one out of 13,955 cases lacked information about direct SU admission and were excluded from the analysis (Figure 2).
Proportion of patients directly admitted to a SU across levels of hospital bed occupancy. N = 13,904. *Reference level.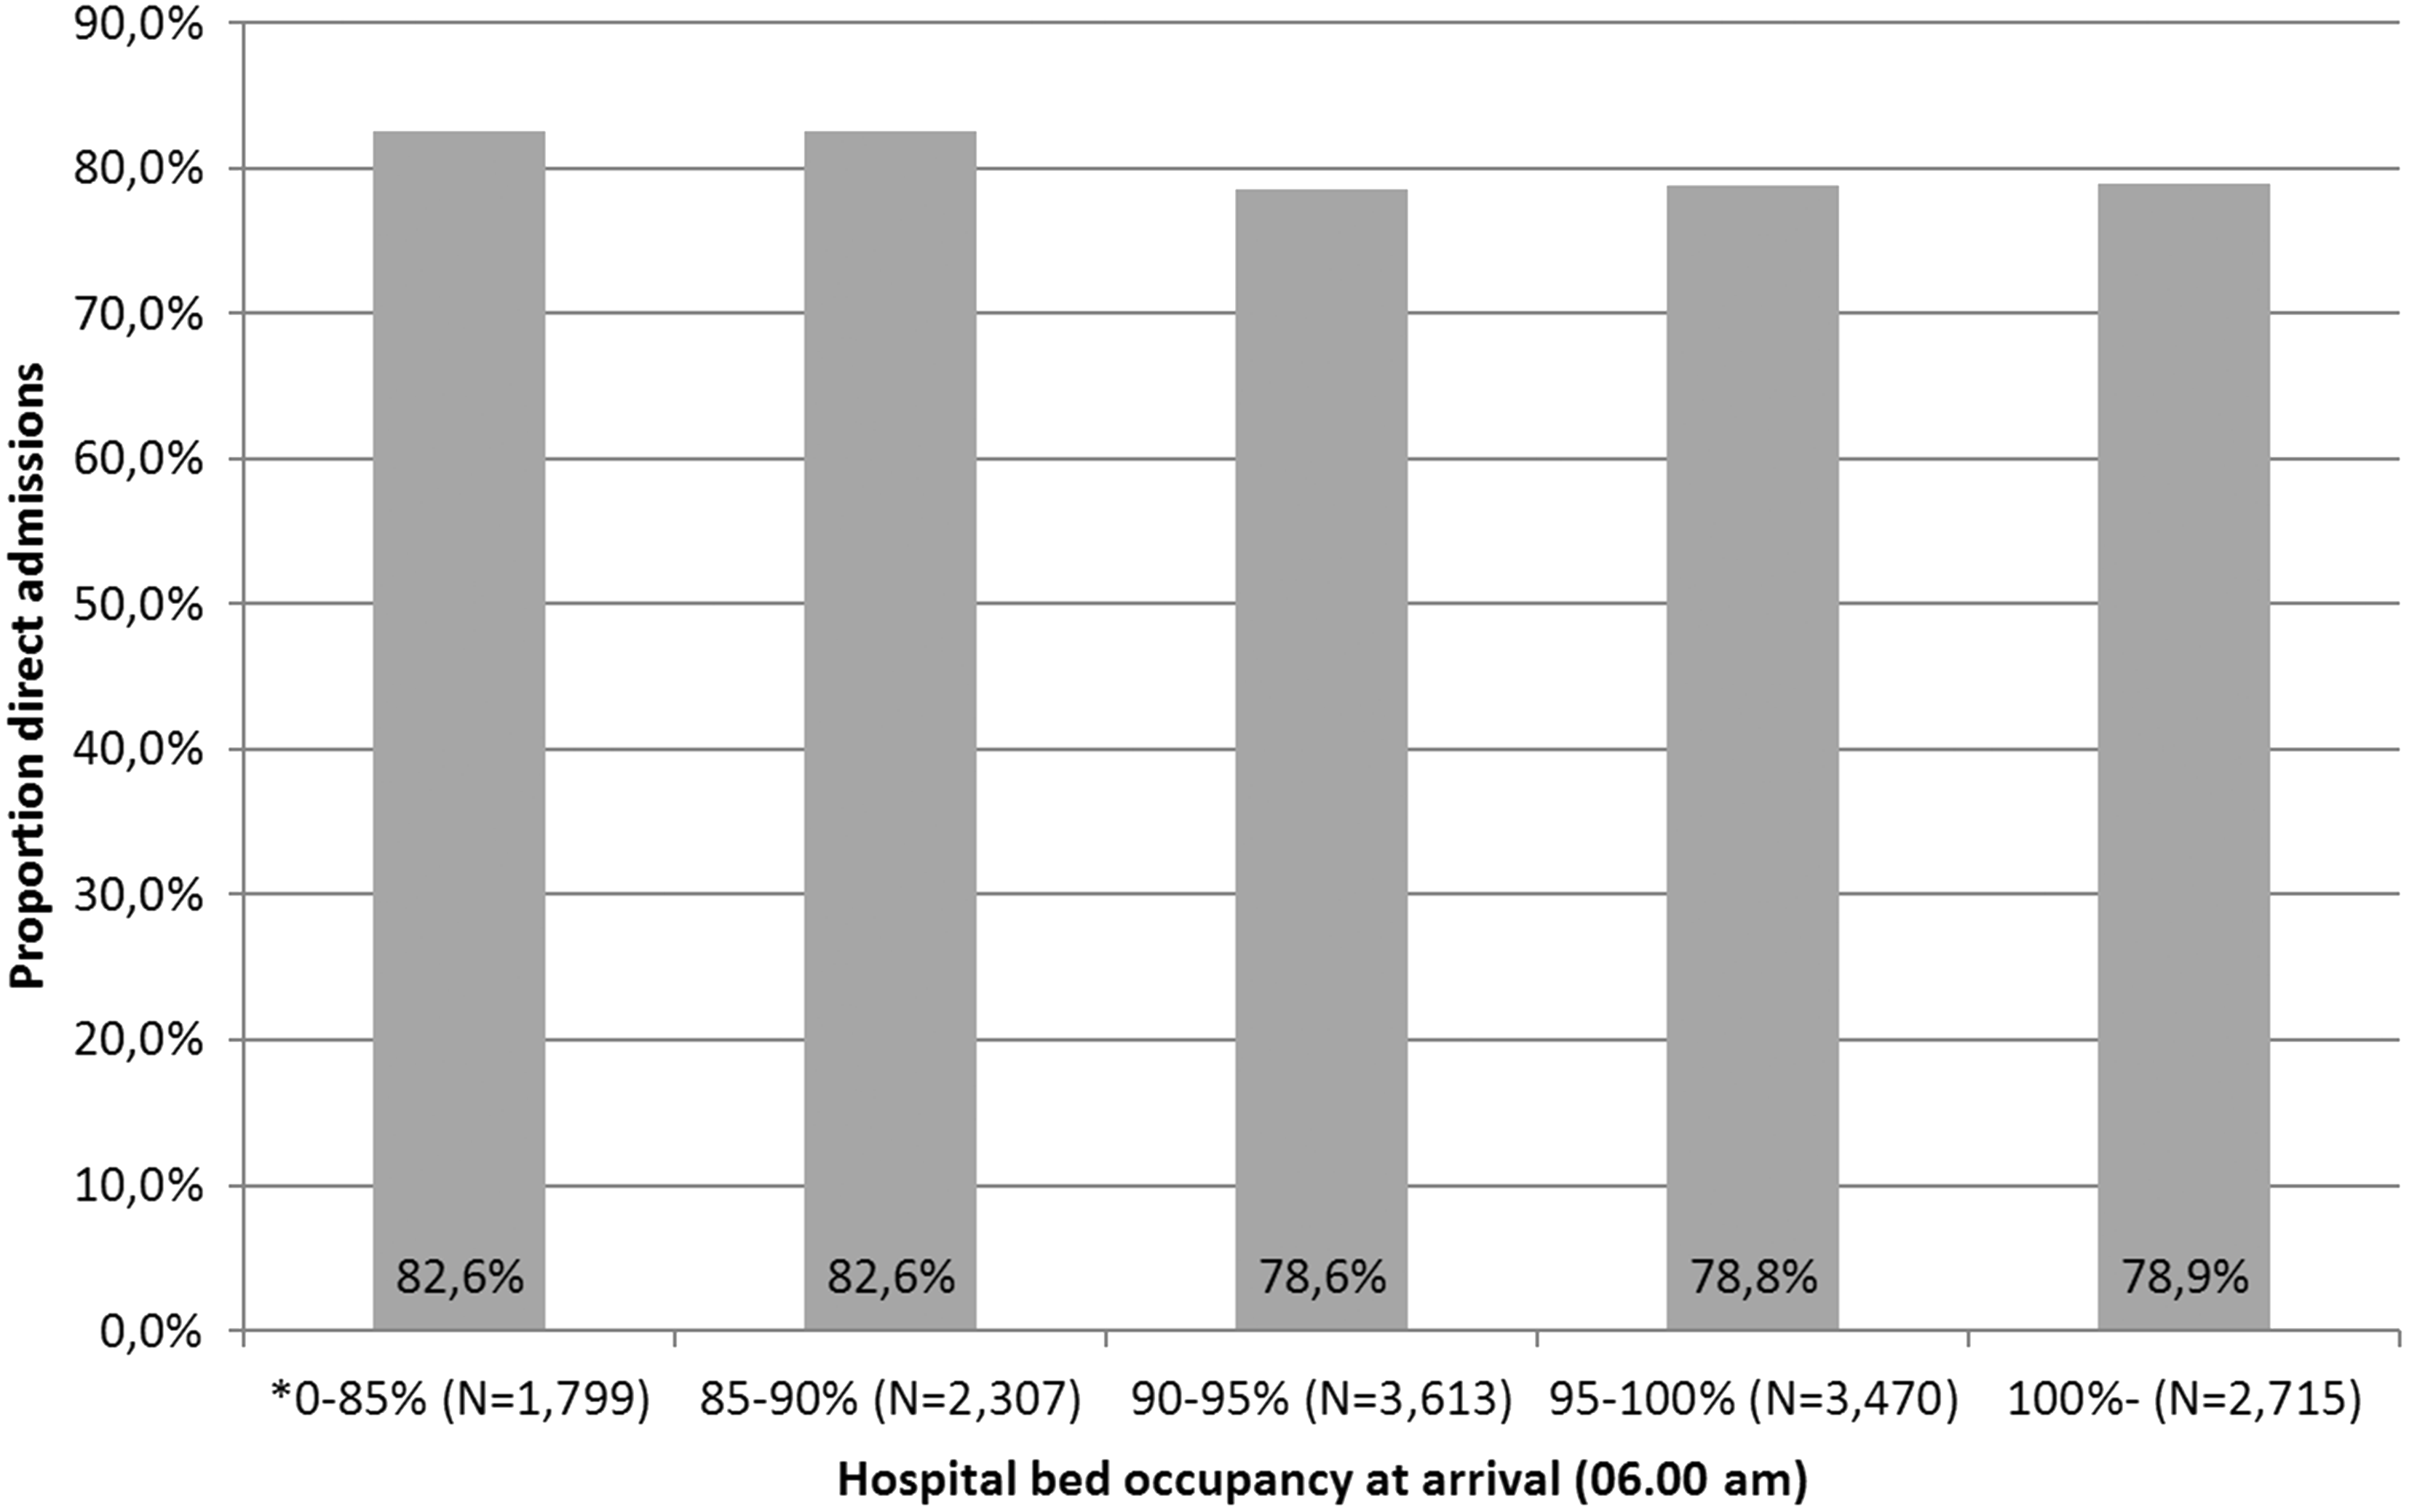
Hospital bed occupancy met the assumption of variable linearity and was included as a continuous variable. Age violated the assumption and was transformed to the ordinal scale (0–65, 65–75, 75–85 and 85 years.) The results of the multivariate model after adding all layers revealed that the odds for direct admission to a SU changes by a factor 0.985 (95% confidence interval (CI) = 0.978–0.992) with each percent increase in hospital bed occupancy. The association was significant and coherent across model layers. The results from the sensitivity analysis being fully comparable (odds ratio (OR) = 0.987, 95% CI = 0.980–0.994, layer 4) speaks against significant individual-level clustering. Please see Appendices 2 and 3 for a full account of the multivariable models and Figure 3 for a visual representation of the relationship.
The odds ratio of direct admission to a SU from the ED as a function of hospital bed occupancy (95% CI). Sensitivity analysis is included. Layer 4. *Reference level.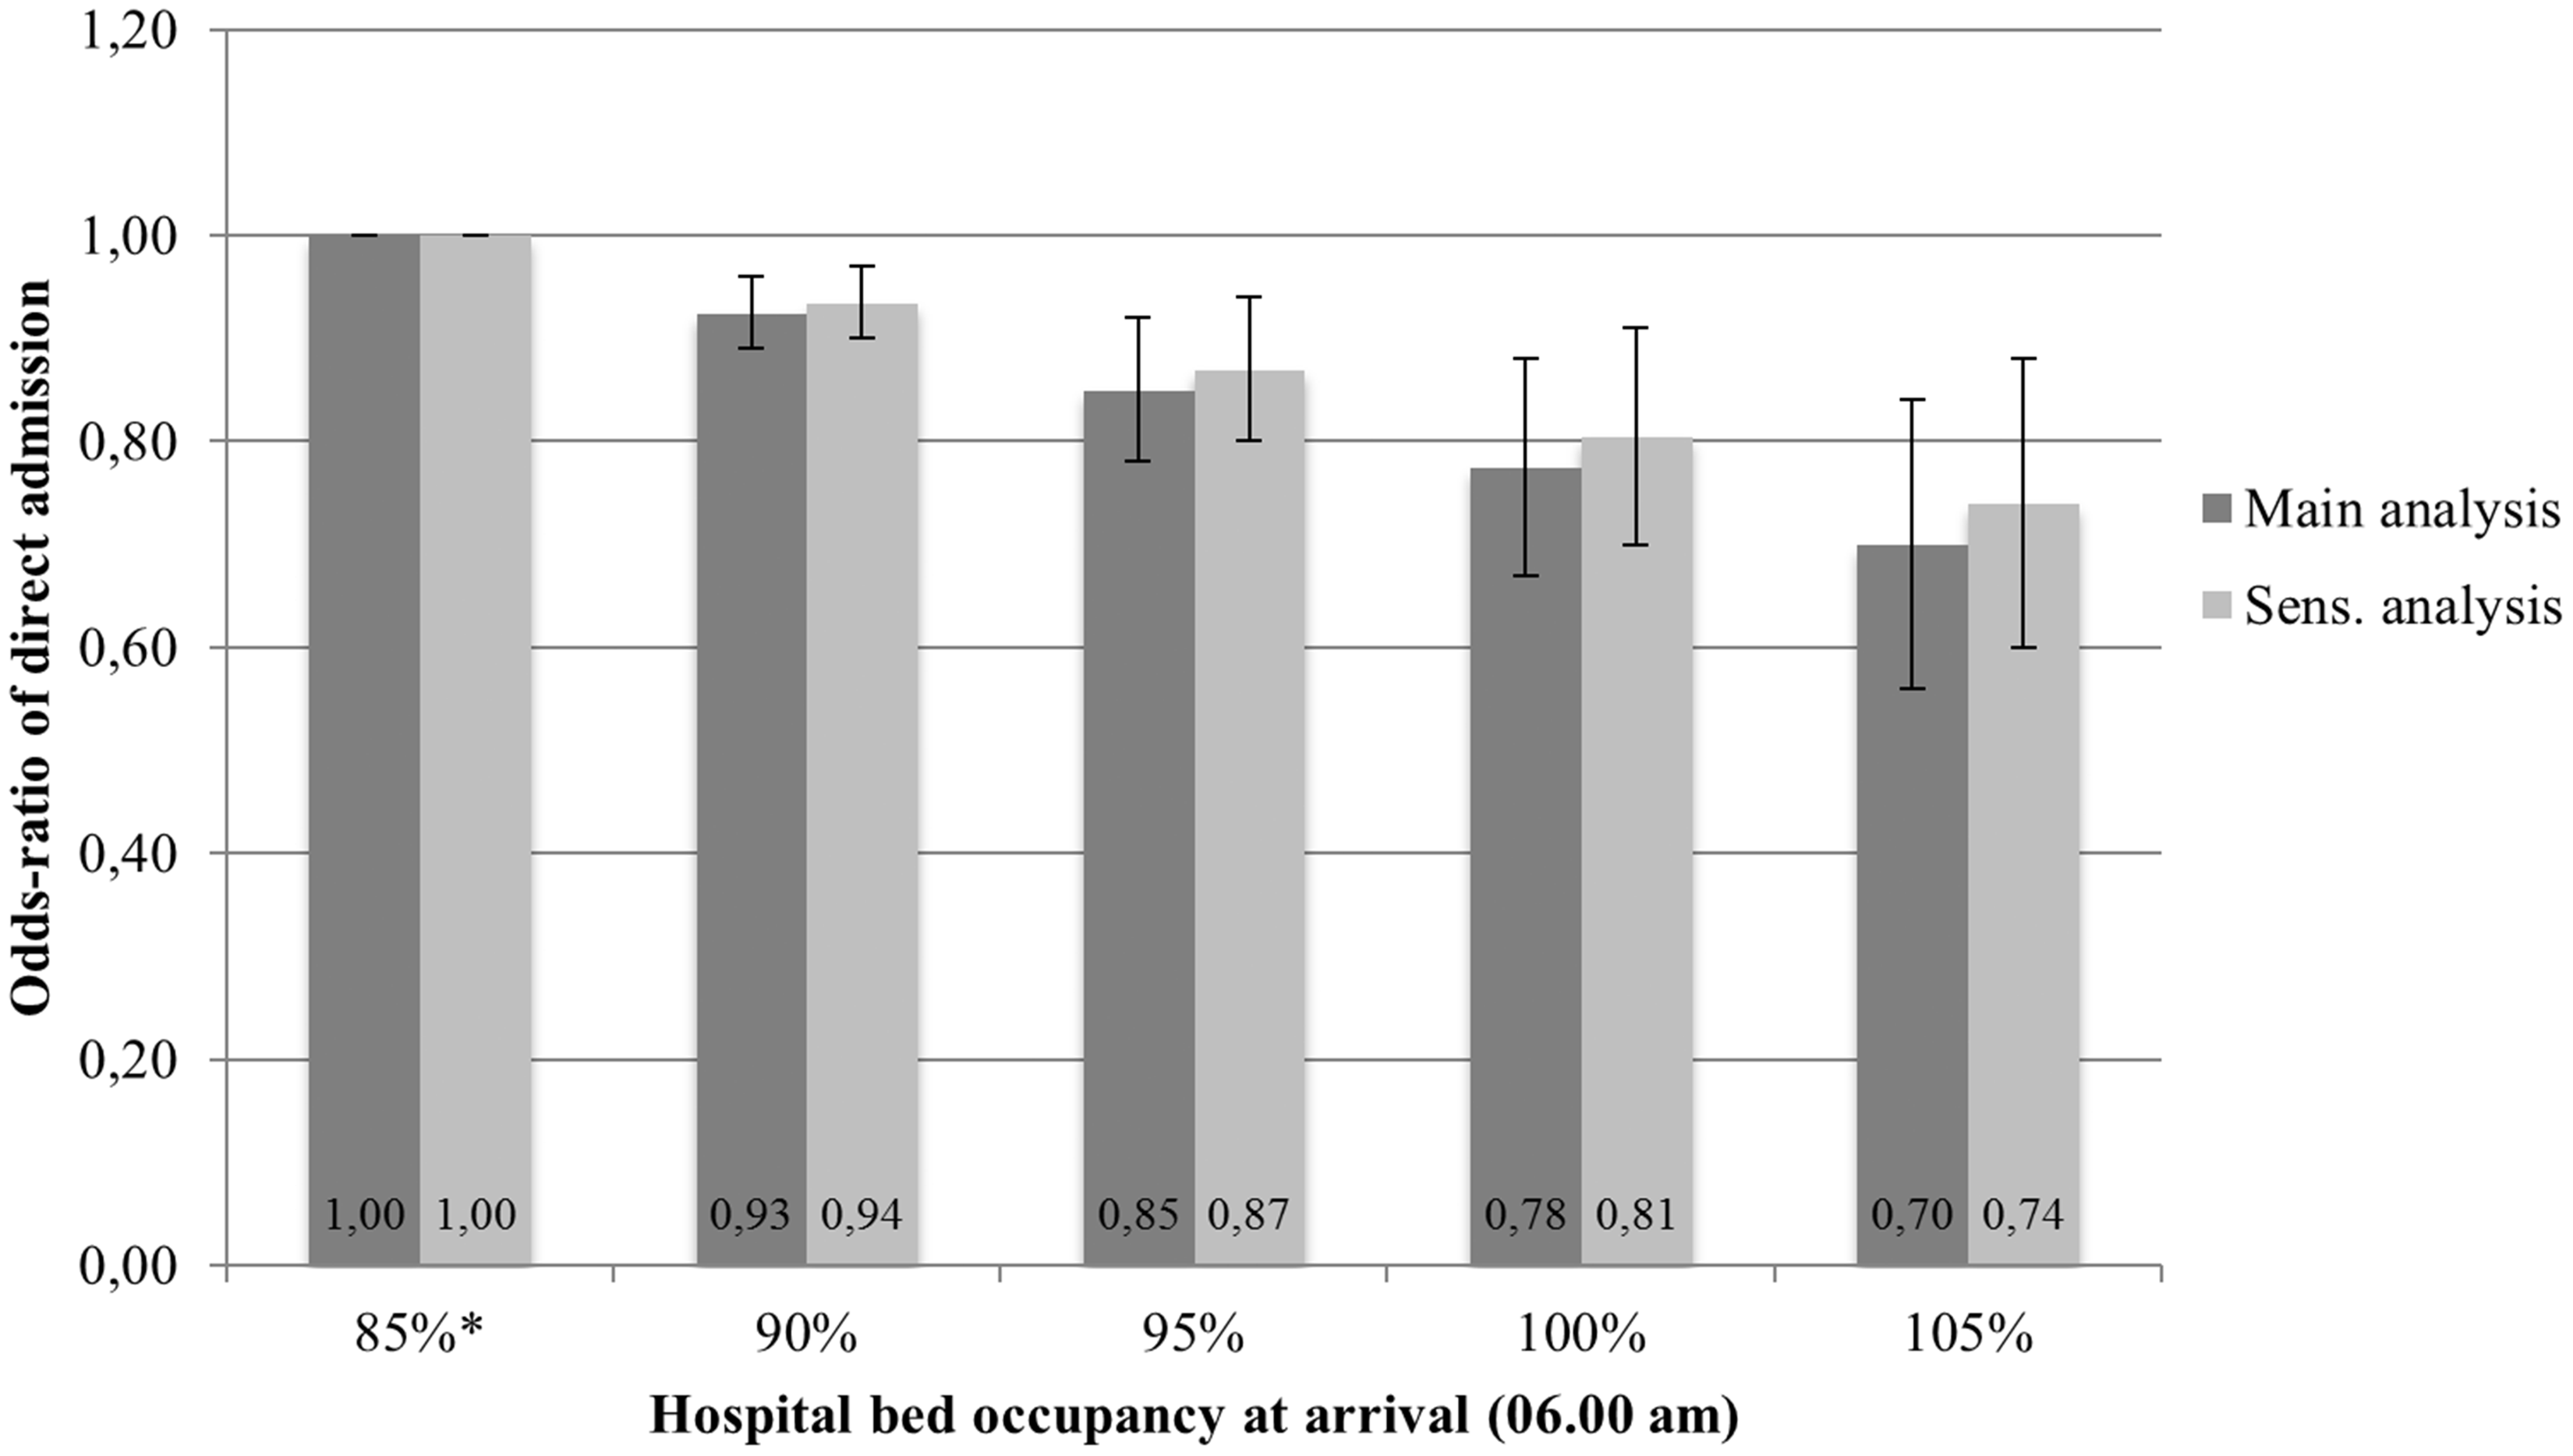
Inter-hospital analysis
An inter-hospital comparison was also performed to identify differences in performance across hospitals. Hospital S2 was used as reference due to its large number of patients, in combination with little missing data and a proportion of direct SU admissions close to the Riksstroke average. Please see Figure 4 for a visual representation of the main results and Appendices 2 and 3 for a full account of the multivariable models.
Comparison of OR for admission to a SU as first destination from the ED across the participating hospitals (95% CI). Main analysis. Layer 4. *Reference (OR = 1.0).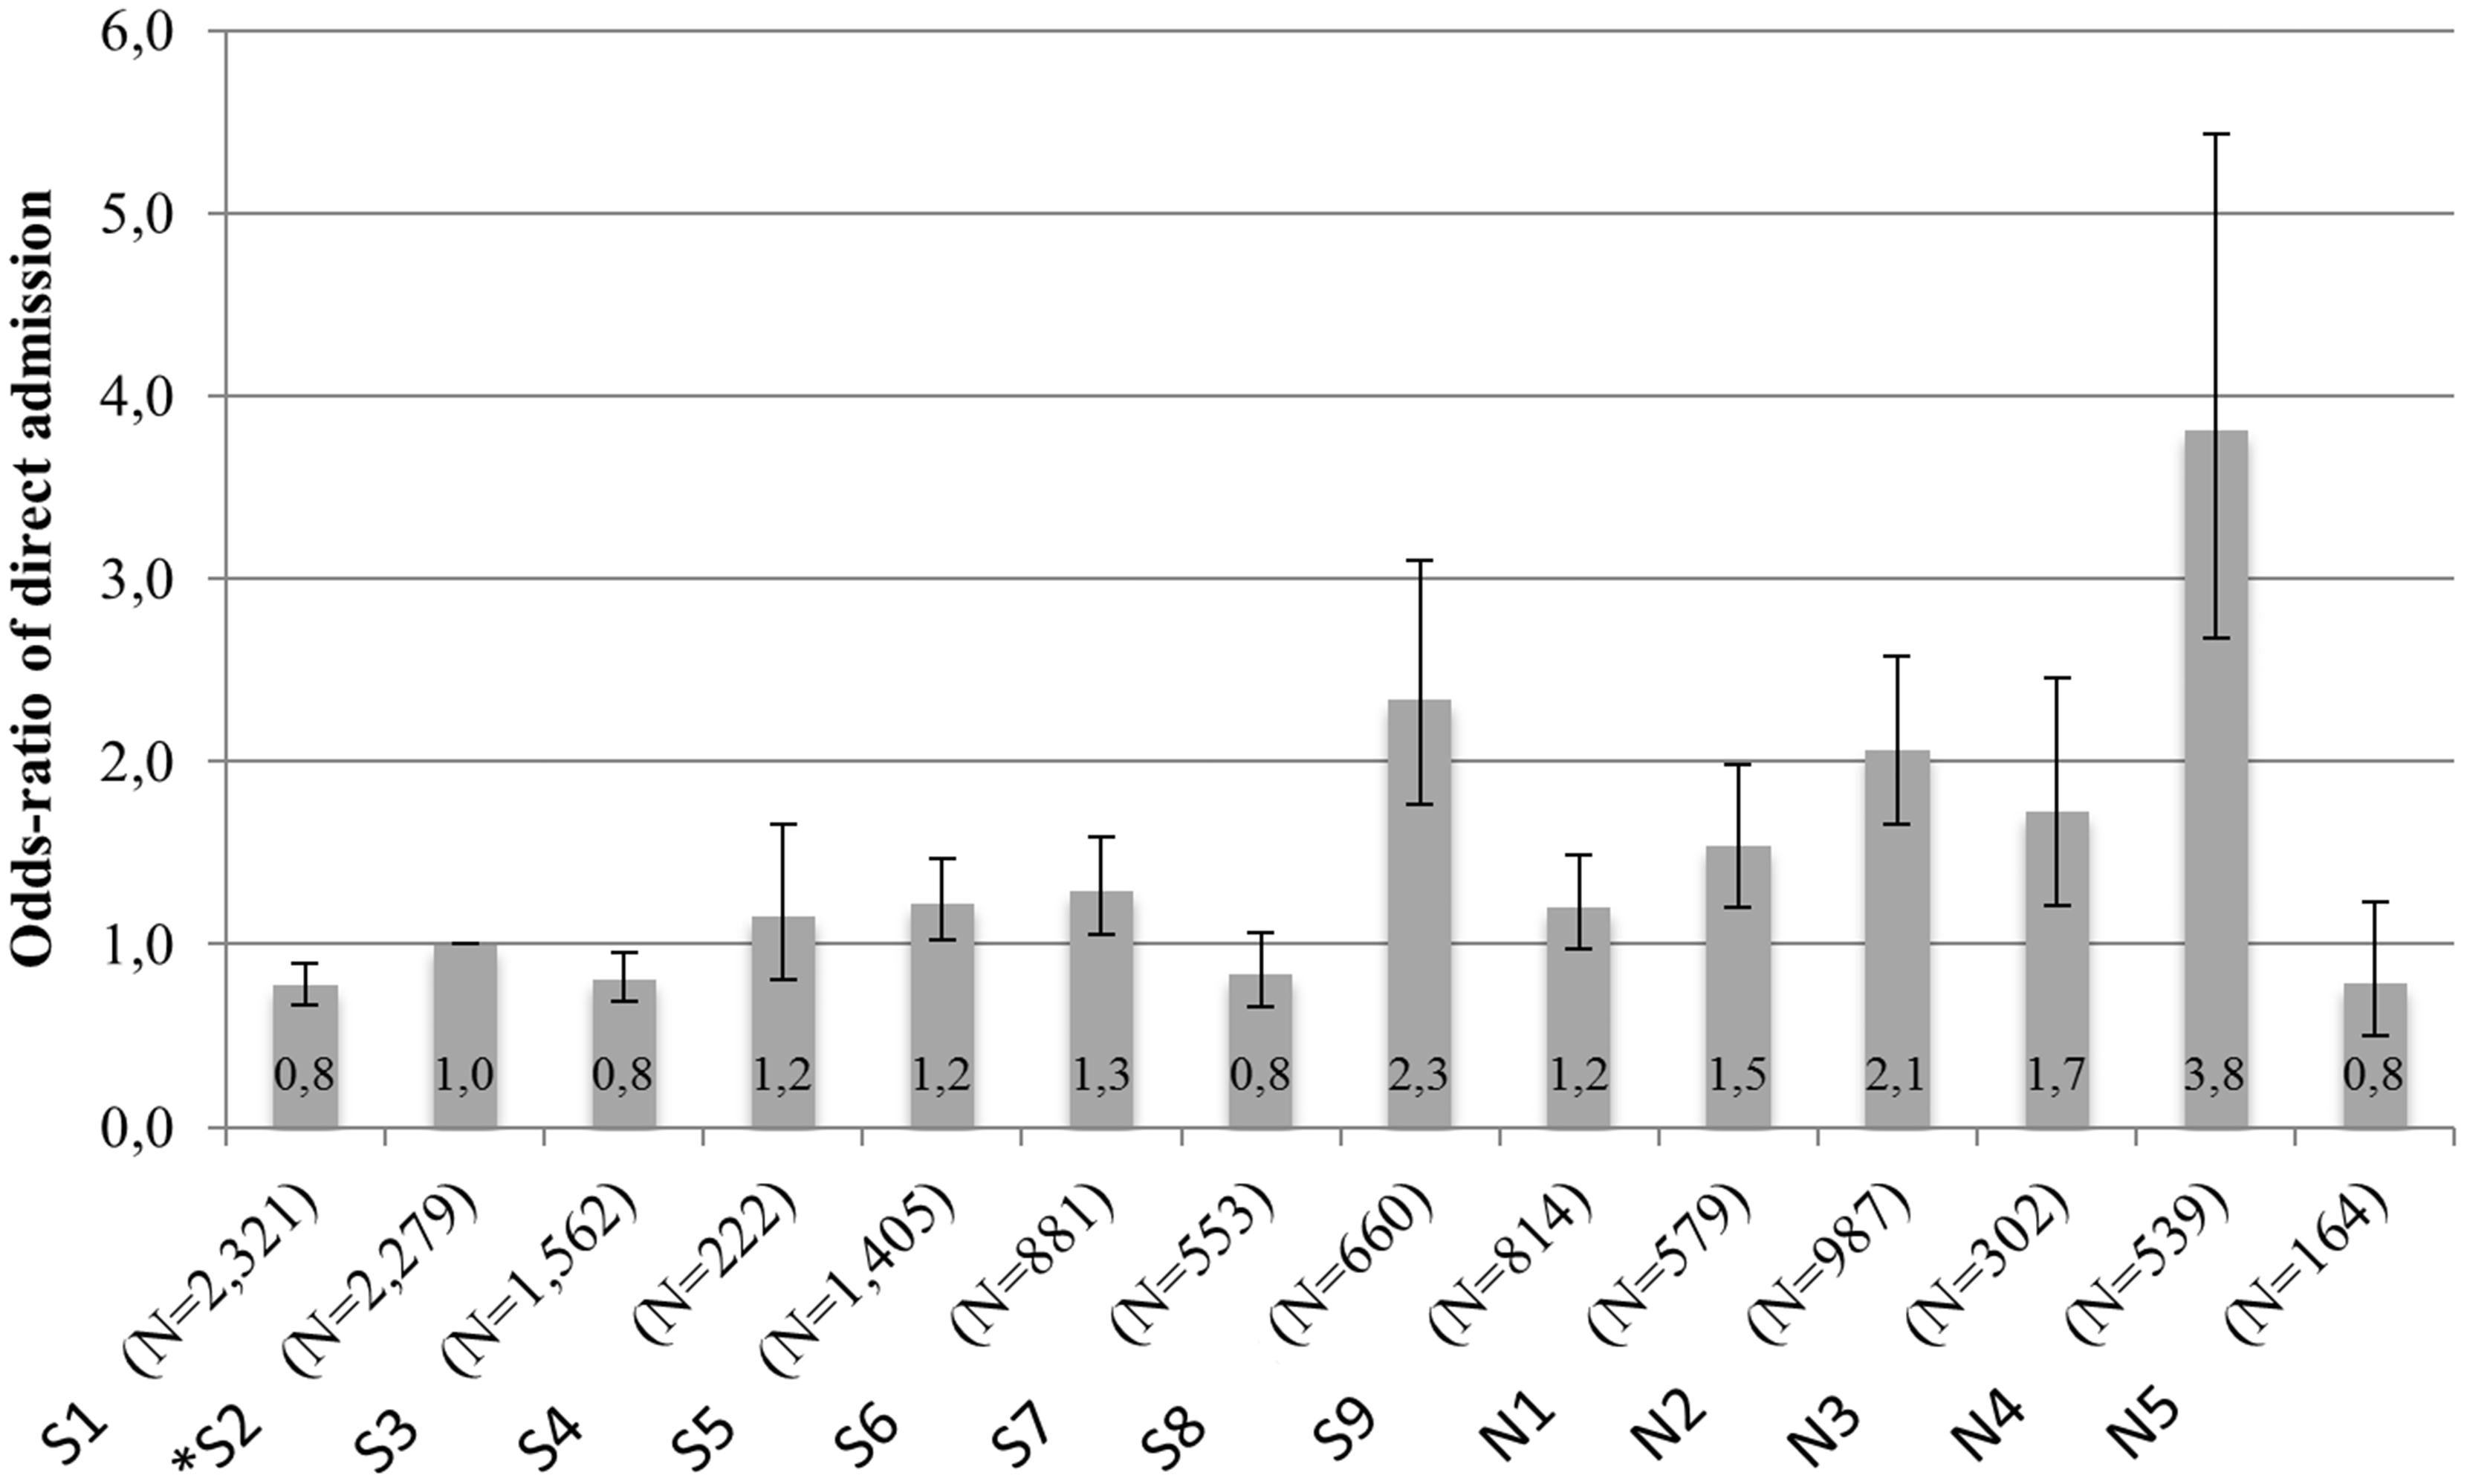
Discussion
Our study is the first to show a strong negative association between hospital bed occupancy (at the Internal Medicine, Intensive Care and Neurosurgery department) and the likelihood of acute stroke patients being admitted to a SU as the first destination from the ED. The robustness of the findings is supported by the coherence between crude and adjusted results, as well as between layers of the multivariable models and the sensitivity analysis. By revealing that hospital crowding is associated with denying a fragile group of patients evidence based care, our results reinforce the negative picture of a phenomenon that largely results from dysfunctional capacity planning and misinterpretation of basic queuing theory. As medicine still is organised around specialties and organ systems, we hope that these more specific results will help build awareness and make valuable additions to previous findings of a more general nature, such as premature hospital discharges, declining mental health in staff and delays in emergency care delivery.16–18,32–38
Profound variation in the likelihood of direct SU admission from the ED among the study sites (adjusted for bed occupancy), indicate that the capabilities of hospitals to handle bed crises differ. One hypothesis is that this stems from differences in local and regional stroke care traditions and in adherence to national guidelines. 39 A method that was strongly advocated by managers at the most successful hospital in our study (in terms of the study outcome), is to optimise SU availability by implementing a priority list, in which SU patients get a ‘ready to transfer’ notation if their medical condition allows. As perceived by managers and clinicians, the practice frees up space to incoming stroke patients that better need the SU resources. Although the SU bed availability (per capita) at the study sites was better than the Swedish average and subject to some variation, our adjustment for hospital bed occupancy in the analysis step makes such differences unlikely to explain the observed results. Rather, our findings suggest that local differences in bed management and attitudes are important drivers of the outcome. If detailed data on specific arrival and discharge patterns for the total case mix were available, a logical continuation of our work would be to deploy simulation methodology in pursuit of site-specific recommendations as to how beds could be allocated between stroke patients and other patients in a manner that is both efficient and safe. In order for such analysis to be representative, it also needs to consider variations in the availability of inpatient and outpatient rehabilitation services.
Strengths and limitations
The use of two geographically disparate regions and 14 different hospitals vouch for high external validity of the results. Another major strength is that the study covers an unselected population of stroke patients, including all hospitalised patients with acute stroke in both regions with only minor losses of coverage. It is worth to note, however, that the study population was defined in terms of stroke diagnosis, which poses some risk of under-reporting of cases, should misdiagnosis have taken place. The effect of such bias would be upward, causing the proportions of SU admissions in our study to be slightly too high. While the 4.9% missing cases could have influenced the results somewhat, this number is small and is not likely to exert any major influence even if cases were not missing completely at random (MCAR). Moreover, annual reviews and analyses performed by Riksstroke officials have given no indication of differential data losses. Apart from the prospective nature of data collection, the close monitoring of registry data quality is another major strength of our study. Current estimations indicate a nationwide coverage of 90.3%, while figures in Region Skåne and Norrbotten County are 87.4% and 85.5% respectively.4,40 If over-diagnosis is considered, registry representatives claim that the overall coverage may be as high as 96%. 4 In comparison to most other registries and questionnaires of similar scope and extent, these levels are more than adequate.
Conclusion
We found that hospital crowding is associated with a reduced quality of care in acute stroke, portrayed by a decreased likelihood of patients being directly admitted to a SU from the ED. We also found that the magnitude of the association between hospital crowding and SU admission varied considerably across the 14 study sites.
Footnotes
Declaration of Conflicting Interests
The author(s) declared no potential conflicts of interest with respect to the research, authorship, and/or publication of this article.
Funding
The author(s) disclosed receipt of the following financial support for the research, authorship, and/or publication of this article: David Darehed was supported by Norrbotten County Council and was also granted a scholarship from the Swedish Association of Local Authorities and Regions. Mathias Blom was supported by Norrbotten County Council and the Tegger foundation.
Ethical approval
The study was approved by the regional ethics review board in Umeå, Sweden (dnr 2015-267-32M).
Informed consent
Not applicable.
Guarantors
DD, BN and MB guarantee the overall contents of the article.
Contributorship
DD, MB and BN conceived and designed the study. DD, MB, BN, BS and KZ amended the study. DD and MB coordinated the study throughout. DD, BN, BS, KZ and MB discussed the study’s ethics. KZ secured ethical approval from the ethics review board in Umeå. DD and MB gathered the data. Data from Riksstroke were provided from Maria Hals Berglund at Riksstroke. MB cleaned and analysed the data. DD wrote the first draft of the manuscript with MB. All authors contributed to subsequent and final drafts.
Acknowledgements
Thanks to the Riksstroke collaboration and all the participating hospitals; the Norrbotten County Council and Region Skåne; Maria Hals Berglund at Riksstroke, for data extraction from Riksstroke; Monica Kokkonen for data extraction from Datalagret NLL; Lars Gustafsson, Helsingborg General Hospital Informatics Unit, for making data extracts from PASIS; Robert Lundqvist, FOI NLL, for statistical advice.
Provenance
Markku Kaste acted as Editor-in-Chief for this manuscript. Bo Norrving (Editor-in-Chief) was not involved in the peer review process.
References
Supplementary Material
Please find the following supplemental material available below.
For Open Access articles published under a Creative Commons License, all supplemental material carries the same license as the article it is associated with.
For non-Open Access articles published, all supplemental material carries a non-exclusive license, and permission requests for re-use of supplemental material or any part of supplemental material shall be sent directly to the copyright owner as specified in the copyright notice associated with the article.