
Abstract
Background and Aims
The fastest growing group of students with disabilities are those with Autism Spectrum Disorder (ASD). States annually report on post-high school outcomes (PSO) of exited students. This study sought to fill two gaps in the literature related to PSO for exited high-school students with ASD and the use of state data and predictive modeling.
Methods
Data from two states were analyzed using two predictive analytics (PA) methods: multilevel logistic regression and machine learning. The receiver operating characteristic curve (ROC) analysis was used to assess predictive performance.
Results
Data analyses produced two results. One, the strongest predictor of PSO for exited students with ASD was graduating from high school. Two, machine learning performed better than multilevel logistic regression in predicting PSO engagement across the two states.
Conclusion
This study contributed two new and important findings to the literature: (a) PA models should be applied to state PSO data because they produce useful information, and (b) PA models are accurate and reliable over time.
Implications
These findings can be used to support state and local educators to make decisions about policies, programs, and practices for exited high school students with ASD, to help them successfully transition to adult life.
Keywords
Introduction
In the United States (U.S.), research in special education has historically had an in-school focus, in areas such as reading and classroom behavior. In the last decade there has been greater emphasis in a different research area, exited high-school students with disabilities (SWD) and their post-school outcomes (PSO) (see Lipscomb et al., 2017). Meanwhile, technological advances have also expanded the ways large administrative data, such as PSO, can be analyzed to support decision making (see Larkan-Skinner & Shedd, 2021) through predictive modeling approaches (e.g., Nassif et al., 2016). Using these data and analytic tools is necessary for state and local educators (Mandinach, 2012), especially the state-level PSO of those with autism spectrum disorder (ASD), who continue to face significant barriers in successfully transitioning from high school to post-high school life (Liu et al., 2018). This was the focus of our study.
Literature review
Post school outcomes
Every year in the U.S., hundreds of thousands of SWD who have received special-education services under the Individuals with Disabilities Education Act (IDEA 2004, P.L. 108-446) graduate from high school. In the most recent pre-pandemic school year (2018–19), nearly 26,000 students with ASD who had received special-education services graduated from high school (National Center for Education Statistics, 2021). Over the last two decades, research into what happens to these students after exiting high school – their PSO – has gained more attention, as they continue to experience more barriers and worse outcomes (e.g., in college, employment) than their peers without disabilities (Newman et al., 2011). This research has been concentrated in four areas: reviews of in-school/transition predictors of PSO, analyses of PSO predictors using nationally-representative data, state/local level PSO studies, and emerging research into science, technology, engineering, and mathematics (STEM) and PSO.
As a distinct area of research in the special-education literature, PSO has notably advanced in the last decade since the seminal work of Test et al. (2009), which identified 16 in-school predictors of PSO for exited high school SWD. Haber et al. (2016) advanced that work, conducting a meta-analysis on these predictors, and found some difference in employment, education, and independent living outcomes based on different in-school predictors and demographic characteristics. Burnes et al. (2018) found that high-school SWD being involved in their IEP, interacting with others, and receiving support from their community predict PSO. Sprunger et al. (2018) recommended that in order to improve PSO, special-education teachers should incorporate both academic and work components into high-school transition plans and receive professional development focused on transition programming.
Much of the peer-reviewed PSO research studies in the literature have utilized nationally-representative data from the National Longitudinal Transition Study (i.e., NLTS-1, NLTS-2, NLTS-2012), which have been conducted since the 1990s. These studies have consistently found that gender and high-school graduation were significant predictors of PSO for SWD (e.g., Aud et al., 2010). Carter et al. (2012) reported that among those with severe disabilities, having paid employment experience during high school predicted post-high school employment, as were social skills and parent expectations.
National studies of PSO have also focused on the differences between SWD and their peers without disabilities, as well as within and across disability groups. Young adults with ASD have had lower rates of employment and higher-education enrollment after exiting high school compared to their peers without disabilities (Liu et al., 2018). Roux et al. (2015) reported that young adults with ASD had lower employment rates (58%) than their peers with specific learning disabilities (95%) and speech/language impairments (91%). The authors also reported that 66% of young adults with ASD were not employed or enrolled in further education two years after exiting from high school; 42% were not employed or enrolled in further education four years after high school, and 23% were not employed or enrolled in further education six years after high school. In a systematic review of PSO research regarding students with ASD since the year 2000, Kirby et al. (2016) reported that only a dozen peer-reviewed studies met their review inclusion criteria, out of which two were identified as using rigorous methodology and identified individual functioning as the only predictor of PSO.
Compared to the PSO studies in the peer-reviewed research literature that have utilized national data, there are far fewer PSO studies focused on state or local levels. In a Wisconsin pilot study, interventions involving school-led coaching led to increased work experiences for students with intellectual and developmental disabilities in high school (IDD), which predicted post-high school paid employment (Molfenter et al., 2017). Christensen et al. (2015) reported that 84% of young adults with IDD in Project SEARCH in Monroe County, New York, became employed over a four-year period.
The newest and potentially most important development in the PSO literature has been research regarding STEM for high-school SWD and their PSO in STEM higher education and employment/career (see Hwang & Taylor, 2016). King et al. (2016) found very few evidence-based interventions in math instruction for high-school students with ASD. Gregg et al. (2017) studied the effects of virtual mentoring, using devices and platforms (email, smartphones, and social media) on STEM persistence, which has been found as an important factor in STEM success. They found significant improvements in student perceptions of self-advocacy and self-determination, although these varied based on student disability type, gender, and ethnicity. Others have reported that career-technical education and STEM enrichment efforts (e.g., summer, after school programs) may lead to positive PSO in STEM (Falkenheim et al., 2017; Plasman & Gottfried, 2018), although disparities in STEM access and outcomes between students with and without disabilities remain a significant challenge (National Science Foundation, 2021). The one area in the PSO literature that continues to lack peer-reviewed research is the application of predictive modeling on state-level PSO data. This research is needed for decision-making by educators and administrators at state and local levels (e.g., schools, districts), where most U.S. schools in K-12 grades are managed and operated.
Predictive analytics
The latest technical and technological advancement in data and analytics is seen in the emergence of the data-science field. At the center of this field is the application of statistics and algorithms to historical data at an administrative level in order to produce or derive usable real-time information (i.e., ‘modeling’). This approach is commonly known as predictive analytics (PA), which has become more widely used as continued expansions in computing power and data storage enable most home computers to run complex algorithms (Zhang, 2020). PA is generally described as using “statistical or machine learning methods to make predictions about future or unknown outcomes” (Abbasi et al., 2015, p.35). One of those statistical methods is logistic regression, which is the analysis of the probability of a categorical outcome given a set of predictors. Machine learning is generally described as a set of algorithms that use statistics and probabilities in a process of ‘learning’ from data to find patterns and relationships among variables (Meserole, 2018). One well-known and often utilized machine learning algorithm in research is Random Forest (e.g., Schonlau & Zou, 2020).
Much of the research involving the use of PA methods occurs in the medical and health science fields. These studies are primarily focused on projecting disease progression and patients’ risk of mortality (e.g., Desai et al., 2020). Studies applying PA in education research have focused on the risk of students falling behind academically or dropping out of college (e.g., Herodotou et al., 2019; Wagner & Longanacker, 2016) and K-12 schools (e.g., Porter & Balu, 2016). These PA models are sometimes referred to as ‘early warning systems’ (see Bowers & Zhou, 2019). None of these studies, however, focused on SWD. Studies applying PA to data on individuals with disabilities have focused on the assessment or diagnosis of an individual's disability condition, such as autism (e.g., Maenner et al., 2016), dyslexia (e.g., Rello et al., 2020), or their comorbidity. Currently, there are no studies in the literature applying PA methods – both statistical and machine learning methods – to PSO and assessing their predictive performance.
The current study
This study sought to fill two gaps in the PSO research literature. One, educators at the state and local levels need to know whether the predictors of PSO identified through previous studies are also observed when analyzing state-level PSO data. While the studies in the literature have utilized nationally-representative data, local educators and state administrators may instead need real-time and or annual data of their state's students with ASD and to account for school and district contexts. Two, while studies in the literature have identified individual variables with statistically significant associations to outcomes, they are missing key aspects of PA – utilizing machine learning and assessing predictive performance. In order for local educators and state administrators to use reliably use PA, they need to know how accurately these models identify their state's exited high-school students with ASD – those who would and would not become engaged in PSO. Filling these two gaps would be critical for states’ PSO data utilization and effective predictive-model development to support policies, programs, and practices.
Method
This study was framed around two research questions: (1) Which predictors had the strongest significant effects on PSO engagement for young adults with ASD across states? (2) How did the different PA models of PSO engagement perform across states?
Data collection
This study involved statistical analyses of de-identified state administrative PSO data of exited high-school students with ASD in the U.S.. Several states were contacted, and two states responded, one in the northwest (NW) region and one in the southwest region of the country. The states each sent two years of de-identified PSO data, excluding certain information such as student ages, that they deemed as potentially personally-identifiable characteristics. Both states had used a statewide census in collecting their annual PSO data. The NW state's data included 2017 and 2018 exit years, and the data were collected one year later in 2018 and 2019. Its statewide census response rates were 76% and 79%, respectively. The SW state's data included 2014 and 2015 exit years, and the data were collected in 2015 and 2016. Its statewide census response rates were 67% and 75%, respectively. These response rates are higher than what is typically reported for this population and method of data collection (see Dillman et al., 2014).
Defining variables
Both states’ data included five predictors: race/ethnicity, gender, exit status, classroom placement, and geographic location. Research has indicated that, to varying degrees, all of these variables predict PSO of students with disabilities (e.g., Eaves et al., 2012). Gender was coded for exited female (coded 0 as comparator group) and male students (coded 1 as reference group) with ASD. Race/ethnicity was coded for exited students of color and exited white/Caucasian students (0, 1). Exit status was coded for students who had not graduated and had graduated from high school (0, 1). The classroom-placement predictor was coded for exited students with ASD who had spent less than 80% of their instructional days in general education classrooms and 80% or more of their instructional days in general education classrooms during high school (0, 1). The 80% threshold is described in IDEA Indicator 5 as a way to ascertain how much time SWD had spent in general education classrooms and to assess these students’ ‘least restrictive environment’. The only school-level predictor was the geographic region in which the students’ high school was located. This predictor is defined by the National Center for Education Statistics (NCES) comprising four specific categories: city, rural, suburb, and town.
Both states’ data included one outcome variables – PSO engagement. Since 2008, states have been required by the U.S. Department of Education to collect data each year on the PSO of SWD who had an individualized educational program (IEP) at the time they exited high school. States collect these data to tally the number of their exited SWD who, during the first year after exit, had been: (a) enrolled in higher education, (b) competitively employed, (c) enrolled in some other post-secondary education or training program, or (d) employed in some other employment (20 U.S.C. 1416[a][3][B]). Exited SWD are counted as ‘engaged’ in PSO if they meet any of the four criteria (a to d); otherwise they are counted as ‘not engaged’. States are required to collect these data using statewide census or representative sampling. In this study, PSO engagement was a binary variable, coded as 1 if the exited student was engaged in PSO (i.e., the reference group), and coded as 0 (the comparator group) if the exited SWD was not engaged in PSO.
Data analyses
All data were screened, and no missing values or outliers were found. Data analyses were conducted using Stata 16.1 statistics software (StataCorp, 2020). In the first step of the analyses, a descriptive summary of the data was produced for each state. Next, the data were modeled using two PA methods: multilevel logistic regression and machine learning with the Random Forest algorithm. The receiver operating characteristic curve (ROC) analysis was used to assess these two PA methods for their model predictive performances. The two PA methods and ROC analysis are described in the following paragraphs in further detail.
Multilevel logistic regression
The PSO data were ‘nested’; they occurred in hierarchies or levels – students (level-1) within schools (level-2) within districts (level-3). Thus, the data were modeled in a way that properly accounted for the fixed and random effects across the levels (see Hox, 2002). A three-level logistic regression was specified (see Austin & Merlo, 2017) with a binary outcome variable and fixed effects of the predictors, and random effects for school and district outcomes (i.e., intercepts), which represent the log odds of PSO engagement for schools and districts.
In the multilevel logistic regression modeling, race/ethnicity was dichotomized (i.e., students of color, white/Caucasian students). Multilevel analysis require sufficient numbers of subjects in each group (e.g., individual, school, and district) of a categorical predictor. Most schools and districts in the two states did not have such numbers across all seven race/ethnicity categories to produce an admissible model solution (see Kline, 2005). It was also dichotomized to ensure parsimony in testing and reduce problems in parameter identifiability (see Gelman & Hill, 2009). Given the complexity of logistic models where the outcome represents probability, a binary (0,1) predictor would also aid interpretations of results (see DeCoster et al., 2009).
In a logistic regression, the main outcome of interest is the odds ratio, which indicates the magnitude of a predictor's unique effect on the outcome. It is interpreted as how much more likely the desired outcome (e.g., engaged in PSO) is for one predictor group (e.g., female) compared to another (e.g., male) for those with the same random effects and after controlling for the effects of other tested predictors (Larsen et al., 2000). The decision rule for judging statistical significance in model testing of multilevel logistic regression was set a priori at p < .05.
Machine learning
Of the several different machine learning algorithms (see Brownlee, 2019), Random Forest is ideally designed for modeling the effects of predictors on a binary outcome (see Breiman, 2001) and is based on an ensemble decision-tree approach to classification and prediction (Cutler et al., 2012). The algorithm randomly separates data into ‘training’ and ‘validation’ samples, refining predictive modeling on the former and validating on the latter. The expectation is for performance to improve through this process (i.e., the model ‘learns’), and possibly improves over non-machine learning methods (e.g., Couronné et al., 2018). There are two main outcomes of interest in Random Forest models. The first outcome is the “out of bag” (OOB) error. The ‘OOB’ is abbreviated from ‘bootstrap-aggregating’ (i.e., b-ag), a process in which thousands of samples are created to ‘train’ the predictive algorithm. The OOB error indicates the degree of error in modeling the training sample. The second outcome is the final error, which indicates the degree of predictive error in the validation sample, with lower values indicating less error and greater ‘learning’.
ROC analysis
The receiver operating characteristic curve (ROC) analysis was used to assess and compare the predictive performances of the multilevel logistic regression and machine learning models for PSO engagement of exited high-school students with ASD. The ROC analysis includes two important indices, Sensitivity and Specificity (Metz, 1978). The former, also known as the ‘true positive rate’, refers to the proportion of people predicted to experience the desired outcome (e.g., engaged in PSO), out of the total number who actually experienced that outcome. The latter, also known as the ‘true negative rate’, refers to the proportion of people who were predicted to not experience the desired outcome (e.g., not engaged in PSO), out of the total number who actually did not experience that outcome.
Sensitivity and Specificity also form integral parts of the “area under the curve” or AUC (i.e., area under the ROC), and indicates model predictive performance (see Hosmer et al., 2013; Mason & Graham, 2002). Combining both Sensitivity and Specificity, AUC values range between 0 to 1, with the former indicating 0% correct prediction and the latter indicating 100% correct prediction. While the importance of the AUC value varies by field (e.g., medicine, engineering), an AUC value of “0.7 to 0.8 is considered acceptable, 0.8 to 0.9 is considered excellent, and more than 0.9 is considered outstanding” (Mandrekar, 2010, p.1316).
Results
The statistical analyses of PSO data from the two states first produced a descriptive summary of the exited students with ASD, and then the answers to the two research questions involving the application of the two different PA methods to that data.
Descriptive summary
Referring to Table 1, for the NW state the total numbers of exited high-school students with ASD were N = 393 in 2017 and N = 387 in 2018. For the SW state, the total numbers of exiters with ASD were N = 337 in 2014 and N = 455 in 2015. Across both states most of the exiters were male, 83.72% to 87.53%. This is similar to the reported statistics on the gender of students with ASD (see Maenner et al., 2020; National Center for Education Statistics, 2021). In terms of race/ethnicity, a majority of the exiters in both states were white/Caucasian (51.13% to 79.64%), though the SW state's exiters were more diverse. The percentages of exiters of color from the SW state were 36.80% in 2014 and 48.87% in 2015, whereas the percentages of exiters of color with ASD from the NW state were 24.81% in 2017 and 20.36% in 2018.
Characteristics (%) of students with a specific learning disability by state and exit year.
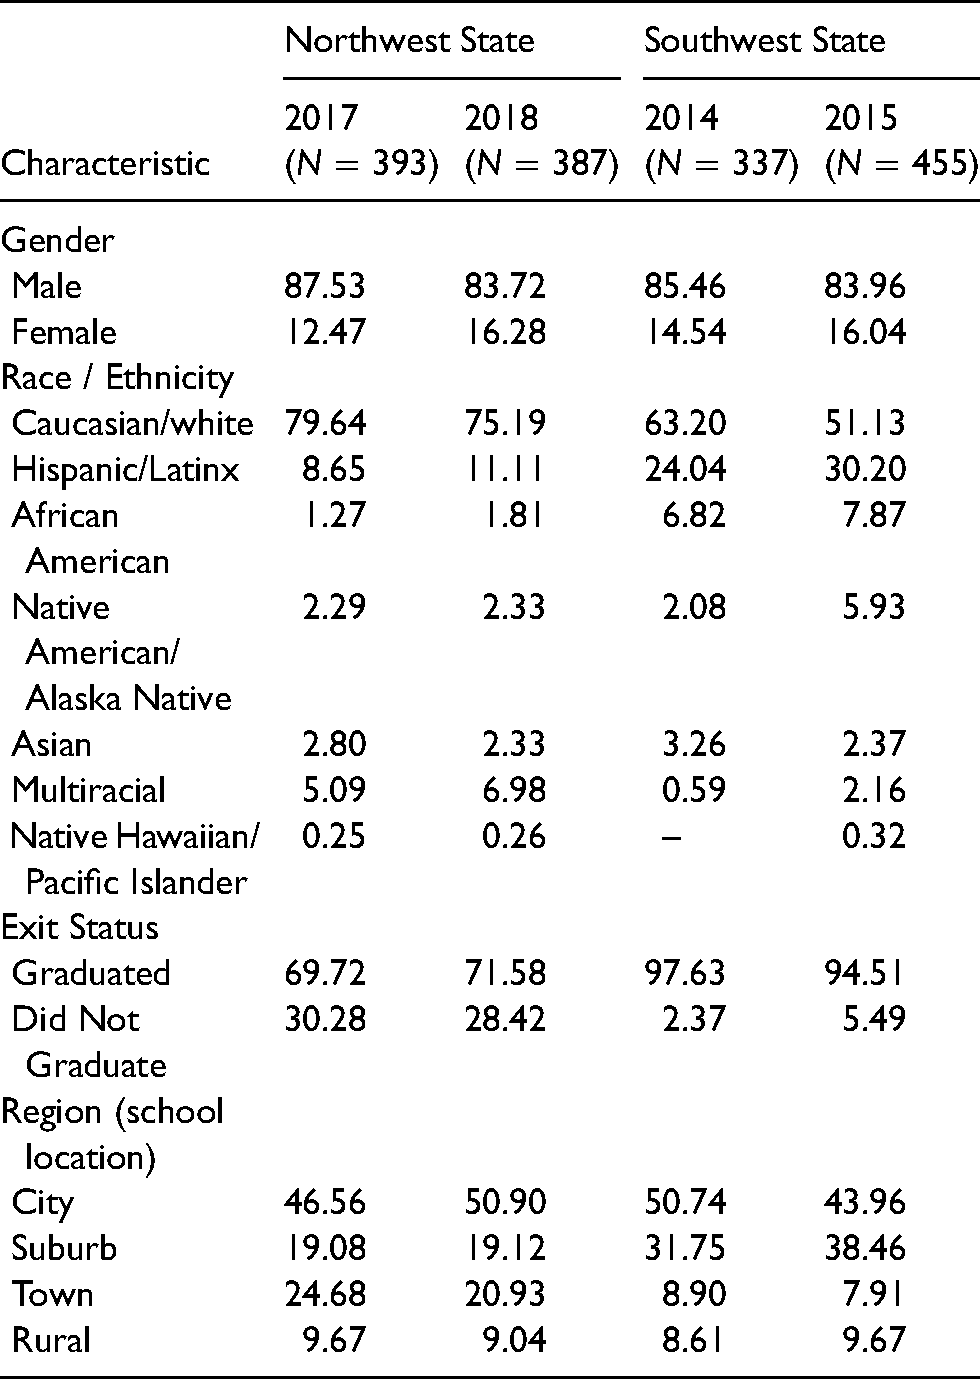
Across both states, most of the exited students with ASD had graduated from high school, 69.72% to 97.63%. There was, however, a notable difference between the two states. For the SW state, the percentages of exiters who had graduated from high school were 97.63% in 2014 and 94.51% in 2015. For the NW states, the percentages of exiters who had graduated from high school were lower, 69.72% in 2017 and 71.58% in 2018.
Across both states, exited students with ASD had attended high schools in the four different regions (city, rural, suburban, town). For the SW state in 2014, 50.74% of exiters had attended high schools located in city regions and 49.26% had attended high schools in the other three regions. In 2015, however, 43.96% of exiters had attended high schools in city regions and 56.04% had attended high schools in the other three regions. The findings were similar for the NW state. In 2017, 46.56% of exiters had attended high schools in city regions and 53.44% had attended high school in the other three regions. In 2018, 50.90% of exiters had attended high schools in city regions and 49.10% had attended high schools in the other three regions.
PSO engagement
Utilizing multilevel logistic regression, PSO engagement of exited students with ASD one year after high school was modeled on several predictors. This analysis produced an answer to the first research question, “Which predictors had the strongest significant effects on PSO engagement for young adults with ASD across states?”. Referring to Table 2, the strongest significant predictor in the NW state was exit status in 2017 (Odds Ratio = 3.39, z = 4.83, p < .001) and 2018 (Odds Ratio = 4.03, z = 4.46, p < .001). Referring to Table 3, the strongest significant predictor in the SW state was classroom placement in 2014 (Odds Ratio = 5.18, z = 5.63, p < .001), and exit status in 2015 (Odds Ratio = 3.14, z = 3.69, p < .001).
Significant predictors of PSO engagement in the multilevel logistic regression model for the northwest state.

Significant predictors of PSO engagement in the multilevel logistic regression model for the southwest state.

The results for the NW state in 2017 and 2018 meant that exited students with ASD who had graduated from high school were three to four times more likely to become engaged in PSO their first year after high school than the exited students with ASD who had not graduated from high school, for those with the same random effects (i.e., log odds of PSO engagement for school and district) and controlling for the effects of the other predictors in the model. For the SW state in 2014, exited students with ASD who had spent 80% or more of their instructional days during high school in general education classrooms were five times more likely to become engaged in PSO one year after high school than were exited students with ASD who had spent less time in general education classrooms during high school, for those with the same random effects and controlling for the effects of the other predictors in the model. In 2015, exited students with ASD who had graduated from high school were more than three times more likely to become engaged in PSO one year after high school than exited students with ASD who had not graduated from high school, for those with the same random effects and controlling for the effects of the other predictors in the model.
Machine learning
Machine learning with the Random Forest algorithm was used to answer the second research question, “How did the different PA models of PSO engagement perform across states?”. Referring to Table 4 for the NW state in 2017, the model demonstrated learning with a decrease in error from OOB error of .39 and final error of .08. In 2018, the model demonstrated a similar level of learning with a decrease in error from OOB error of .35 to final error of .08. Referring to Table 5 for the SW state in 2014, the model demonstrated learning with a decrease in error from OOB error of .36 to final error of .07. In 2015, the model demonstrated learning with a decrease in error from OOB error of .40 to final error of .09.
Performances of predictive analytics across models for the northwest state.

Performance of predictive analytics across models for the southwest state.

ROC analysis
To finish answering the second research question, the receiver operating characteristic curve (ROC) analysis was utilized to assess and compare the two PA methods – multilevel logistic regression and machine learning with Random Forest. Referring to Table 4 and Table 5, across both states and based on the AUC values the Random Forest models clearly performed better than the multilevel logistic regression models in predicting the PSO engagement of exited students with ASD one year after high school.
Referring to Table 4 for the NW state in 2017, the AUC for Random Forest was .91 (SE = .02), whereas the AUC for multilevel logistic regression was .75 (SE = .03). This difference in AUC of .16 was significant (z = 4.44, p < .001). In 2018, the AUC for the Random Forest was .92 (SE = .02), whereas the AUC for multilevel logistic regression was .85 (SE = .02). This difference in AUC of .07 was significant (z = 2.47, p = .01). Referring to Table 5 for the SW state in 2014, the AUC for Random Forest was .92 (SE = .02), whereas the AUC for multilevel logistic regression was .75 (SE = .03). This difference in AUC of .17 was significant (z = 4.71, p < .001). In 2015, the AUC for Random Forest was .89 (SE = .02), whereas the AUC for multilevel logistic regression was .70 (SE = .02). This difference in AUC of .19 was significant (z = 6.72, p < .001).
Lastly, the two main indices for the ROC analysis, Sensitivity and Specificity, were also examined. Because the Random Forest models clearly performed better (i.e., more accurate predictions) than the multilevel logistic regression models across both states, the ROC analysis was only applied to the Random Forest models with the best performance. Referring to Table 6, the Sensitivity or the ‘true positive rate’ for the NW state in 2018 was 94.53% (225/238), and the Specificity or ‘true negative rate’ was 88.59% (132/149). The false positive rate was 11.41% (17/149), and the false negative rate was 5.46% (13/238). Referring to Table 7, the Sensitivity or the ‘true positive rate’ for the SW state in 2014 was 95.56% (215/225), and Specificity or ‘true negative rate’ 87.50% (98/112). The false positive rate was 12.5% (14/112), and the false negative rate was 4.44% (10/225).
Sensitivity and specificity of machine learning random forest: northwest state in 2018.

Sensitivity and specificity of machine learning random forest: southwest state in 2014.

Discussion
In seeking answers to the two research questions that framed this study, the results of our statistical analyses of PSO data from two states have produced important new information for the research literature regarding the PSO engagement of recently exited high-school students with ASD. Moving forward, these results also have important implications for education professionals at state and local levels and researchers applying PA to state administrative data for decision making regarding education policies, programs, and practices.
PSO engagement
Across both states, it was clear from the odds ratio values in the multilevel logistic regression models that the two strongest predictors of PSO engagement for young adults with ASD one year after high school were spending 80% or more instructional days in general education during high school and graduating from high school. This aligns with what has been reported in government data and other research, such as those using NLTS data, about the strong linkages of classroom placement and high school graduation to the likelihood of college enrollment and or competitive employment for exited high-school SWD (e.g., Blackorby & Wagner, 1996; Liu et al., 2018). This study, however, goes further because it (a) tested both main types of PA models, logistic regression (i.e., traditional statistical approach) and Random Forest (i.e., newer machine learning approach), on state-level PSO data of exited high-school students with ASD over multiple years while also accounting for school and district effects, and (b) assessed and compared the predictive accuracy of the PSO engagement models with the ROC analysis, which provided an empirical measure of reliability and usability of these models.
There were also interesting differences in PSO engagement across the two states. Graduating from high school (i.e., exit status) was a strong significant predictor of PSO engagement for exited students with ASD in the NW state in both years, 2017 and 2018. In the SW state, however, it was a strong significant predictor for exited students with ASD in only one year, 2015. This may be indicative of the very high percentage of exited students with ASD who had graduated from SW high schools compared to the NW state. This could also be, at least in part, explained by the differing response rates in the states’ annual census data collection of PSO.
Classroom placement having a strong predictive effect on PSO engagement underscores the impact that classroom placement has on high-school students with ASD and their high-school and post-high school experiences and outcomes. The issue of classroom placements for SWD has been a major topic of debate for decades. More recently, this issue has also been a significant part of the increased focus on systemic bias and education equity involving the complex intersectionality of student and teacher gender and race/ethnicity, school resourcing and accountability, and calls for transformative reforms (see Gordon, 2017; Grindal et al., 2019).
Admittedly, some of the effects of high-school graduation and classroom placement could have also captured other un-measured factors, such as employment opportunities or supports across communities. These are factors that were not part of our statistical analyses but nevertheless could still have had some level of impact on PSO engagement. For example, Pillay and Brownlow (2017) identified additional predictors such as supported workplace, functional independence, and family advocacy in the employment of youth with ASD. Also, some research suggests that as more time passes since exiting high school, more individuals with ASD become competitively employed full-time (Bouck & Park, 2018). Research using NLTS data also shows that four to eight years after exiting high school, young adults with ASD were less likely than their peers without disabilities to be enrolled in two- and four-year colleges. With the exception of young adults with multiple disabilities and intellectual disabilities, young adults with ASD were also less likely than young adults with other disabilities to be enrolled in two- and four-year colleges (Newman et al., 2011).
Predictive performance
Perhaps the clearest result in this study is that machine learning with the Random Forest algorithm performed significantly better than the multilevel logistic regression models across the two states. This does not mean, though, that machine learning is always better than multilevel logistic regression in predictive performance. The general recommendation from other fields (e.g., medicine) is for researchers and analysts to utilize both PA methods and assess their performances (see Rajula et al., 2020). Taking such an approach could also make the application of PA in research more methodologically rigorous over time, particularly with administrative data (e.g., PSO), because each year presents new but related data on which to analyze performance, then assess and refine the models based on error and AUC.
Because the ROC analysis produces numerical measures of Sensitivity and Specificity, the differences in predictive performance from this study can also be utilized by education professionals, as those values translate to actual numbers of exited high-school students with ASD who did or did not become engaged in PSO in the two states for those years (see Table 6 and Table 7). Unlike in other fields, however, the application of PA to state PSO data for exited high-school students with ASD will likely involve different discussions about the level of predictive accuracy needed or wanted by state and local educators and administrators, and how to approach the refining of these PA models (e.g., Baker, 2017). For example, the Random Forest models in the NW and SW states produced true positive rate or Sensitivity at about 95%, with false positive rates of 11 to 12%. Therefore, state and local education professionals may be interested in deciding the levels of false positives and or false negatives they deem acceptable for using PA models in their decision making on education policies, programs, and practices.
Because the two states possess the entire unedited PSO data of exited high-school students with ASD (not de-identified PSO data we used in this study), they can trace exactly which students were correctly predicted to be engaged and not engaged in PSO. Then, they can use that information to figure out which combination of factors (e.g., being a female graduate from a suburban school “ABC” in district “123”) are likely to be driving predictive accuracy (see Zhou et al., 2007). They can also use that information to help them analyze the PSO trajectories of similarly situated, current high-school students with ASD in their schools and districts. In turn, using that information gathered over time from the PA models has the potential to be impactful, from decision-making in areas such as high-school transition planning, to providing education professionals the data-analytic tools for continuous improvement.
Limitations
Because this study solely involved the application of PA to administrative data for PSO of exited students with ASD from two states, its limitations are directly connected to the data (i.e., respondents, variables) and the statistical analyses (i.e., modeling). The first limitation of this study is data, specifically, the number of states and participants. This study included two states, and though they have different populations, there is no claim here to generalizing their results to the rest of the U.S. states. Moreover, the number of exited students with ASD from the NW and SW states were modest in size, between 300 and 500. Multilevel models can be more efficient in parameter estimation with larger sample sizes at each level (e.g., student, school, district) of the analysis (see Maas & Hox, 2005). Conversely, the machine learning Random Forest models utilized bootstrapping in its predictive algorithm, a well-established way of modeling with modest sample sizes. Additionally, although both states reported higher than typical response rates for their statewide census PSO data collection, anything short of 100% response rate leaves open the possibility of non-response bias (Bose, 2001).
The second limitation of this study was the PA modeling. Statistical models are never free of error. This was seen in multilevel logistic regression standard errors (SE) of predictors and confidence intervals for odds ratios. This was also seen in Random Forest standard errors (SE) for AUC, OOB and final errors. A likely source of error was the small number of predictors. Although the PA models performed well in predicting PSO engagement, subsequent studies applying PA models to state administrative PSO data should include additional predictors. As a complex phenomenon, PSO engagement is likely affected by other predictors that were not in this study. Therefore, the PA models developed in this study could be considered ‘base’ models from which to start, refine, and build models in future studies. Future studies could also reveal that other factors instead of (or related to) classroom placement or high school graduation, such as various components of high-school transition planning and experiences (see Liu et al., 2018), are the strongest predictors of PSO engagement for exited high-school students with ASD.
Implications
The implications of this study are pertinent to two stakeholder groups – education professionals at the state and local levels (educators, administrators) and researchers.
Education professionals
States are mandated by federal law to annually collect and report PSO data, and PA is designed to utilize historical and current data to create testable models for prediction (see Shmueli & Koppius, 2011). Thus, states do not need to use other, nationally sampled data. Educators could take models from this study and refine them to apply to their own exited high-school students with ASD. In analyzing Sensitivity and Specificity of the PA models, states can also see how accurately the models predicted PSO engagement in each year's data. Using the AUC to compare models also provides a rigorous empirical method that can give states more confidence about the PA models they develop for subsequent use. That process can further incentivize states and local education professionals to continue refining the models, making them more reliable and sustainable. Following that process can also build the necessary community trust in and support for using these analytic tools long-term (see Hammer, 2021).
Utilizing the PA models developed in this study could also narrow the research-to-practice gap. Because the states possess the entire dataset on all students with ASD at their schools and districts every school year, they can utilize more of the other variables that were excluded from the data we were provided for this study, and create more ‘complete’ predictive models of PSO engagement. The multilevel logistic regression and machine learning models would also enable education professionals to pinpoint context-specific effects that appear only at certain schools and or districts in the state. That level of detailed information would be beneficial not only to those students with ASD and schools/districts, but also to state policy makers.
Lastly, it is also important to note that although a well-known commercial statistics software, Stata, was used in this study to conduct the data analyses, the same analyses can also be done in free non-commercial software, such as Jupyter Notebook, Spyder, and R-Studio. These are open-source software programs that have been in existence for many years, and they are regularly updated and well-supported. Both commercial and open-source software programs with predictive-modeling capabilities also provide a number of support resources in online forums and platforms. These resources can be helpful when users have specific data or analysis-related questions regardless of their level of expertise and or experience.
Researchers
A unique advantage of using multilevel logistic models are that they produce a prediction equation with log odds converted to odds ratios of PSO engagement for each student, school and district in the dataset (see Austin & Merlo, 2017). For example, a prediction equation can be created for a female student with ASD, who had spent more than 80% of her instructional days in general education during high school, attended school in a rural region (in the NW or SW state), and graduated from high school. This is granular information that is based on the data each year from students who come from their communities, and not a hypothesized or simulated data.
Further research is needed to analyze the effects of other predictors, such as self-determination. That would likely involve the states connecting their PSO data systems to their other administrative data systems, such as human services, higher education, labor or commerce. Those linkages could produce more robust and durable PA models of PSO engagement, and provide researchers more contextualized information that may also open up other avenues for PSO research beyond engagement. For example, more in-depth analyses could include studying effects of higher-education disability-support systems for students with ASD, or natural support systems for employees with ASD in a competitive integrated employment settings.
While they are sources of important and potentially actionable information, state administrative data systems are also very complex, and researchers should remain keenly aware of public concerns with the over-reliance on technology-heavy and algorithm-driven methods in data-based decision making. There is agreement across most fields that personal human judgment remains central, and all of these PA tools should only be used in support of, and not in place of, human judgment (Chin-Yee & Upshur, 2017). Moreover, as data-analytic tools continue to develop, ethical and equitable applications and utilizations of PA (Palmer & Carpenter-Hubin, 2020) must always be ensured in order to advance the field for everyone.
Footnotes
Declaration of conflicting interests
The authors declared no potential conflicts of interest with respect to the research, authorship, and/or publication of this article.
Funding
The authors received no financial support for the research, authorship, and/or publication of this article.