
Abstract
It is widely believed that the planting of new churches is a cause of church growth, regardless of culture or context. However, surprisingly little reliable and relevant data are presented to support this claim. In this article recent membership data of the Bund Freier evangelischer Gemeinden (Association of Free Evangelical Congregations) in Germany is explored to examine the relationship between church planting and church growth. The data show that there is indeed a positive correlation, but since there is also a clear correlation between rapid growth and decline, the evidence should be treated with care.
In the secular parts of the West many churches are in decline. This trend has stimulated a search for growth strategies, among which the planting of new churches is often considered as one of the most reliable methods. In fact, especially among evangelical Protestants, it is widely believed that church planting furthers numerical growth, including conversion growth. 1 To the extent that this claim is formulated in researchable hypotheses, it is generally thought that church growth, especially through attracting new believers, will happen mostly as a consequence of age and size. That is, it is believed that younger churches are more flexible and more outreach-oriented. Also, smaller churches are claimed to be more likely to grow, as they are supposedly more efficient in their management of members and mission, and more relationship-oriented. 2
Unfortunately, there is little reliable evidence either supporting or refuting these claims. Many churches do not keep accurate membership records, and those that do, very often present their figures in nontransparent ways, rendering it impossible to distinguish between the various sources of growth. Also, growth-oriented churches often present their undifferentiated membership figures as evidence for church growth, without inspecting their data to see where the growth comes from. For example, adult baptisms may be considered as ipso facto evidence for the influx of new believers, while many of these newcomers might very well come from other churches or from Christian families within the church. Moreover, research that seems to support claims of church growth is often based on spurious or inaccessible data, or it suffers from serious methodological flaws. 3
Together with Alrik Vos, I have presented some figures based on recent research in three Dutch Reformed denominations suggesting that church plants are indeed better at attracting converts and returnees (at least five times as many as older churches). However, this research, although conducted with scientific rigor and based on fairly accurate data, works with very unequal sample sizes: only 16 church plants against 476 older churches, of which, respectively, 13 and 143 (response rates of 81 and 30 percent) participated in the research. 4 Nevertheless, this is in fact the only research project in Europe that is based on solid data, and it presents transparent outcomes as regards the relationship between church planting and church growth.
Recently, new high-quality material has become available, which I discuss in this article. The data under review are the complete membership records of the Bund Freier evangelischer Gemeinden (Association of Free Evangelical Congregations) in Germany for the period December 31, 2011, to December 31, 2015. 5 This denomination (hereafter referred to as BFeG) planted its first church in 1854 and, ever since the turn of the millennium, has accelerated its church planting efforts. Currently, there are nearly 500 BFeG-churches all over Germany, comprising around 40,000 members. As a so-called free church, the BFeG is one of the smaller churches in Germany, dwarfed in size by the Evangelische Kirche in Deutschland (Protestant Church in Germany), with its millions of members. Compared with other free churches in Germany (e.g., Baptists and Pentecostals), however, the BFeG is one of the largest. As a classic revivalist church, it is eager to evangelize and expand. Its website even has a separate section on church planting, explaining the methodology of planting and the way an existing church can become recognized as a BFeG congregation. The website also introduced a plan to establish one hundred new churches between 2006 and 2015; sixty-nine were actually realized. 6 Also, at the end of 2015 no fewer than nineteen church planting initiatives were listed on the website. Altogether, the BFeG is thus a good case study on the success of a growth-through-planting strategy in Europe. The fact that the denomination keeps meticulous records of membership developments, using many refined and rather well-defined categories, is a very helpful factor in assessing these strategies.
In this article I first address some terminological and methodological issues, then propose three hypotheses about the relationship between church planting and church growth. In the following sections I test these hypotheses, using the BFeG data. The article concludes with some strategic comments on church planting in secular Europe.
Terminology and methodology
Church growth can be due to births, transfers from other churches, and recruitment (conversions). If figures for these categories exceed the losses by deaths, transfers to other churches, and church leaving, a church has grown. By presenting different categories of growth and decline in its membership, the BFeG membership records make it possible to distinguish between these categories of growth. In this article I concentrate on three figures: (1) absolute growth (all forms of growth minus all forms of decline), (2) conversion growth (the number of converts), and (3) net conversion growth (the number of converts minus the number of church leavers). All growth figures are calculated with reference to the membership as of December 31, 2011. Thus, for example, a church that grew from 100 to 110 members between 2011 and 2015 has a total increase of 10 percent in these four years. If churches were planted after 2011, I have calculated their growth relative to their year of founding.
The BFeG registers its membership developments once every two years in a report using seven different categories of arrivals (Eingänge) and the same number of categories for departures (Abgänge). With regard to my three types of growth mentioned above, I have used for type (1) the membership figures as of the end of the years 2011 and 2015. The difference between the two is the absolute growth of this particular church over these four years. For types (2) and (3) I have used the second growth category in the membership records (Bekehrte durch ihre Arbeit, “converted through evangelism”) and the sixth and seventh categories of decline (Ausschlüsse, “expelled,” and Austritte, “left for no church”). I have lumped together these last two categories as “leavers.” (Note that this category does not include transfers to other BFeG churches or other denominations.) The growth category of conversions is distinguished from other growth categories such as transfers or baptism candidates who grew up in the church.
All calculations are based on those who have registered as members, which is the least insecure way to measure growth and decline. People can become members in the BFeG through a public confession of faith and baptism. Infants are not baptized and therefore are not registered as members. The BFeG also records “visitors of the worship meetings,” a category that includes visiting nonmembers and the children of members. This category is not specified in the records, and it is not included in my calculations. Finally, the BFeG has an unspecified category “friends,” that is, people who are not registered as members but have some formal connection to the church. I have left them out as well.
Do the BFeG data allow us to support the claim that church planting furthers church growth? In order to examine this issue, I have formulated three general hypotheses that will be tested. These hypotheses can be found in virtually every handbook on church planting, and I have discussed them at length in my recent study of church planting in Europe. 7 They are:
Age hypothesis: church planting furthers church growth because new churches grow better than older churches.
Size hypothesis: church planting furthers church growth because planted churches are usually small, and small churches grow better than larger churches:
Place hypothesis: church planting furthers church growth because church plants are in better locations than other churches.
As for the second hypothesis (size), no significant results were found. In other words, with regard to the BFeG there is no clear correlation between church size and church growth. In order to save space, I will therefore discuss only the first and third hypotheses. First, however, I will present some general figures pertaining to the BFeG as a whole.
General data
The following table presents some general figures about the BFeG as a whole for the four-year period December 31, 2011, to December 31, 2015.
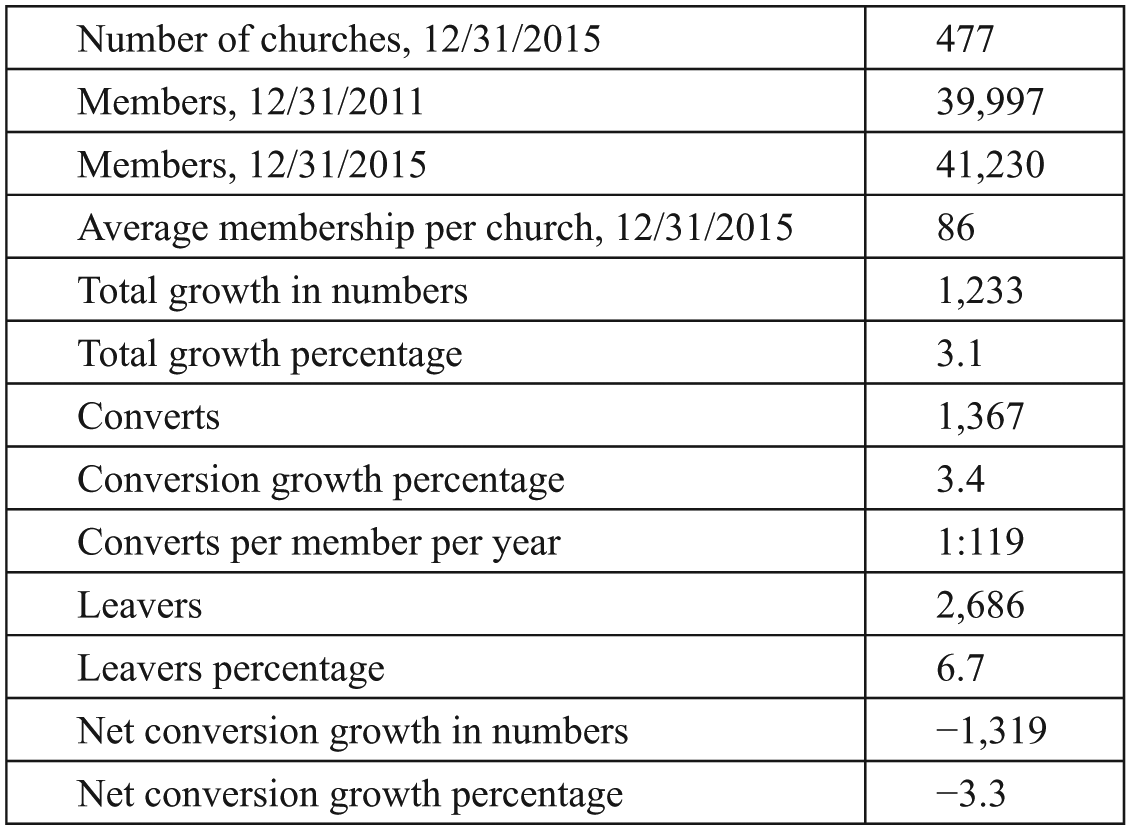
BFeG, 2011–2015.
As for the number of churches, I have omitted one church because its data were polluted. Also, a number of churches closed between 2011 and 2015. I have not included them in the number of churches, but I did include their membership numbers in the data for 2011–15 under the assumption that their members remained within the BFeG.
As a whole, it appears that the BFeG experiences numerical growth (0.76 percent annually), which is more than most churches in Europe can claim. Also, the rate of converts per member per year is quite high, at least when compared to other churches. Elsewhere I have argued that the average conversion rate in secularized Europe may be around one convert per 700–800 members per year. 8 At a rate of one convert for every 119 members, the BFeG attracts six to seven times as many converts. This finding agrees with the general claim in social science literature that more conservative churches are more likely to grow than more liberal churches. However, we see that the denomination does not succeed in drawing enough converts to compensate for its losses in terms of church leavings; although experiencing overall growth, the BFeG has a net conversion loss (conversions minus leavers) of ca. 0.8 percent per year.
Age
In order to test the age hypothesis, I have divided the BFeG churches into ten-year samples based on their year of establishment. Grouping them in this way results in fourteen samples, two of which cover a slightly longer period than ten years (to prevent awkward samples). This is true for the 1926–45 sample, since no churches were planted between 1941 and 1945, and only four churches between 1936 and 1940. Also the oldest sample, representing establishment years 1854–75, covers a somewhat longer period, producing one sample with sixteen churches rather than two very small samples with nine and seven churches.
From figure 2 it appears that the BFeG has accelerated its church planting, especially since the 1980s. More than 40 percent of all currently existing churches have been planted since 1986. However, these figures represent only the present distribution of churches. For example, eight churches closed in 2015, five dating from 1886–1946, and three from 1997–2003. If the same number of church closings has happened in previous years, we should expect that more older churches have disappeared. So, although the figures clearly suggest that the BFeG plants more churches than it used to do, the figures must be taken with some caution. Most likely, older churches are underrepresented, as a larger number of these have closed.
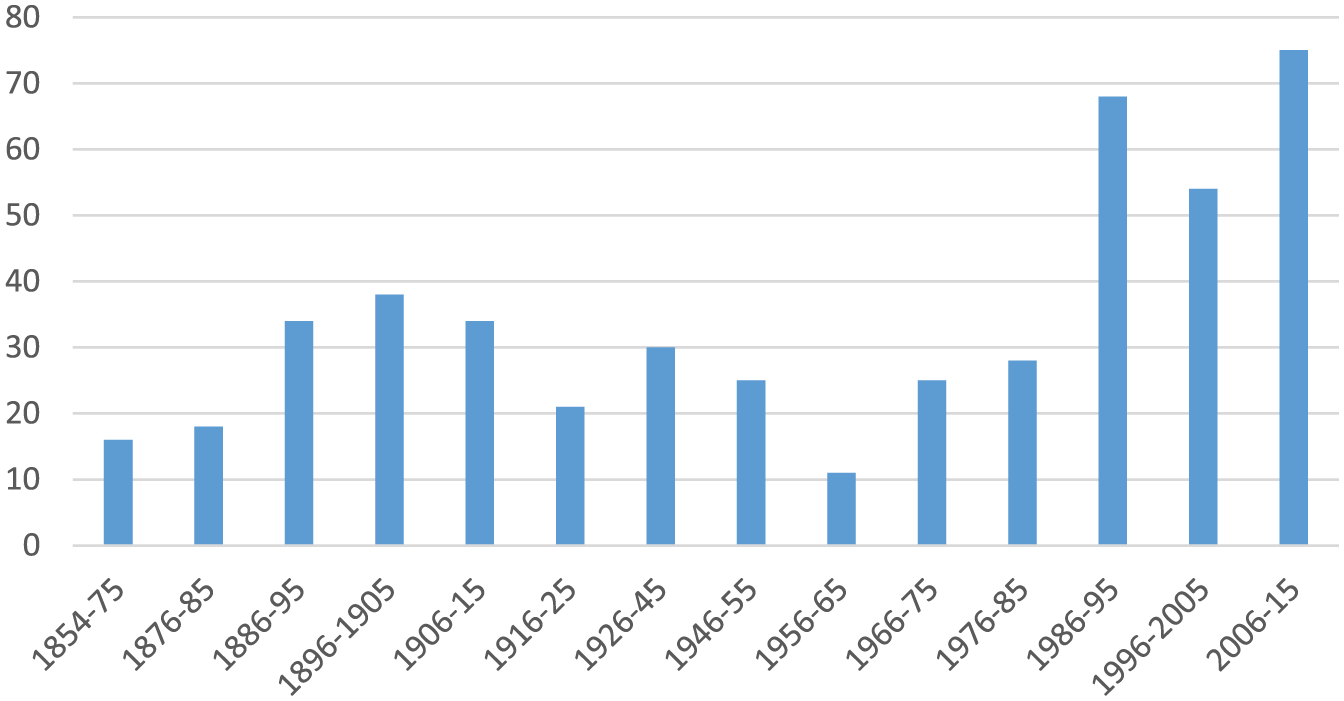
Number of churches per (usually) ten-year sample.
As for the membership distribution and the average congregational size per age sample, the picture is somewhat different. It is no surprise that the 1986–95 sample contains the largest membership group, for this sample is the second largest in number of churches. However, the youngest sample (2006–15), which has the most churches, has a far smaller membership—in fact, the smallest average congregational size of all samples.
Figure 3 also shows that older churches tend to be somewhat bigger. Taking the range of statistical normality roughly between 60 and 120, 9 the difference in congregational size between the oldest sample (1854–75) and the youngest sample (2006–15) is considerable: on average, the oldest churches are four times bigger than the youngest churches (157 vs. 38). Most other samples hover around the BFeG average congregational size of 86 members per church. Therefore, the difference in size between the oldest and the youngest sample cannot be solely explained as a consequence of age (after all, older churches have had more time to grow). Even the second oldest sample (1876–85) has considerably smaller memberships than the oldest (157 vs. 119), while its churches are larger than those in all remaining samples. However, the results of the oldest sample are influenced to a large degree by one single very large congregation (500+ members), which I will hereafter call Church X. 10 Without this church, the average congregational size in this sample would be 132, which brings this sample more toward the normal range.
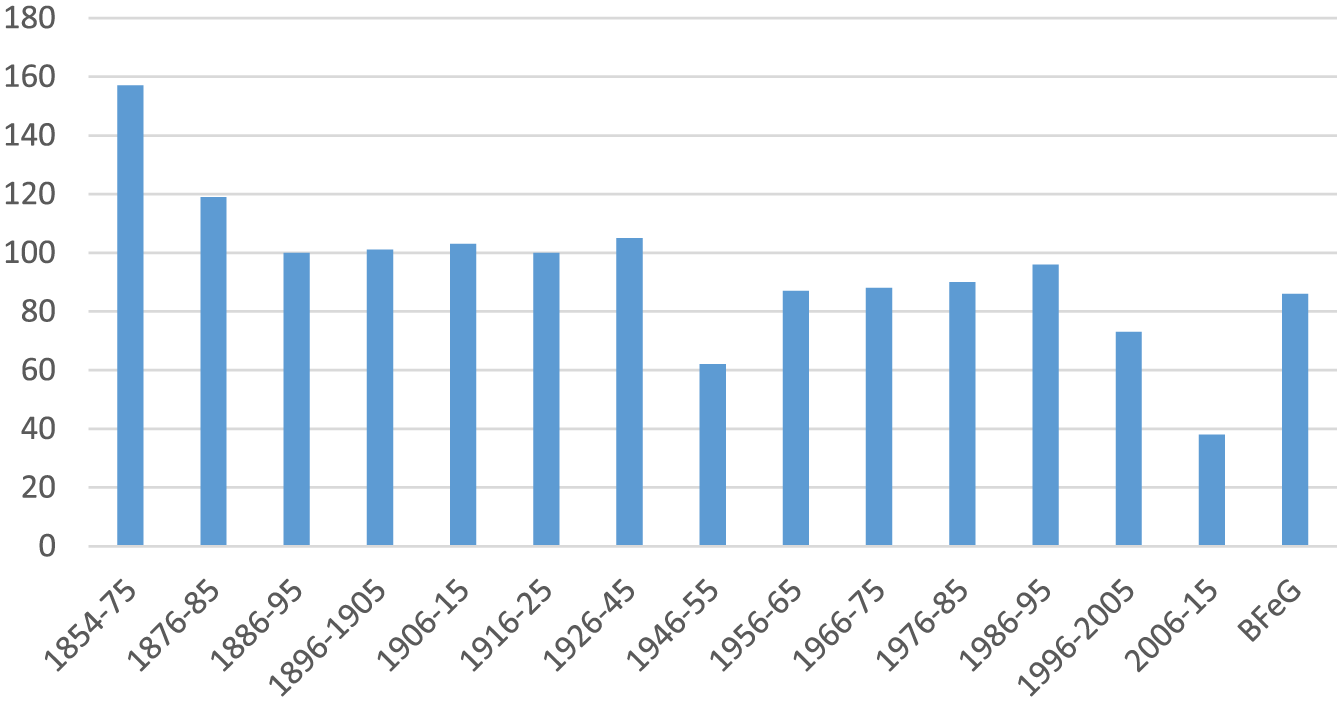
Average church size, 12/31/2015.
The available data render it very likely that age is an important factor in church growth. Figure 4 shows growth percentages of each sample. The pattern is highly suggestive: almost all older samples are shrinking or stagnant, while, beginning in 1976, the youngest samples show increasing growth. The youngest sample (2006–15) has grown by no less than 42.3 percent, or more than thirteen times the BFeG average.
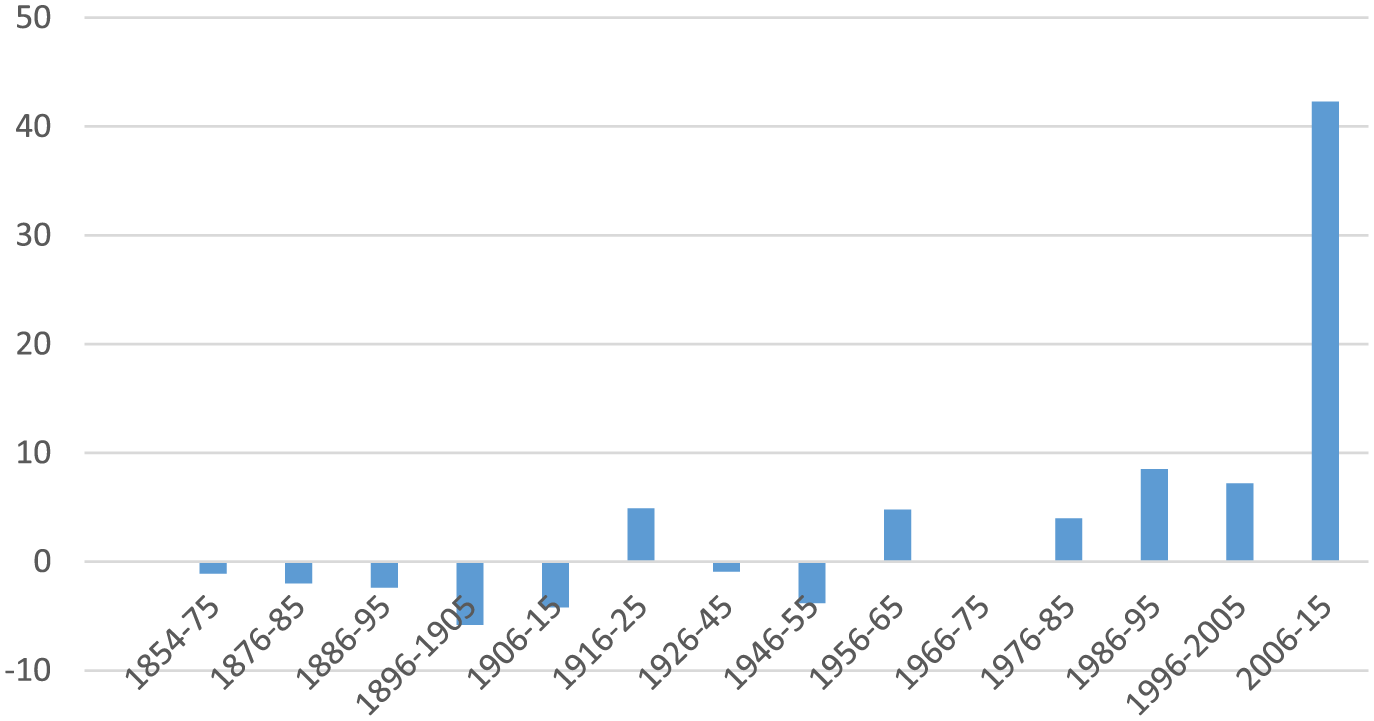
Percentage growth, 2011-15.
The extreme growth of the youngest sample puts the range of statistical normality somewhere between −8 and 15 percent, which would render the results of only the youngest sample significant. If we exclude this sample, the range of normality lies between −4 and 5 percent, which would show the 1896–1905 sample to be in significant decline (−5.8 percent), and the two samples between 1986 and 2005 to have grown above expectations (8.5 and 7.2 percent). Either way, this is strong evidence that church growth in the BFeG is age-related.
While undifferentiated church growth undisputedly happens more in younger churches than in older churches, it remains to be seen whether this is also the case with conversion growth. Figure 5 shows conversion growth and church leaving in all samples in absolute numbers.
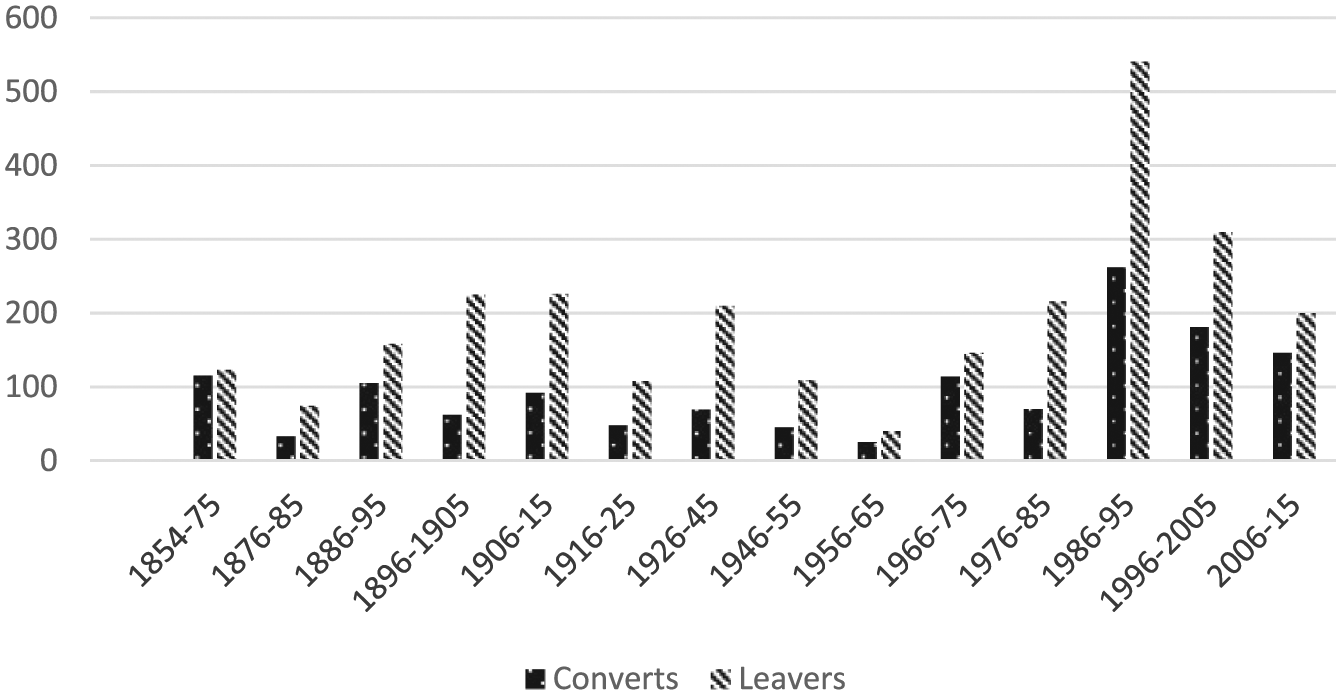
Converts and leavers, 2011–2015.
From this figure we see that every sample has more leavers than converts. Also, it appears that generally the younger samples have more converts and more leavers. This pattern becomes even clearer when we look at percentages.
Figure 6 confirms that younger churches tend to draw more converts, relatively, but they also suffer more losses from church leaving. Assuming that all results between 2 and 5 percent conversion growth fall within the normal range, two samples (1876–85 and 1896–1905) perform below expectations, while two younger samples (1966–75 and 2006–15) perform better than expected. Altogether, the higher conversions are found in the youngest samples (1986–2015). As for church leaving, assuming statistical normality to lie between −8.5 and −4.5 percent, only one sample is performing somewhat better than might be expected (1876–85 with −3.4 percent), while the 1956–65 sample with −4.4 percent is also doing not too badly. Here the four youngest samples are the worst achievers, with percentages between −8.4 and −9.9 percent.
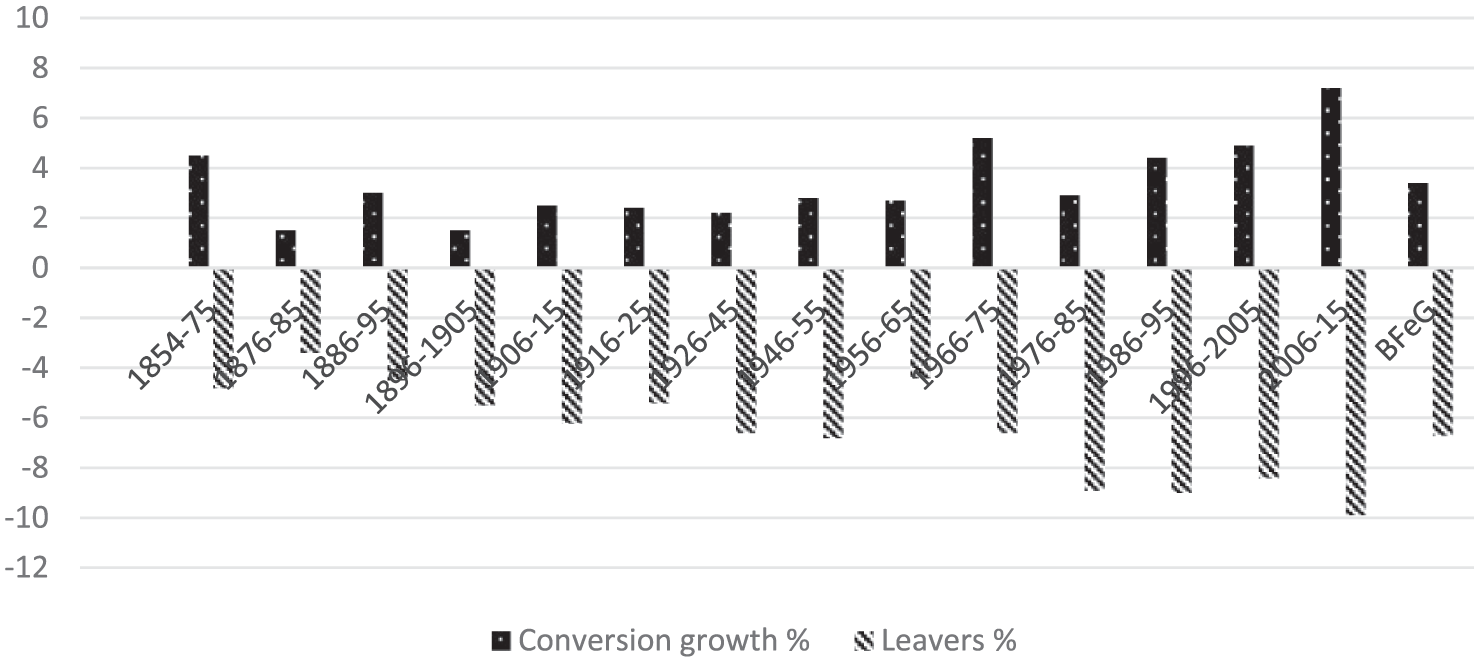
Percentages of converts and leavers, 2011–15.
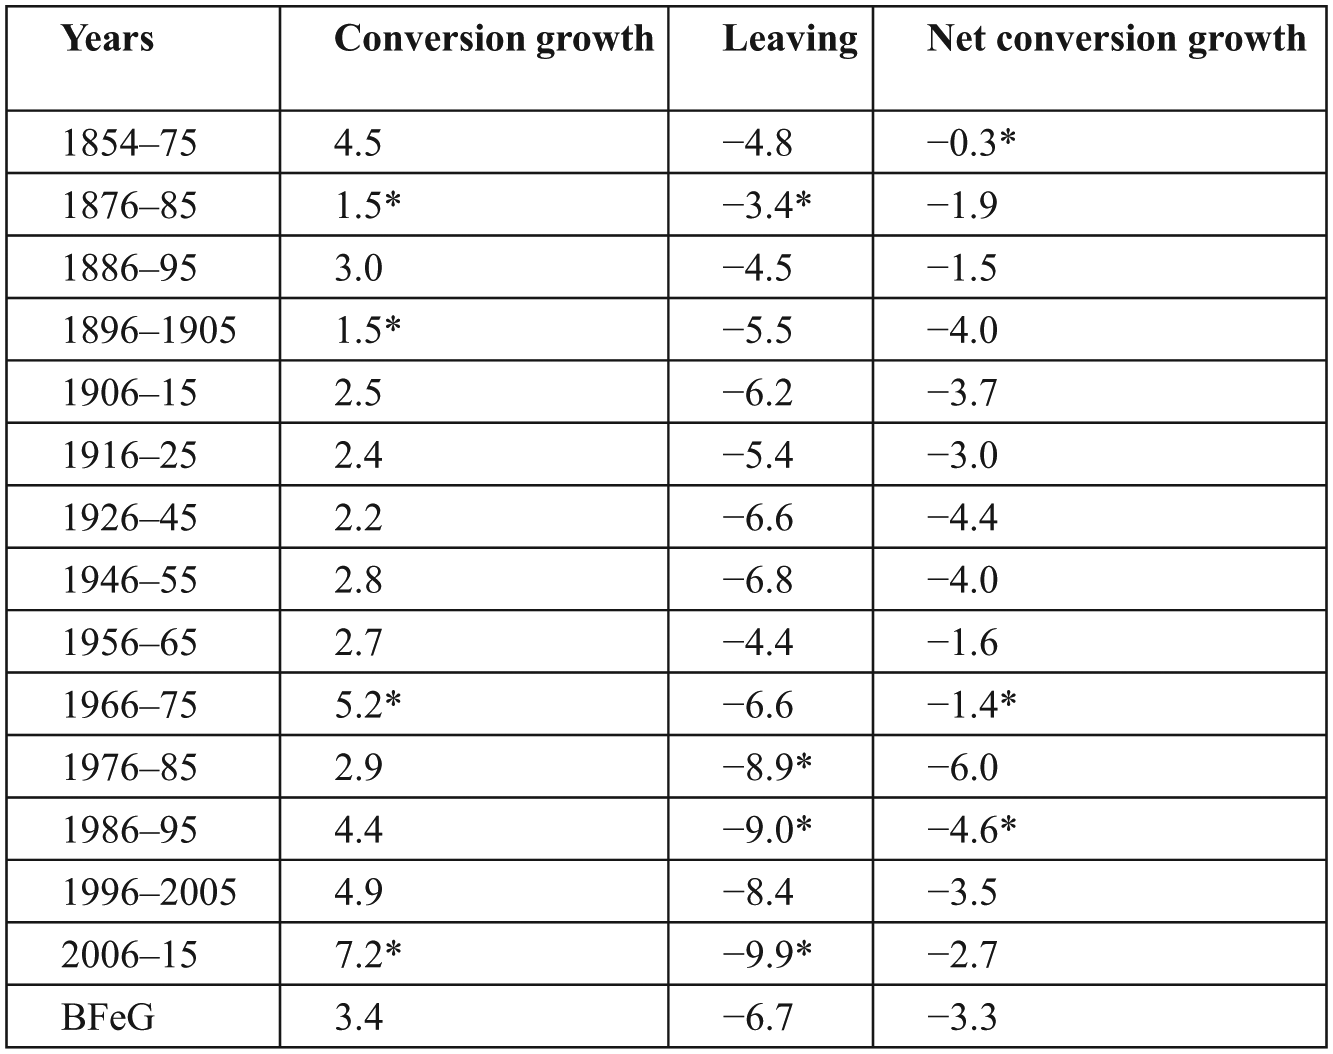
Percentage of converts and leavers, 2011–15 (* = significant result).

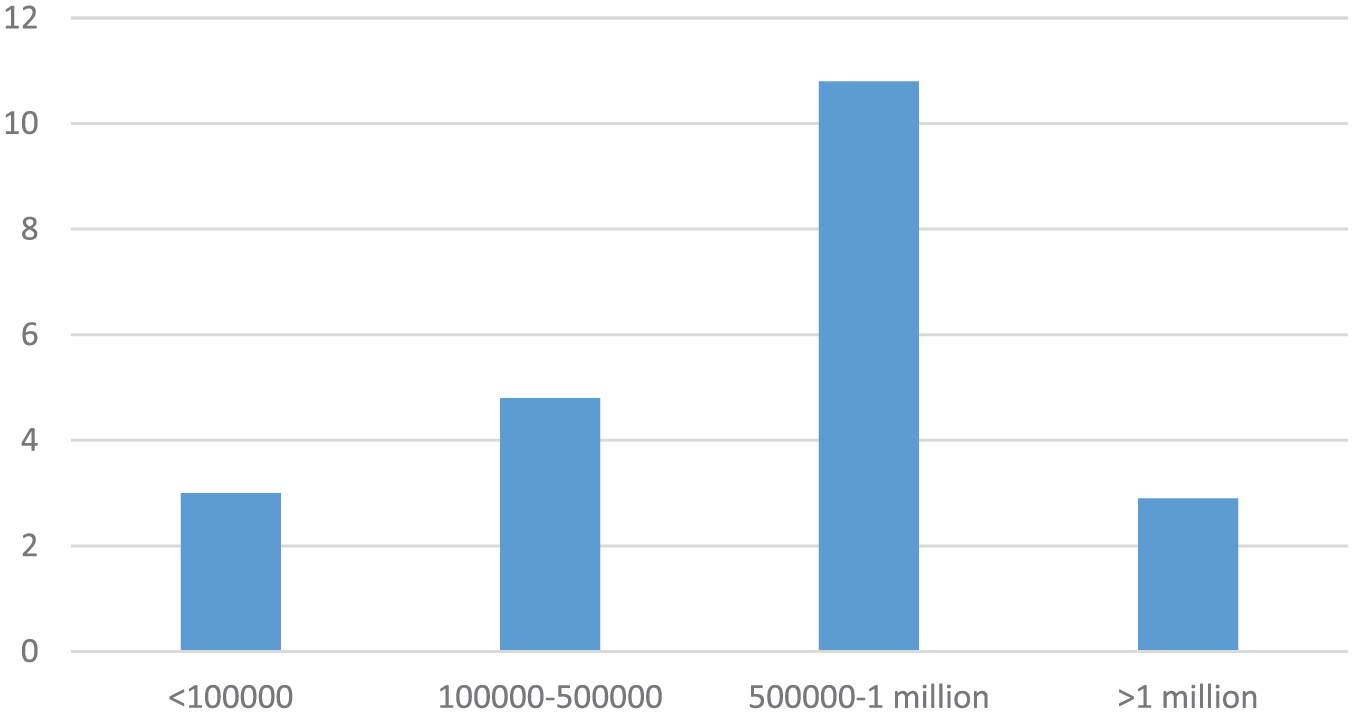
City size and number of churches.
Since the youngest samples compensate for their losses somewhat with higher conversion rates, their net results tend to remain within the normal range of between −1.5 and −4.5 percent. In fact, only one sample is performing slightly worse: 1986–95 with −4.6 percent, while two samples are performing better: 1966–75 with −1.4 percent and the oldest sample, 1854–75, with −0.3 percent. Especially the latter is interesting, since this is by far the best net conversion growth in the BFeG. Much of this performance can be explained, again, by the already mentioned Church X, which belongs to the oldest sample, and which attracted 72 converts alone (63 percent of all converts in this sample). Also this is virtually the only church in this sample with a positive net conversion growth (9.7 percent). If we would exclude this church from our calculations, absolute growth in this sample would amount to −4.4 percent, conversion growth would be 1.5 percent, and net conversion growth −1.9 percent. All this would mean a significant loss (both with and without the youngest sample included) with regard to undifferentiated growth, and normal scores for conversion growth and net conversion growth.
In conclusion, it seems that young churches are doing relatively (far) better when it comes to growth in general and conversion growth in particular, but since they suffer heavy losses from church leaving at the same time, their net conversion growth remains fairly average. The oldest churches are performing better at guarding their back door. Also, the data show that there are always exceptions to the rule: some very old churches (such as Church X) may outperform many other churches.
Place
As the size hypothesis does not produce significant results, we now turn to location. To what extent is the place of settlement a factor influencing church growth? There is evidence from other research indicating that especially cities with much economic activity and immigration are places where churches are more likely to grow. 11 This is difficult to examine, however, as there are many indicators influencing demographic growth and economic activity. Here I have limited myself to a rather surface attempt to find significant growth patterns in cities of different size. Based on population numbers of German cities as of December 12, 2015, 12 I have made four samples: (1) churches in places with more than 1 million inhabitants, (2) churches in places with 500,000 to 1 million people, (3) churches in places with 100,000 to 500,000 people, and (4) churches in places with less than 100,000 people.
Clearly, the vast majority of BFeG churches are found in places with less than 100,000 inhabitants, while these churches represent a bit less than two-thirds of all BFeG members. These uneven sample sizes make comparisons between the first and the other three samples difficult. Even so, there is a significant difference in growth between the different samples, as figure 9 shows.
Percentage growth, 2011–15.
While all the other samples fall within the normal range (2.5–8.6 percent), the sample of churches from places with 500,000 to one million people has grown by 10.8 percent. Caution is advised, though, since this is by far the smallest sample (nineteen churches), which can easily distort percentage results. As for conversions and leaving, no really significant results appear (figure 10).
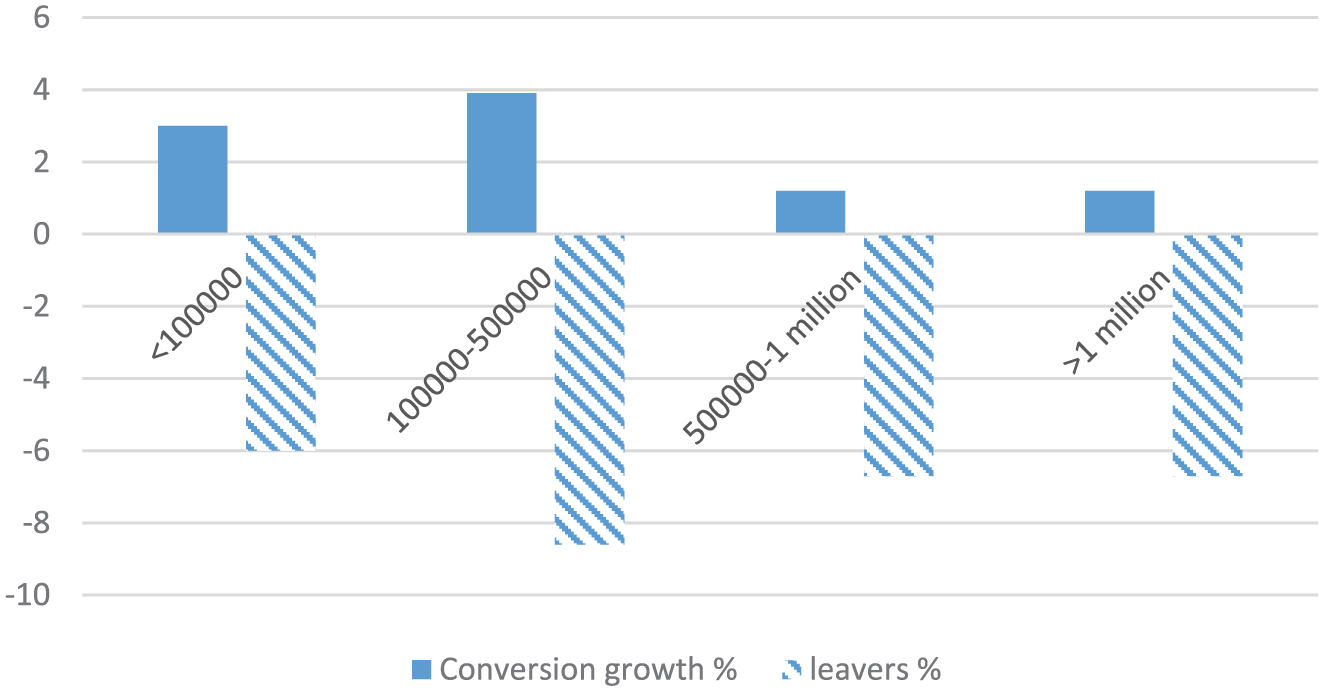
Percentage of converts and leavers, 2011–15.
Only the sample with churches from places with 100,000–500,000 people has a slightly better conversion growth than the statistical normal (3.9 vs. 3.5 percent), and a slightly worse outcome for church leaving (−8.6 vs. −8.0 percent). However, such meager results do not really support the claim that church growth is affected by location, at least not for the BFeG data.
Apparently, city size in itself does not relate directly to church growth. However, when it comes to factors such as economic flourishing, immigration, and population growth, there are important differences between cities, all of which may affect the growth of churches in such cities. Take, for example, the sample with the four largest cities (figure 11).
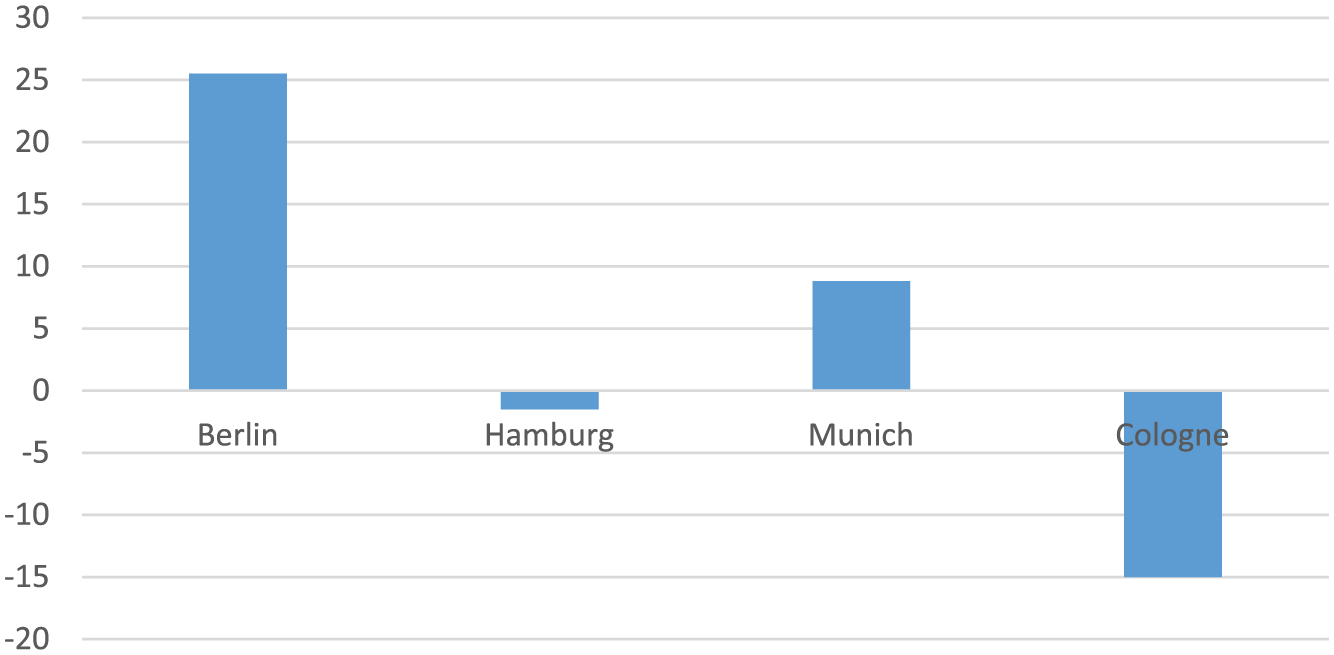
Percentage of church growth, 2011–15, the four largest cities.
Evidently, Berlin (11 churches, 701 members) does much better in terms of church growth than Hamburg (13 churches, 1,367 members), Munich (6 churches, 645 members), and Cologne (6 churches, 466 members). With the smallest average church size of all four major cities (64), Berlin also has by far the best conversion growth and net conversion growth.
From figure 12 it becomes clear that the churches of Berlin have, in fact, a positive net conversion score of 5.3 percent. Munich, with a net conversion rate of −1.1 percent, also seems to do relatively well, but it should be noted that all forty converts in this sample were found in one church only. Berlin is the first sample in our research that has more converts than leavers (9.1 vs. 3.8 percent). Moreover, eight of its eleven churches actually have attracted converts, and six churches have positive net conversion scores (plus two slightly negative and three even scores). Even though the sample is small, the results indicate that location does indeed matter when it comes to church growth. Interestingly, also eight of its eleven churches have been planted after 1990 and seven after 2005. But even an older church established in 1906 has had a positive net conversion growth of 12.5 percent in four years. There is only one shrinking church in this sample. These facts confirm the more general observation that the major European cities are doing relatively well in terms of church growth.
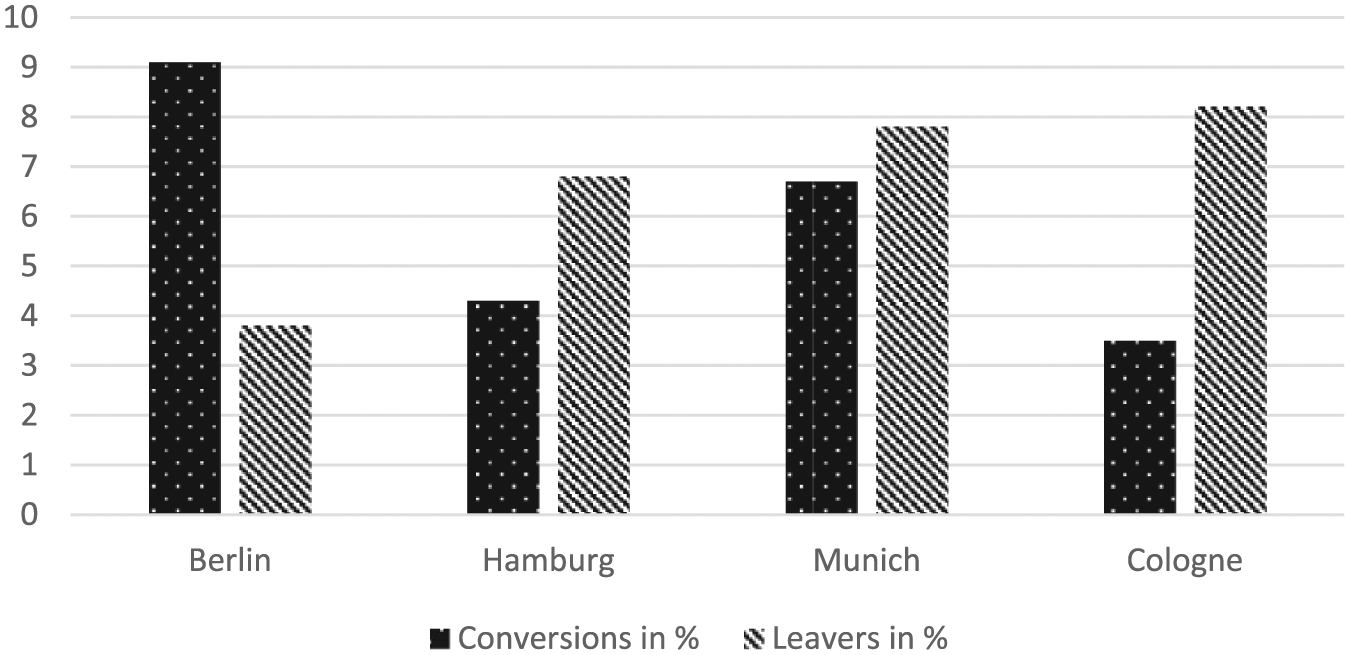
Percentage of converts and leavers, 2011-15, the four largest cities.
These results suggest that, with a closer look at local conditions and with a more refined comparison between different places, location does indeed affect the growth of a church. While this research was not focused particularly on this issue, the case of Berlin seems to prove the point sufficiently.
Conclusions
Two hypotheses have been examined in this article. In this concluding section I draw conclusions with regard to both, and add some thoughts for further discussion.
Age hypothesis: Church planting furthers church growth because new churches grow better than older churches. In fact, this hypothesis has been discussed in three versions. The first is that new churches grow better in general. This research has confirmed this hypothesis with the BFeG in Germany. The samples with the younger churches grow (far) better than the older samples, while the youngest sample has grown more than thirteen times as much as the BFeG average. In fact, the youngest sample is responsible for two-thirds of all the BFeG growth in 2011–15, even though it has less than 10 percent of all the membership.
The second version of this hypothesis is that new churches draw more converts. This research has also confirmed this subhypothesis. While the results are less spectacular than with growth in general, the younger samples tend to have significantly more converts than the older samples, while the youngest sample (2006–15) has relatively the most. Also it has been shown that some (very) old churches can outperform most other churches, indicating that age is not the single determining factor here.
The third subhypothesis is that new churches have a better net conversion growth. This research has shown that this is not the case in the BFeG. Younger churches suffer (far) more from church leaving than do the older churches, which results in a quite average net conversion growth.
These high figures in younger churches of both growth and decline suggest what we could call a fast metabolism. Apparently, their organizational dynamic attracts many newcomers, but then it has trouble keeping them. This combination makes sense, if we consider that people who reverse their decisions will usually do so relatively shortly after they have made one. We may expect that a high proportion of joiners (either converts or transfers) will reconsider their decision afterward, with some deciding to leave. Converts are typically in a process of readjusting, which may also result in a choice to return to their previous life. Transfers or switchers, in contrast, may very well be discontented church members who carry certain frustrations with them, which makes them vulnerable for new disappointments. As most of these churches have been planted less than ten years ago, their membership will consist mostly of converts and transfers, thus creating an environment highly susceptible of both attracting newcomers to an interesting and dynamic group, and of frustrating those who did not find what they hoped to find. It is to be expected (and this research confirms it) that this process of dynamic gain and loss will subside after the first ten years of a congregation, when the membership settles into a certain balance.
Place-hypothesis: church planting furthers church growth because church plants are in better locations than other churches. This hypothesis is difficult to examine, given the complexity of the factor “location.” The BFeG evidence makes it clear, however, that city size as such does not make a difference when it comes to the growth of the churches established there. This is also true for the largest cities (Berlin, Hamburg, Munich, and Cologne), contrary to the expectation that these cities are favorable places for church growth. If we look with more precision at specific cities, however, we do see interesting differences. Berlin in particular appears to be a city where churches grow, in all three manners that we have been investigating here. This suggests that location is indeed an important factor in church growth, like much other research has indicated, but that we need more detailed and specific comparisons to make a case for this claim.
In terms of mission, this research points toward at least three important strategic conclusions. First, if churches want to grow through conversions, church planting seems a good strategy in general, while it must be remembered that some older churches can outperform any new church. Second, a church that wants to grow should equally invest in “member satisfaction” and “recruitment.” Church plants in particular must reflect on the right balance between welcoming new members and discipling them. Pastoral care, good theology, and building the congregation are just as important as evangelism or creating attractive worship. Third, it seems that denominations and mission organizations would do well to concentrate their planting efforts in the major cities, even if more research is needed to find out why some cities are better contexts for church growth than others.
Footnotes
Funding
This research received no specific grant from any funding agency in the public, commercial, or not-for-profit sectors.
Notes
Author biography