
Abstract
Customer-perceived value (CPV) has been a focal point in marketing literature, typically modelled as a reflective construct centred on the balance of benefits over costs, which in turn influences consumer satisfaction and subsequent behaviour. However, recognizing the multifaceted nature of CPV and its dependency on specific contexts, this study introduces a novel methodological approach by treating CPV as an emergent artifact. In doing so, we provide an alternative means to conceptualize and operationalize CPV, accommodating its diverse determinants across different sectors. Using data from an online survey of users of mobile food and delivery applications (MFODAs), we demonstrate the application and utility of this methodological shift, employing partial least squares path modelling (PLS-PM) to validate our approach. This study underscores the potential for marketing scholars to adapt and tailor the CPV construct based on the nuances of individual industries, offering both academic and practical insights into its formulation and implications.
Keywords
Introduction
In line with the marketing principle, the secret to attaining organizational objectives lies in outperforming competitors at generating, delivering and communicating superior value to the chosen target customer base (Kotler &Keller, 2008). So, research into value is fundamental in marketing, with a particular emphasis on customer-perceived value (CPV), given its subjective nature in the minds of customers. CPV is a multidimensional concept investigated in numerous fields, such as economics, psychology and marketing (Sánchez-Fernández &Iniesta-Bonillo, 2007).
Perceived value (PV) research began in the 1980s (Porter, 1985) and expanded further in the 1990s (Woodruff, 1997; Zeithaml, 1988). These studies demonstrate that PV plays an important role in consumer decisions when purchasing products and services. However, they are mainly from the perspective of cost-benefit analysis (Babin et al., 1994; Mathwick et al., 2001; Sinha &DeSarbo, 1998; Sweeney &Soutar, 2001). From a reflective approach, PV is often modelled as a second-order construct, including indicators of both benefits and costs. However, this approach falls short in enabling marketers to compare the weight of CPV. There is a pressing need for research centred more on practical solutions, addressing queries such as ‘how can we...?’ or ‘how should we...?’ as opposed to ‘how is it...?’ or ‘how does it...?’ (Henseler &Guerreiro, 2020). Design research predominantly adheres to a pragmatist paradigm and formulates questions in this way. Vargo et al. (2017) provide a valuable perspective by conceptualizing value as phenomenological, multidimensional and emergent, a viewpoint also outlined by Kotler (2020). Drawing on these dimensions, this study proposes an alternative method that treats CPV as an artifact and proposes its modelling as an emergent variable. By doing so, we introduce a flexible and context-sensitive framework that recognizes the inherent variability of CPV across different industries. This approach acknowledges that CPV can be formed differently depending on the specific context, such as distinct industries, allowing for an adaptation to the unique costs, benefits and customer value determinants present in each. As a result, businesses can tailor their strategies based on the nuanced and evolving factors that shape customer value perceptions in their respective sectors. Additionally, this perspective provides advantages such as capturing a comprehensive representation of the multidimensional nature of CPV, reflecting the diverse indicators that customers consider when determining value (Flint et al., 2002).
We provide empirical evidence to model CPV as an emergent variable, and we investigate its antecedents and consequences. This modelling approach, which diverges from traditional perspectives on CPV, offers a fresh lens to capture the fluid and context-dependent nature of how customers perceive value. Rooted in this novel methodological foundation, our research emphasizes the multi-faceted nature of CPV and acknowledges that it can evolve based on a myriad of external and internal influences.
By treating CPV as an emergent variable, our approach introduces a flexible and context-sensitive framework that adapts seamlessly across different industry landscapes. It recognizes that CPV formation varies based on specific contextual factors, including the industry’s unique costs, benefits and determinants of customer value. This ensures a more nuanced understanding of CPV, one that resonates more closely with the actual determinants that customers consider when evaluating value.
Furthermore, our research delves into both the antecedents that shape this emergent CPV and its subsequent consequences on other relevant outcomes, such as customer satisfaction. This comprehensive exploration provides businesses with a holistic view, empowering them to tailor their strategies more effectively based on evolving customer value perceptions.
Our study, therefore, not only contributes to the academic discourse on CPV by introducing a novel modelling approach but also equips practitioners with actionable insights to navigate the dynamic landscape of customer value perceptions.
Customer-Perceived Value as an Artifact
The concept of ‘value’ has been approached heterogeneously within the literature, subject to the diverse orientations of varying academic fields. Porter (1985), for instance, succinctly defines value as the price buyers are amenable to pay (Bevan &Murphy, 2001). Contrastingly, Rokeach delineates ‘value’ as the conviction of particular behaviour or circumstances being personally and socially superior to its alternatives. Within this discursive space, CPV engenders a category of marketing instruments, qualifying as human-made artifacts as posited by Henseler (2017, p. 178). Misra et al. (2022) adopt the ‘give’ versus ‘get’ framework to explicate marketing’s role in value creation for customers. This is conceptualized as the differential between customer-incurred costs and benefits. Predicated on a fundamental behaviourist assumption, a majority of marketing studies posit CPV as an artifact within design science, measurable as an emergent variable (Henseler, 2017). In alignment with this perspective, Vargo et al. (2017) describe value as an emergent construct, exemplified in the context of ride-sharing applications and wireless payment systems.
When considering its measurement, extant literature primarily operationalizes CPV as a reflective construct. This implies a causal effect of the latent variable on its manifest indicators, with less emphasis on the construct’s constituent elements. For example, Z. Yang and Peterson (2004) employed a set of items to measure CPV as a first-order construct within an e-commerce environment.
However, this measure falls short in pragmatic terms, failing to provide practitioners with insight into which dimension contributes more significantly to PV. Alternatively, H. Yang et al. (2016) adopted a distinct approach, delineating perceived benefits from perceived risks as antecedents of PV. While this approach provides practitioners with insight into constructs exerting stronger path coefficients on PV, the voluminous number of items mitigates its practicality.
To the best of our knowledge, no extant research has examined CPV as a formative, composite or emergent variable, potentially restricting its pragmatic value. Addressing this lacuna, our study endeavours to model CPV as an emergent construct, in line with Vargo et al. (2017) and Kotler (2020)’s propositions. This approach views CPV not merely as a latent variable but as an ‘artifact’, a construct shaped by multiple determinants and contexts that hold tangible significance in real-world scenarios.
Treating CPV as an artifact underscores its multifaceted and dynamic nature. It recognizes CPV’s susceptibility to changes in external and internal business environments, emphasizing its context-dependent formation and interpretation. By doing so, we offer a more holistic and nuanced perspective, shedding light on the myriad dimensions and components that converge to define CPV in varied business contexts.
Further, we provide a procedural demonstration of its treatment within a partial least squares context. This analytical approach facilitates a comprehensive representation of the multidimensional nature of CPV as an artifact, ensuring that its various facets are appropriately captured, measured and interpreted. Through this methodological lens, we aim to bridge the gap between academic theorizations of CPV and its practical implications, offering both scholars and practitioners a more grounded and actionable understanding of customer value perceptions.
Description of the Illustrative Example
Our study’s primary ambition is to offer a new methodological perspective on how CPV can be envisioned and modelled as an emergent variable. To do so effectively, it was vital to utilize a context that would allow us to draw a stark contrast between conventional reflective modelling and the emergent modelling approach we propose. This contrast becomes evident when we revisit a familiar model from the literature and reinterpret it through our proposed methodological lens.
The mobile food and delivery application (MFODA) context, which has been previously studied and validated in the literature, offers this opportunity. By employing a well-established model from this domain, we are able to draw attention to the methodological nuances and transformations that come into play when CPV is treated as an emergent construct. Furthermore, the simplicity of the model ensures that our readers can focus on the methodology without getting sidetracked by complex relationships or new constructs.
It is crucial to note that our primary contribution is not the introduction or testing of a new model. Instead, it is about showcasing how well-established constructs and models can be re-envisioned when CPV is treated as an emergent variable. Thus, the illustrative example of MFODAs serves to accentuate this methodological contribution, without introducing extraneous complexities that could distract from our study’s core message.
With this context in mind, we now delve into the background and hypotheses related to MFODAs. The popularity of MFODAs has dramatically increased over the past decade in various regions, both in developed and in emerging economies (Devanesan, 2021). In 2022, the global number of MFODA downloads was approximately 247 billion, with expectations for this figure to rise to 299 billion in 2023 (Statista, 2023a). Moreover, the worldwide number of food and beverage ordering app downloads amounted to about 717 million (Statista, 2023b). In 2021, the Turkish mobile food delivery sector brought in approximately $518 million in sales. According to the Statista Digital Market Forecast, Turkey’s digital market revenue is projected to keep growing and peak at $763.4 million US dollars in 2025 (Statista, 2023c). For this evolving technology industry, we investigate the CPV of MFODAs by developing a research model.
Studies such as Ban et al. (2022); Ryu et al. (2012); Teng and Wu (2019); H. Yang et al. (2016) have identified a positive relationship between PV and consumer behavioural intentions. When consumers are faced with new technologies, such as facial recognition payments, they tend to judge the overall usefulness of the application (Raza et al., 2019). If the technology makes sense, consumers are more likely to adopt it, indicating that PV can significantly enhance consumer behavioural intentions. Therefore, we propose the following hypothesis:
H1: CPV leads to word-of-mouth.
Customer satisfaction is an essential aspect of marketing. According to Oliver (1980), it is ‘a judgment that a product or service feature, or the product or service itself, provides a level of satisfaction with consumption, including insufficient or excess levels of fulfillment’. Research has shown that PV has a positive impact on customer satisfaction. Several studies have demonstrated a positive relationship between PV and customer satisfaction, including those conducted by Bagozzi (1992); Brady et al. (2005); Matsuoka (2022); Uzir et al. (2021); Wu et al. (2016). Therefore, we propose the following hypothesis:
H2: CPV leads to satisfaction.
The concept of customer satisfaction is closely linked to comparisons of the customer’s experience and their expectations (Guntoro &Hui, 2013). Consequently, it has been shown to have a direct influence on consumer behaviour (Jung &Seock, 2017) and is closely related to WOM interactions (Soleimani &Einolahzadeh, 2018). Several studies have demonstrated a strong correlation between customer satisfaction and WOM (Garcia et al., 2020; Huete-Alcocer, 2017; Yen &Wang, 2020). Therefore, we propose the following hypothesis:
H3: Satisfaction leads to word-of-mouth.
For service providers, customer re-patronage intention represents an important outcome (Mustak et al., 2013) that can be defined as the likelihood of a customer repeating an activity (Baker &Crompton, 2000). According to Ajzen (1991), the re-patronage intention is accepted as the immediate antecedent of the actual behaviour (Chiu et al., 2019). Studies have shown that there is a strong correlation between re-patronage intention and customer satisfaction (Akbar, 2014; Bolton, 1998; Hellier et al., 2003). Therefore, we propose the following hypotheses:
H4: CPV leads to re-patronage.
H5: Satisfaction leads to re-patronage.
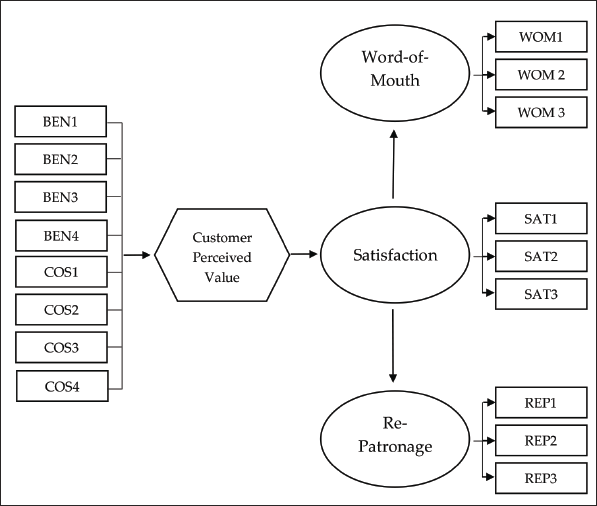
By considering the nature of the CPV artifact, we developed a simple illustrative example to present how it can be modelled as an emergent variable. Figure 1 shows the proposed research model that will be estimated and tested. Although previous partial least squares path modelling (PLS-PM) studies addressed more complicated models with more constructs, second-order constructs and/or moderation effects (Benitez et al., 2020), the proposed model appears to be appropriate for our purpose of presenting CPV as an emergent variable.
Research Model.
Measurement Development
We developed the items used to measure each construct in the model from the extant literature to improve the study’s content validity. Table 1 summarizes the constructs and the relevant items.
List of Constructs and Their Items.
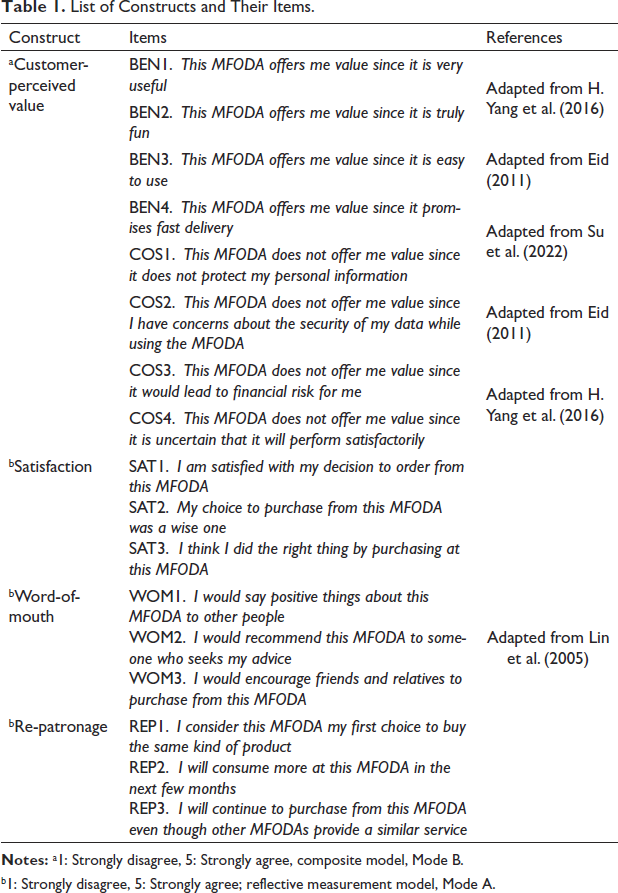
b1: Strongly disagree, 5: Strongly agree; reflective measurement model, Mode A.
Behavioural research variables such as personality traits, individual behaviour and individual attitude are typically modelled as latent variables (Churchill Jr, 1979). Therefore, satisfaction, word-of-mouth and re-patronage, which represent different forms of individual behaviour and attitude, were measured with three indicators each (Lin et al., 2005). These theoretical concepts were operationalized by reflective measurement models. The ovals represent latent variables, whereas the connecting rectangles stand for their indicators. We used PLS to estimate the reflective measurement models to get consistent estimates (Dijkstra &Henseler, 2015).
However, we regarded the theoretical concept of CPV, as previously explained. The composite model was used to operationalize CPV, with the assumption that it is made up of the following components: Usefulness, enjoyment, ease of use, fast delivery, privacy concern, security concern, financial risk and performance risk (Eid, 2011; H. Yang et al., 2016; Su et al., 2022). Marketing researchers and analysts from other contexts (e.g., smart wearables) may view social influence (an antecedent of the technological adoption model) as a major ingredient and may exclude other, less important value components for the chosen industry. This demonstrates the power of incorporating/studying several artifacts to examine the same phenomenon of interest in firms and society. The hexagon represents the construct (i.e., the emergent variable), whereas the rectangles represent the ingredients that form the construct, as suggested by Benitez et al. (2020).
Data Collection and Sample Characteristics
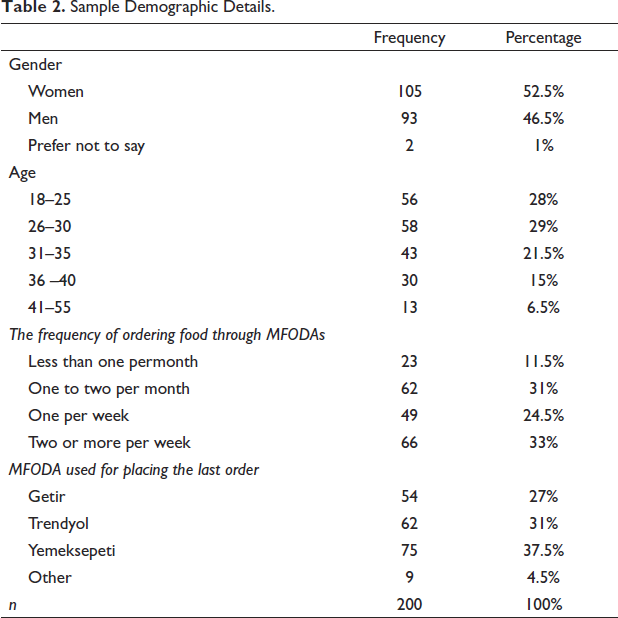
We conducted an online survey to gather information from MFODA users, evaluate our hypotheses and achieve our research goal. Considering the minimum sample size suggestions made by Hoelter (1983), Hair et al. (2011) and F. Hair Jr et al. (2014), we included 200 participants who order mobile food from their mobile devices. We chose to perform a web-based survey due to its convenience and cost-effectiveness, as it allows us to reach participants faster and to swiftly and electronically collect and store responses (Boyer et al., 2002).
The survey was distributed using Google Forms, which allowed for stringent control measures to ensure the quality and integrity of responses.
Before the actual survey distribution, a pretest was carried out with a small group of 10 students, who had already ordered from a MFOA. These participants were asked to provide detailed feedback on the clarity, relevance and comprehensibility of each question. Based on their inputs, refinements were made to the survey questions to ensure their appropriateness and effectiveness in eliciting the required information from the respondents.
In administering the main survey, we took several measures to overcome common online survey challenges. First, to prevent double responses, we limited the settings of the Google Forms survey to allow only one response per participant. This ensured that our dataset did not include duplicate entries from the same individual.
Second, to counteract potential issues with unmotivated or hastily completed responses, we endeavoured to keep the questionnaire concise and straightforward. This approach was believed to deter participants from providing less thoughtful and authentic responses.
Lastly, to address the problem of proxy responses, we included a clear statement at the beginning of the survey, emphasizing that the survey should be completed by the person to whom it was sent, and that their honest and personal responses were essential. We also emphasized the anonymity of their responses to encourage honesty and personal input.
Using a snowball sampling technique that is popular in social science research, we gathered the data online (Biernacki &Waldorf, 1981). During this fieldwork, the respondents referred other participants who had also adopted MFODAs. Table 2 summarizes the details about the sample characteristics.
Sample Demographic Details.
Estimation
We used ADANCO 2.3.2 Professional for Windows (
Evaluation of the Overall Fit of the Saturated Model
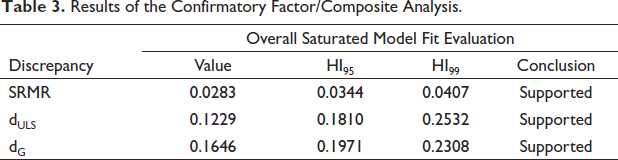
Throughout the analysis, we followed the steps suggested by Benitez et al. (2020). We commenced the evaluation process by examining the overall fit of the model compared to a saturated structural model. We examined the internal consistency, convergent validity and discriminant validity of the structural model prior to testing. We initially looked at the confirmatory factor/composite analysis. To determine the validity of the measurements and the composite models, we assessed the saturated model’s overall model fit. The SRMR value, which was 0.0283, fell below the recommended threshold of 0.080 (Henseler et al., 2014). Table 3 summarizes the analysis.
Results of the Confirmatory Factor/Composite Analysis.
Assessment of the Reflective Measurement Model
We analysed the composite reliability using Dijkstra-A Henseler’s values. Table 4 shows that Dijkstra–Henseler’s ρA values for satisfaction, word-of-mouth and re-patronage indicate reliable construct scores.
Measurement Model Evaluation.
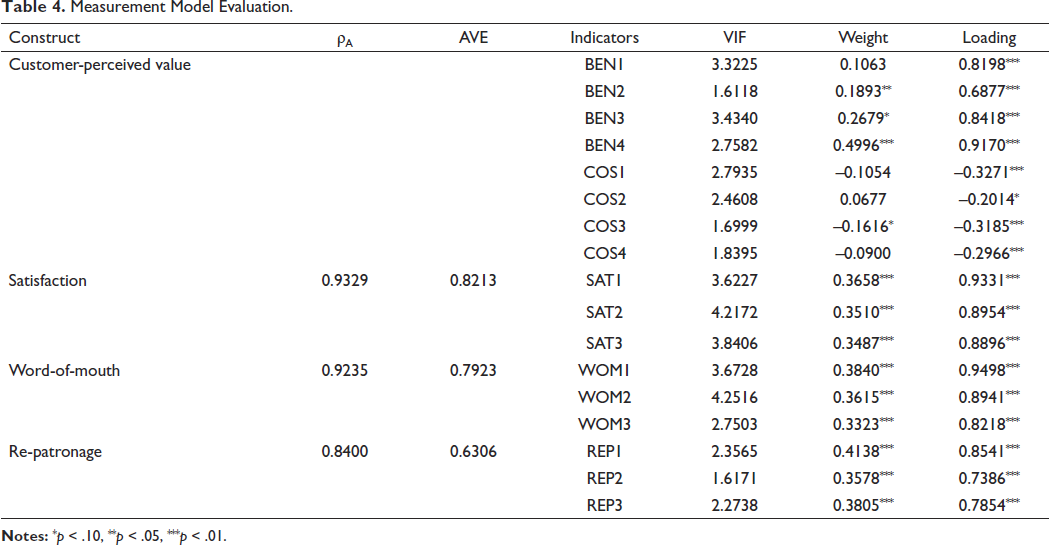
To examine the convergent validity, we used the average variance extracted (AVE), where values that are above 0.5 indicate convergent validity.
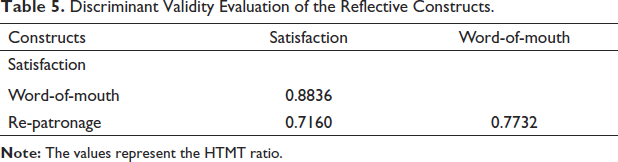
To assess the discriminant validity, we considered the Heterotrait-Monotrait (HTMT) ratio proposed by Henseler et al. (2015). As shown in Table 5, the HTMT ratios of satisfaction, word-of-mouth and re-patronage in our sample range from 0.71 to 0.88. Although the HTMT of satisfaction to word-of-mouth is higher than the threshold of 0.85, it is still below 0.90 because the constructs are conceptually very similar. Furthermore, the HTMT’s one-sided 95% percentile confidence interval is less than 1. Therefore, we can conclude that the reflective constructs are discriminately valid.
Discriminant Validity Evaluation of the Reflective Constructs.
Assessment of the Composite Model
We followed Benitez et al.’s (2020) guidelines to assess the composite model, which requires an evaluation sui generis. Hence, we investigated it with respect to multicollinearity, weight, composite loading and significance.
After estimating the composite model and CPV using Mode B in PLS-PM, we must check for collinearity among indicators using the variance inflation factor (VIF). The VIF values CPV within our example range from 1.61 to 3.43; since they are below 5, we can conclude that they do not indicate problematic multicollinearity.
On the one hand, all composite loading estimates presented the expected sign and are significant at 1 per cent significance level. On the other hand, the weight estimates of the four indicators (i.e., enjoyment, ease of use, fast delivery and financial risk) are significant. Since the factor loading estimates for these indicators are significant and their inclusion is essential for content validity, we decided to retain them in the subsequent empirical analysis. If faced with this type of situation, researchers may repeat the analysis by excluding the questionable indicators and investigating whether retaining or removing them has an impact on the results. Furthermore, we analysed the structural model because all of the reflective measurements and composite models in our example have desirable properties.
Assessment of the Structural Model
To evaluate the structural model, we investigated the overall fit of the estimated model, the path coefficient estimates, their significance, the effect sizes (f2) and the coefficient of determination (R2). Table 6 summarizes the results of the structural model evaluation.
Structural Model Evaluation.
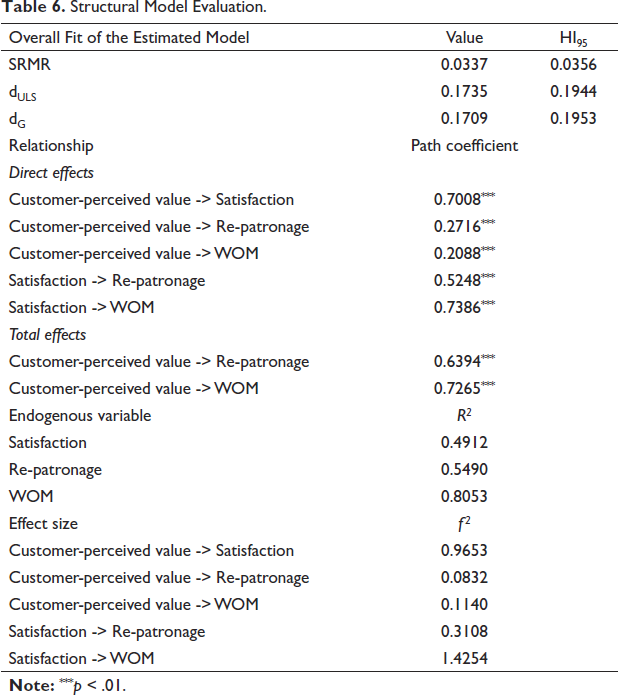
The estimated model was not rejected at the 5 per cent significance level because all values of discrepancy measures were below the 95 per cent quantile of their corresponding reference distribution (HI95). Furthermore, the SRMR demonstrated an acceptable model fit that was below the suggested preliminary threshold of 0.080. This result indicates that the proposed model is well-suited to confirm and explain the role of CPV in relation to satisfaction, word-of-mouth and re-patronage.
In our example, the path coefficient estimates for the hypothesized relationships range from 0.21 to 0.74 and are significant at a 1 per cent level. Furthermore, the total effects of the CPV on re-patronage and word-of-mouth are 0.64 and 0.73, respectively, and are significant at a 1 per cent level.
Regarding the coefficient of determination, the R2 value of 0.49 for satisfaction means that the CPV explains 49 per cent of variance in satisfaction. Similarly, the R2 values of 0.55 and 0.81 explain 55 per cent and 81 per cent of variance in re-patronage and word-of-mouth, respectively.
Discussion
The paradigmatic underpinning of this research, centred around design science, offers a fresh perspective on the conceptualization and operationalization of CPV. In dissecting the implications of our findings, we delve into both the domains of research and practice.
A salient implication for research resonates with Henseler and Guerreiro (2020)’s assertion: the compelling need for marketing research to transition towards a more pragmatic paradigm, emphasizing not just observation but actionable solutions and forward-looking inquiries. Our research is firmly based on design science ideas and is a perfect example of this new way of thinking. We are strongly urging other researchers to change their research methods in a similar way.
Moreover, the presentation of CPV not as a mere static construct, but as an emergent variable, plants the seeds for myriad novel investigative avenues. This perspective compels the academic community to approach CPV with a lens of dynamism and evolution. While our work has laid down an illustrative model, the canvas remains vast. By including different factors, from basic details like age to more complex situations, we can gain a better and more detailed understanding of what influences CPV.
Our research also underscores the untapped potential and relevance of the design science methodology within the realm of marketing research. By echoing the perspectives of well-respected experts like Vargo et al. (2017) and Kotler (2020), we aspire to pave a roadmap for fellow researchers to embark on this enriching journey.
On the practical front, our findings hold significant ramifications. The spotlight on specific facets of CPV that wield substantial influence serves as a beacon for businesses. With this insight, they can strategically channel their resources, ensuring that they amplify those arenas that directly boost customer satisfaction and loyalty. Furthermore, the emergent nature of our CPV model offers a beacon for marketing professionals. It provides them a flexible tool, which allows them to create CPV evaluations that perfectly fit the unique needs and changes of their industries. In a rapidly evolving market landscape, understanding and harnessing CPV in its multifaceted form becomes pivotal. Equipped with this knowledge, businesses can formulate strategies that resonate deeply with market shifts, ensuring sustained relevance and impact.
Moreover, the very essence of design science, which revolves around aligning solutions with specific needs, presents businesses with tangible market opportunities. Embracing this perspective in conceptualizing CPV can become a lighthouse, guiding firms towards the effective matching of technologically feasible solutions with latent or manifest customer needs, eventually culminating in value creation and capturing lucrative market opportunities.
In conclusion, this study, firmly rooted in design science and driven by a pragmatic worldview, not only unveils a unique lens to view CPV but also offers a bevy of implications for both the research community and industry practitioners. As we echo the sentiment for a paradigm shift in marketing research, we remain hopeful that our contributions will catalyze deeper inquiries and innovations in the realm of design science, ensuring enhanced customer value and superior market outcomes.
Conclusion
Our research, grounded in the principles of design science and shaped by a pragmatic worldview, resonates with the definition of design science by Brown (2008). This perspective advocates using designer’s methods to match people’s needs with technologically feasible solutions, thereby creating customer value and market opportunities.
The application of Partial Least Squares Path Modelling (PLS-PM) in our research permitted us to delve deeply into the relationships between CPV and its antecedents and consequences. This robust approach accentuates the necessity for more adaptive frameworks in assessing multifaceted constructs, illuminating CPV’s multidimensional and emergent nature.
For the research community, our study signifies a starting point for further exploration. We urge scholars to not only adopt the design science approach but also to consider the myriad opportunities for extending the proposed CPV model.
Concluding, this research contributes both academically and pragmatically to the field of marketing. Through our study’s lens, we envision stimulating further design science inquiries within marketing, with the ultimate goal of fostering enhanced customer value and favourable market outcomes.
Footnotes
Declaration of Conflicting Interests
The authors declared no potential conflicts of interest with respect to the research, authorship and/or publication of this article.
Funding
The authors disclosed receipt of the following financial support for the research, authorship, and/or publication of this article: The authors are grateful to Erasmus University Rotterdam for covering the open-access article processing charge.