
Abstract
The background to this article is a quantitative model for data-driven value creation that conceptually explains a holistic approach to finding optimal data-driven service configurations along the customer lifecycle by modeling both provider and customer value and identifying the optimum on the Pareto front. This model, which provides an artifact for service optimization in an iterative design process, is characterized by different inputs that model the costs and benefits of providers and customers depending on different intensities of data usage for services in the respective phases of the lifecycle. In this article, we analyse empirical industrial service configurations by applying the quantitative model and derive insights for optimizing value creation. The analysis shows that this optimization leads to solutions that are not simply achieved by maximizing the intensity of data usage of individual services, but by specifically optimizing the reconfiguration of operant resources along the lifecycle. This enables an overall optimization in a designoriented, iterative approach that differs significantly from standard models that target ascending levels of intensity and maturity of digitization.
Introduction
Industrial value creation is transforming companies from selling products and equipment to selling services that are based on them. Manufacturers are trying to create more revenue by selling services before the actual sales moment (e.g., consulting) or thereafter (after-sales services), in particular in the business-tobusiness (B2B) area (Ulaga & Kowalkowski, 2022; Witell, 2021). This is in line with helping the customers to better achieve their goals, for example, in terms of output, quality achieved or reduced down times. The services are typically implemented in the form of so-called pay-per-use or pay-per-output service models (Adrodegari et al., 2021). Hence, new industrial service models create value for the actors of an ecosystem. However, since the service value flows between the provider and the customer are complex and time-dependent and also change the cost structure, finding which service constellation provides the best value for provider and customer in a combined way is not trivial or obvious.
Design-oriented approaches like design science, design science research (DSR), or design thinking are concerned with the knowledge to generate solutions for relevant managerial problems. They draw on observation of practices and scientific knowledge and work in iterative processes with artifacts that can be, for example, models, simulations, or actionable instructions, such as described in (Goecks et al., 2018). Design approaches can be applied towards the improvement of aspects such as processes, smart services, or customer relationships.
In this article, an artifact based on a quantitative computational model will be applied and numerically evaluated for specific company cases. The goal of this evaluation is to design the company’s development towards optimized industrial service constellations along the customer lifecycle. The article is organized as follows: in section ‘Value Creation by Industrial Services’ we frame the topic of digital services in industrial contexts, followed by a review of the quantitative model which is the starting point of this study in section ‘The Value of Data in Industrial Service’, followed by the sections ‘Research Question’ and ‘Research Methodology’. The empirical cases are discussed against the quantitative model in section ‘Discussion of Empirical Findings and Cases against Quantitative Model’, followed by a final discussion, the conclusions and the outlook.
Value Creation by Industrial Services
The shift to mutual value creation by services is conceptualized by the theoretical framework of the Service-Dominant Logic (S-D L) (Vargo & Lusch, 2004). In this context, operant resources are resources that act on other resources and contribute to value creation, that is, technology (Akaka et al., 2019) or human knowledge and skills (Vargo et al., 2008). Data and analytics for service value creation are considered operant resources.
The convergence of digitalization and servitization enables smart productservice systems (PSS) (Pirola et al., 2020). According to (Porter & Heppelmann, 2014), value for customers may be created at 4 digitalization levels with different value creation mechanisms:
Monitoring: providing information about the customer equipment, for example, the service provider can observe the status or condition of the customer equipment. Control: establishing a feedback loop to control the equipment based on the results of the monitoring. Optimization: following a maximization or minimization goal for the customer equipment, such as number of units produced per time or energy used. Autonomy: self-organized customer equipment or systems.
The Value of Data in Industrial Service
Value Creation Models
There are various approaches for defining different dimensions of value creation (Leroi-Werelds, 2019). (Sweeney & Soutar, 2001) define the 4 value dimensions: (a) emotional; (b) social (enhancing the self-concept); (c) economic (financial); and (d) functional (performance-related) value. The literature presents different approaches for accounting the value of data (e.g., Moody & Walsh, 1999; Breuer et al., 2018; Möller et al., 2017). A typical scheme differentiates between: (a) cost-based value of data; (b) market-based; and (c) utility-oriented. The utility-oriented approach considers the value in use in terms of economic benefits and is aligned with the functional value as described by (Sweeney & Soutar, 2001). As data-driven, industrial services are particularly focused on achieving a desired output for the customer, the utilityoriented approach for accounting the value of data is adequate for describing the value creation by these services.
The literature proposes models for quantifying and measuring the service value along the customer lifecycle, such as (Lemon & Verhoef, 2016; Mourtzis et al., 2018). A quantitative modeling approach for value creation is proposed in (Roels, 2014). Modeling the costs along the phases of the customer lifecycle by a mathematical vector is discussed by (Levin et al., 2000). Quantitative models for linking acquisition efforts, provision costs and service revenues with customer lifetime value are described in (Malthouse & Blattberg, 2005; Rust et al., 2004). However, the application of these models in the context of a service design process for concrete service systems as well as the quantitative evaluation and optimization of value creation in these systems are not described in the literature and represent a research gap that is addressed in this article.
Quantitative Model for the Value of Data in Service Ecosystems
This article is based on a recently proposed quantitative model for value creation by (Meierhofer et al., 2022). The model presents a novel approach for formalizing value in a service context and identifying optimal data-driven service configurations. This is done by considering the values for the customer and the provider independently and by a multi-criteria optimization that defines optimal constellations as solutions on the Pareto front (Miettinen, 2008). Solutions on the Pareto front are optimal in the sense that the value for the customer can only be improved by accepting a deterioration of the value for the provider and vice-versa.
The customer generates data with his or her processes and equipment and shares this data with the provider (Figure 1). The provider processes and analyses this data for two purposes: First, to create additional service value and to capture value by additional fees. Second, to improve his or her own processes (more effective and/or efficient marketing or service processes) by utilizing data.
Conceptual Model for Valuation of Data in Service Exchange.
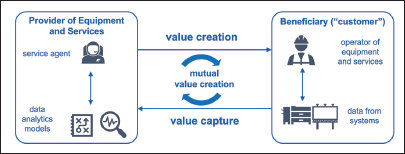
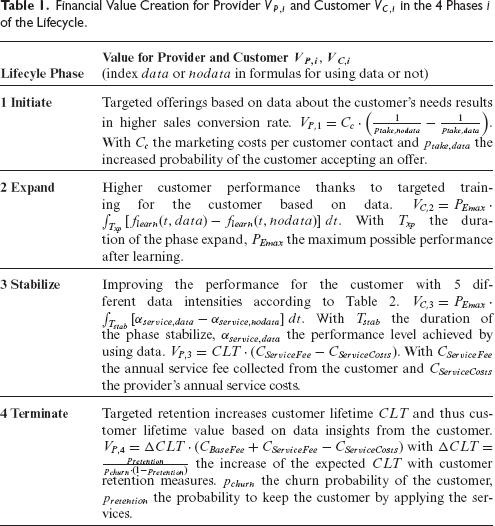
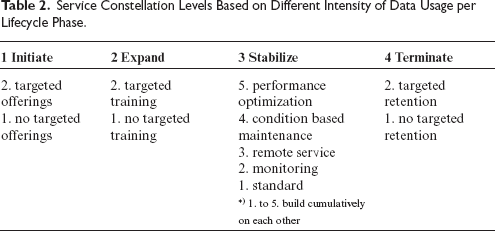
The mutual service value between the provider and the customer is created over time, which is described by the 4 phases of the customer lifecycle ‘1 Initiate’ (pre-sales), ‘2 Expand’ (customer gets acquainted with the equipment and increases the performance over time), ‘3 Stabilize’ (customer utilizes the equipment for multiple years), and ‘4 Terminate’ (customer gives up or replaces the equipment including reverse logistics).
The financial value captured by the provider V
P
is given by
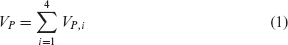
with V
P,i
representing the value captured in phase
The value
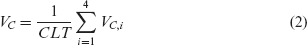
with
Quantification of Mutual Value Creation per Lifecycle Phase
Both
The combination of these levels results in
Research Question
Given the concepts for data-driven, industrial services and the model for quantitatively assessing their contribution to mutual value creation, the goal of this article is to elaborate how the framework discussed in section ‘Quantitative Model for the Value of Data in Service Ecosystems’ enables a systematic analysis of the potential of data in industrial provider-customer relationships. This includes understanding how the model as an artifact supports an iterative, design-oriented approach to optimize mutual value creation and which specific reconfigurations of using data and other operant resources for the services along the customer lifecycle can be used for these iterations. This analysis is intended to clarify where and why improvements can be achieved along the way of this iterative design process.
Financial Value Creation for Provider
and Customer
in the 4 Phases
of the Lifecycle.
Service Constellation Levels Based on Different Intensity of Data Usage per Lifecycle Phase.
The goal of the article is not to derive conclusions about optimal configurations of smart services, neither in general nor for specific companies, as this depends heavily on the specific cases that are reflected in the different parameter values of the quantitative value generation model.
Research Methodology
The model discussed in this study is based on the previous study (Meierhofer et al., 2022) and is summarized in section ‘Quantitative Model for the Value of Data in Service Ecosystems’. As the purpose of this article is to discuss this model in specific practical situations, a qualitative empirical study was applied to understand how companies use data for value creation along the lifecycle. Therefore, informal interviews were conducted with eight firms to understand how they quantify the value of data specifically related to the quantitative model.
First, the insights of these interviews were used to describe characteristic service constellations in relation to the parameterized model that may occur in practical cases. Second, the goal of the investigation of these eight firms was to discuss potential reconfigurations of these constellations for improvement on the basis of the model. This analysis was used to evaluate service design hypotheses in iterative steps and to draw conclusions for management decisions that are not obvious with regard to value optimization.
Since the goal of the empirical study was not to analyse the content of specific companies or markets, but merely to obtain examples for model application, opportunistic sampling was used. The eight firms are located in the German-speaking part of Switzerland and produce or operate technical equipment for mechanical engineering or building operations. Five of the companies are small or medium-sized enterprises, while three of them are larger medium-sized enterprises but still clearly below corporate size.
Discussion of Empirical Findings and Cases against Quantitative Model
Conclusions from Interviews
The aim of this assessment was to find out whether and how companies understand the possibilities for creating value along the phases of the lifecycle in practice and which level of the service constellations they apply. The exchange with the companies clearly showed that they do not have sufficiently accurate numerical values of the variables described in section ‘Quantification of Mutual Value Creation per Lifecycle Phase’. Where they made rough quantitative statements, the data collected actually consisted of a rough probabilistic indication of the benefits (instead of base data from which the distributions could be derived). However, they were able to specify the level of data intensity they apply according to Table 2 quite well. The findings are summarized in Table 3.
Based on 8 Interviews: Service Constellation Level (i.e., Utilization of Data) for Value Creation Based on a Sample of Eight Firms. The Number in the Table Describes the Level of the Service Constellation According to Table 2.
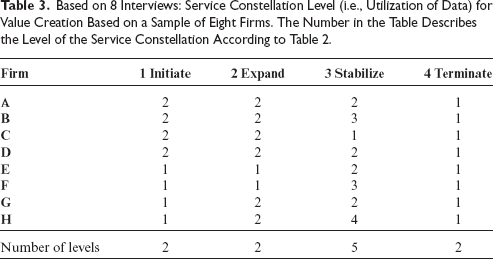
It became evident that the firms in the sample are not sufficiently aware that when designing their services along the lifecycle there is a trade-off between the resource configurations among the phases. None of the cases covers all phases systematically. The firms base their design on the assumption that doing more would generally create more value. But they are not able to arrive at a factbased design of their resource configurations because they lack a methodology like the design-oriented framework described in this article.
Discussion of Empirical Cases Against the Quantitative Model
Using the model and service configurations described in section ‘Quantitative Model for the Value of Data in Service Ecosystems’ as a generic example and locating the eight company cases A to H in the resulting scatter plot (Figure 2) allows us to discuss how these cases relate to the Pareto optimum and how they could change their service constellations to get closer to the optimum.
First, it becomes obvious that all cases except firm B are sub-optimal (i.e., below the Pareto front), which means that they can improve in one dimension ( For firms A and D (located in the same service constellation (2, 2, 2, 1) to move to the Pareto front: They could spend more effort in phase ‘3 Stabilize’ by changing from a simple monitoring service to remote service (moving to point (2, 2, 3, 1) on the Pareto front), for example, by providing help and prescriptions to the customer how to apply specific maintenance measures. This can potentially overload the human resources available to the provider (firm A or D). Alternatively, firms A and D could decide to reduce their effort in phase ‘2 Expand’ and allocate the operant resources freed up (i.e., the experts and technology) to provide remote service in phase ‘3 Stabilize’ (i.e., move to Pareto-optimal point (2, 1, 3, 1)). Firm B, although already located on an optimum point on the Pareto front with (2, 2, 3, 1), could be faced with the situation that customers require more value Firm B could move up the Pareto front to point (2, 1, 4, 1) with a higher data intensity level in phase ‘3 stabilize’ by introducing a condition based maintenance service. They could do this with operant resources freed up from eliminating the targeted training service in phase ‘2 Expand’. Firm C seems to operate in a market with lower competitive intensity and can afford to create relatively low customer value As long as the competitive intensity is low, they can decide to capture even higher value for themselves by moving to point (2, 1, 1, 2), while slightly reducing If the intensity of competition is not weak, it would be advisable for firm C to introduce a higher service constellation level in phase ‘3 stabilize’ by providing remote service. They could make resources available for this by giving up targeted training in phase ‘2 Expand’ and thus move to point (2, 1, 3, 1) on the Pareto front (i.e., by reconfiguring operant resources). Firm H, which already creates very high customer value In any case, they need to introduce targeted offerings in phase ‘1 Initiate’, thus moving to point (2, 2, 4, 1). If, additionally, they change to a performance optimization service in phase ‘3 Stabilize’, they could even increase the already high value However, the latter change is demanding in terms of operant resources. Therefore, firm H could potentially also recognize that their market is not utterly competitive and that they could risk creating a bit less value for the customers by reducing their human and technical operant resources in phase ‘3 Stabilize’ and going back to a much simpler remote service on point (2, 2, 3, 1). The operant resources then freed up in phase 3 could be used for running the targeted offerings in phase ‘1 Initiate’.
Service Constellations of Practical Cases with Trajectories Towards Pareto Optimal Cases.
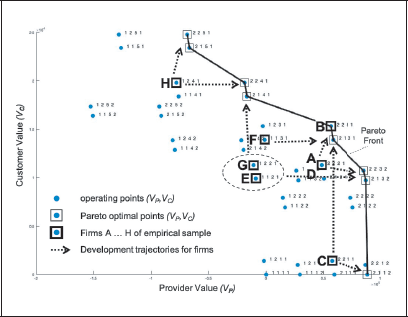
The trajectories for cases E, F, and G could be discussed analogously.
Discussion of Findings
Trading off Operant Resources for Service Value vs. Striving for Higher Service Maturity
The trajectories discussed in section ‘Discussion of Empirical Cases Against the Quantitative Model’ are non-obvious trade-offs for reaching an optimum point on the Pareto front by specifically reconfiguring the operant resources, that is, by not simply spending more effort in specific phases of the lifecycle without reduction in others. The discussion showed that often, the firms might reduce their service and thus free up operant resources in one phase and potentially reallocate them in another in order to create more value. This is important because reaching any given optimum point on the Pareto front is not always feasible for a firm, even if it creates more value for all actors, because of resource limitations.
Additionally, even without these resource constraints, ‘doing more’ is not always better. Value optimization can also mean reduction on one side to do more on another. Moving along the points on the Pareto front shows that mutual value creation can stay optimal in the Pareto sense by reducing the service resources in one phase while increasing them in another. This is in contrast to the numerous existing maturity models for smart manufacturing including Industry 4.0 and smart service concepts that exist in the literature. A review of different maturity models is provided in (Mittal et al., 2018). These various models have in common that they rank the development in ascending order, whereby more intensity (e.g., more services, more data usage) is ranked higher.
However, the framework applied in this article shows that such a maturityoriented approach can lead to sub-optimal constellations that destroy value instead of creating more. By way of example, this can be shown using the case of firm H, starting at point (1, 2, 4, 1). The philosophy of ‘doing more is better’ would, taken to its furthest development, move this firm to point (2, 2, 5, 2), which is further away from the Pareto front than the point of departure.
Thus, the model applied in this study serves as an artifact for the valuation of a service constellation and making data-based decisions on how to further develop the services for value optimization in a design-oriented process. In particular, the discussion of the trajectories discussed in Figure 2 shows that in many cases there are several ways for approaching an optimal state. Applying the artifact given by this quantitative model helps companies finding a designoriented, iterative way to optimization that fits their context.
Conclusions and Future Research
The discussion of the eight firm cases showed that all except one case were below the optimum on the Pareto front. The companies can move to an optimum point by selectively adapting their configuration of operant resources (i.e., data intensity or human resources) along the lifecycle. Interestingly, this does not necessarily mean generally increasing the resource intensity for achieving more value. For 6 of the 8 firm cases, trajectories to optimal points could be found that involved selectively reducing the resource intensity in some phases and increasing it in others. Depending on the type of operant resources required, this can open doors for companies to reallocate existing resources from one lifecycle phase to another.
The discussion of the application of the new model shown in this article has several practical implications. First, it shows that in most cases, service configurations chosen by companies are not optimal and can be improved by selective measures. Second, it becomes evident that for achieving optimal value creation, companies do not necessarily need to increase the operant resources (in particular the level of data intensity) in all cases, since there may be interesting development paths that can be achieved by systematic reconfiguration of resources that also comprises specific effort reduction in some areas. The article discussed how this reconfiguration clearly varies from the approaches offered by typical data maturity models, where it is assumed that generally higher intensity is required for higher value. Thus, the new model enables firms to find a new strategic way to achieve optimal value creation with data-driven services by applying it as an artifact in an iterative, design-oriented way. The discussion of the individual company cases showed that the model offers particular help in designing and assessing intermediate stages on the way to the optimum. For each intermediate stage as well as for the possible target stages, an assessment and reorientation can be carried out with the help of the model artifact. The model informs managers where to reduce the intensity of using data and human resources for services and where to increase it, and quantifies how much value will be created by this.
Based on the findings of this study, the following topics lend themselves to further research:
Adapting the phases of the lifecycle and the services including the intensities of data and other operant resources to specific industries and branches. Developing a methodology for empirical data assessment with firms, in particular for specific numerical values of the input variables. Extending and applying the model to an ecosystem perspective with multiple actors and thus mutual value creation consisting of multiple value flows. Extending the quantitative model to comprise the potentially negative or positive ecological and social impact of the services and evaluating the model based on empirical data for these.
Overall, we can conclude that the analysis framework has a high potential in specific applications and supports a design-oriented approach for value optimization through industrial smart services.
Footnotes
Acknowledgements
Declaration of Conflicting Interests
The authors declared no potential conflicts of interest with respect to the research, authorship and/or publication of this article.
Funding
This study was partly supported by the grant ‘ABH097’ within the framework of the Interreg VI-programme ‘Alpenrhein-Bodensee-Hochrhein’ (DE/AT/CH/LI) whose funds are provided by the European Regional Development Fund (ERDF) and the Swiss Confederation. The funders had no role in study design, data collection and analysis, decisions to publish, or preparation of the manuscript.