
Abstract
The Net Zero Emission goal by 2050 as per the Paris Agreement limits the global temperature rise to 1.5°C which requires the decarbonisation of the energy sectors. This article evaluates one of the key technologies, the fuel cells that can abate the global emissions of the highest emitting sectors, the transport and power industry. The article compares the fuel cells to incumbent technologies in terms of cost competitiveness, maturity, infrastructure availability, economic barriers in deployment at scale and the public policies for decarbonisation. The global energy demand is expected to increase almost 50% by 2050. If the emissions remain unabated the levels are expected to be doubled when compared to preindustrial levels, and a 35% increase to present emission levels which would result in an increase in global temp of 4.5°C–5.7°C.
Keywords
Introduction
The Net Zero Emission (NZE) goal by 2050 as per the Paris Agreement limits the global temperature rise to 1.5°C which requires the decarbonisation of the energy sectors. This article evaluates one of the key technologies, the fuel cells that can abate the global emissions of the highest emitting sectors, the transport and power industry. The article compares the fuel cells to incumbent technologies in terms of cost competitiveness, maturity, infrastructure availability, economic barriers in deployment at scale and the public policies for decarbonisation. The global energy demand is expected to increase almost 50% by 2050. If the emissions remain unabated the levels are expected to be doubled when compared to preindustrial levels, and 35% increase to present emission levels which would result in an increase in global temp of 4.5°C–5.7°C.
We analyse the technical and economic challenges in deployment of fuel cells at scale that can potentially abate 60% of the emissions among the different energy sectors, by comparing the total cost of ownership of each fuel cell technology with its potential incumbent technology, the technology readiness level and maturity in terms of the patents landscape. The analysis is done through secondary research and literature review of the studies published by IEA, U.S. DoE, EEA, EPA, NREL, IRENA, governmental websites and such sources, journals and latest reports for energy published by these public departments. The fuel cells have applicability in all sectors of energy and power generation from backup power to centralised power generation and transport with zero emissions.
The fuel cell at present is a fairly mature technology with higher capital and operational costs because of fewer economies of scale and lesser infrastructure availability. The fuel cell technology at present is neither commercially viable nor has it fully achieved the readiness level. The average FC technology TRL level at present is 5–8 across different applications and around 5–10 times more expensive than incumbent technologies. The advantages of fuel cells regarding lesser maintenance costs and longer lifetime for power generation and longer ranges compared to electric vehicles does not compensate for the higher capital costs.
The governments need to prioritise the energy sectors to abate the emissions in the first place and set stringent goals for the NZE scenario. There is a need to increase the awareness about carbon free technologies among the public and private investors. Public buildings and spaces should be equipped with emission free technologies at the earliest to promote the technologies, build initiative and increase the economies of scale. Fuel cells will not become cost competitive until there are significant economies of scale. The energy sectors in future will not be the same as today and to remain competitive and profitable in the energy sector, it is necessary for clients to shift the focus towards low carbon and hydrogen market advisory solutions.
In this article we conduct a techno economic review of the hydrogen applications in the energy sector, analysing the key technology of fuel cells, which is a primary hydrogen application. The increasing carbon emissions place a dire need to decarbonise the energy sectors at the earliest, which requires the implementation of carbon free technologies for power generation and transportation, the two major energy consuming sectors. The report will provide an insight into the fuel cell technologies, its applicability for different sectors over various power ranges, commercial and economic viability to incumbent technologies and technological risks and infrastructural challenges in deployment of fuel cells at scale.
Background
Carbon Emissions are the primary driver of global climate change and play a crucial role in maintaining our ecosystem, and whose excess levels cause damage to the environment. CO2 like other greenhouse gases (GHG) absorbs radiation and prevents heat from escaping from the atmosphere. Out of all GHG, CO2 puts us at the greatest risk of irreversible changes if it continues to accumulate unabated in the atmosphere, which highlights a growing concern to reduce carbon emissions and the resultant carbon footprint. This leads us to reduce emissions with technology or less emitting equipment, or by reusing the waste energy to minimise the footprint. The world at present emits around 50 billion tonnes of GHG each year. However, the regions and countries contribute to different levels of emissions, and the sectors emit different levels of CO2. In 1950, the world emitted 6 billion tonnes of CO2, and by 1990 it quadrupled reaching around 22 billion tonnes. In 2018, we emitted over 40 billion tonnes of GHG, due to fossil fuels and land use change combined where the fossil fuels were the biggest contributor for over 36 billion tonnes.
At the regional level, Asia is the biggest contributor to global emissions contributing almost 53% of the global emissions, followed by North America with 18% and then Europe with 17% emissions (Ritchie et al., 2020).
Problem Statement
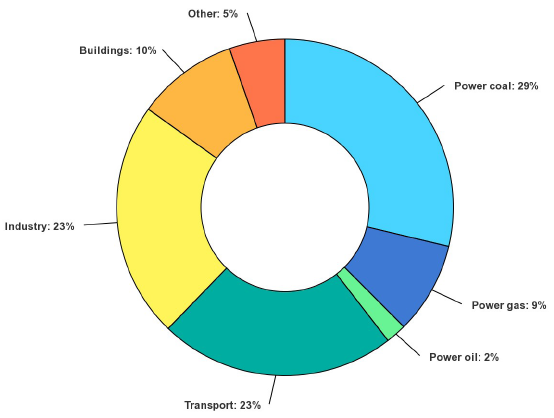
The emissions vary by different sectors of energy with the power generation sector being the highest emitting sector followed by industrial processes and transport, as depicted in Figure 1 (IEA, 2021a).
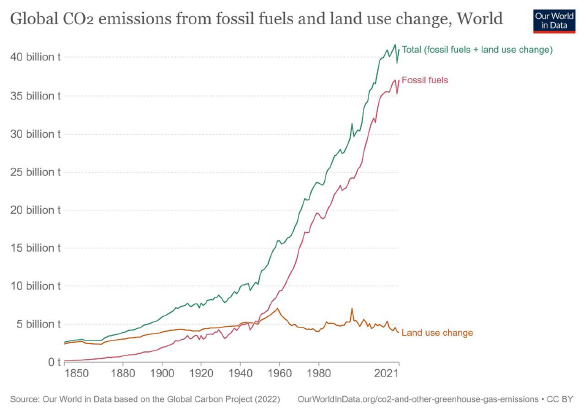
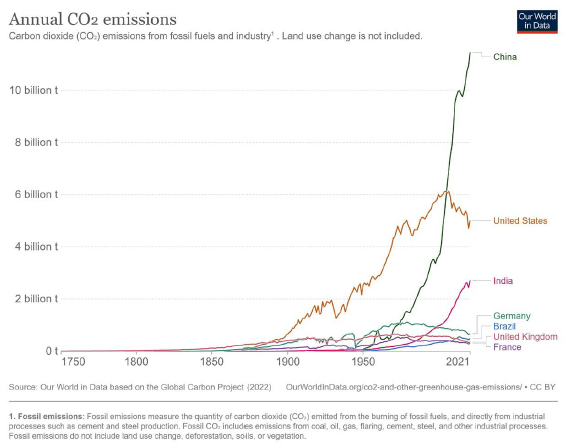
The fossil fuels produce most of the emissions as highlighted by Figure 2. The international treaty adopted by 196 parties at COP 21 in Paris on 12 December 2015 is a legal binding on climate change which limits global warming to well below 2°C, preferably to 1.5°C, compared to preindustrial levels. This brings all nations into a common cause to undertake ambitious efforts to combat climate change and adapt to its effects. To direct efforts towards the long-term goal, this agreement invites countries to formulate long-term low greenhouse gas emission development strategies (LT-LEDS). Different regions contribute differently to the emissions as shown in Figure 3. Therefore different regions have to take different steps for abating their emissions. The Paris agreement reaffirms that developed countries should take the lead in providing financial assistance for the goal, realising technology development and transfer for improving resilience to climate change and reducing GHG emissions and emphasise on climate related capacity building. By 2030, zero-carbon solutions would be competitive in sectors representing major emissions of around over 70% of global emissions (European Commission, n.d.).
Technological and Economic Ramifications
These highest emitting sectors, the power industry and transport need to be decarbonised, and the conventional technologies running on fossil fuel as energy source and their energy consumption methods need to be replaced either with carbon free fuel or more efficient technologies producing lesser or zero emissions. To address this issue hydrogen is seen as a pivotal energy source that has the potential to abate emissions and achieve the NZE Scenario as per the Paris agreement. Hydrogen is an element that is abundant in nature and has the potential to produce clean and green energy with a huge potential of application in sectors that produce highest emissions.
Hydrogen can be used as fuel for some technologies like fuel cells, which are more efficient and produce zero emissions. Fuel cells are seen as key solutions for the 21st century that enable clean and efficient production of energy in the form of power and heat from a range of primary energy sources. Fuel cells are electrochemical devices that use hydrogen and converts the chemical energy to electric energy along with heat. Fuel cells began to become commercial in various applications in 2007 and gained huge importance in material handling equipment applications, such as forklifts, portable applications and CHP applications. Over the last few years, the shipments of fuel cells have accelerated rapidly (Giorgi & Leccese, 2013). This leads to an opportunity to explore the fuel cells as a potential source of power for the respective sectors, in terms of economic competitiveness, commercial viability, technological maturity and market in comparison to existing technologies and the public policies for the carbon free technologies which result in the research objectives for the scope of this study.
Scope and Purpose
This article illustrates the technological maturity, cost comparison, applicability potential, implementation challenges and market risks of the fuel cell technology to incumbent technologies. The available studies on the governmental websites for energy were reviewed for the scope of this report. No literature comprehensively addresses the technological maturity with cost competitiveness and the infrastructural risks that can help in identifying the market potential for the energy sector market players. The hydrogen innovation and fuel cell technology transition can have significant impact on the Oil and Gas sector, analysing the future potential of low carbon energy market.
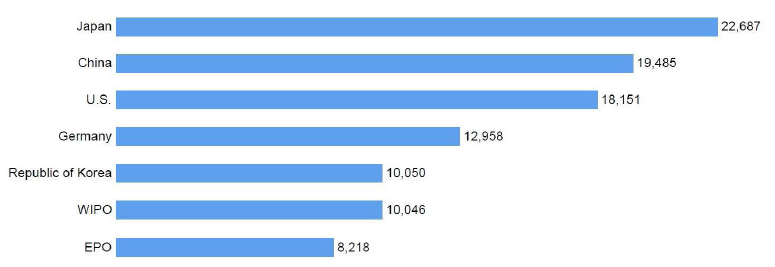
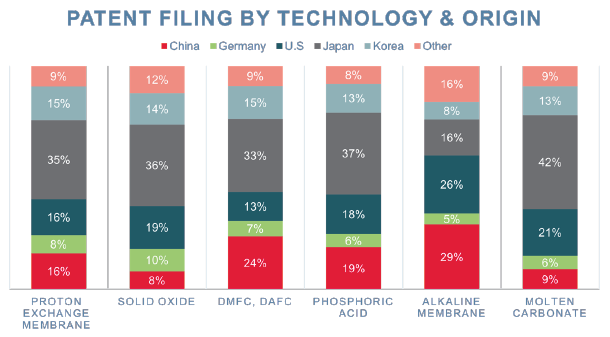
Much of the research work has been done by the United States in this context and the major policies flow from the U.S. and the E.U. in the hydrogen transition context, though the efforts are also in place by Japan, and China as well. A lot of research work is being done by Japan, China and the U.S. in terms of research and patent filing as depicted by the World Intellectual Property Report (WIPO, 2022). The following graph will highlight the patent filing by region as shown in Figure 4.
The report is structured in nine parts. Part One explains the methodology involved for the literature review and analysis followed by Part Two which reviews the literature. Part Four concludes the analysis, and the extent of research objectives met as a result of the research conducted.
Part One: Methodology
We carry out a literature review of the studies and reports published and available publicly from renowned sources. The criteria of source selection were the governmental websites or the energy departments of the OECD contributing and working towards the decarbonisation policy globally. The reports were analysed for qualitative and quantitative data related to fuel cell technologies and carbon abatement.
The data was gathered through desk research by performing a detailed systematic literature review of the available literature on the subject addressing the research objectives looking for key terminologies of fuel cell technology, its types, applicability, technological maturity, ownership cost, cost drivers, cost competitiveness, infrastructural availability, market potential, estimated market share, future market share, economic and market barriers, risks and challenges in deployment at scale. Most of the data available addressing the research objectives has been published by United States. The studies reviewed for the literature review for the scope of this study were obtained from multiple energy departments and websites of the U.S. Department of Energy (U.S. DoE), International Energy Agency (IEA), United States Environmental Protection Agency (EPA), US Energy Information Administration (EIA), European Environmental Agency (EEA), National Renewable Energy Laboratory (NREL), UK Government, European Commission and International Renewable Energy Agency (IRENA). The reports published are either for specific objectives of cost drivers, economies of scale, infrastructure requirement or the applicability. This report through systematic literature review provides the holistic picture of the fuel cell technologies covering the research objectives and key terminologies.
We collected data from the reported and publicly available data for both the qualitative and quantitative research for the scope of this report for fuel cell technologies. The key variables identified for the literature review were the following:
Basics of fuel cell, operation, structure and chemical composition Technological maturity and state of play Economic and commercial competitiveness Fuel cell applications in the respective energy sectors Fuel cell risks and earning potential
The reports were analysed for the above-mentioned themes through the reports of the U.S. DoE and NREL. The cost analysis was done to identify the cost drivers, potential cost reduction drivers of the fuel cell technologies and the reason for high capital cost of fuel cell system through the reports of NREL and IRENA. The other variables were analysed through other sources. To perform the systemic review encompassing the objectives of the research, around 40 studies were reviewed.
Analytical Framework
The research objectives were then answered after analysing the literature through the themes uncovered and comparing it to the incumbent technologies for each potential sector. The analysis was done to evaluate the most mature fuel cell technology, the value chain risks that remain a hurdle for cost competitiveness, identify the most economic viable technology in terms of CAPEX and lifetimes and then analyse the user requirement criteria while identifying the fuel cell technology best fitting to the requirements of the potential sector. The best fitting technology was compared to incumbent technologies of that sector in terms of total cost of ownership (TCO) and Levelised Costs, which enabled to analyse the abatement costs for each sector to strategise the fuel cell application in the potential sector for carbon abatement. The risks were analysed by extrapolating the requirements of the rare materials through the reported data to investigate the extent of the rare material utility in achieving net zero emissions and the infrastructure availability. The analysis marks out the riskiest technology by combining the risks identified throughout the analysis.
Part Two: Literature Review
In this part we provide an overview of the existing literature on fuel cells, fuel cells technologies, fuel cells maturity, applicability sectors and fuel cell infrastructure requirement. We start by discussing fuel cell technology, its applicability for economic attractiveness and the technical characteristics of its various types. We end this section by discussing critically the economic competitiveness and the risks in applicability of fuel cell technology in various power sectors.
Hydrogen as Potential Energy Source
In the 19th century and early 20th century important technologies were developed to use and produce hydrogen. The potential for hydrogen was discovered in the 1960s during space applications which relied heavily on hydrogen for energy storage. In the 1970s, during efforts for alternative energy concepts in the wake of energy and oil price crises, hydrogen was given importance. Moreover, the rising issues of sustainability, climate protection and environmental protection gave a much-needed boost towards the growing influence of green energy policies. Over the past decades, the energy debate has been and is still dominated by other energy sources, for example, natural gas, biofuels/biomass and electricity. Till now hydrogen has failed to gain commercial viability and user acceptance as an alternative energy source capturing a significant market share. The delay to transition is attributed to high capital costs and infrastructure availability that requires considerable investment and market (Shell, 2017)
Fuel Cell and Its Principles
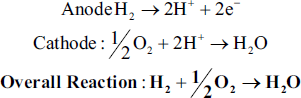
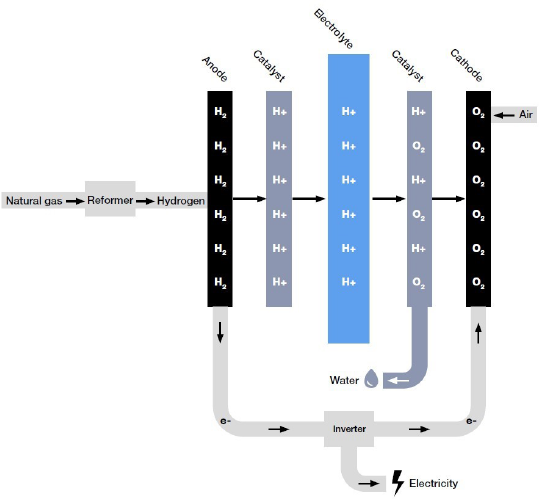
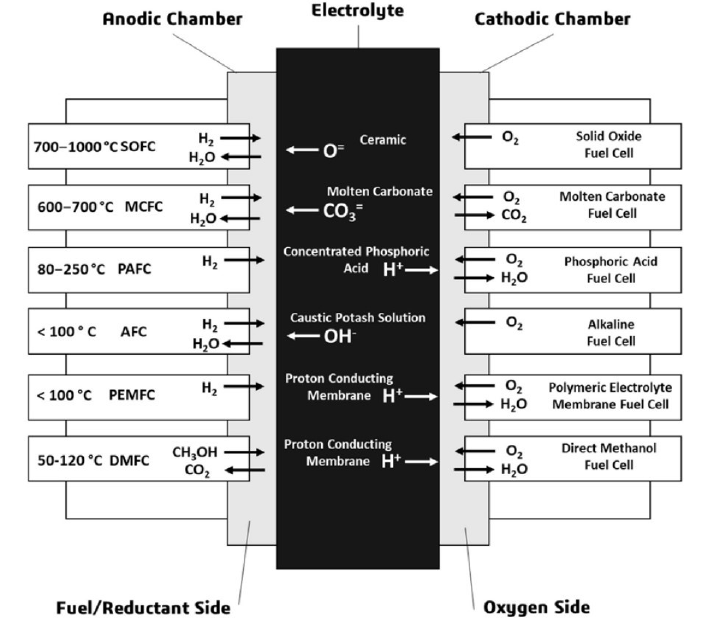
Fuel cells are electrochemical devices that converts the chemical energy of a fuel, typically hydrogen or in some cases methanol, to electric energy. The basic physical structure of a single cell consists of an electrolyte layer bonded with an anode and cathode on either side as shown in Figure 5. The fuel is to be continuously fed to the anode for the energy generation along with a continuous supply of oxygen as oxidant at the cathode. Anode of a fuel cell is a negative electrode that conducts electrons released from the hydrogen molecules. Cathode is a positive electrode that receives electrons from the external circuit. Electrolyte is the third major component of the fuel cell; it conducts the movement of ions within the cell through the internal circuit and blocks the flow of electrons so they only flow through the external circuit only. The electrolyte forms the basis of classification of FC technologies. Another major component of the fuel cell is the catalyst that facilitates the reaction in the cell (Giorgi & Leccese, 2013). The chemical reactions taking place at anode and cathode are described below:
Importance of FC
Fuel cells is the potential technology that can help in utilisation of hydrogen and achieve the objectives of the Paris Agreement. As the fuel cell technology is applicable over a wide range of application sectors including micro power generators, auxiliary power generators, stationary power generators, distributed power generation and portable power along with application in transport, military applications and automotive markets (Giorgi & Leccese, 2013). Thus fuel cells cover all power sectors that are used in a number of industries and environments on a worldwide scale (Petrovic & Hossain, 2020). Fuel cells are energy conversion devices that have numerous advantages over incumbent technologies:
Higher efficiency Low chemical and thermal emissions Low maintenance Fuel flexibility Pollutants free
Fuel cells because of their chemical composition have their own advantages and disadvantages and thus different applicability sectors as well.
Types of FC Technologies
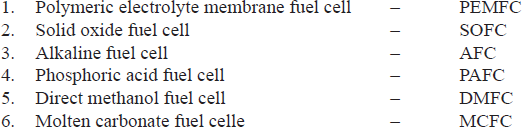
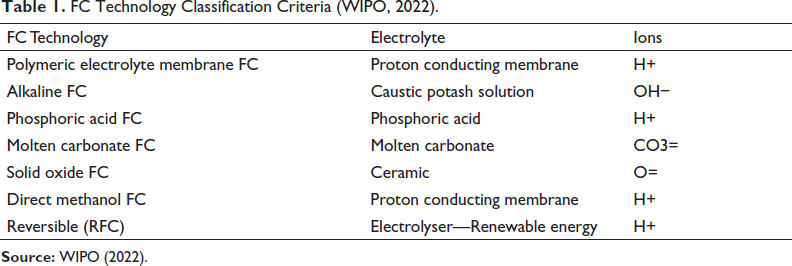
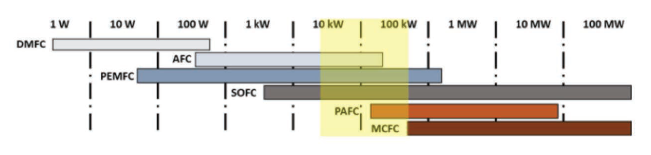
At present according to WIPO Report there are six major fuel cell technologies illustrated in Table 1 and Figure 6 which have salient characteristics depending on their composition which in turn leads to several advantages that makes them suitable and competitive for various application sectors. The electrolyte forms the basis for the classification of FC technologies (WIPO, 2022). The six major FC types are enlisted below:
FC Technology Classification Criteria (WIPO, 2022).
Polymeric Electrolyte Membrane Fuel Cell
It is the most mature and most widely researched and developed fuel cell type that is expected to play a dominant role in in future energy solutions. This technology has drawn the most attention due to its simple cell structure, viability, quick start up time and low operating temperature. It operates at a temperature of 70°C –100°C with a polymer electrolyte membrane. This low temperature operation also results in less wear on system components.
Solid Oxide Fuel Cell
SOFC are high temperature and a higher power range fuel cell technology that uses non-noble metals as catalyst. It is most popular in stationary power and combined heat and power (CHP) applications.
Alkaline Fuel Cell
Alkaline fuel cell is one of the oldest fuel cell technologies also known as Bacon fuel cell that had been used in the Apollo space program for the provision of water and power requirement of the crew.
Phosphoric Acid Fuel Cell
It was the first to be commercialised and was developed around the 1960s. It has applications in stationary power generation and CHP applications as well. It has higher power ranges which makes it suitable for distributed power generation as well. It has a high lifetime of 60,000 h among all FC technologies.
Direct Methanol Fuel Cell
It is a developing FC technology that can use existing infrastructure for refuelling because of its fuel flexibility.
Molten Carbonate Fuel Cell
It is a high-power range FC with non-noble metal as catalyst. It is suitable for applications in stationary or centralised power generation. It has a power range up to 3 MW with a temperature range from 600°C to 700°C.
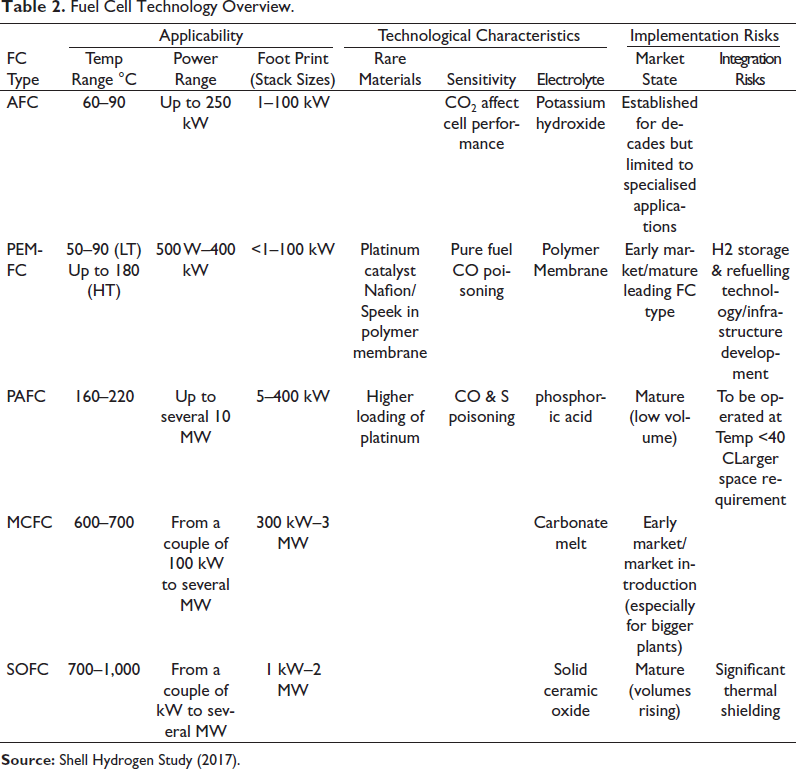
An overview of the FC technologies is also shown in Table 2 for brief comparison.
Fuel Cell Technology Overview.
Maturity
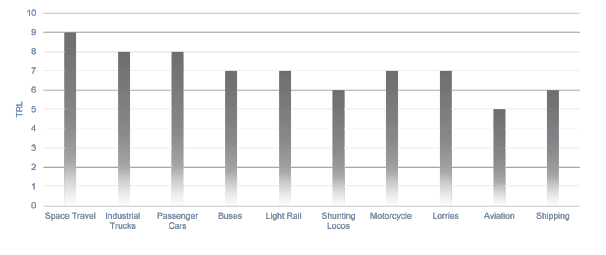
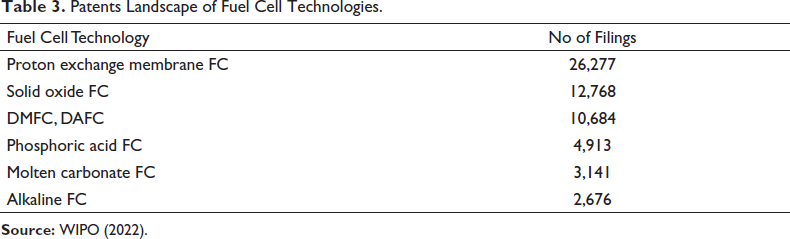
Fuel cell is a fairly mature technology with a Technology Readiness level of 6–7 across different applications as shown in Figure 7 (Shell, 2017). A proxy to show the state of play landscape of the FC technologies will be the number of patents being shown in Table 3 that can depict the maturity of the FC technologies as highlighted in the WIPO report (WIPO, 2022).
Patents Landscape of Fuel Cell Technologies.
Public Policies
As far as public policies are concerned the OECD are really setting ambitious targets for themselves to achieve the NZE scenario as per the Paris Agreement. The goal year for NZE is 2050, as agreed by all 192 countries. Moreover, the UN Sustainable Development Goals are also one of the key pivotal forces that put an emphasis on sustainable power generation and energy practices. U.S. has four strategies for decarbonising the U.S. industry, through energy efficiency, low carbon fuels, industrial electrification and carbon capture, utilisation and storage. The U.S. DoE has invested US$100 million for research and development of hydrogen projects and fuel cells in 2022 for their objective to be a carbon free economy by 2050. European Union plans to invest US$430 billion in green hydrogen by 2030. China’s New Energy Vehicle Roadmap plans to install 300–1000 hydrogen refilling stations from 2025 to 2030 thus improving the infrastructural requirement of the fuel cell technology application in transportation sector and launch 1 million fuel cell electric vehicles into service by 2030 (REGLOBAL, 2020). EU is working on 11 step research programmes to reduce cost and move towards a hydrogen-oriented economy by 2050. Cost reduction, materials choice and utilisation, balance of plant, system integration, fuel quality and processing, hydrogen production, distribution and storage, durability and efficiency, standardisation and socio-economic research are some of the aspects being explored and given importance by the European Union. PACE—a major EU project that aims at deploying 2,800 micro-CHP units in 10 EU countries by 2025 (European Commission, n.d.) aims for 13%–14% hydrogen fuel shares by 2050. The Central German Chemical Triangle in Saxony-Anhalt will produce 150,000 MWh energy from wind power generated hydrogen. Europe has salt formations to store ~85 PWh of Hydrogen Power (Marsh, 2020).Two hundred and fifty companies and research organisations are investing US$65 billion to build hydrogen storage capacity of 3 MMT in USA, known as the Salt Cavern Storage, by 2030.
The UK has set targets for four low carbon clusters by 2030 and at least one net zero cluster by 2040. The UK has also implemented a Ten Point Plan for Green Industrial Revolution by investing 12 billion GBP to create and support green jobs. The UK also plans to decarbonise the transportation sector and has set out the goals for no gasoline engines by 2040. The UK has also strategised its transportation sector and plans to have a net zero rail network by 2050 and net zero domestic aviation by 2040 (GOV.UK, 2021b).
Applications
FC technologies are applicable for four major sectors of energy as shown in Figure 8, which are portable power, backup power, transport and centralised or distributed power generation. FC technology has recently got a lot of attention in material handling equipment including forklifts and other equipment. The four sectors are described below:
Portable Power
Portable power devices require a power range of 1–100 W. These devices are mainly:
Laptops Cellular phones Power tools Military equipment Battery chargers Sensors UAVs and UUVs
Backup Power
Backup power includes all the equipment and devices that are required for backup power for homes, offices, buildings or other critical setups that require uninterrupted power supply (WIPO (2022)). The power requirement ranges from 100 W to anything up to 50 kW. These include:
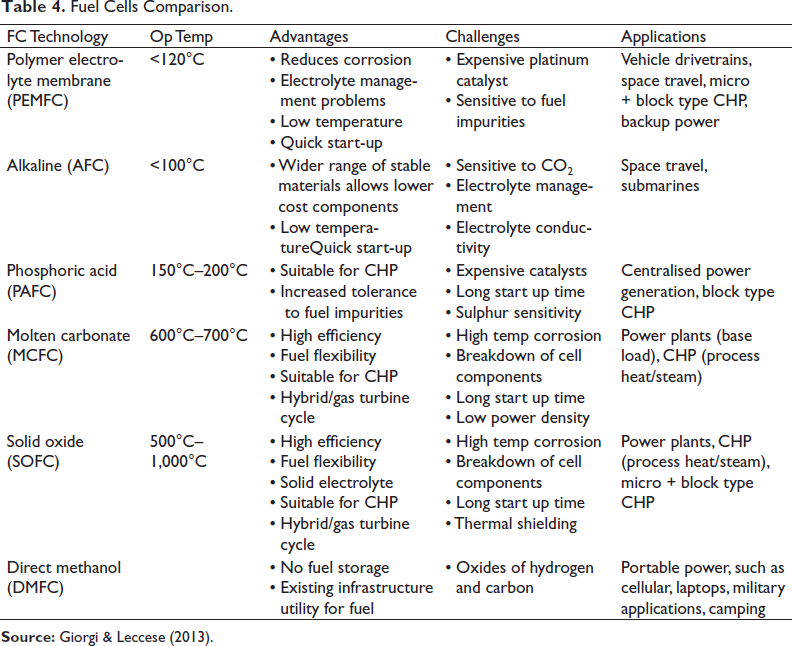
A comparison of various fc technologies as depicted by Table 4 for its resective suitable application criteria.
Data Centres Offices/Buildings Hospitals Retail and Warehouse Utilities Telecommunication Sector
Fuel Cells Comparison.
Transport
Transport includes all mobile equipment which includes light mobility equipment that include motorbikes, light vehicles, heavy vehicles and rail transport, The power requirements for road transport is 50–125 kW, special vehicles 100–160 kW and trains and ships 50–200 kW (WIPO, 2022). These include:
Super light mobility Automobiles Buses Rail Maritime
Centralised Power Generation
The power range for central power range is from 1 to 200 MW. This includes power generation and distribution through grid and transmission lines. These include:
Central power generation Combined heat and power applications
FC Substitutes
The incumbent technologies already filling the energy requirements of the sector as described earlier (Shell, 2017; WIPO, 2022). The alternative technologies to FC as per the available literature are enlisted below:
Batteries
Batteries are an alternative and present energy source to portable power in laptops, cellular devices and other portable equipment.
UPS, Generators, Solar Systems
The alternative and substitute to this energy power sector are UPS, invertors, gasoline generators or solar systems, as they have already been deployed for the backup power generation for multiple buildings.
Transport
The transportation sector already has gasoline and electric vehicles as an alternative to the mobility sectors.
Stationary Power
The stationary power sector has huge energy requirement and will continue to grow in near future, the alternative energy methods are hydro power plants, coal fired plants, steam cycle turbines, wind power and combined cycle power turbines.
Comparison: Advantages, Disadvantages and Respective Applications of Fuel Cells
Geographical Analysis
In terms of geographical overview patent filing was taken as a proxy to evaluate the regional development regarding the fuel cell technologies as shown by Figure 9. Japan leads in FC technologies followed by China in Direct Methanol and Alkaline Membrane. The U.S. and Korea are leading in molten carbonate fuel cell (WIPO, 2022).
Economic Aspects
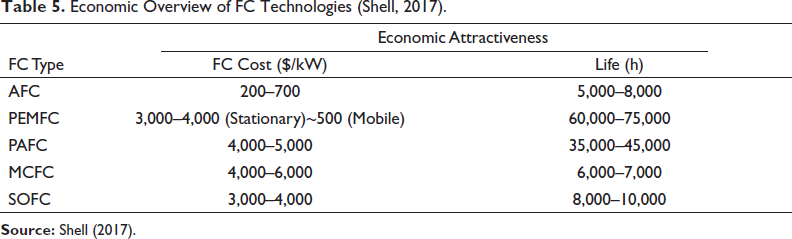
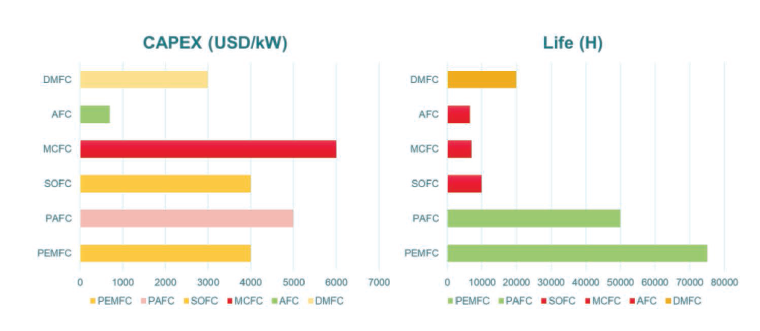
The economic attractiveness of the FC technologies in terms of CAPEX and lifetime as shown in Table 5 of the FC technologies is quite high at present (Shell, 2017).
Economic Overview of FC Technologies (Shell, 2017).
FC technologies at present are at least 5–10 times more expensive to incumbent decarbonisation technologies as highlighted in Figures 10, 11 and 12 respectively (Petrovic & Hossain, 2020; Shell, 2017).
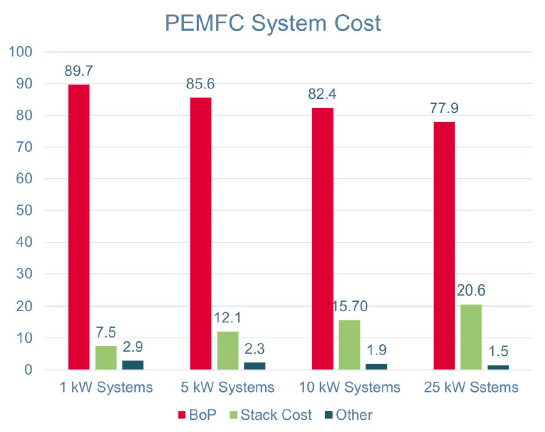
To evaluate the cost drivers of FC technologies, the breakdown of total cost of FC stack shows that the highest cost contributor is balance of plant (BoP) elements which constitute the DC/DC convertors, interconnects, electronics, fuel supply and air flow equipment. In most of the systems the BoP constitutes around 80% of the system cost highlighted in Figure 13 (Berkeley Lab, 2017).
Risks
FC technology at present is maturing and has technological and supply chain risks which hinders the deployment of fuel cells at scale. FC technologies use rare materials, and their availability is a supply chain risk. Since FC technology is maturing therefore the technological challenges are also the supply chain risks and supply chain risks are related to technological challenges (Nelaturi et al., 2020). Since there is no extensive infrastructure available at present for the hydrogen and fuel cell technology, therefore the infrastructural challenges in the deployment are also one of the main hinderance for applicability in the energy sectors (Marsh, 2020). The risks determined from the literature review are:
Rare materials Manufacturing capacity Development of end products Infrastructure (Logistics) Operational risks (Life and Cost) Cost competitiveness Impurity sensitivity Hydrogen production
Evidence Uncovered: Summary of the Literature Review and the Research Objectives
Analysis
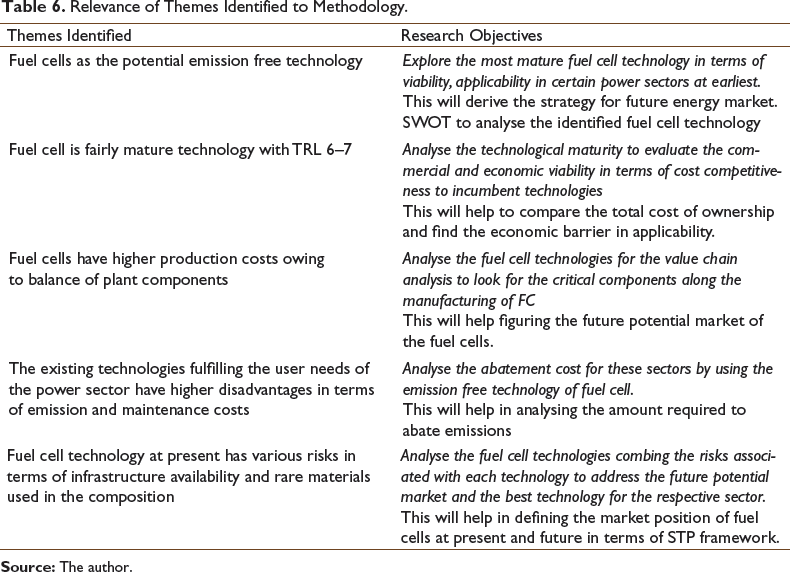
Analysis of the literature reveals the potential of the fuel cell technologies to abate the emissions and their applicability in the power sectors. This leads to the research objectives of this article as highlighted in Table 6 and further leads evaluate the most mature and promising technology and compare the fuel cell technologies to the incumbent technologies to evaluate the difference of total costs of ownerships and commercial viability which would allow to compare the abatement costs for each power sector. Since the literature indicates that the technology has not fully reached the maturity in technological readiness level therefore analysing the value chain for critical inputs is also important in order to evaluate the future potential market. The goal year for achieving carbon free economy and NZE scenario is only around 10,000 days away which demands our aligned and deliberate efforts to make it happen otherwise it will compromise the objectives of the Paris Agreement and UN Sustainable Development Goals.
Relevance of Themes Identified to Methodology.
Maturity ‘State of Play’ of Fuel Cell Technologies
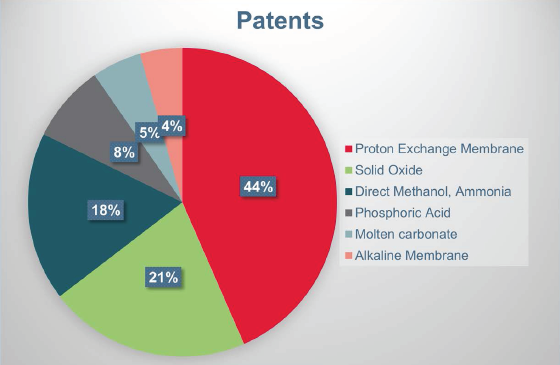
The FC technology that is most promising among all FC technologies by the number of patents in all application sectors of FC applicability is the polymeric electrolyte membrane fuel cell also known as proton exchange membrane fuel cell depicted by Figure 14 (WIPO, 2022).
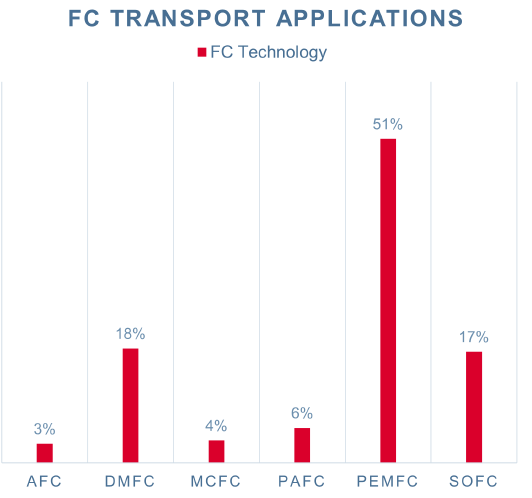
The following graph shows Polymeric Electrolyte Membrane fuel cell with the highest percentage of patents in the transportation sector as shown in Figure 15.
Analysing the FC technologies for the stationary power generation sector, no dominant technology has potential applicability in the stationary power sector. DMFC are being developed for the portable power sector especially for the military and camping applications.
Value Chain Analysis of Fuel Cell Technology
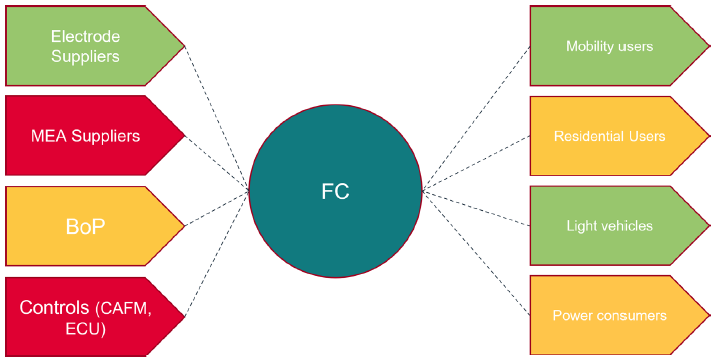
FC technology value chain risks are associated with membrane electrode assemblies (MEA) and control components as highlighted in Figure 16, as most fuel cells require MEA for the operation of the cell, these MEAs are currently being produced by few key suppliers DuPont and Johnson Matthey (Advanced Propulsion Centre UK, 2021). The control components are another major critical value chain risk; the control components are used as inter stack control components and for the power conversion purposes from stack to inverters, some other critical controls are Cathode air flow meter (CAFM) and electronic control units (ECUs) (Berkeley Lab (2017)). These components are required for cathode humidification and for configuration of the stack with the system, these are critical components which are produced by few suppliers and have the potential to create halts in production when economies of scale are increased significantly.
Analysis of Promising FC Technology in CAPEX and Lifetime
Considering the CAPEX and Lifetime of the FC technology as per the customer and user perspective, the Figure 17 highlights the comparison which indicates the Polymeric Electrolyte Membrane being most attractive because of its lower CAPEX and high lifetime.
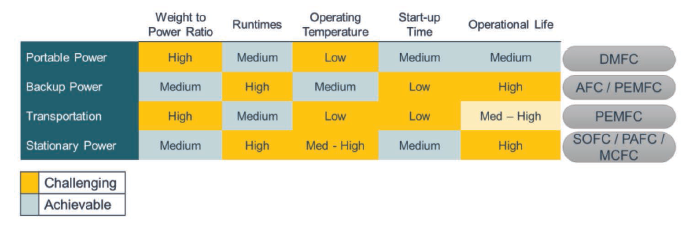
User Requirement Criteria for the Four Sectors of Energy
There are certain requirements for the selection and suitability of FC technology to each application sector as highlighted by Figure 18 (Gren, 2020). The following table analyses and summarises the requirements for each sector and resultantly identifies the best fitting FC technology for the specific sectors.
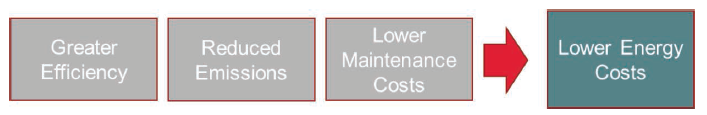
Why Fuel Cells are Better Compared to Conventional Technologies
The FC systems are preferred over incumbent technologies because of their greater efficiency, reduced emissions, lower maintenance costs which in turn lead to lower energy costs as highlighted by Figure 19.
The FC technologies are preferred over substitutes as they have fewer disadvantages over substitutes (Giorgi & Leccese, 2013). The disadvantage of substitutes varies with application sectors.
Batteries
Lesser life compared to fuel cell technologies.
Higher replacement costs.
Frequent replacements of batteries as compared to FC technologies.
UPS, Generators, Solar Systems
Higher emissions as compared to fuel cell technologies.
Higher maintenance and replacement costs.
Around 20%–25% less efficient.
BEVs, Gasoline and Diesel Engines
Produce the second highest emissions.
Higher maintenance cost.
Battery electric vehicles have shorter ranges compared to gasoline and diesel engines.
Power Plants, Wind Power, PVs, ICEs and Natural Gas Turbines
Highest emissions produced around all the sectors.
Lesser efficiencies.
Lower energy utility.
Higher maintenance costs.
They have more moving parts which increases the complexity and noise production as well.
Consume fossil fuels resources which are already being depleted below the normal levels.
FC Technology
FC requires continuous fuel supply for their operation.
FC either requires hydrogen cylinders or hydrogen storage modules for the supply of fuel.
FC technology also requires refuelling infrastructure.
At present the higher costs are a disadvantage over incumbent technologies.
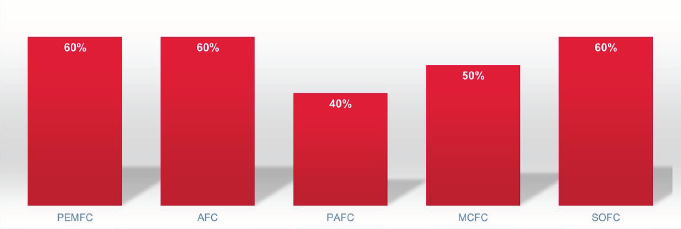
Efficiency Comparison of Fuel Cells to Incumbent Technologies
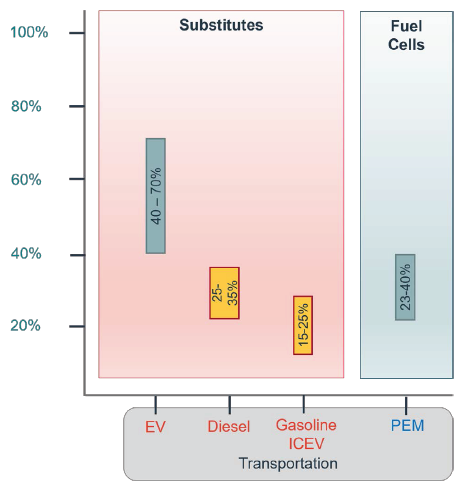
FC are at least twice more efficient than incumbent technologies; their efficiency varies from 40% to 60% for different FC types as highlighted in Figure 20.
Analysing the FC technology efficiency in transportation as compared to substitutes, the most efficient are BEVs as shown in Figure 21 but they have lesser range as compared to gasoline vehicles (Kurtz et al., 2014). The FCEVs addresses the issue of shorter ranges while producing zero emissions.
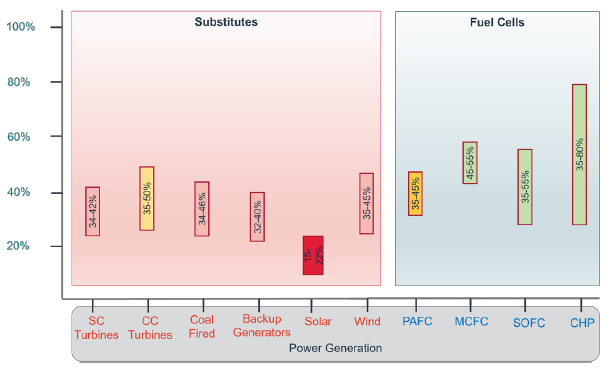
The present power generation alternatives are not as efficient as compared to the FC technologies. The FC technologies are at least twice more efficient than incumbent technologies for centralised power generation and distribution as depicted by Figure 22.
Cost Comparison of Fuel Cells to Diesel Generators and Batteries for Backup Power
To evaluate the cost comparison of FC technologies to incumbent technologies it is important to investigate the total cost of ownership of fuel cells to incumbent technologies for transport and backup power. For total cost of ownership, the following elements are included:
Capital cost Instalment cost Operational cost Fuel supply and storage cost Decommissioning cost
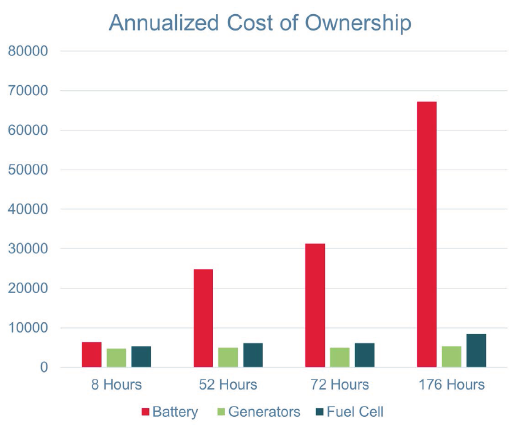
Through the cost analysis of the FC technologies in the backup power sector, it comes out that that the cheapest method is generator and the FC technology at present is 12% more expensive than generators whereas batteries in backup power is the most expensive alternative, around 34% more expensive as shown by Figure 23 (Battelle, 2016; Kurtz et al., 2014). The FC technology is competitive to generator in long haul scenarios of 52, 72 and 176 hours depicted through Figure 24.
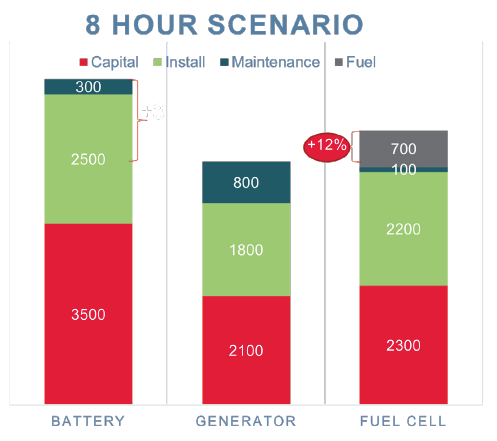
The elements which add to these high costs are capital costs and installation cost. The highest among these are the capital and installation costs whereas the maintenance and fuel costs are comparatively less than the substitutes.
Cost Comparison of FC to Turbines and Power Plants for Centralised Power Generation
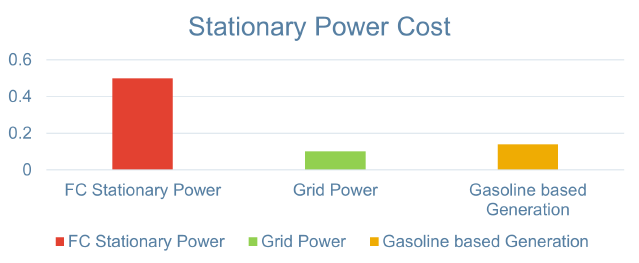
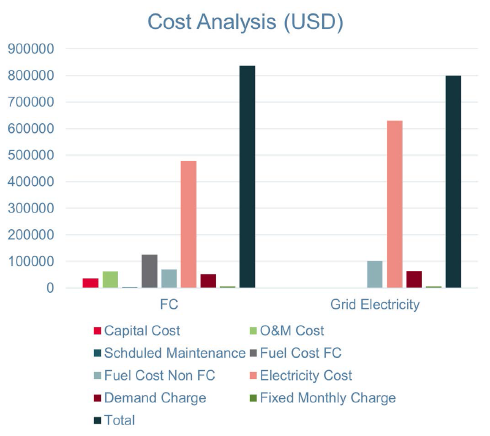
The levelised cost of electricity will be evaluated for the centralised power generation (Elgowainy & Wang, 2008). The FC cost analysis in centralised power generation concludes that the levelised cost of electricity for FC technology is approximately 20% more expensive than alternative energy generation methods as shown in Figure 25.
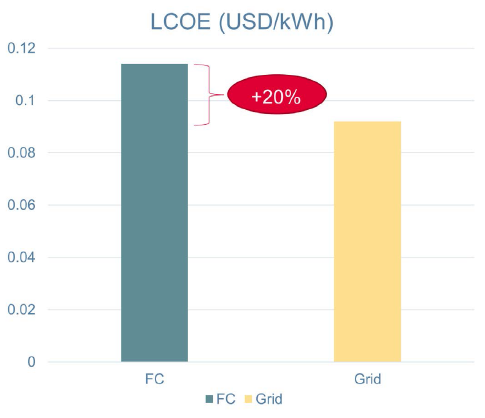
The difference of higher cost of FC technology and the constituent elements which add up to the cost also shown in Figure 26 are higher capital, operation and installation and fuel costs because of hydrogen storage modules or hydrogen produced through electrolyses (Battelle, 2016).
Cost Comparison of Fuel Cells to Electric and Gasoline Vehicles in Transportation Sector
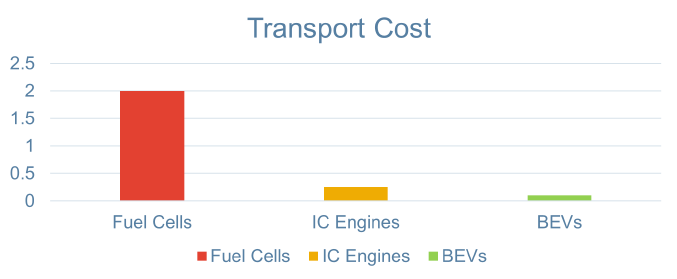
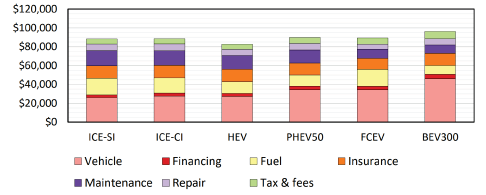
Analysing the FC technology applicability in transport sector, the FC technology is neither cost effective in this sector nor competitive to the existing alternatives (Burnham et al., 2021). The most economical option in this sector is diesel vehicles, and FCEV is still far more expensive than BEVs as highlighted in Figure 27.
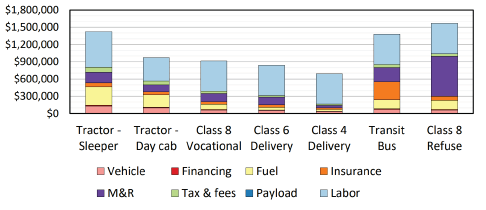
In transport sector the most important category is heavy vehicles as they consume more fuels and travel on long hauls drives. Therefore, these are the highest emission producers and require the most to decarbonise but the economic competitiveness in this sector is also not user centric as shown in Figure 28.
Abatement Cost for Emitting Sectors
Analysing the abatement cost in the major emitting sectors of transport, backup power and power generation sector, the highest emission sector is the electricity generation and heat which produces around 13.94 Gt CO2, followed by transport sector with 8.26 Gt CO2 (IEA, 2021b). Other industrial processes make the third highest sector and produces around 6.16 Gt CO2 (Friedmann et al., 2020).
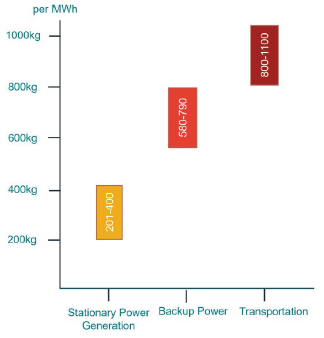
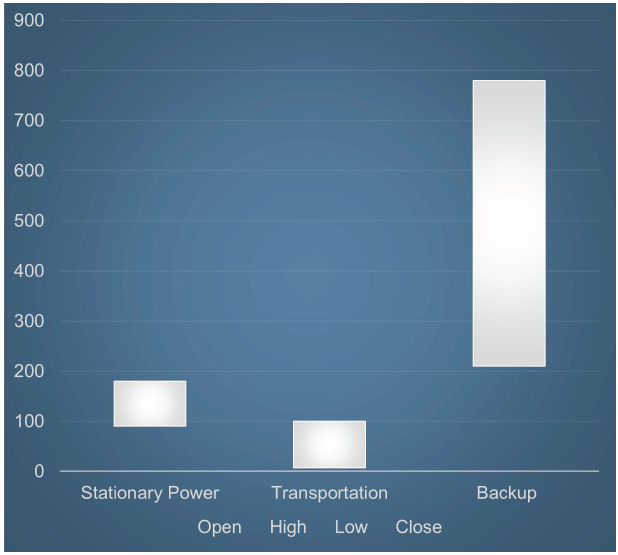
FC technology targets the highest emitting sectors, and the following graph shows different amounts of emissions produced for each MW of energy consumed. The analysis shown in Figure 29 highlights that the transport sector produces the highest level of emissions for a MW of fossil fuel energy consumed around 800–1,100 kg MW−1, followed by backup power with around 600–800 kg MW−1. The least number of emissions are produced by centralised power sector for a MW energy consumed which is around 200–400 kg MW−1.
The following illustration in Figure 30 and graph show the abatement cost for these sectors. This shows cost to abate per ton CO2 abated though the use of fuel cell technology.
The backup power has a wider cost range because of the different scenarios for hours of backup power required.
Rare Materials Utility by 2050 in Energy Transition
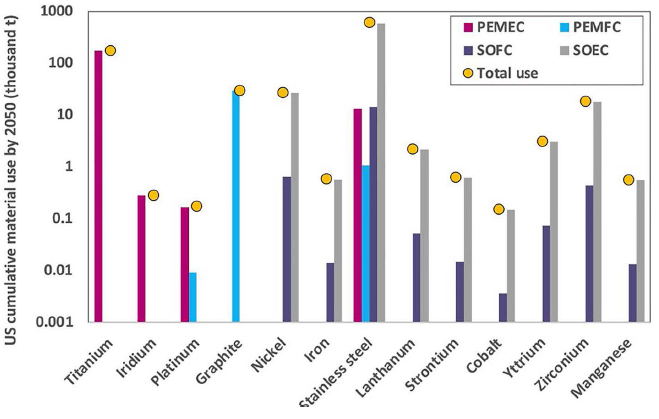
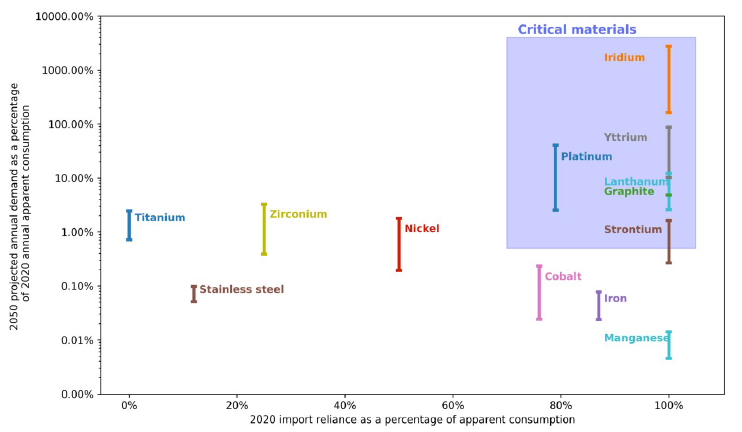
Analysing the risks of the FC technologies, it is important to explore the extent of rare materials usability by the goal year so that it suffices the rare metals requirement for the decarbonisation. The rare metals usage will be increased by more than 100% by 2050 as highlighted by Figure 31 in hydrogen applications using the critical metals in fuel cell technologies. Titanium, iridium and platinum are the most significant noble metals required for fuel cell deployment at scale as shown in Figure 32.
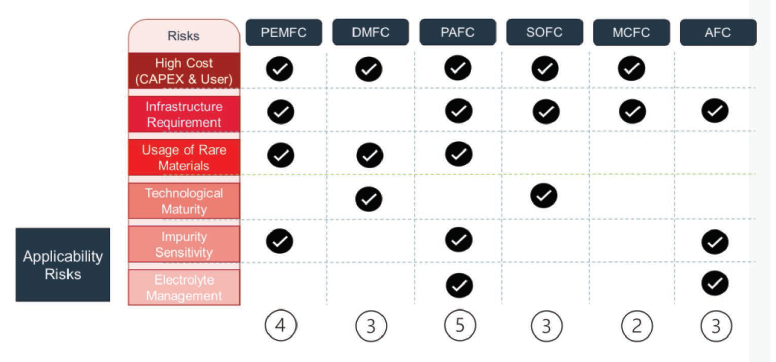
Risks Assessment of FC Technologies
The following risks were considered for analysing the risks of the FC technologies:
Cost Infrastructure requirement Rare metals usage Technological maturity Applicability risks Impurity sensitivity Electrolyte management
FC technologies are analysed over a matrix of risks on the basis of the above-mentioned criteria. The analysis shows that PAFC is the riskiest FC technology based on the factors selected as illustrated in Figure 33.
Future Potential Market of Fuel Cells
The Future FC market is expected to grow at a CAGR of 20% and reach US$28.95 billion by 2050 from US$3.36 billion (BloombergNEF, 2020; Gren, 2020). The hydrogen requirement is expected to reach 22–41 TW by 2050 as illustrated in online Appendices B-F. Moreover, the hydrogen demand will increase 10 times and reach 100 million metric tonnes. Thus, domestic FC capacity to reach 50 GW with annual production of 3 GW per year till 2050 as shown in Figure 34.
Part Three: Limitations of the Report
The report has been prepared with a specific objective to investigate the fuel cell technologies with specific research objectives. The main limitation of the study was the subjectivity of the methods used to conduct the study. Owing to time restrictions it could not involve primary data that can provide more detailed insight with greater details towards the public policies. Developing a regional level analysis of the fuel cell manufacturing capacity was not in the scope of this report but that could possibly highlight the regional gaps in achieving the NZE.
Part Four: Concluding Observations
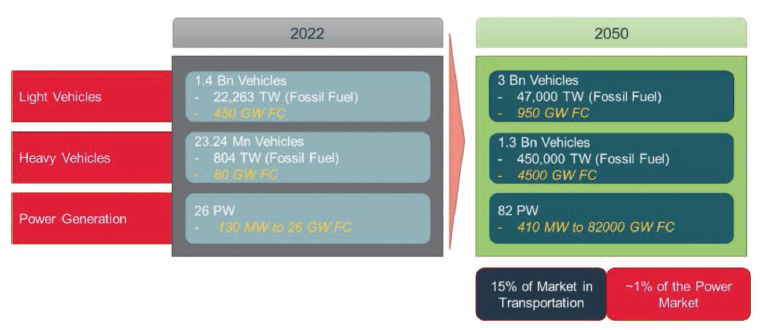
Fuel cell market can be key player of the energy sector in the future and can attract a sizeable market share in the transportation sector. Moreover, the least abatement cost is of the power generation sector, but the FC technology can only claim around 1% of the global market in the power sector (online Appendix D). This also highlights that FC has greater market share depending on the infrastructure and economies of scale. The light vehicles are expected to be doubled by 2050 to 3 billion and consume around 47.000 TW of fossil fuel energy and the FC production is expected to be around 950 GW, which claims around 15% of the transport market. The power generation requirement is around 26 PW and is expected to be around 82 PW by 2050,which is around 3.5 times. The FC requirement will be around 410 MW to 82,000 GW FC, this can claim around 1% of the market share of the power sector also highlighted through Figure 34.
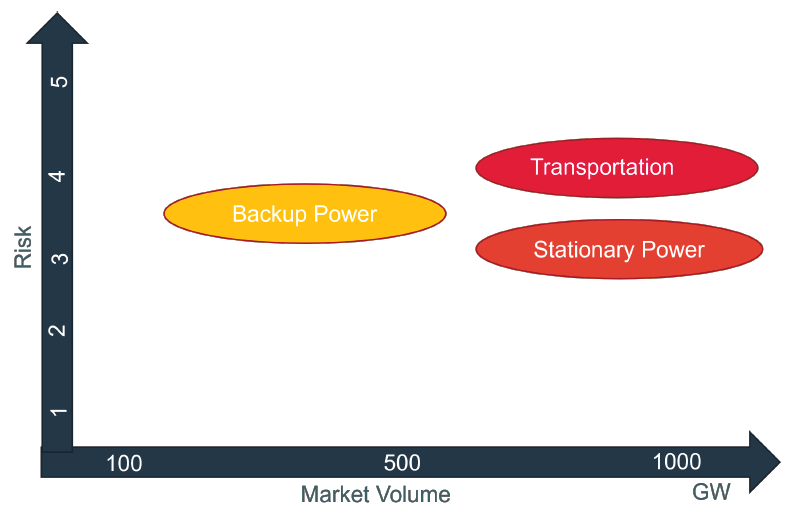
Considering the risks and market volume, the stationary power is the least risky and high-volume market as shown in Figure 35 that can be prioritised in the first place to decarbonize and will require the least cost and have a high fuel cell demand.
Summary of Findings
The fuel cell market is a potentially high volume and high-risk market that can help abate around 20% emissions if the economies of scale are not increased significantly, which would resultantly require billions in infrastructure.
The risks associated with the deployment of fuel cell technology at scale are related to user cost and infrastructure availability. The cost barriers are very high at present and that restricts the user from adopting the technology, moreover in some applications the cost is even 10 times of incumbent technologies.
The power sector has the least abatement cost but because of limited manufacturing capacity of the fuel cells and less hydrogen infrastructure will not allow to abate much of the emissions by 2050.
The application of fuel cell in transportation sector can potentially abate a significant amount of carbon emissions provided the costs are brought down, competitive to BEVs.
More generally our article identifies and demonstrates the potential of fuel cell technologies in comparison to incumbent technologies to abate emissions in energy sectors, as enumerated below:
Fuel cell technology is a mature technology in comparison to incumbent technologies with a readiness level to be deployed in operational environments. There are various implementation barriers in the deployment of fuel cells at scale at present, and capital cost is the most significant barrier among them requiring an increase in economies of scale and RDD for controls and electronic components of the BoP. The fuel cell technology has risks in terms of infrastructure availability and usage of noble metals which requires more research and development for lesser loadings of the noble metals and infrastructural network. Fuel cells have an attractive market owing to the NZE scenario and public decarbonisation policies which make them a promising option for decarbonisation of the energy sectors. Public and private investments are required to make the Net Zero Emission happen. Private investments will be key for the boost required for the decarbonisation of the economy by 2050, followed by the public policies.
Part Five: Recommendation
To make the fuel cell technology competitive for applicability in the sectors of energy, the following actions will help achieve the NZE:
Development of refillable stationary hydrogen modules that would reduce the fuel costs. Development of infrastructure for hydrogen to increase the site accessibility and refuel ease. Increasing the economies of scale to decrease the BoP cost and overall production cost. Reduction in capital and installation cost Reducing BoP cost. Improving stack power density. Decreasing rare materials content. Reducing onboard hydrogen storage cost.
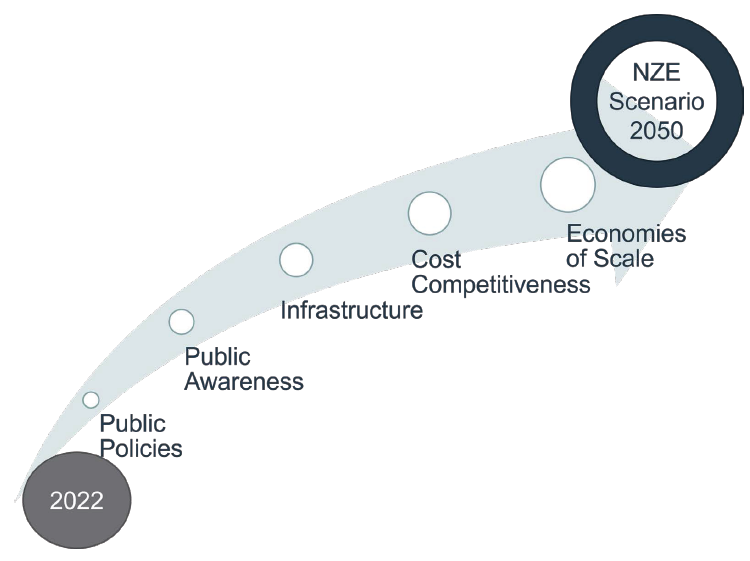
The future roadmap as shown in Figure 36 emphasize to reduce risks requires public policies for enhanced economic fuel cell applications. There should be governing bodies that can maintain an overview and analyse the FC development while streamlining and directing the efforts of the private sector for FC development that can target the highest emitting sector first. To create public awareness, public buildings must be made carbon free in the first place. The governments need to work for the infrastructure and economies of scale to increase the fuel cell applicability to achieve the NZE scenario.
Supplemental Material
Supplemental material for this article is available online.
Supplemental Material for Decarbonisation of Global Economies; Is Net Zero Emission Achievable? The Case for Hydrogen and Fuel Cell Technology for Innovative Futures by Hassan Naeem Khokhar, in Journal of Entrepreneurship and Innovation in Emerging Economies
Footnotes
Acknowledgements
The author wishes to thank Genesis Consulting and Essex Business School for enabling the preparation of this article. The article is an adaptation of an MBA Consulting Project.
Declaration of Conflicting Interests
The authors declared no potential conflicts of interest with respect to the research, authorship and/or publication of this article.
Funding
The authors received no financial support for the research, authorship and/or publication of this article.
References
Supplementary Material
Please find the following supplemental material available below.
For Open Access articles published under a Creative Commons License, all supplemental material carries the same license as the article it is associated with.
For non-Open Access articles published, all supplemental material carries a non-exclusive license, and permission requests for re-use of supplemental material or any part of supplemental material shall be sent directly to the copyright owner as specified in the copyright notice associated with the article.