
Abstract
Purpose
The demographic composition of United States (US) medical school leadership remains underexplored, despite growing recognition of workforce disparities in gender, race, and specialty. These gaps may affect patient care, mentorship, and education. This study examines demographic patterns in US allopathic medical school leaders relative to the broader physician and general US populations.
Methods
From June 2023 to January 2024, we reviewed 154 US allopathic (MD) medical schools. We analyzed individual leadership structures and patterns in each institution. Institutional websites and publicly available sources were used to collect data on leadership demographics (gender, race, age), academic background (degrees, specialty), prior leadership roles, and research productivity via PubMed searches.
Results
In total, 154 allopathic medical schools in 46 states met inclusion criteria. We identified 1097 individuals (56.97% male, 70.46% White/Asian) serving as Dean, Senior Associate Dean, Assistant Dean, or equivalent. Most leaders held an MD or equivalent (76.12%), while 23.79% held solely a PhD. The majority practiced nonprocedural specialties (61.71%) and had prior leadership roles, such as Department Chair/Vice Chair (34.28%) or Program Director/Associate Director for Residency or Fellowship (18.24%). Most held or had held professorships (68.55%).
Conclusions
Most allopathic medical school leaders come from nonprocedural specialties, which may influence students’ mentorship access and specialty choices. With gender, race, and specialty disparities existing among medical leadership, diversification of these leaders could enhance the medical school learning environment, broaden mentorship, and help align the physician workforce with the population it serves.
Keywords
Introduction
The landscape of medical education is constantly evolving and being shaped by the individuals that make up medical school classrooms, academic institutions, and healthcare at large. Central to this development is the role of leadership within medical schools. Leaders of these institutions serve not only in the traditional administrative capacity but also influence the culture and priorities of the institutions they serve.1,2 This influence extends beyond administrative tasks and has the potential to deeply impact the professional and personal development of the student body.1–3 Mentorship, though difficult to quantify, is a crucial aspect of medical education under the guidance of these leaders and has been repeatedly underemphasized in the literature. Serving as a mentor is a pivotal role that can heavily shape the specialty choice and ultimate practice environment (academic, private, community, etc) of medical students.4–7 With this context, the importance of diversity among medical school leaders cannot be overstated.
Despite the recognized importance of leadership and mentorship in medical education, there exists a notable disparity in the representation of gender, race, and medical specialty among leaders of US allopathic medical schools.8–10 This imbalance is not merely a statistical concern but a significant issue as it directly influences the mentorship of students in training and, by extension, the career trajectory of medical students.2,4–6 The homogeneity in leadership may lead to constricted perspectives and perpetuate a cycle of certain specialty choices over others for some medical students. This bias, whether conscious or not, negatively affects the future composition and representation of the medical education workforce and its alignment with the diverse population it serves.
The presence of diverse leadership in academic medicine not only promotes institutional equity but also provides critical identity modeling and affirmation for trainees. According to social cognitive career theory, exposure to leaders with shared backgrounds can enhance career self-efficacy and influence professional aspirations, a concept often summarized as “see it to be it.” 11 By examining the demographic and professional backgrounds of presidents, deans, department chairs, and other positions, we seek to provide a comprehensive overview of the current state of medical leadership. Secondarily, we aim to contribute to the ongoing discussion of workforce composition by gender identity, racial identity, and specialty by advocating for a leadership panel more representative of our physician workforce and the population we serve. We suspect that enriching the environment of trainees will have a profoundly positive impact on those matriculating and serving a very diverse population of patients.
Methods
Data Collection
A cross-sectional descriptive study of top leaders from 154 allopathic (MD) medical schools in 46 states from June 2023 through January 2024 was conducted. Four states (Alaska, Delaware, Montana, and Wyoming) were excluded from the analysis because they did not have a Liaison Committee on Medical Education (LCME)-accredited allopathic medical school or lacked sufficient publicly available data during the study period. All data were stored within a database on the institution's secure server. Using each institution's website, we identified the leadership structure of the institution and selected the top school of medicine leaders. These leaders occupied positions like Dean, Assistant Dean, Associate Dean, or some equivalent at each institution. When not available on the institution's webpage, publicly available data from several sources like LinkedIn or USA People Search websites was used. Informed consent and Institutional Review Board (IRB) review was not applicable, as this study involved only de-identified, aggregate data and did not include human subjects in accordance with 45 CFR § 46.102(e)(1).
Cohort Definition
Included individuals held “clinically focused” degrees such as Doctor of Medicine (MD), Doctor of Osteopathic Medicine (D.O.), Doctorate of Philosophy (PhD), or equivalent. Leaders with nonmedical degrees, namely, Master of Business Administration (MBA) and Certified Public Accountant (CPA), were excluded. The more business-focused leaders were typically found in medical schools with large hospital systems attached, and authors felt excluding them would be appropriate as they are nonclinical and do not have requirements that typically require interactions with trainees and are thus less likely to serve in a mentor capacity. Leaders holding dual degrees, like MD and MBA, were included in the analysis. Only LCME-accredited allopathic (MD) medical schools were included in this analysis to ensure consistency in accreditation standards, institutional structure, and leadership roles. Osteopathic medical schools were excluded, although individuals with D.O. degrees were included if they held qualifying leadership positions at LCME-accredited allopathic institutions. Leadership titles were consolidated into four categories based on scope of responsibility and institutional hierarchy: Dean/Equivalent (eg, Dean, President, Regional Dean, Chief-level roles, Chancellor), Vice Dean/Senior Leadership (eg, Vice Dean, Senior Associate Dean, Executive Vice President, Vice Chair), Associate Dean (including Associate Vice Provost and Senior Associate Provost), and Assistant Dean/Entry-Level Leadership (eg, Assistant Dean, Assistant Vice Provost).
Outcomes
Using the institution's website, we determined the leaders’ demographic information including age, gender, and race; discipline of practice; prior leadership positions; and research productivity based on a PubMed search. Specialty was categorized as procedural, nonprocedural, or nonclinical (PhD, etc). When data about prior leadership positions were unable to be obtained, data collectors assumed the individual did not occupy the leadership role. Similarly, leaders for whom research output could not be reliably determined due to name commonality or lack of results were excluded from that specific analysis.
Racial identity was categorized as “White/Asian” or “Black/Latinx/+” and determined through explicit self-identification in publicly available sources, including institutional biographies, professional group memberships requiring self-identification (eg, organizations for Black physicians or Hispanic physicians), and social media profiles (eg, Facebook, LinkedIn). When explicit self-identification was unavailable, race was inferred from profile photographs. Gender identity was determined from pronouns listed on institutional websites, in professional biographies, or on social media profiles. When pronouns were unavailable, gender was inferred from profile photographs. These characterizations were made by data collectors and may not reflect self-identified gender or race.
Specialty of practice was determined by the individual's primary department or division. Procedural specialties were defined as any surgical subspecialty or general surgery and its derivatives. Nonprocedural specialties comprised of all other clinicians. Those with PhD degrees that have department assignments and faculty biographies consistent with time spent largely conducting research were grouped together as nonclinical. Leaders who did not fit into these criteria—typically business-focused administrators—were excluded from clinical subgroup analyses.
Statistical Methods
Data analysis was conducted using Microsoft Excel® (Microsoft Corporation, Redmond, WA, USA) and R statistical software (Version 4.1.2; R Core Team, 2021). Categorical variables such as gender, race, specialty, and prior positions were summarized as frequencies and proportions. Continuous variables such as research publication count were reported as means ± standard deviation. Subset analysis of the top deans within the cohort of leaders was completed.
Results
Overall Cohort and Leadership Category by Race and Gender
Overall, we identified 154 allopathic (MD) medical schools in the United States that met inclusion criteria. We identified 1205 individuals occupying top leadership positions at each institution. A total of 108 individuals were excluded from analysis as they held only business-focused degrees. The final cohort included 1097 individuals (57.0% male, 70.5% White/Asian) who held at least one clinically focused degree and served as Dean, Senior Associate Dean, Assistant Dean, or equivalent at their respective institutions (Figures 1 and 2). Among biographies listing pronouns, none included pronouns outside of she/her or he/him.

All Medical School Leaders Stratified by Gender.

All Medical School Leaders Stratified by Race.
Stratification by leadership category demonstrated that the proportion of Black/Latinx/+ leaders was lowest among Deans/Equivalents (68 [23.1%]) and highest among Assistant Deans/Entry-Level Leadership (30 [38.0%]) and Associate Deans (104 [37.5%]) (Table 1). Vice Dean/Senior Leadership positions had an intermediate proportion of Black/Latinx/+ leaders (122 [27.4%]). Gender analysis revealed that women comprised of 33.2% (98) of Deans/Equivalents, 43.7% (195) of Vice Dean/Senior Leadership, 52.0% (144) of Associate Deans, and 44.3% (35) of Assistant Deans/Entry-Level Leadership (Table 2).
Distribution of Leadership Category by Race Among Leaders at LCME-Accredited Allopathic Medical Schools (n (%)).

Abbreviation: LCME, Liaison Committee on Medical Education.
Distribution of Leadership Category by Gender Among Leaders at LCME-Accredited Allopathic Medical Schools (n (%)).

Abbreviation: LCME, Liaison Committee on Medical Education.
All Leadership Positions
A majority of leaders held Professor titles (68.6%). Of these, 464 (42.3%) held prior Chair, Vice Chair, or Departmental Chief positions. Similarly, 220 (18.2%) served as Program Director or Associate Program Director of a residency or fellowship program prior to or in addition to their current leadership role. Most leaders held a medical doctorate or equivalent (76.3%). Clinical specialty distribution included 61.7% nonprocedural specialties, 14.4% procedural specialties, and 23.8% nonclinical PhD scientists (Table 3).
Allopathic Medical School Leaders and Their Characteristics (n (%), Mean ± SD).

Deans
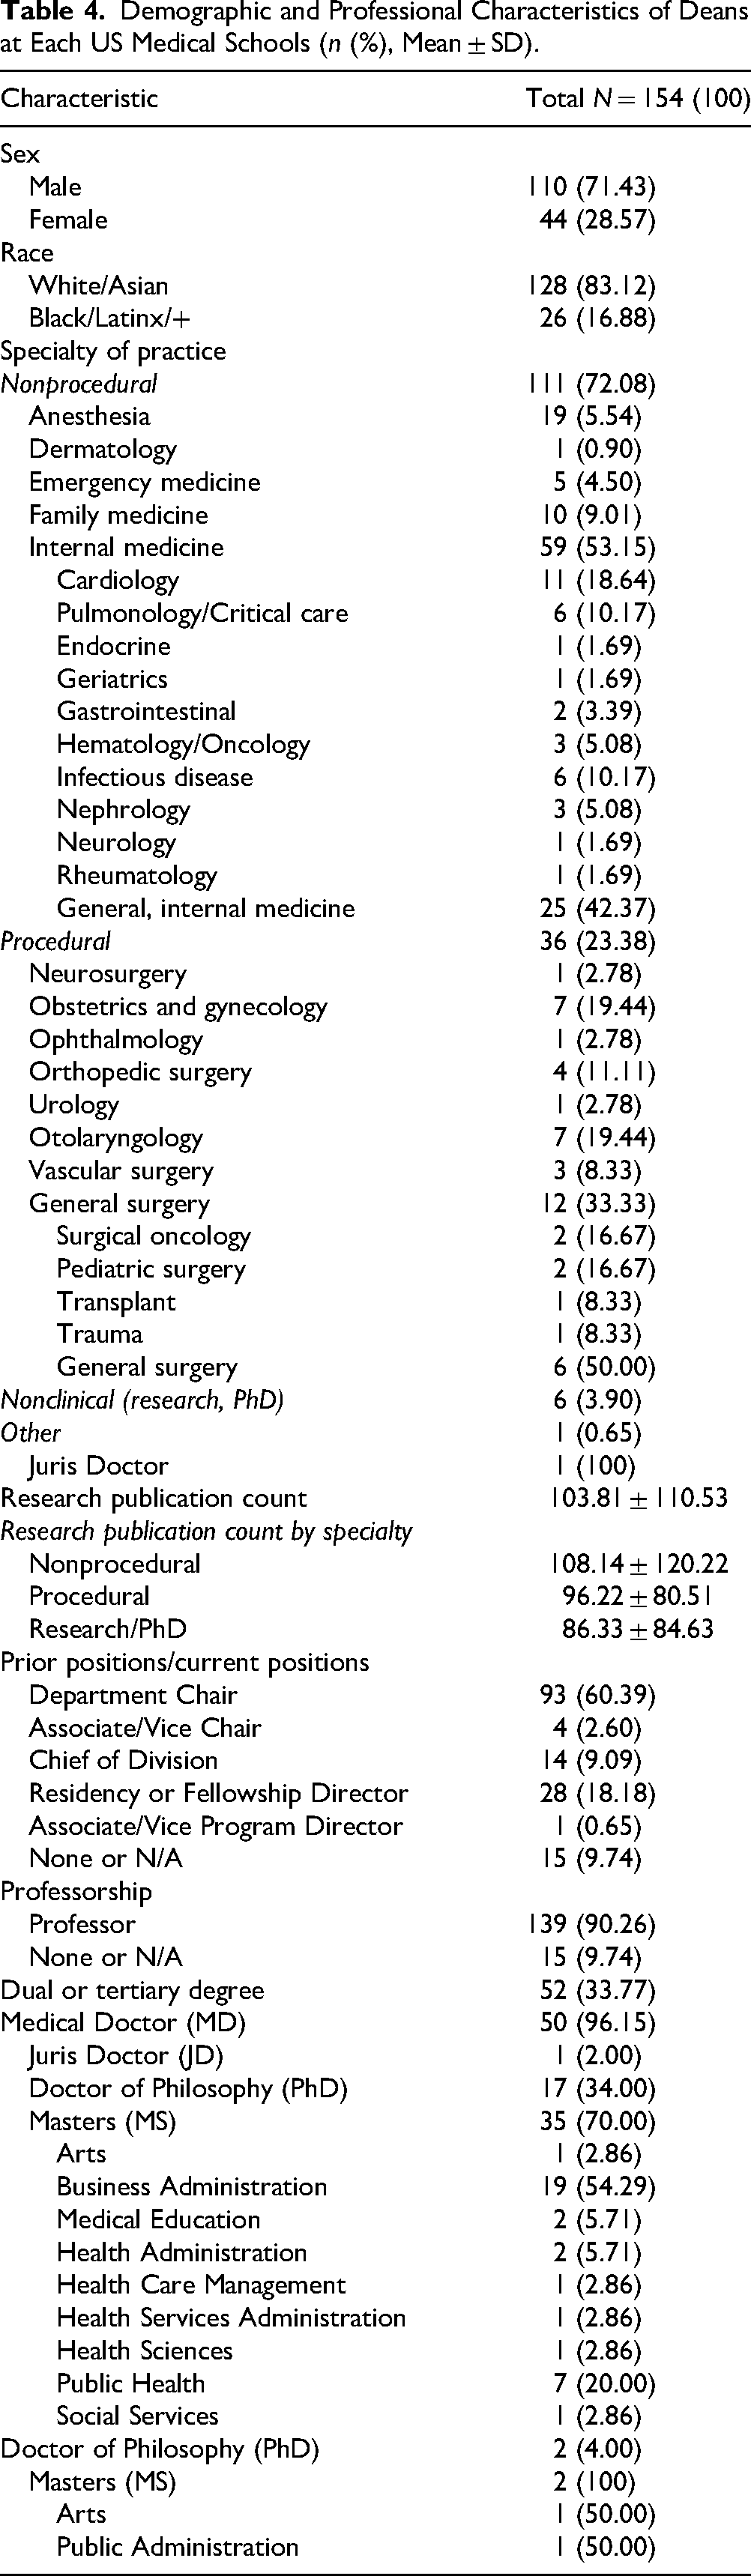
When comparing the top Dean at each institution (n = 154), a majority identified as male (71.4%) and White/Asian (83.1%). Similarly, a majority held an MD degree (95.5%). Of those earning medical degrees, 52 (33.8%) hold at least one additional degree above a bachelor's level, most commonly an MBA (36.5%), PhD (32.7%), or Master of Public Health/Master of Science in Public Health (13.5%). Most Deans practice in nonprocedural specialties (72.1%), commonly internal medicine or some derivative thereof like cardiology, pulmonology, or infectious disease (38.3%) (Figure 3). Nonprocedural specialties for this cohort include emergency medicine, radiology, psychiatry, pediatrics pathology, neurology, internal medicine, family medicine, dermatology, and anesthesia. In total, 36 proceduralists (23.4%) currently occupy top Dean positions. Procedural specialties represented among top Deans included general surgery (n = 12), obstetrics and gynecology (n = 7), otolaryngology (n = 7), orthopedic surgery (n = 4), vascular surgery (n = 3), neurosurgery (n = 1), ophthalmology (n = 1), and urology (n = 1). Seven (4.6%) leaders hold only either PhD or Juris Doctorate (JD) degrees. Research productivity (average 103.81 publications, SD 110.53) of these top Deans demonstrated a wide range but was roughly equivalent when stratified by specialty (nonprocedural average 103.14, procedural average 96.22, other doctorate degree average 86.3) (Figure 4). In total, 93 (60.4%) top leaders held prior or current Department Chair positions with 90.30% holding either a Chair, Vice Chair, Division Chief, or Program Director positions (Figure 5). Similarly, a majority (90.3%) of leaders earned Professorship at their respective institutions at the time of data collection (Table 4).
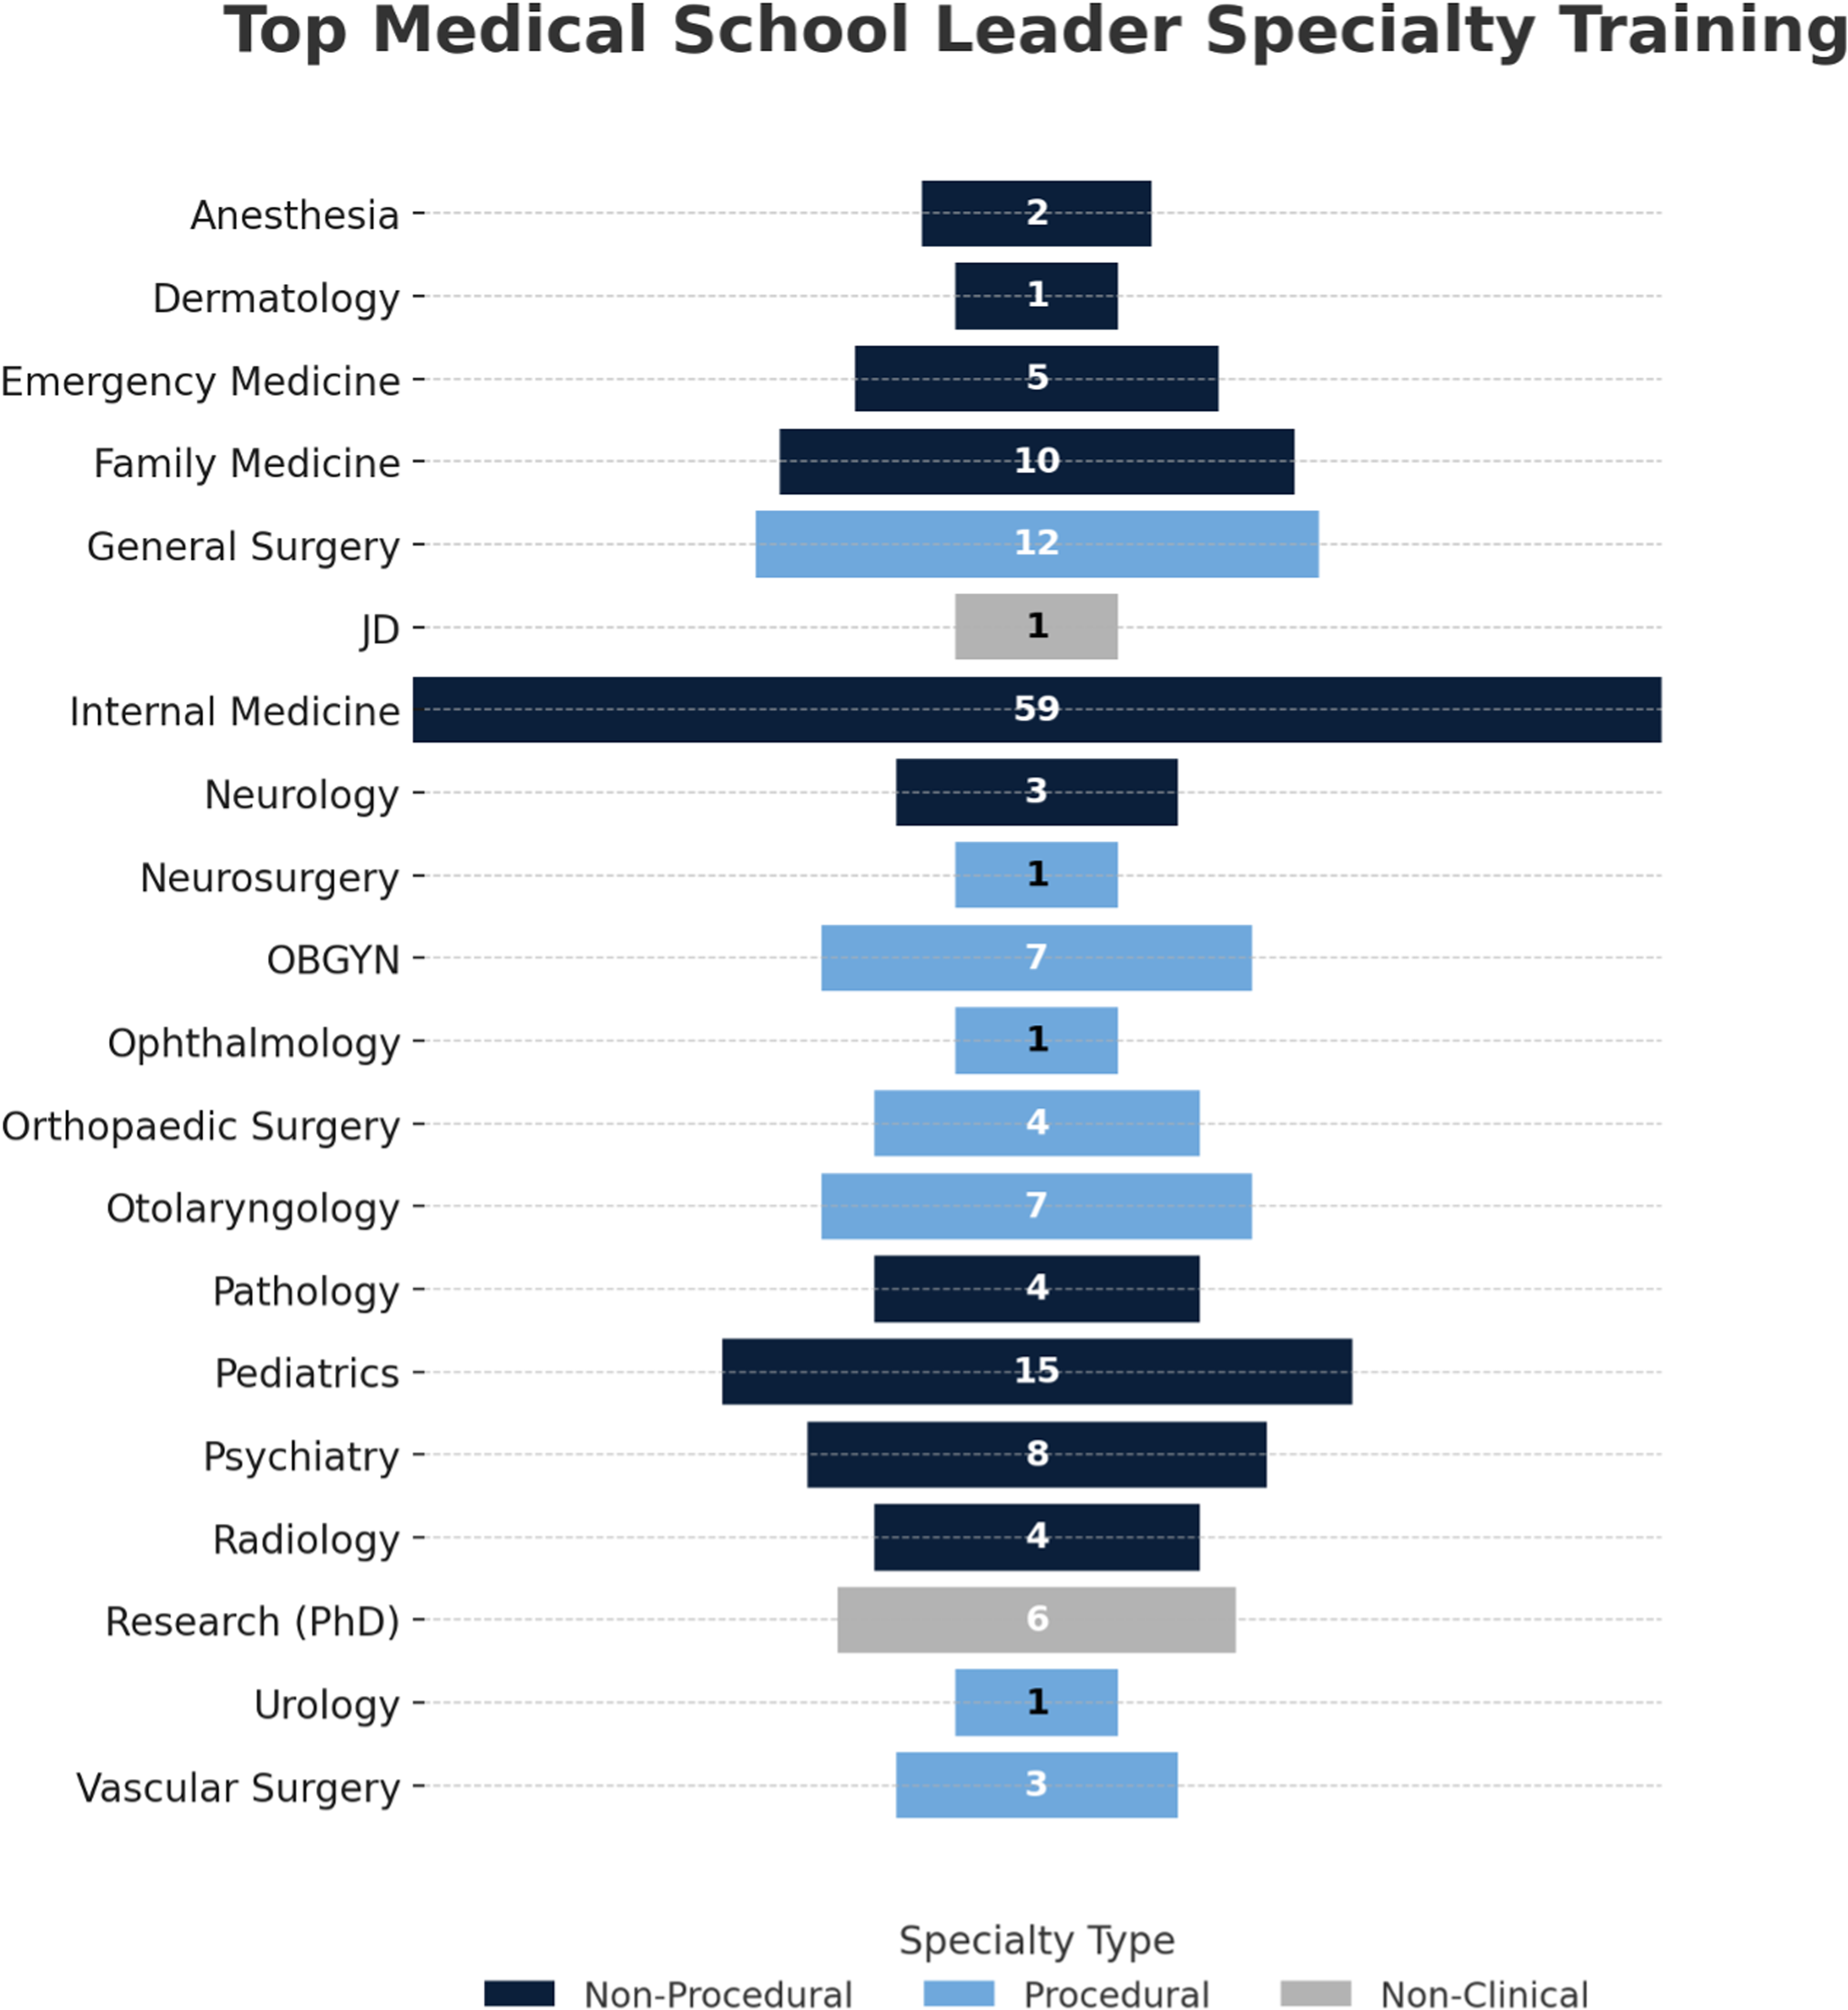
Top Deans From Each Medical School Divided by Specialty.
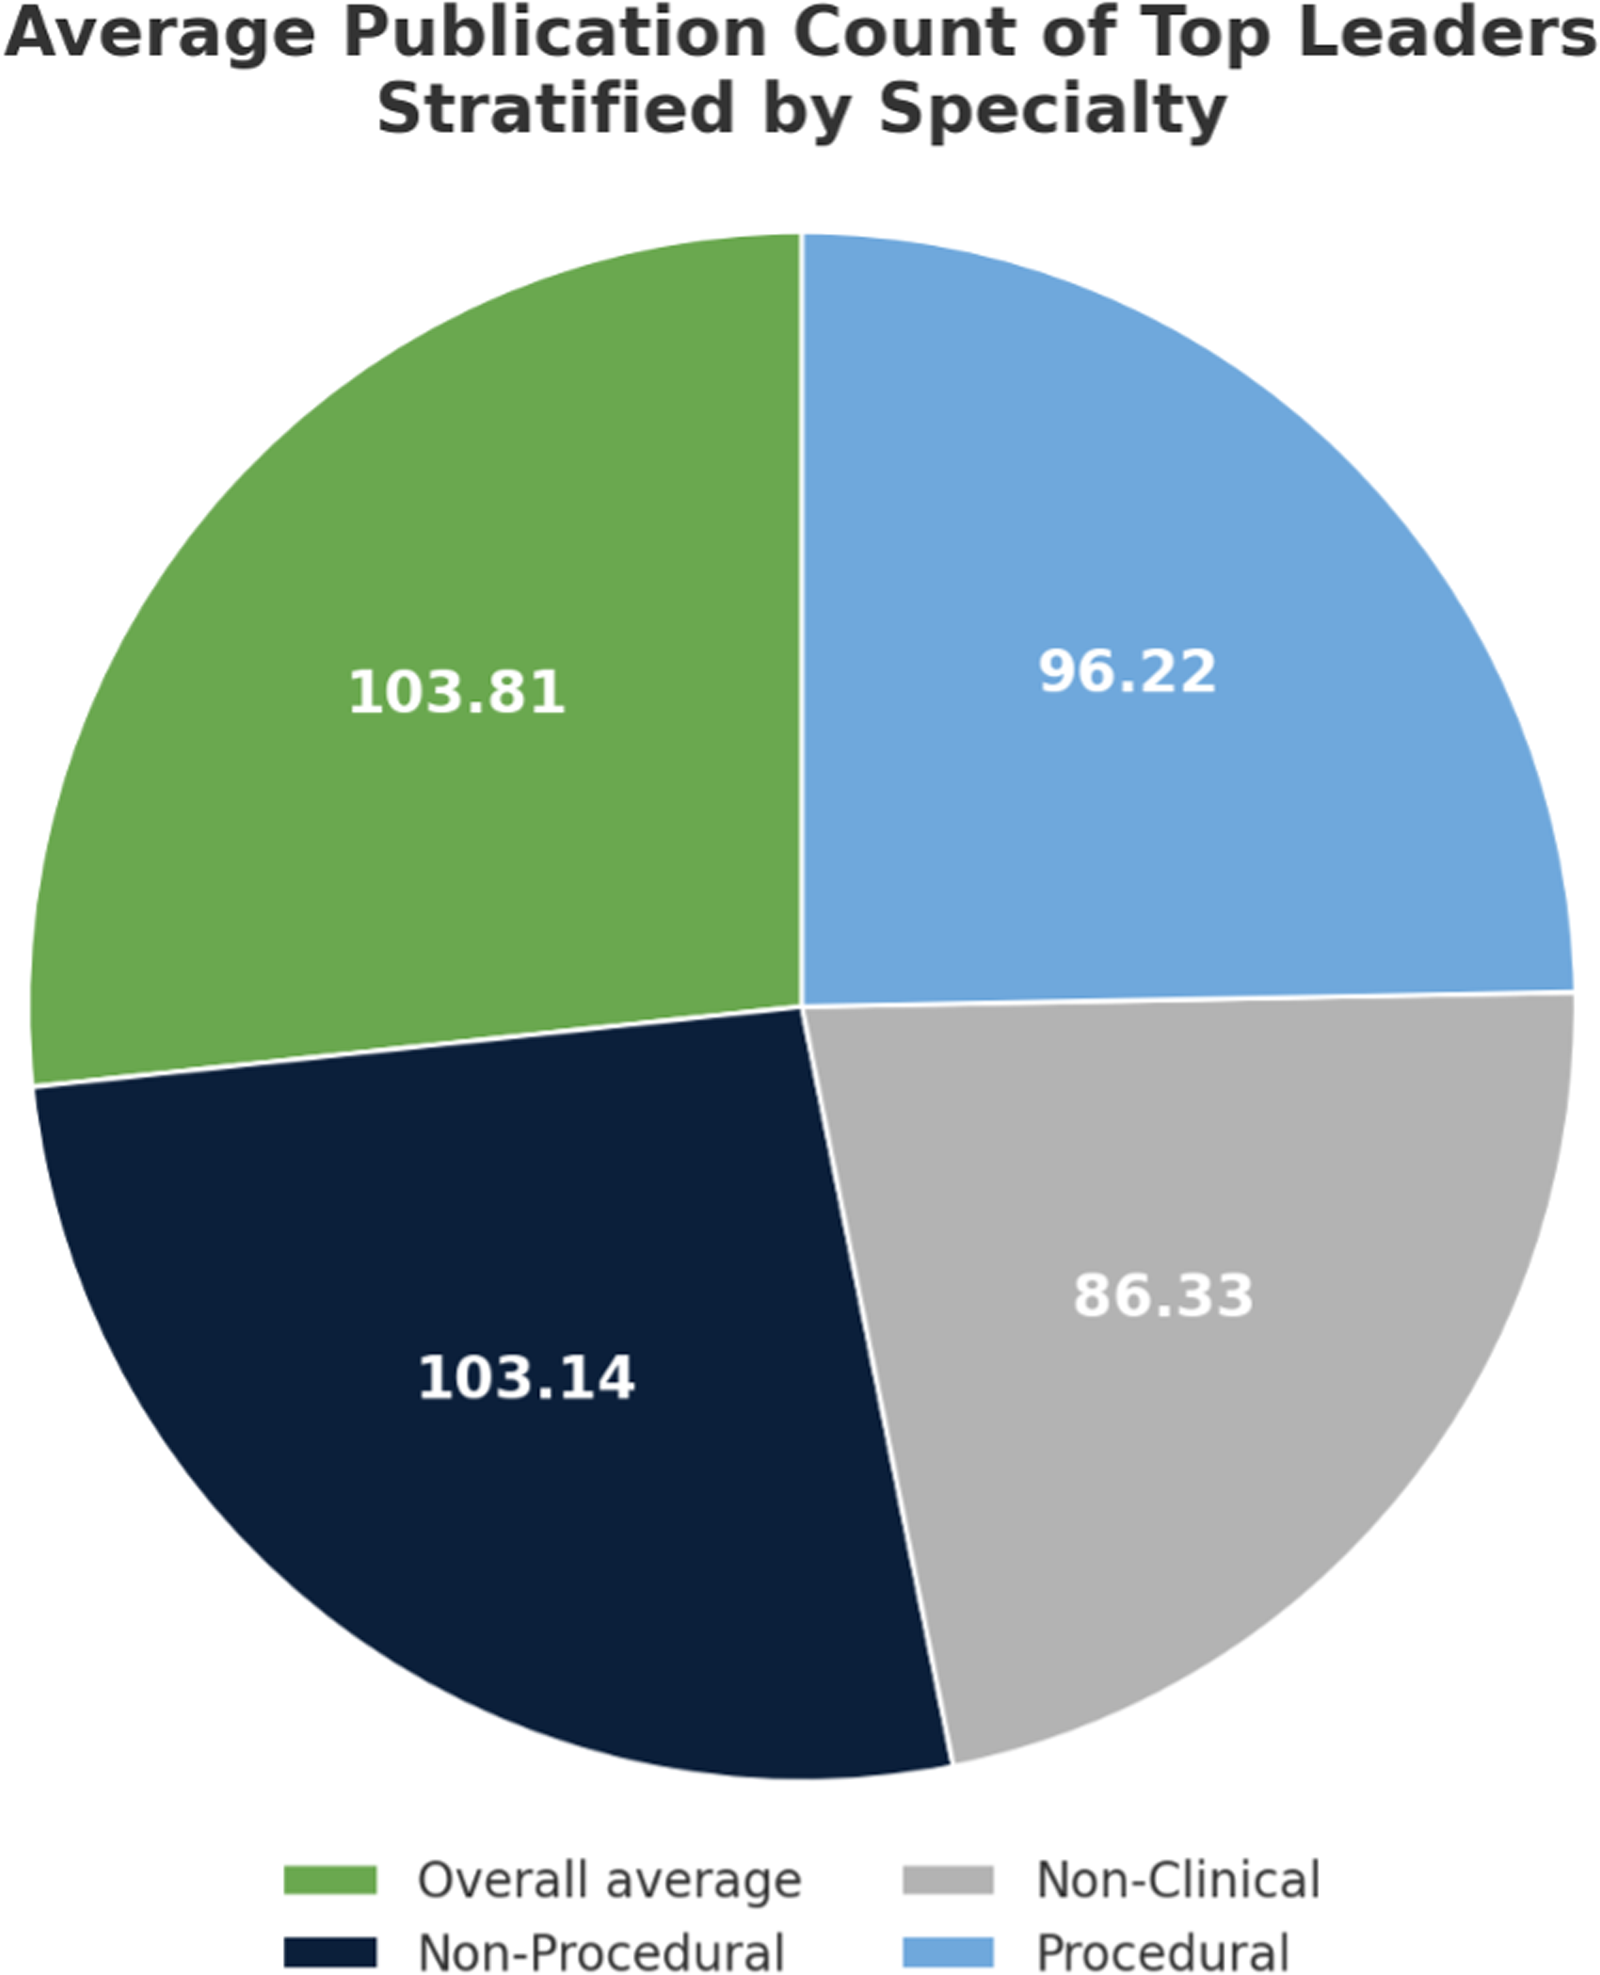
Average Publication Count of Top Deans Grouped by Overall Average, Nonprocedural Specialties, Procedural Specialties, and Nonclinical Leaders.

All Medical School Leaders Stratified by Prior or Current Associate/Vice Chair, Department Chair, Division Chief, and None.
Demographic and Professional Characteristics of Deans at Each US Medical Schools (n (%), Mean ± SD).
Discussion
Demographics
It has been well studied that diversity among the student body enhances education experiences of students in medical school.12,13 Thus, it makes sense that these findings would extend to the diversity of medical school leaders and educators; however, women and underrepresented minorities (URM) are less likely to hold Dean positions in medical schools. Of those that do, they are more likely to rise through the ranks of education at a slower pace.14,15 One study found, “a lower tier physician Dean (Assistant and/or Associate Dean) was 1.25 times more likely to be a man than a woman, and a higher tier (Dean of medical school, Senior Associate, Vice, or Associate) physician Dean was 1.16 times more likely to be a man.” 14 These results highlight the unique challenges women leaders face. Similar disparities exist among professorships of those underrepresented in academic surgery, with only 7% of full professors in academic surgery faculty positions identifying as URM in 2018.9,16
Similarly, we found that the majority of the leaders identified as male (57%) and White/Asian (70%). The disparity is more significant at the highest Dean or president level (71% male, 83% White/Asian). In 2018, the Association of American Medical Colleges (AAMC) reported that, of all actively practicing physicians, 56.2% identified as White/Asian and 64.1% as male with a similar breakdown of those graduating from medical school (54.6% White/Asian, 52.1% male). 17 With a more well-rounded cohort of those matriculating and graduating from medical school and practicing in the United States, it is curious that such heterogeneity is not reflected in our highest leaders.8,9,17 We propose it is in part due to the evolution in demographics of those applying and matriculating into medical school. A more diverse applicant pool is contributing to the new graduate statistics, but these graduates do not yet have the years of experience to serve in higher roles or lack of term limits in other areas like Department Chair preclude them from being able to move up the academic ladder at a quicker pace than prior leaders. With more women and unrepresented minority students matriculating into medical school over the past few decades, we are hopeful healthcare and medical school leaders will eventually reflect the demographic distribution of the workforce in training and have a closer resemblance to the general population, but for now, we can only speculate about the future leaders.
It is also worth noting that gender in this study was reported on a binary scale. This is in contrast with the AAMC, who had individuals self-identify. This was because our study relied on data collectors to assign leaders the label male or female based on the pronouns used in their institution's faculty bio.
Specialty
Of all the medical school leaders, 61.7% were identified as practicing in nonprocedural specialties and 14.4% in procedural specialties. Similarly, at the highest leader level, 72.1% of leaders practice in nonprocedural specialties and 23.4% in procedural specialties. In 2023, the National Resident Matching Program reported that there were 37,425 Post-Graduate Year-1 positions. Of those, only 6188 of them were for procedural specialties, including preliminary spots—neurologic surgery (243), obstetrics–gynecology (1503), obstetrics and gynecology preliminary (18), orthopedic surgery (899), otolaryngology (373), plastic surgery (207), general surgery categorical (1670), surgery preliminary (1133), thoracic surgery (49), and vascular surgery (93). 18 With only about 16.5% of residency positions being identified as procedural specialties, it makes sense that fewer surgeons would occupy leadership roles within medical schools based on the mere number of proceduralists, but we hypothesize that sample size is not the primary contributing factor to this difference. 8
The AAMC reported that the mean total compensation for all medical school Deans in 2024–2025 was $1,009,268: $910,853 from salary and the remainder as deferred compensation and employee retirement contributions as a percent of salary. 19 Deferred compensation was defined as “the annual amount set aside under a contractual agreement whereby a part of the compensation for services rendered in the current year would be paid in future year, not including employee retirement contributions paid through a salary reduction plan, which are considered part of salary.” 19 Employer retirement contributions as a part of salary was defined as “employer payments to a retirement plan” (eg, state pension, Teachers Insurance and Annuity Association of America, 401k, and other tax-deferred payments). 19 Interestingly, when the data of the compensation of medical school Deans was stratified by gender, males had a higher mean total compensation compared to females, and those that identified as white had a higher mean total compensation compared to people of color. This could simply be a reflection that white males are more likely to occupy higher-ranking positions than females or people of color, but it is thought-provoking when viewed through the lens of the gender pay gap that exists in the United States. One study cited that the mean work relative value unit (RVU) compensation rate for surgical specialties was 7.2% higher compared to medical specialties. 20 Although this value was found to not be statistically significant, it brings up an important point that on average, surgeons can bill for higher values compared to their medical counterparts. Similarly, one study found that surgeons, specifically thoracic and transplant surgery, contribute significantly to the hospital margin. This contribution is coupled with many other factors but suggested that surgeons should be cognizant of their significant influence on the marketplace.20,21
We speculate that this might play a role in why procedural specialists are not found occupying as many leadership roles. While mentorship and teaching are extremely impactful, they do not generate revenue for hospital systems. Thus, procedural specialists may be viewed as better suited for clinical work and less valuable in teaching spaces, for which more procedural specialists are not found in medical school leadership roles. Because occupying mentorship roles would mean spending more time mentoring and teaching students, which, although impactful, does not monetarily contribute to the hospital bottom line nor billable RVUs. While this study will not discuss the fairness or lack thereof in the difference of compensation per field of medicine entered, we do think this might be contributing to the trend of nonprocedural specialists seen in leadership roles. We suspect that salary difference and hospital revenue incentives are likely contributing to the differences in specialty seen among those that occupy medical school leadership positions and those that do not.
Impact of Mentorship on Specialty Choice
The connection between mentorship, diversity, and student career choice among medical schools has been well studied.6,7,12,13,22 To date, there is evidence that suggests mentors can have a significant impact on student career choice, and studies suggest that early exposure and role models throughout medical school encourage students to select specific careers.6,7,13,22 Mentorship has been cited as helpful and impactful in career choices in 94% of third- and fourth-year medical students, with 95% of students agreeing a structured mentorship program could have an impact on their career. 22 In Barker et al, 80% of students with reported mentors that matriculated into plastic surgery say their mentor influenced their decision to pursue plastics, with 40% reporting interest in the same surgical subspecialty. 23 Additionally, the same trend has been seen across other specialties like primary care. The impact of mentorship has been widely studied to be impactful to students, but how early exposure or lack thereof to mentors in a diversity of specialties influences today's medical students is not well understood. To date, no study has analyzed the impact of specialty diversity and barriers to occupancy for procedural specialists in medical education. One study even noted the most common factors deterring students from careers in surgery were limited exposure, personality fit, and personal values, with real and perceived gender discrimination also being cited as contributing to barriers for entry into surgery and identification of mentors. 24 Procedural specialists can serve as a wealth of knowledge based on their experience teaching residents and medical students. With a majority of medical school leaders occupying nonprocedural specialties, this suggests that students may be better able to access mentors from these specialties throughout their time in medical school, which may impact their specialty choice. Small interventions early in medical school or during clerkship rotations could aid in career interest, opinions of surgeons as educators, and positively impact students pursuing careers in procedural specialties. 24
Prior Leadership Experiences
Previous data indicate that the most common pathway to becoming a medical school Dean is prior service as a department Chair. One study found that 73% of Deans had served as permanent department Chairs before their appointment, and only 8 of 153 had never held a department Chair, medical Director, or associate Dean position. These few individuals had served as division or section Chiefs and primarily practiced in nonprocedural specialties such as internal medicine, family medicine, or pediatrics. 25 In our study, this pattern was less pronounced: 60% (n = 93) of Deans had held prior department Chair positions, while 90% had served in another senior leadership role, including Chair, Vice Chair, Division Chief, or residency/fellowship Program Director. This suggests that while prior leadership experience remains a near-universal characteristic of Deans, the pathway does not necessarily require service as a department Chair. The earlier study was based on curriculum vitae review, whereas our analysis relied on publicly available data, which should in theory capture visible leadership roles but may not identify all prior positions.
Attaining senior departmental leadership roles typically requires a substantial external funding portfolio, a sustained record of high-impact publications, and access to influential professional networks. In research-intensive institutions, Deans with prior Chair experience had markedly higher H-indices (mean 73.1 vs 33.5), underscoring the weight placed on research capital and visibility. 25 Access to the resources that enable candidates to build “Chair-ready” portfolios is not equitably distributed. Women report fewer sponsorship opportunities that confer professional visibility, such as invitations to write editorials or nominations to honorary societies, and sponsorship itself is unequally distributed by gender. 26 Strategic networking, which opens doors to committees, boards, and high-profile collaborations, has been shown to advance men's careers more than women's in academic contexts that favor masculine network structures. 27 Racial and ethnic disparities are also evident; Black and Asian investigators face lower award rates across all sponsor categories, including National Institutes of Health R01-equivalent grants, while promotion systems continue to place heavy emphasis on federal funding. 28 These inequities are embedded in systemic patterns of homophily, bias, and the “diversity tax,” which restrict access to the sponsorship and high-impact opportunities that shape leadership trajectories. 29
Addressing these barriers requires structural change. As discussed in prior reviews, institutions should formalize sponsorship processes with accountability measures to ensure equitable allocation of high-visibility opportunities such as keynote addresses, board appointments, and editorial invitations. Leadership selection should use structured, competency-based criteria, evaluated by diverse and trained panels, and broaden the definition of leadership merit beyond grant funding to include educational, clinical, and community impact. Such approaches have been associated with improved representation of women and racially or ethnically minoritized leaders.27,30
However, as the prerequisites for these top positions diversify, it becomes evident that structured leadership development is crucial for preparing candidates to navigate the complex challenges inherent in academic medicine. Despite this need, formal leadership training opportunities remain limited. A study by Neely et al revealed that while more than half of US allopathic medical schools offer some form of leadership education, the content, delivery methods, and student participation vary significantly, indicating a lack of standardized training across institutions. 31
Another factor to consider as we see a shift in the types of prior leadership experience is term limits for Department Chair positions. The above study suggested that the average number of years from achieving an MD degree to promotion to a Dean position was 31.4 years, with a longer time to reach the top Dean in more recent years. The authors hypothesized that this could be due to decreased turnover or increased expectations for these roles. 25 One study reported a median tenure of obstetrics and gynecology Department Chairs to be 8 years, with a wide variety of 1–23 years of service. 32 This aligns with the trend observed in our study, as most Deans are likely unable to occupy Department Chair positions due to the lack of term limits and tenure of those holding them. This suggests that leaders pursuing Dean roles are likely excelling in other leadership roles based on the availability and unpredictable nature of the Department Chair positions.
With uncertain tenure limits for Department Chair positions, we observe a de-emphasis on the position as a prerequisite for medical school Deans.
Limitations
As previously mentioned, when data about prior leadership positions could not be obtained, data collectors assumed the individual did not occupy the role, so our results may underestimate the true breadth of prior leadership experience for some leaders. Gender identity was determined from pronoun usage in faculty biographies or other institutional materials; when unavailable, gender was inferred from profile photographs. Racial identity was determined from publicly available self-disclosures in institutional biographies, professional affiliations, or social media; when not explicitly stated, race was inferred from profile photographs. This approach necessarily involves appearance-based determinations and may not reflect self-identified race or gender. For cases in which race or gender was ambiguous, determinations were made by consensus among at least two data collectors to improve consistency.
Conclusions
A majority of allopathic medical school leaders are members of nonprocedural specialties and represent a single race and gender that is only exacerbated at the highest leader level despite more equitable distributions of those matriculating into medical school. Our goal is that by highlighting the disparities that exist, we can encourage further diversification of these leaders to enrich the medical school learning environment, increase preparedness to serve a diverse population, and improve access to meaningful mentors for trainees.
Footnotes
Ethical Considerations
This study was conducted using de-identified, aggregate-level data from the Texas STAR (Seeking Transparency in Applications to Residency) database. The dataset contains no individually identifiable information. As no human subjects were involved and no identifying information was accessed, this study was not subject to institutional review board (IRB) oversight in accordance with federal regulations [45 CFR 46.102(e)(1)].
Consent to Participate
Informed consent for information published in this article was not obtained because the study utilized only de-identified, aggregate data from publicly available sources and did not involve human subjects.
Consent for Publication
Not applicable.
Author Contributions
Julia Kessel: conceptualization, data curation, formal analysis, methodology, and writing—original draft.
Peter N. Drossopoulos: data curation and writing—original draft.
Smith M. Ngeve: data curation.
Grace Anne Longfellow: writing—original draft.
Shannelle Campbell: writing—review and editing.
Luigi Pascarella: supervision, project administration, and writing—review and editing.
Funding
The authors received no financial support for the research, authorship, and/or publication of this article.
Declaration of Conflicting Interests
The authors declared no potential conflicts of interest with respect to the research, authorship, and/or publication of this article.
Data Availability
Data used in this study are all public data.
Study Type
Cross-sectional descriptive study.
Level of Evidence
Level 5.