
Abstract
Background
Simulation-based medical education has become increasingly prevalent. However, the high cost and lack of comprehensive effectiveness evaluations have raised questions about its feasibility. This study introduces a novel approach to assess the cost-effectiveness of simulation training.
Methods
This study uses simulated data from 120 medical students, set in a teaching hospital scenario, and randomly assigns them to 6 groups with different training durations. This was done to determine the optimal length of VR training that maximizes knowledge and skills transfer efficiency while minimizing costs, using 4 analytical methods: the transfer effectiveness ratio (TER) quantifying time savings, the incremental TER (ITER) assessing individual gains, isoperformance curves mapping cost-effectiveness, and change-point analysis identifying diminishing returns.
Results
The overall TER of 0.66 indicates 0.66 units of time saved per simulation training unit invested; peak ITER variability occurred in the 3h cohort, reflecting divergent individual responses to incremental training; isoperformance curves established a 4.5min minimum operative time threshold, defining inherent procedural constraints; and an inflection point at 8 VR training hours (80th data point) marked the onset of diminishing returns.
Conclusions
The methodological innovation of integrating TER, ITER, isoperformance curves, and change-point analysis offers a new framework for evaluating the cost-effectiveness of simulation training in medical education. The findings highlight the potential for simulation training to reduce the time required to achieve clinical competency and to optimize training strategies.
Keywords
Introduction
Simulation-based training (SBT) has emerged as a transformative paradigm in medical education, fundamentally reshaping healthcare professionals’ learning trajectories by significantly enhancing both subjective learning and objective clinical competencies. 1 Simulation in medicine is increasingly available, portable, and advanced. 2 The integration of simulation in international medical education has seen a rapid expansion, driven by advancements in medical technology and the increasing complexity of medical procedures. 3 Simulation medicine offers several key advantages, including reduced clinical training time, improved clinical skills, 4 and the provision of a risk-free environment for practice. 5 These benefits enable healthcare professionals to hone their skills before engaging in actual clinical operations, thereby enhancing the quality and safety of healthcare services. Ealier studies2,6 showed a strong positive attitude in medical students toward VR-based teaching and assessment, such as MD program in Medicine and Surgery of University of Turin-MedInTo. However, despite these advantages, the feasibility of simulation-based medical education has been questioned due to its high cost and the lack of comprehensive effectiveness evaluations, 7 as well as the long-term impact of this approach on skill retention and professional practice. 8 Therefore, it is essential to conduct a cost-effectiveness analysis to determine whether simulation-based medical education can achieve the standard clinical skill level of healthcare professionals at a lower cost compared to traditional teaching methods, or whether it can improve the clinical skill level of healthcare professionals while keeping the cost the same.
Cost-effectiveness analysis (CEA) is a method that measures costs and outcomes in natural units. 9 Unlike pure cost analysis, CEA quantifies both the direct costs of a project and the multifaceted effectiveness that arises from it, encompassing economic, social, environmental, and health benefits. 10 By quantifying effectiveness, CEA facilitates comparisons between projects, 11 enabling decision-makers to make more informed choices with limited resources. CEA is now widely utilized in the field of medical simulation, including applications in drug research, 12 curriculum evaluation, 13 and clinical research. 14
Traditional CEA metrics rely on artificially set thresholds to determine whether the simulation is cost-effective. 15 For example, the Incremental Cost-Effectiveness Ratio (ICER), the most commonly reported cost-effectiveness indicator by Health Technology Assessment organizations, does not require a threshold for its calculation, but a threshold is needed to interpret ICER after the results have been calculated. 16 Moreover, the influence of human factors and the limitation of the measure to only 2 decisions have made ICER somewhat controversial. Additionally, traditional CEA metrics only indicate the ratio of the difference in cost and the difference in effect between different simulation trainings, 17 and do not adequately address the extent to which competencies gained through simulation are transferred to operations in real clinical settings.
This study introduces a novel methodological framework to assess the cost-effectiveness of simulation training in medical education. To overcome limitations of traditional CEA metrics and provide a more comprehensive evaluation focused on competency transfer, we propose an innovative integration of established and emerging techniques: (1) transfer effectiveness ratios (TER) and incremental TER (ITER)—which measure the time saved in reaching criterion performance in actual clinical settings when simulation is deployed (TER) and quantify efficiency gains for individual trainees (ITER); (2) isoperformance curves—which quantify the relationship between varied interventions and the costs (in time or number of trials) required to meet criterion performance in a real operational task, revealing patterns of cost-effectiveness; and (3) change-point analysis—which identifies the point of diminishing returns on these curves, where additional training yields minimal performance gains. This framework, inspired in part by evaluation practices from flight simulation technology, 18 aims to identify the most cost-effective point for simulation training.
Methods
Scenario Setting
In a teaching hospital, medical students and trainee doctors are being trained in a key surgical skill—vascular anastomosis. Traditional training methods rely on direct patient training, but mistakes are extremely costly in this high-risk scenario. As a result, the hospital has introduced a state-of-the-art VR simulation system to help trainees master the technology. To ensure training is both effective and cost-effective, we need to assess the balance between VR simulation training and actual operating theater operations. So, we try to determine the optimum length of time for VR simulation training in order to maximize the efficiency of knowledge and skills transfer while minimizing costs, and this is where TER, ITER, and the isoperformance curve come into play.
Participants and Data Collection
This study uses simulated data from 120 medical students, set in a teaching hospital scenario, and randomly assigns them to 6 groups with different training durations. All groups received the same amount of hands-on practice in the actual operating room after completing the VR simulation training. The final performance of all participants on the vascular anastomosis was assessed by a standardized examination that simulated real surgical conditions and was scored by experienced surgeons. The study design is shown in Figure 1.

Study Design of VR Simulation Training.
Each trainee's VR simulation training time, actual operating theater operation time, and final exam score were recorded, of which the samples data points are listed in Supplemental material.
Analysis Methods
This study identifies optimal VR duration for cost-effective skill transfer using TER, ITER, isoperformance curves, and change-point analysis.
Transfer Effectiveness Ratios and Incremental Transfer Effectiveness Ratios
TER is a metric used to study the time it takes for trainees to reach criterion performance in the final standardized assessment with and without the use of simulation training. The formula for TER is
ITER is used to study the amount of transfer resulting from successive increases in the duration or number of simulated training sessions. ITER is calculated as
Isoperformance Curves
Isoperformance curves provide a viable solution to this problem. The basic idea of an equivalent isoperformance curve is to design a function that shows all the points at which different combinations of training inputs produce equivalent performance.
19
In medical simulation training, an isoperformance curve can relate the repetitions of simulation training to the repetitions required to achieve a standard level of performance in a real operational task. The equation for the isoperformance curve can be expressed as
Change-point Analysis
Change-point analysis is a statistical method used to identify points in a sequence of observations where the underlying parameters of the data-generating process undergo abrupt changes. 21 In the context of training effectiveness, this technique can pinpoint specific thresholds or breakpoints in the training process where there are significant shifts in performance gains relative to additional training inputs or costs. By applying change-point analysis to the isoperformance curve, we can uncover the precise point at which additional training resources yield diminishing returns in terms of performance improvement. 22 This optimal point, often referred to as the “knee” of the curve, signifies the transition from a phase of high marginal benefit to one of low marginal benefit. Identifying this change-point enables decision-makers to allocate resources more efficiently by recognizing the point of diminishing returns, thereby avoiding unnecessary expenditures on additional training that offers little to no incremental gain in performance. 23 Furthermore, change-point analysis can help in identifying the cost-effectiveness frontier by highlighting areas where small increases in cost can lead to disproportionately large gains in performance. 24 This information is crucial for policymakers and educators seeking to maximize the impact of limited training budgets.
Instruments and Procedures
To better demonstrate the application of TER, ITER, and the isoperformance curve in evaluating the effectiveness of simulation training in medical education, we first created a simulation dataset using R, adding the actual task time and final standardized test scores for each student. Afterwards, we used the collected data to calculate TER and ITER, and visualized the link between VR simulation training duration and actual task time by predicting and plotting isoperformance curves using nonlinear least squares. Finally, we performed change-point analysis of isoperformance curves to determine whether different VR simulation training durations are more economically efficient (see Appendix for detailed tutorial).
Results
Results Analysis of TER
The overall TER calculated for the simulation-based training program is 0.66. This ratio indicates the relative reduction in the time required to complete the actual task after engaging in simulation training. In this case, the TER suggests that for every unit of simulation training invested, there is a saving of approximately 0.66 units of time in achieving the same level of performance without the simulation training.
Results Analysis of ITER
The ITERs provide a more detailed insight into the efficiency gains of the training process for each individual/student. The range of ITER values is quite broad, varying from negative values (indicating no gain or even a loss in efficiency) to positive values (indicating significant efficiency gains). Positive ITER values greater than 1 indicate that additional units of simulation training result in more than 1 unit of time saved in the actual task performance. For example, an ITER of 2.03 suggests that an additional unit of simulation training leads to a savings of over 2 units of time in reaching the criterion performance level.
As seen in Figure 2, the violin plot allows us to visualize the distribution of ITER values across the training hours. The dispersion of ITER values was largest for the 3h group, indicating a wide variation in the effectiveness of additional training hours among students. As the number of VR hours increases, the dispersion decreases, suggesting diminishing returns and a more consistent impact on performance, while by 12 and 15 h of VR training, the dispersion was minimal. The ITER range for participants with 3 VR hours of training is quite broad, from 0.225 to 2.870, indicating a high degree of variability in the effectiveness of additional training hours among these participants. The ITER range for participants with 6 VR hours was slightly narrower, from 0.787 to 1.678, making its variation somewhat reduced compared to the 3h group: although its highest ITER value was 1.678-lower than the highest values observed in the 3h group, the lowest ITER value was 0.787, which is still relatively close to 1, suggesting that even the least responsive participants still see some benefit. The ITER range for participants with 9 VR hours was from −0.259 to 1.509, indicating a wide dispersion but with a notable shift toward lower values. There was a negative ITER value (–0.259), showing a slight decline in performance for one participant. The highest ITER value was 1.509, which was similar to the highest values in the 6h group, but the overall trend presented a decrease in the magnitude of the values.

Distribution of ITERs Across VR Training Hours. Abbreviation: ITER, Incremental Transfer Effectiveness Ratio.
Results Analysis of Isoperformance Curve
The isoperformance model, represented by the equation
Parameter Estimates of Isoperformance Curve.

Further, the isoperformance curve is marked red in Figure 3, while the blue straight line shows the trend of the data simply fitting a linear model. It's straightforward to find that why a linear model did not approximate the data well, as the line failed to capture the dynamic change of the relation between VR training and the costs. That said, the decrement of downward.
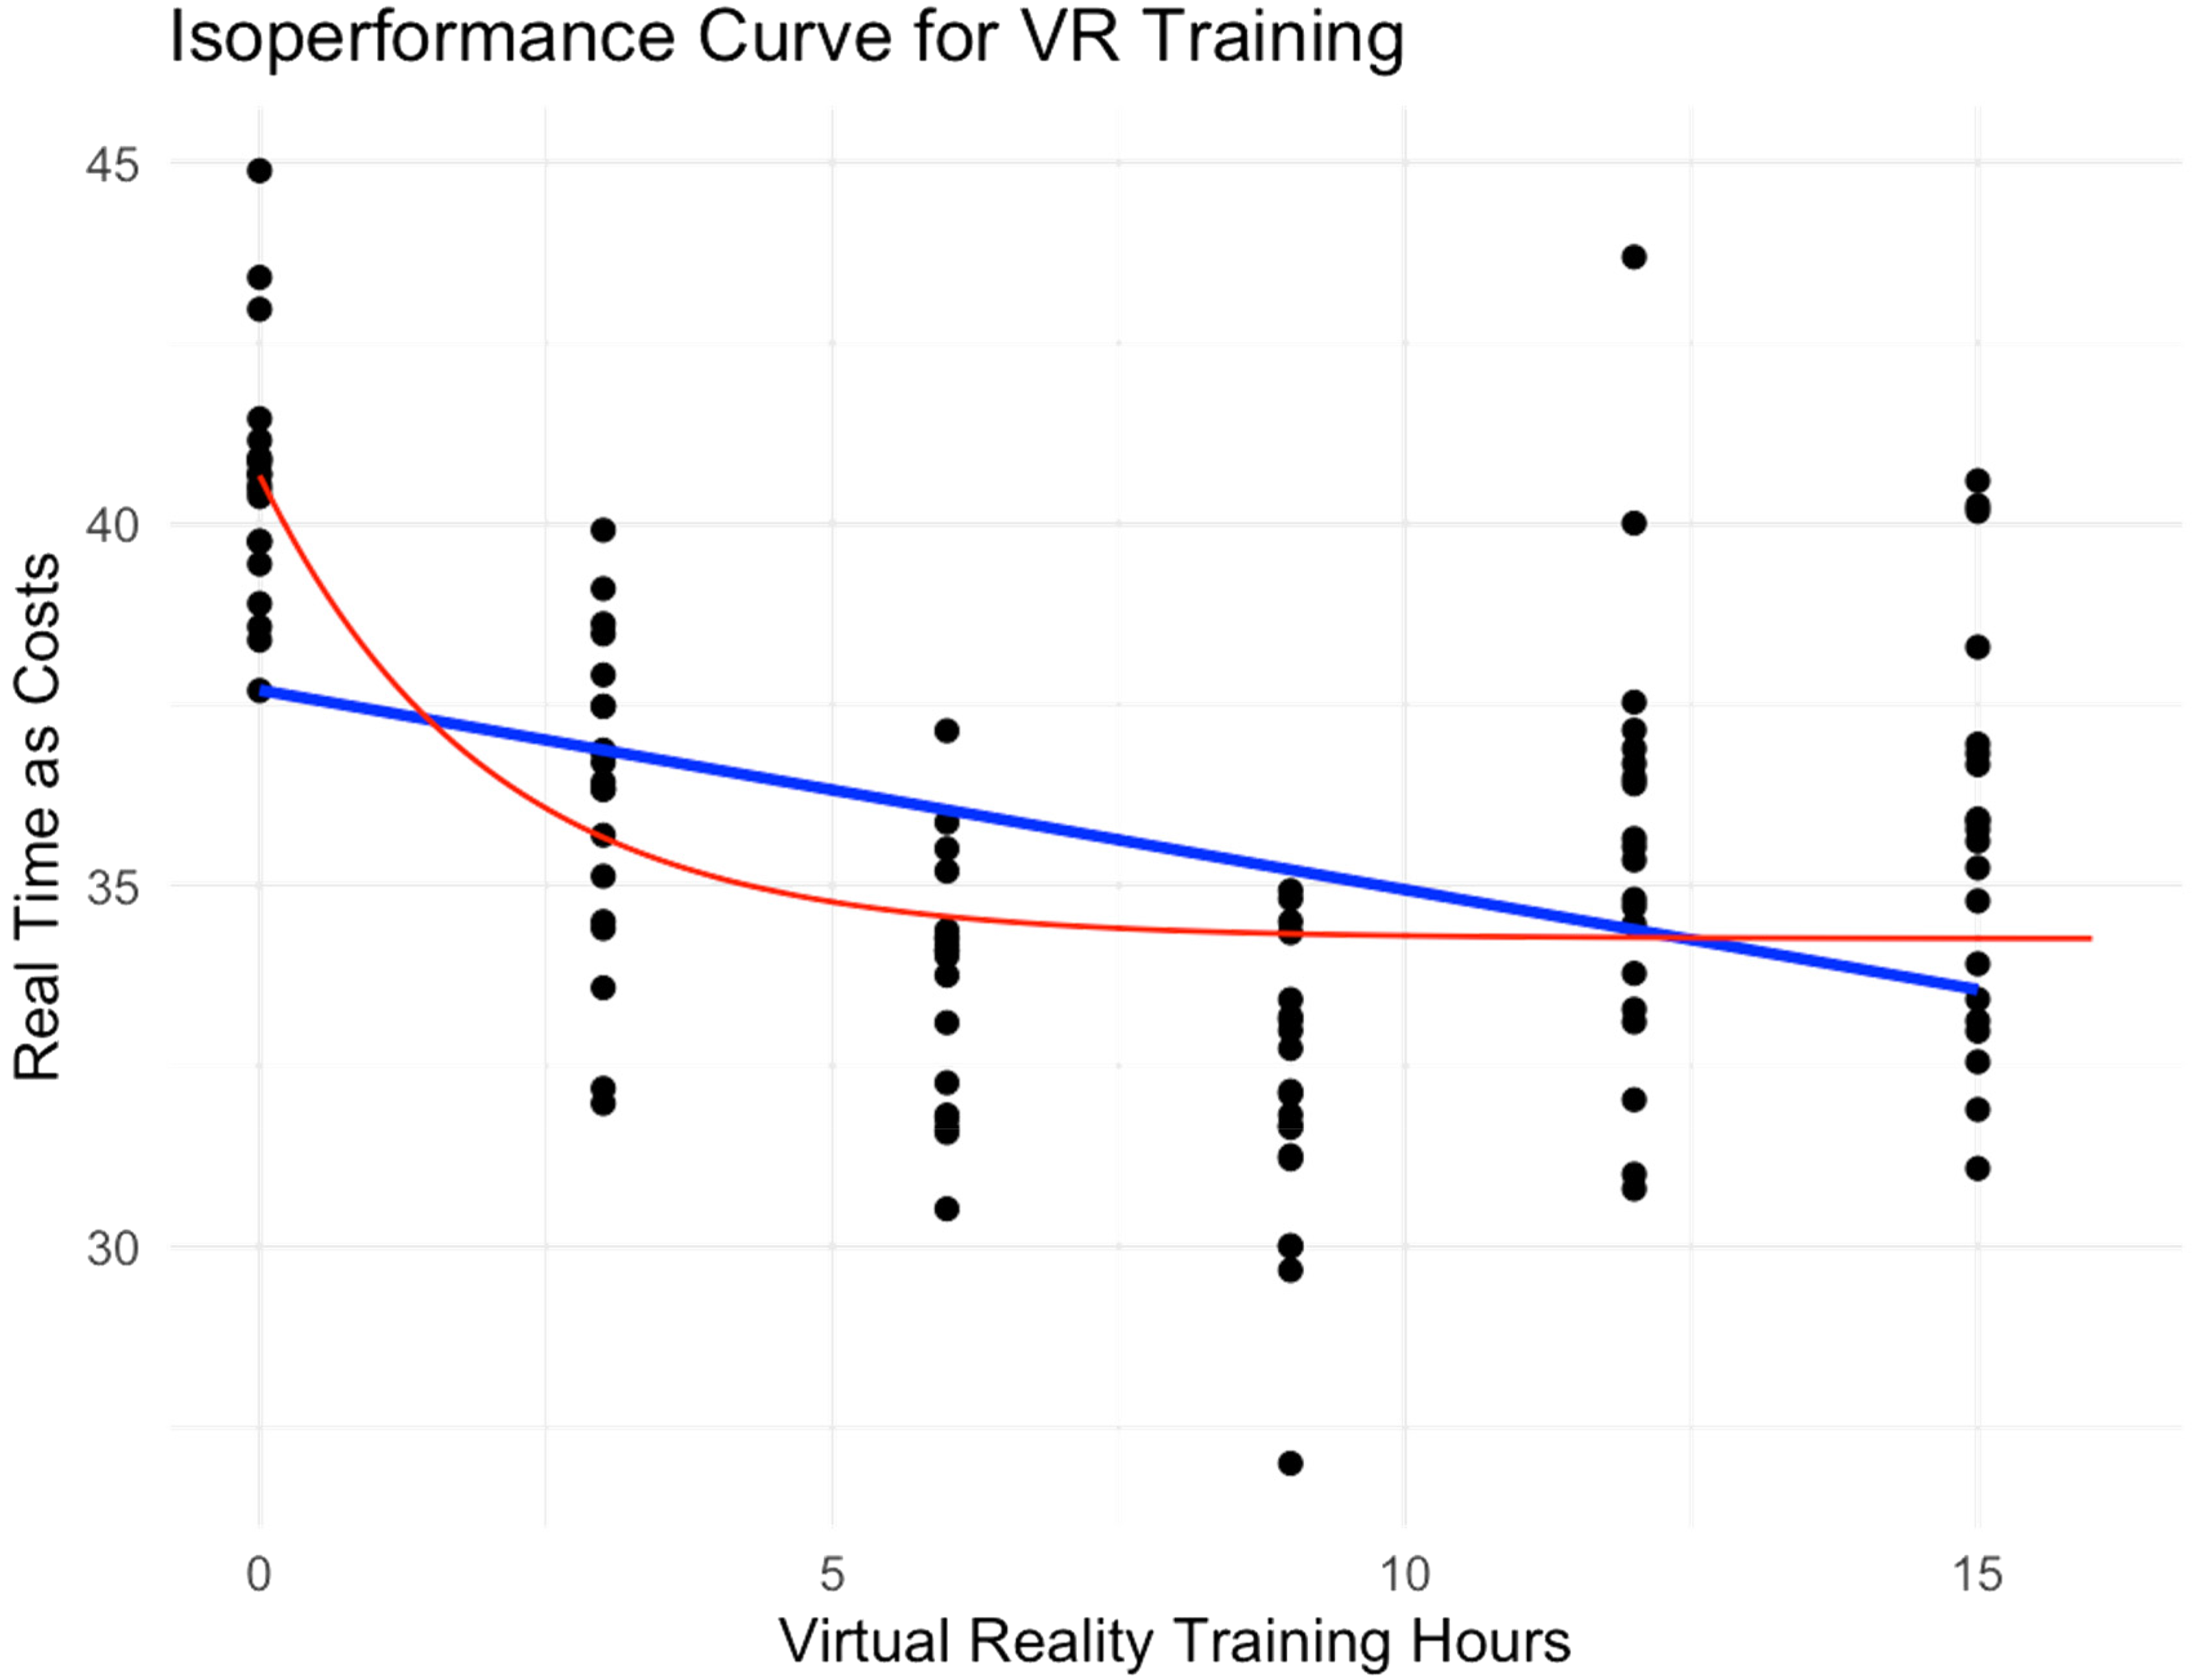
Isoperformance Curve for VR Training.
Results Analysis of Change-Point Analysis
To optimize training strategies, the isoperformance curve was further analyzed using change-point detection. This analysis aimed to identify a point of diminishing returns in VR training, where additional training time yields less significant improvements in operation completion time. As depicted in Figure 4, the analysis revealed a distinct “knee” in the curve at the 80th data point. This point corresponds to approximately 8 h of VR training, suggesting that further training beyond this point may not be preferred since the rate of improvement would start dropping. This insight provides valuable guidance for determining the optimal allocation of VR training time for students, balancing proficiency gains with training efficiency.

Change-Point Analysis for Isoperformance Curve.
Discussion
While TER and ITER address artificial performance thresholds in simulation training, their inability to sufficiently link costs with transfer effects limits precise identification of cost-effectiveness equilibria. Although isoperformance curves visualize cost-effectiveness trade-offs, they present idealized continuous relationships without definitive decision points—a limitation overcome through integrated change-point analysis that pinpoints critical inflection points. 25 By synthesizing these 4 metrics, this study demonstrates that simulation training significantly reduces clinical time-to-competency while establishing an evidence-based framework for optimizing training efficiency through quantified cost-effectiveness thresholds. 26
Cost-Effectiveness Analysis as A Aatalyst in Medical Simulation Education
Simulation, a rapidly growing substitute for clinical experiences, remains costly for teaching and learning. 8 Evaluating the cost and value of simulation education is imperative for determining its viability and sustainability, thereby enabling healthcare simulation to validate its value proposition. 27 A systematic review 28 confirms cost-benefit analysis enhances training ROI by evaluating resource needs, costs, and outcomes, enabling stakeholders to determine simulation-based programs’ long-term viability. The findings indicate such analysis equips healthcare decision-makers to implement simulation more effectively across income settings using transparent, rigorous cost assessment frameworks. 29 Further research is imperative to elucidate the cost structures, implementation processes, and outcome metrics essential for developing cost-effective and scalable simulation-based education programs. 28
In our study, cost-effectiveness analysis guides medical simulation programming through empirical TER and ITER metrics. This study's overall TER of 0.66 indicates that each hour of simulation training saves 0.66 h in real-task performance time. ITER analysis reveals critical individual variability patterns: (1) high-yield threshold: prioritize modules where median ITER > 1.0 (observed in 6h VR group); (2) low-efficiency cutoff: eliminate training with ITER < 0.3 or negative values (emerging at 9 + hours); (3) critical intervention window: 3 to 6 h VR training shows maximum ITER dispersion (0.225-2.870), signaling the optimal period for personalized adjustments. Furthermore, change-point analysis confirms 8 h as the cost-effectiveness threshold.
Hierarchical Analysis of Core Challenges in Model Fitting
Fitting the isoperformance curves model to the data involves estimating the parameters a, b, and c of the equation. These parameters are estimated using optimization algorithms that aim to minimize the difference between the predicted values and the observed data. The optimization process can be challenging due to the nonlinear nature of the equation. This process faces 3 inherent tensions, as described below.
Optimization algorithms, such as gradient descent, Newton-Raphson, and Levenberg-Marquardt, are commonly used to find the best-fit parameters. 30 These algorithms iteratively adjust the parameters to minimize the sum of squared errors between the predicted and actual values. Therefore, the choice of algorithm depends on the characteristics of the data and the specific requirements of the optimization problem.
Nonconvergence issues can arise during the optimization process, especially if the data are noisy or if the starting values are far from the true parameters. Poor initialization, data quality, and model misfit are common reasons for nonconvergence. To address these issues, better initialization techniques can be employed, such as using more informed starting values based on preliminary analyses or domain knowledge. Regularization techniques can also be introduced to prevent overfitting and improve the stability of the estimates. Robust estimation methods can be used to mitigate the influence of outliers. Trying different optimization algorithms may also help, as some algorithms may perform better than others depending on the specific data and model structure. 6
Parameter range specification creates a precision-reliability tradeoff where wide bounds increase nonconvergence likelihood while narrow bounds risk suboptimal solutions, demanding adaptive search strategies.
Study Limitations
The current study focuses specifically on VR training, which is a powerful tool for medical education. Nevertheless, certain limitations of this study should be acknowledged. First, as data were synthetically generated, findings may not fully reflect operational realities and performance variances in authentic clinical settings, and expanded model validation and clinical correlation are needed. Second, results are specific to VR simulation training, limiting generalizability to other modalities (eg, tactile-dependent mannequin-based simulations or cost-efficient task trainers) where skill transfer dynamics may differ. Third, the study examines a specific set of procedures, which may not be representative of all medical specialties or the broader range of skills required in clinical practice. Different specialties, such as surgery, emergency medicine, and pediatrics, may require distinct skill sets and training methodologies. The transfer of skills from simulation to real-world clinical settings can vary significantly across these specialties.
Future Implications
First, future research should expand upon the current study by incorporating real-world data and exploring the effectiveness of different types of simulation training. Comparative studies between various simulation modalities could provide insights into the most effective methods for specific procedures or specialties. Secondly, the development of adaptive training algorithms based on the TER and ITER could enhance the personalization of training programs. These algorithms could dynamically adjust the intensity and duration of training sessions based on individual performance metrics, potentially maximizing the cost-effectiveness of simulation training. Lastly, longitudinal studies are needed to assess the long-term retention of skills acquired through simulation training and to evaluate the impact on patient outcomes. This will provide a more comprehensive understanding of the benefits and limitations of simulation training in medical education.
Conclusion
In conclusion, the methodological innovation of integrating TER, ITER, isoperformance curves, and change-point analysis offers a new framework for evaluating the cost-effectiveness of simulation training in medical education. The findings highlight the potential for simulation training to reduce the time required to achieve clinical competency and to optimize training strategies. The continued development of this methodology holds promise for enhancing the quality and efficiency of medical education.
Supplemental Material
sj-csv-1-mde-10.1177_23821205251368247 - Supplemental material for Methodological Innovation in Evaluating the Cost-Effectiveness of Simulation Training Combining Transfer Effectiveness and Change-Point Analysis
Supplemental material, sj-csv-1-mde-10.1177_23821205251368247 for Methodological Innovation in Evaluating the Cost-Effectiveness of Simulation Training Combining Transfer Effectiveness and Change-Point Analysis by Zhehan Jiang, Hao Hang, Xinyu Wu, Shate Xiang and Shucheng Pan in Journal of Medical Education and Curricular Development
Supplemental Material
sj-R-2-mde-10.1177_23821205251368247 - Supplemental material for Methodological Innovation in Evaluating the Cost-Effectiveness of Simulation Training Combining Transfer Effectiveness and Change-Point Analysis
Supplemental material, sj-R-2-mde-10.1177_23821205251368247 for Methodological Innovation in Evaluating the Cost-Effectiveness of Simulation Training Combining Transfer Effectiveness and Change-Point Analysis by Zhehan Jiang, Hao Hang, Xinyu Wu, Shate Xiang and Shucheng Pan in Journal of Medical Education and Curricular Development
Supplemental Material
sj-docx-3-mde-10.1177_23821205251368247 - Supplemental material for Methodological Innovation in Evaluating the Cost-Effectiveness of Simulation Training Combining Transfer Effectiveness and Change-Point Analysis
Supplemental material, sj-docx-3-mde-10.1177_23821205251368247 for Methodological Innovation in Evaluating the Cost-Effectiveness of Simulation Training Combining Transfer Effectiveness and Change-Point Analysis by Zhehan Jiang, Hao Hang, Xinyu Wu, Shate Xiang and Shucheng Pan in Journal of Medical Education and Curricular Development
Footnotes
Authors’ Contributions
ZJ and XW contributed to the drafting of the paper. All authors made substantial contributions to the conception and design of this research approach paper, contributed to the critical revision of the article, and approved the final manuscript for publication.
Funding
The authors disclosed receipt of the following financial support for the research, authorship, and/or publication of this article: This research was funded by National Natural Science Foundation of China, grant number 72474004. This research was also supported by the Postdoctoral Fellowship Program of CPSF, grant number GZC20240067, Peking University Health Science Center Education and Teaching Research Project, grant number 2024YB40, Scientific Research Project of National Traditional Chinese Medicine Examination, grant number TB2024002, and Peking University Medicine Sailing Program for Young Scholars’ Scientific & Technological Innovation, grant number BMU2025YFJHPY008.
Declaration of Conflicting Interests
The authors declared no potential conflicts of interest with respect to the research, authorship, and/or publication of this article.
Data Accessibility
All data are incorporated into the article and its online Supplemental material.
Supplemental Material
Supplemental material for this article is available online.
Appendix
To use the app developed for the proposed approach, one can follow the simple 2-step instruction below.
Step 1: Install R
Download R:
Go to the CRAN (Comprehensive R Archive Network) website: https://cran.r-project.org/
Click on the link corresponding to your operating system (Windows, macOS, or Linux) and install it.
Step 2: Run the Shiny App
References
Supplementary Material
Please find the following supplemental material available below.
For Open Access articles published under a Creative Commons License, all supplemental material carries the same license as the article it is associated with.
For non-Open Access articles published, all supplemental material carries a non-exclusive license, and permission requests for re-use of supplemental material or any part of supplemental material shall be sent directly to the copyright owner as specified in the copyright notice associated with the article.